Extended Abstract

Interpretable Market Segmentation on High Dimension Data †

by
Carlos Eiras-Franco
1,*,
Bertha Guijarro-Berdiñas
1,
Amparo Alonso-Betanzos
1 and
Antonio Bahamonde
2
1
Grupo LIDIA, CITIC, Universidade da Coruña, 15071 A Coruña, Spain
2
Computer Science Department, Universidad de Oviedo, 33203 Gijón, Spain
*
Author to whom correspondence should be addressed.
Presented at the XoveTIC Congress. A Coruña, Spain, 27–28 September 2018.
Proceedings 2018, 2(18), 1171; https://doi.org/10.3390/proceedings2181171
Published: 17 September 2018
(This article belongs to the Proceedings of XoveTIC Congress 2018)

Abstract

:
Obtaining relevant information from the vast amount of data generated by interactions in a market or, in general, from a dyadic dataset, is a broad problem of great interest both for industry and academia. Also, the interpretability of machine learning algorithms is becoming increasingly relevant and even becoming a legal requirement, all of which increases the demand for such algorithms. In this work we propose a quality measure that factors in the interpretability of results. Additionally, we present a grouping algorithm on dyadic data that returns results with a level of interpretability selected by the user and capable of handling large volumes of data. Experiments show the accuracy of the results, on par with traditional methods, as well as its scalability.

1. Introduction

Data obtained by monitoring a marketplace are mainly dyadic [1], that is, they represent the relation between two entities (for instance user vs products, buyers vs sellers or any other pairing of agents). This sort of data are also prevalent in common problems such as recommender systems [2], computational linguistics, information retrieval and preference learning [3], besides being used in more specific problems like automatic test grading [4].
A traditional problem to be solved with this kind of data consists on obtaining groups of entities that show a similar behavior. Market segmentation is the process of performing this analysis on market data [5]. The resulting grouping is coveted by companies since it offers valuable insight, but it is hard to obtain.
Also, having results that are easily interpretable by managers is essential. Interpretability is given by a collection of characteristics that promote ease of understanding of a model [6] and can be achieved by providing transparent models and algorithms or by offering additional explanations for the outputs of the model.
The algorithm introduced in this work aims to obtain informative and easy to interpret data for human supervisors. It is implemented in the Apache Spark [7] distributed framework, which enables the analysis of large amounts of data in a reasonable time.

2. Proposal

Given a dataset X containing data showing the interactions between two entities U and V in which each data point x X has the form ( u , i , f ( u , i ) ) with f being a utility function f : ( U , I ) 1 , + 1 , a grouping C l ( U ) = C l u 1 , , C l u m on one of the entities can be defined as a set of m groups containing all the elements in U . The aptness of this grouping can be measured as the homogeneity of the value v across the elements in each C l u k [8]. Using this measure, we can define the weighted entropy of a grouping as
W E ( C l ( U ) ) = k , j | C l u k | | U | | I | H ( | u C l u k : f ( u , i j ) = + 1 | | C l u k | ) .
where H ( x ) represents the Shannon entropy of x.
Since each u U is a defined by a set of variables, each C l u k is defined by giving a range for those variables. We can obtain a measure of the quality of C l ( U ) by adding a factor that measures its interpretability. We do that by adding the number of such variables needed to define each group C l u k .
Q ( C l ( U ) ) = W E ( C l ( U ) ) λ C l u k C l ( U ) N V ( C l u k ) .
where N V ( x ) represents the number of variables needed to characterize x and λ is a hyperparameter that enables the user to manage the balance between accuracy and ease of understanding.
The proposed algorithm takes a dataset X as input and returns a grouping C l ( U ) that maximizes Q ( C l ( U ) ) . It does so by constructing a decision tree over the variables in U which defines the grouping  C l ( U ) .
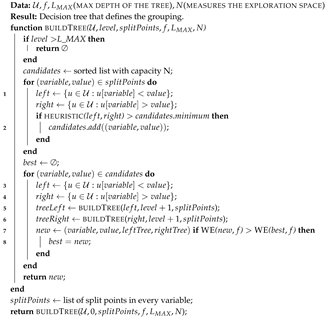
Algorithm 1: Grouping algorithm.
Proceedings 02 01171 i001

3. Results

Experiments performed on a large real world dataset containing information about readers and news items show that the proposed algorithm obtains a grouping consisting of 18 groups with a weighted entropy similar to that of the grouping with 100 elements obtained by Kmeans with k = 100 .
Additional experiments show that the Apache Spark implementation of the algorithm shows almost linear scalability when adding more computation nodes.

Acknowledgements

This work has been partially funded by the Ministerio de Economía y Competitividad (research projects TIN 2015-65069-C2, both 1-R and 2-R and “Red Española de Big Data y Análisis de datos escalable”, TIN2016-82013-REDT), by the Xunta de Galicia (GRC2014/035 y ED431G/01) and by the European Union Regional Development Funds.
The authors want to thank Fundación Pública Galega Centro Tecnolóxico de Supercomputación de Galicia (CESGA) for the use of their computing resources.

Conflicts of Interest

The authors declare no conflict of interest. The founding sponsors had no role in the design of the study; in the collection, analyses, or interpretation of data; in the writing of the manuscript, and in the decision to publish the results.

References

  1. Hofmann, T.; Puzicha, J.; Jordan, M.I. Learning from dyadic data. In Advances in Neural Information Processing Systems; MIT Press: Cambridge, MA, USA, 1999; pp. 466–472. [Google Scholar]
  2. Koren, Y.; Bell, R.; Volinsky, C. Matrix factorization techniques for recommender systems. Computer 2009, 42, 30–37. [Google Scholar] [CrossRef]
  3. Luaces, O.; Díez, J.; Alonso-Betanzos, A.; Troncoso, A.; Bahamonde, A. A factorization approach to evaluate open-response assignments in MOOCs using preference learning on peer assessments. Knowl. Based Syst. 2015, 85, 322–328. [Google Scholar] [CrossRef]
  4. Luaces, O.; Díez, J.; Alonso-Betanzos, A.; Troncoso, A.; Bahamonde, A. Content-based methods in peer assessment of open-response questions to grade students as authors and as graders. Knowl. Based Syst. 2017, 117, 79–87. [Google Scholar] [CrossRef]
  5. Kotler, P.; Cox, K.K. Marketing Management and Strategy; Prentice Hall: Upper Saddle River, NJ, USA, 1980. [Google Scholar]
  6. Lipton, Z.C. The mythos of model interpretability. arXiv 2016, arXiv:1606.03490. [Google Scholar]
  7. Zaharia, M.; Xin, R.S.; Wendell, P.; Das, T.; Armbrust, M.; Dave, A.; Meng, X.; Rosen, J.; Venkataraman, S.; Franklin, M.J.; et al. Apache spark: A unified engine for big data processing. Commun. ACM 2016, 59, 56–65. [Google Scholar] [CrossRef]
  8. Díez, J.; Pérez, P.; Luaces, O.; Bahamonde, A. Readers Segmentation According to their Preferences to Click Promoted Links in Digital Publications; Technical Report; Universidad de Oviedo: Oviedo, Spain, 2018. [Google Scholar]
Publisher’s Note: MDPI stays neutral with regard to jurisdictional claims in published maps and institutional affiliations.

