On-demand (or unplanned) track inspection could be due to a disruption in a track geometry recording car [1,2,3,4,5]. A proper selection of input- and output-memory order which is required for prediction of missing track measurement using a nonlinear autoregressive model with external series (NARX) is expected to create value added to the inspection decision.
For a M-meter length of unit track section, there could be sequence of track (measurement) points, denoted as where . Distance between two adjacent points is r meter and its value depends on the sampling rate employed by a track recording car during track measurement (inspection). Each is assigned with amplitude of track irregularity e.g., longitudinal level. Here, it is expressed as . In the event of disruption, a predicted value of is demanded as risk aversion towards unplanned train speed restrictions. The NARX model is formulated to predict track irregularity of a track section and is given as follows:
where denote, respectively, the input and output of the model at discrete unit step i, while and and are the input-memory and output-memory orders [6]. Performance of the NARX model is however sensitive to a selection of and . In the context of our study, the corresponding selection problem can be solved by determining a segment of size L denoted as which minimizes the weighted error function wMSE given as follows [7].
where is the performance ratio, the network weights and biases and the number of hidden nodes in the network. The function wMSE represents the performance of NARX model in Equation (1) to predict track irregularity for a unit track section .
An example is prepared to demonstrate benefits of analyzing the effect of proper selection of segment S. Here, the NARX model takes measurement of track gauge, alignment (left and right) and the value of recent change in the longitudinal level calculated from two consecutive track inspections as external variables. An output of the model is longitudinal track irregularity over a m unit track section. Related data series in the example is plotted in Figure 1. In this example, the value of L was 10 (is equivalent to 5 m track). Thirteen values of were selected as candidates for the segment S and their model performance is displayed in Figure 2. Results show the existence of variation in the performance of prediction model due to a different choice of position of S.

Figure 1.
Collection of data series used in the example. The bottom three plots associate with in the Equation (1).
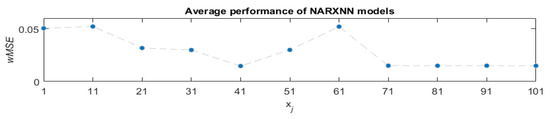
Figure 2.
Model performance averaged over 30 simulation runs for 11 choices of Si.
Disruptions in track geometry inspection create an opportunity to deliver value added to track inspections program. This goal can be achieved through an effective decision in assigning on-demand (manual) inspection to an affected track area. A case of missing longitudinal track irregularity where the missed values can be predicted by NARX is presented. The simulation results demonstrate that the segment selection step in NARX is beneficial to obtain rich information from unplanned track inspection. More simulation works are however required in future to strengthen the claim/suggestion.
Acknowledgments
The authors are sincerely grateful to European Commission for the financial sponsorship of the H2020-RISE Project No. 691135 “RISEN: Rail Infrastructure Systems Engineering Network” [8].
References
- Bin Osman, M.H.; Kaewunruen, S.; Min, A.; Dindar, S. Disruption: A new component in the track inspection schedule. In Proceedings of the 2016 IEEE International Conference on Intelligent Rail Transportation (ICIRT), Birmingham, UK, 23–25 August 2016; pp. 249–253. [Google Scholar]
- Sa’adin, S.L.B.; Kaewunruen, S.; Jaroszweski, D. Operational readiness for climate change of Malaysia high-speed rail. Proc. Inst. Civ. Eng. Transp. 2016, 169, 308–320. [Google Scholar]
- Kaewunruen, S.; Sussman, J.M.; Einstein, H.H. Strategic framework to achieve carbon-efficient construction and maintenance of railway infrastructure systems. Front. Environ. Sci. 2015, 3, 6. [Google Scholar] [CrossRef]
- S’adin, S.L.B.; Kaewunruen, S.; Jaroszweski, D. Risks of climate change with respect to the Singapore-Malaysia high speed rail system. Climate 2016, 4, 65. [Google Scholar] [CrossRef]
- Kaewunruen, S.; Remennikov, A.M. Relationships between wheel/rail interface impact and railseat flexural moment of railway prestressed concrete sleepers. In Proceedings of the 2007 SEM Annual Conference and Exposition on Experimental and Applied Mechanics, Springfield, MA, USA, 4–6 June 2007. [Google Scholar]
- Siek, M.; Solomatine, D. Chaotic model with data assimilation using NARX network. In Proceedings of the International Joint Conference on Neural Networks, Atlanta, GA, USA, 14–19 June 2009; pp. 2928–2935. [Google Scholar]
- Burden, F.; Winkler, D. Bayesian regularization of neural networks. Methods Mol. Biol. 2008, 458, 25–44. [Google Scholar] [PubMed]
- Kaewunruen, S.; Sussman, J.M.; Matsumoto, A. Grand Challenges in Transportation and Transit Systems. Front. Built Environ. 2016, 2, 4. [Google Scholar] [CrossRef]
Publisher’s Note: MDPI stays neutral with regard to jurisdictional claims in published maps and institutional affiliations. |
© 2018 by the authors. Licensee MDPI, Basel, Switzerland. This article is an open access article distributed under the terms and conditions of the Creative Commons Attribution (CC BY) license (https://creativecommons.org/licenses/by/4.0/).