You are currently viewing a new version of our website. To view the old version click .
Proceedings
  • Proceeding Paper
  • Open Access

30 November 2018

Enabling Citizen Science with A Crowdfunded and Field Validated Smart Air Quality Monitor †

,
,
,
,
,
,
,
,
and
1
ENEA—Energy Technology Dept., PV and Smart Networks Division, P. le E. Fermi, 1, 80055 Portici, Italy
2
ENEA—Department of Fusion and Technology for Nuclear Safety and Security, Via Anguillarese 301, 00123 Rome, Italy
*
Author to whom correspondence should be addressed.
Presented at the Eurosensors 2018 Conference, Graz, Austria, 9–12 September 2018.
This article belongs to the Proceedings EUROSENSORS 2018

Abstract

This work report the preliminary results of crowdfunding/crowdsensing campaign run in Italy aimed to functional test of a smart air quality monitoring infrastructure. Design and implementation of the cooperative monitoring infrastructure are described along with details of crowdfunding campaign. Participating users received, for a whole month, a field validated electrochemical sensors based air quality monitoring node and a companion APP capable of reporting sophisticated concentration estimations. Calibration functions are actually based on machine learning components correcting for environmental and non target gas interferences. Data gathered in the cloud allowed for evaluation of acceptability and reliability of the node as well as for mapping concentrations measurements inside city landscape through an ad-hoc GUI.

1. Introduction

Measuring air quality is a hot topic in today’s newscast. The level of concern among population is continuously raising due to the stream of scientific data about the impacts on public health and economy [1]. Knowing pollutant concentration distribution may help population, including those who suffer from specific pathologies (autoimmune, COPD, asthma) and elderlies, to reduce their exposure while keeping an adequate active life [2]. These information may be used to choose where to buy home or just the route for commuting or moving inside our cities. Low cost mobile smart sensors devices based on solid state chemical sensors may be used, along with pervasive fixed nodes and certified analyzers, to obtain the needed data stream. While the impact of citizen science on policy making is still under evaluation, the increase of awareness can greatly be enhanced with targeted feedback on personal exposure. Several research groups are active in the development of AQ pervasive monitoring technologies. Simultaneously, private companies that are beginning to ship low cost AQ monitoring nodes for indoor or outdoor applications. However, their accuracy must be seriously screened and taken into account (see [3]), since most of COTS products available nowadays are sold without no information about it. In this scenario, user perception can me mislead causing false alarms, conflicts with concerning authorities, false expectations. To bridge this gap, ENEA has designed a crowdfunding campaign and a subsequent crowdsensing campaign for cooperative air quality monitoring based on a smart multisensory device built for personal exposure monitoring to air pollutants and a cloud based sensor fusion and mapping system. Main objectives were increasing awareness about these new technologies in citizens and institutional stakeholders along with validation, functionality and acceptability test of the MONICA(tm) device. This work account for the preliminary results of the crowdsensing campaign.

2. Methods and Results

Designing and building a suitable technological infrastructure supporting such campaign is, per se, a significant endeavor. A small fleet of smart sensor nodes should be designed, built, calibrated and validated. They should be shipped together with a GUI capable to support user real time and deferred interaction with its own data and data shared by other users. Sensor fusion algorithms has to be designed for achieving concentration mapping while dealing with irregular, impromptu measurement coming form a crowdsensing campaign. Finally a cloud backend should be designed and built to gather data, process it and render them in a suitable form. This chapter briefly account for the different components of the MONICA infrastructure design and implementation.

2.1. The MONICA Node

The MONICA 2.0 device (see Figure 1a) is a chemical multisensor device based on Alphasense A4 electrochemical sensing unit (CO, NO2, O3) coupled with the Alphasense analog front end board. plus Temperature and RH environmental sensors. An STNucleo platform take care of sensor data acquisition, onboard preprocessing and Bluetooth interconnection with smartphones. An android App (see Figure 1b) provides for data (instantaneous and geolocalized) visualization (see Figure 1c,d), recording and transmission towards the cloud backend. Specifically the smartphone App is capable to show the instantaneous exposure to pollutants in terms of concentrations and using the European Air Quality Index scheme as compound exposure index. Each of the Monica nodes responses have been analyzed and their sensor array have been calibrated in a controlled atmosphere setup.
Figure 1. MONICA system. (a) Three different linear univariate calibration curves for MONICA CO sensor, computed from the in lab recorded data. It is possible to note the influence of Temperature on CO sensor response; (b) The Monica v2.0 prototype and a snapshot of the MONICA Android app showing, in color coding, a personal pollutant exposure index, computed using the recorded CO, NO2, O3 concentrations; (c) A point cloud map visualization of test campaign recorded NO2 concentrations (color coded) in the MENA web panel; (d) MENA web panel interface (Premium funders, below).
One of the node underwent a validation process in a 4-week co-location experiment with a regulatory grade station. The results of the campaign confirmed that a field calibration may held sufficient accuracy to hit the European Commission set data quality objectives for “indicative” measurements (see Figure 2). Indicative measurements are actually meant to compliment the network of regulatory grade stations that is affected by serious sparseness issues due to which it is typically unable to capture the spatial and temporal variability of the phenomena.
Figure 2. Relative expanded uncertainty computation for NO2 and CO estimation after field calibration. For NO2 (a), the use of multiple sensors output as calibration function was decisive to meet DQO threshold (dashed black line) indicating the need to compensate for interferents. On the contrary (b), non linear calibration schemes were the only to be capable to meet the DQO with a slight advantage of multivariate regression indicating a significant non linearity of the CO sensor response at the field recorded concentration range.

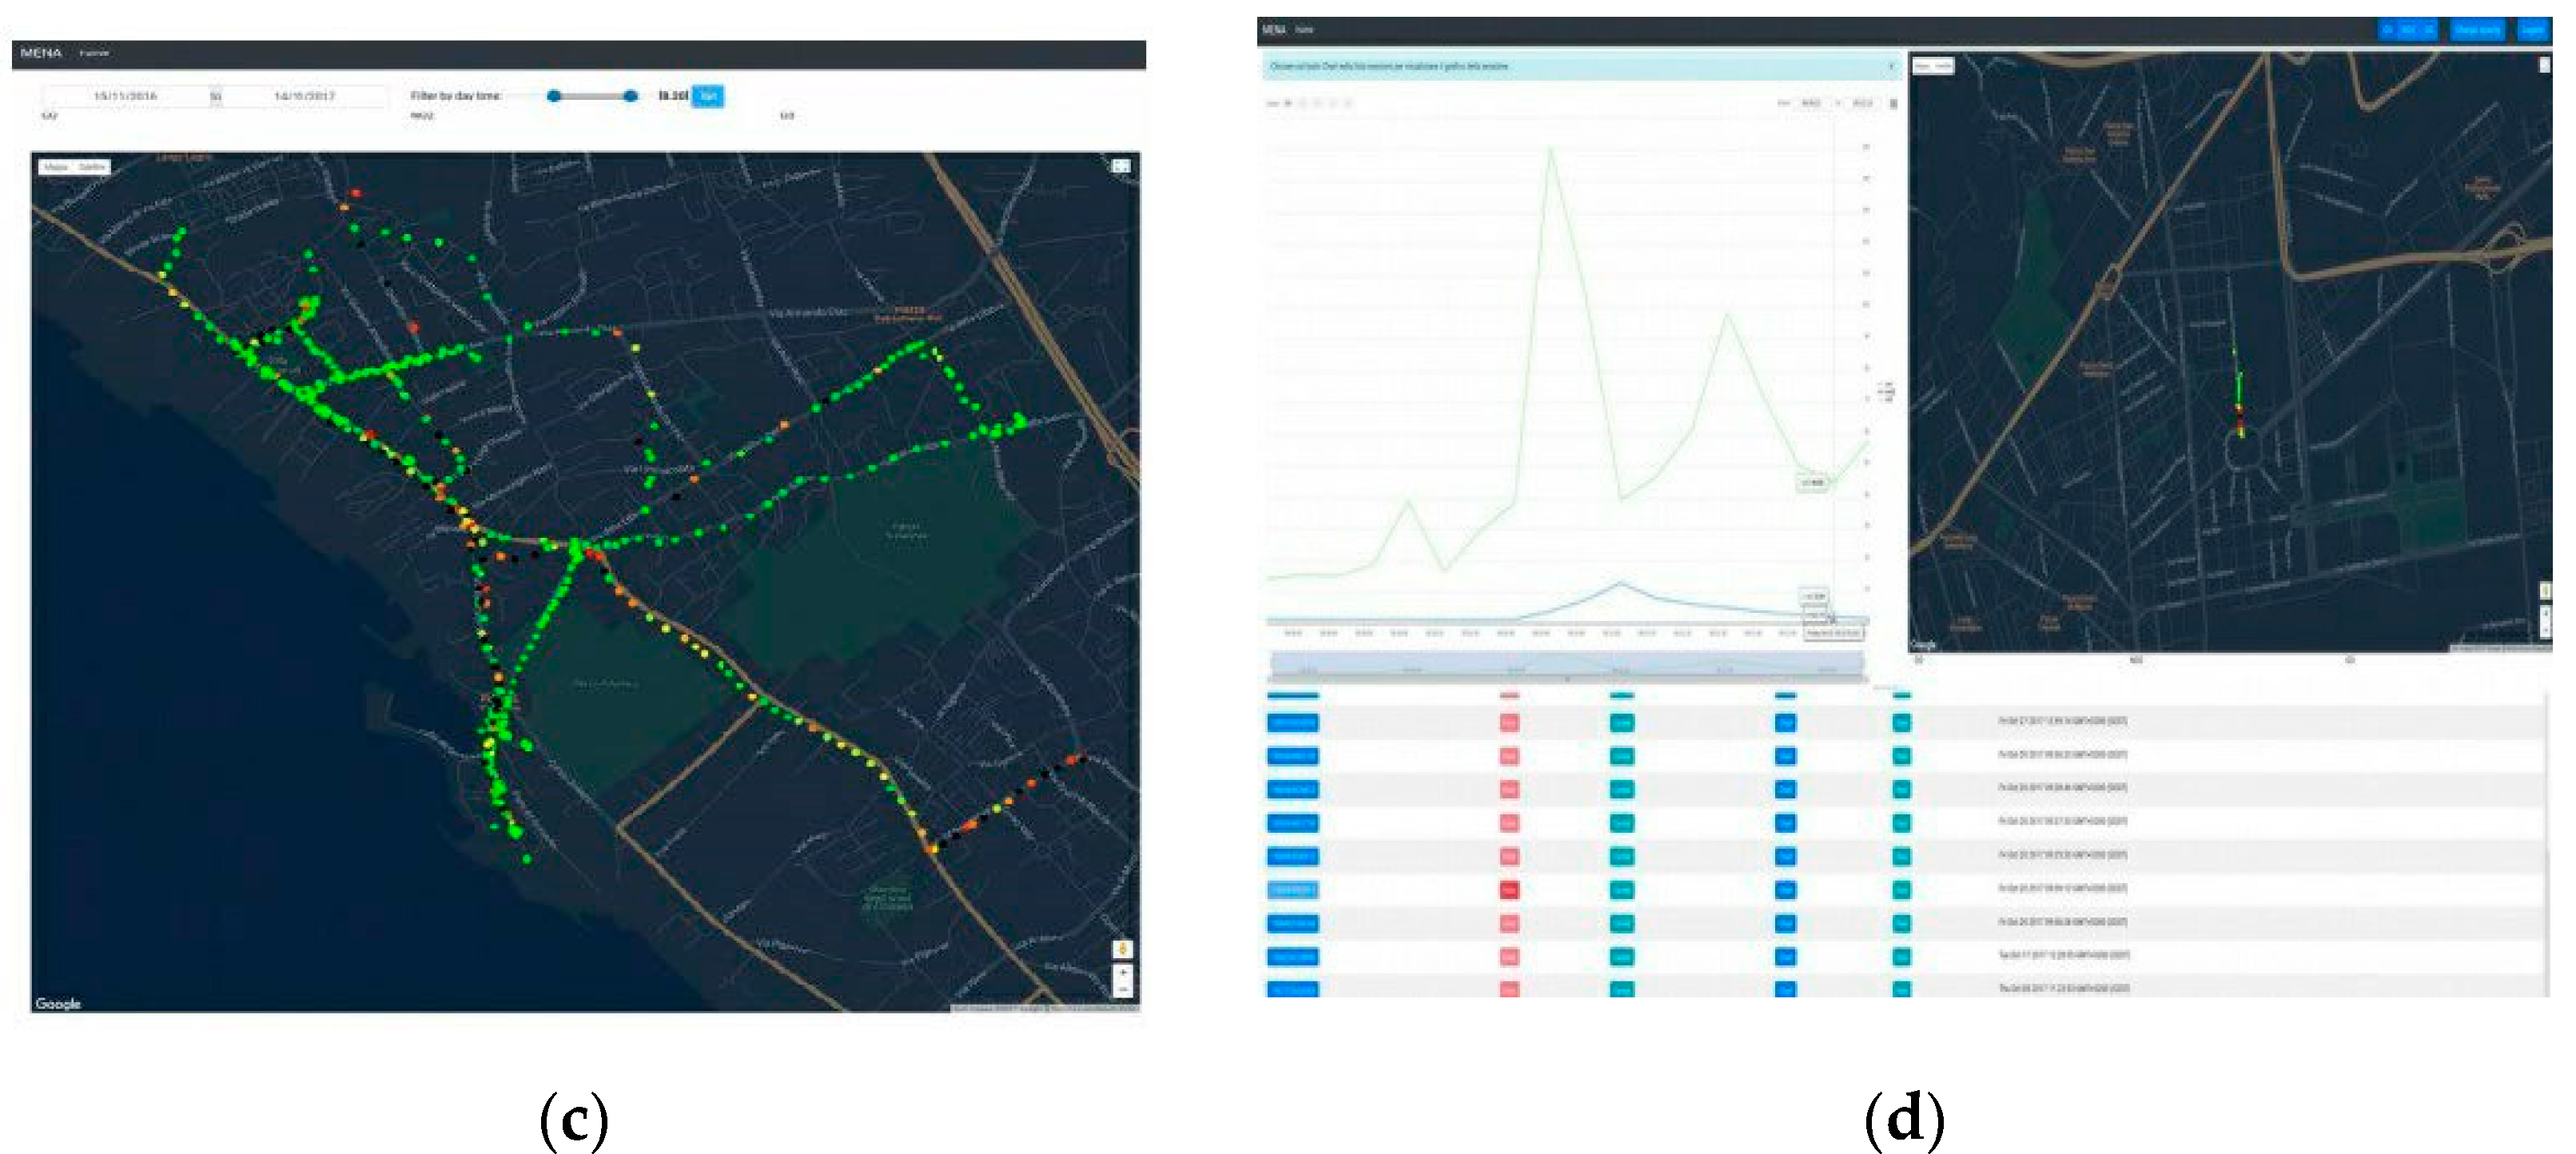
2.2. Data Gathering and Processing

Raw data about electrochemical sensors electrodes voltage potential are gathered and processed through a calibration function on board of the smartphone. Calibration function may be chosen among linear/non-linear univariate or multiple regression functions. Current software allow for using, for each target gas concentration estimation, data coming from the target focused gas or for all the sensor included environmental targeted ones (multiple regression) and process them with a linear function or a basic feed forward shallow neural network. Figure 2a,b show the relative expanded uncertainty of the field calibrated node while estimating NO2 and CO concentration respectively.
Concentrations are then sent to a MONGODB based backend as JSON packets. The MENA web based interface, based on a Javascript/Php engine including Google API Maps calls, have been finally developed to visualize stored data.

2.3. Crowdfunding and Crowdsensing Campaign

The building, calibration and operation of MONICA v2.0 devices have been crowdfunded on EPPELA web site with a campaign ending December 2016 [4]. Premium funders have been allowed to participate in the functional test campaign receiving a MONICA device and the related smartphone app for a one month test run at their premises. All founders have been given the possibility to access the anonymized dataset in form of the resulting measurement maps. They also participated in a newsletter campaign being informed of the development status and introduced to the limits of certified analyzers and smart sensing devices. The crowdfunders on-field tests have been analysed by ENEA team (Table 1), in order to develop a real-time spatio-temporal map of personal exposure.
Table 1. An example of collected crowdsensing data results as preprocessed for basic exposure indicators.

3. Conclusions

We have designed and run a participated crowdfunding campaign allowing the funders to participate in a crowdsensing functional tests campaign. Field validation have shown the capability for the MONICA node to reach, for selected ranges, the DQO level set by EC in the 2008/50 directive. Users have come close to submit one recording session each day on average with a minimum of 18 sessions in a month. Participating users mapped different areas of different cities among the most populated in Italy. Data losses and node damages were negligible. Along with accuracy and functional testing, the interaction with citizens have been of great help for a deeper understanding of our technical role as researchers in this rapidly changing scenario.

Author Contributions

All the authors contributed equally to this work. S.D.V. and G.D.F. coordinated the entire work.

Acknowledgments

This work has received funding by FLAG-ERA CONVERGENCE project as well as from private citizens participating to MONICA crowdfunding project.

Conflicts of Interest

The authors declare no conflict of interest.

References

  1. Baklanov, A.; Molina, L.T.; Gauss, M. Megacities, air quality and climate. Atmos. Environ. 2016, 126, 235–249. [Google Scholar] [CrossRef]
  2. FLAG-ERA Convergence Project. Available online: https://www.flagera.eu/wp-content/uploads/2016/02/FLAGERA_JTC2016_Project_flyer_Convergence_v0.3.pdf (accessed on 1 September 2018).
  3. Lewis, A.; Edwards, P. Validate personal air-pollution sensors. Nature 2016, 535, 29–31. [Google Scholar] [CrossRef] [PubMed]
  4. Available online. Available online: https://www.eppela.com/it/projects/9652-monica-il-tuo-navigatore-personale-antismog (accessed on 10 September 2019).
Publisher’s Note: MDPI stays neutral with regard to jurisdictional claims in published maps and institutional affiliations.

Article Metrics

Citations

Article Access Statistics

Multiple requests from the same IP address are counted as one view.