Proceeding Paper

Estimation of the Particle Sizing Error Due to Particle Position in an Integrated PM2.5 Optical Particle Counter †

1
Carinthian Tech Research, Europastraße 12, 9524 Villach, Austria
2
ams AG, Tobelbaderstraße 30, 8141 Unterpremstätten, Austria
*
Author to whom correspondence should be addressed.
Presented at the Eurosensors 2018 Conference, Graz, Austria, 9–12 September 2018.
Proceedings 2018, 2(13), 850; https://doi.org/10.3390/proceedings2130850
Published: 4 December 2018
(This article belongs to the Proceedings of EUROSENSORS 2018)

Abstract

:
An increasing need for portable personal time- and size-resolved monitoring of the fine airborne particulate matter drives the development towards miniaturization and cost reduction of the optical particle counters. In an integrated design of the optical particle counters, the confinement of the air is becoming more critical, since variations in particle positions are getting bigger relative to the dimensions of the sensor. Variations in particle position directly affect the light collection angle and hence induce the particle sizing error. We have developed a 3D simulation framework based on a Lorentz-Mie theory and analyzed the effect of particle position on the particle sizing error. We show that the relative sizing error induced by particle position is detrimental and seriously limits the sizing performance of downscaled PM2.5 sensors.

1. Introduction

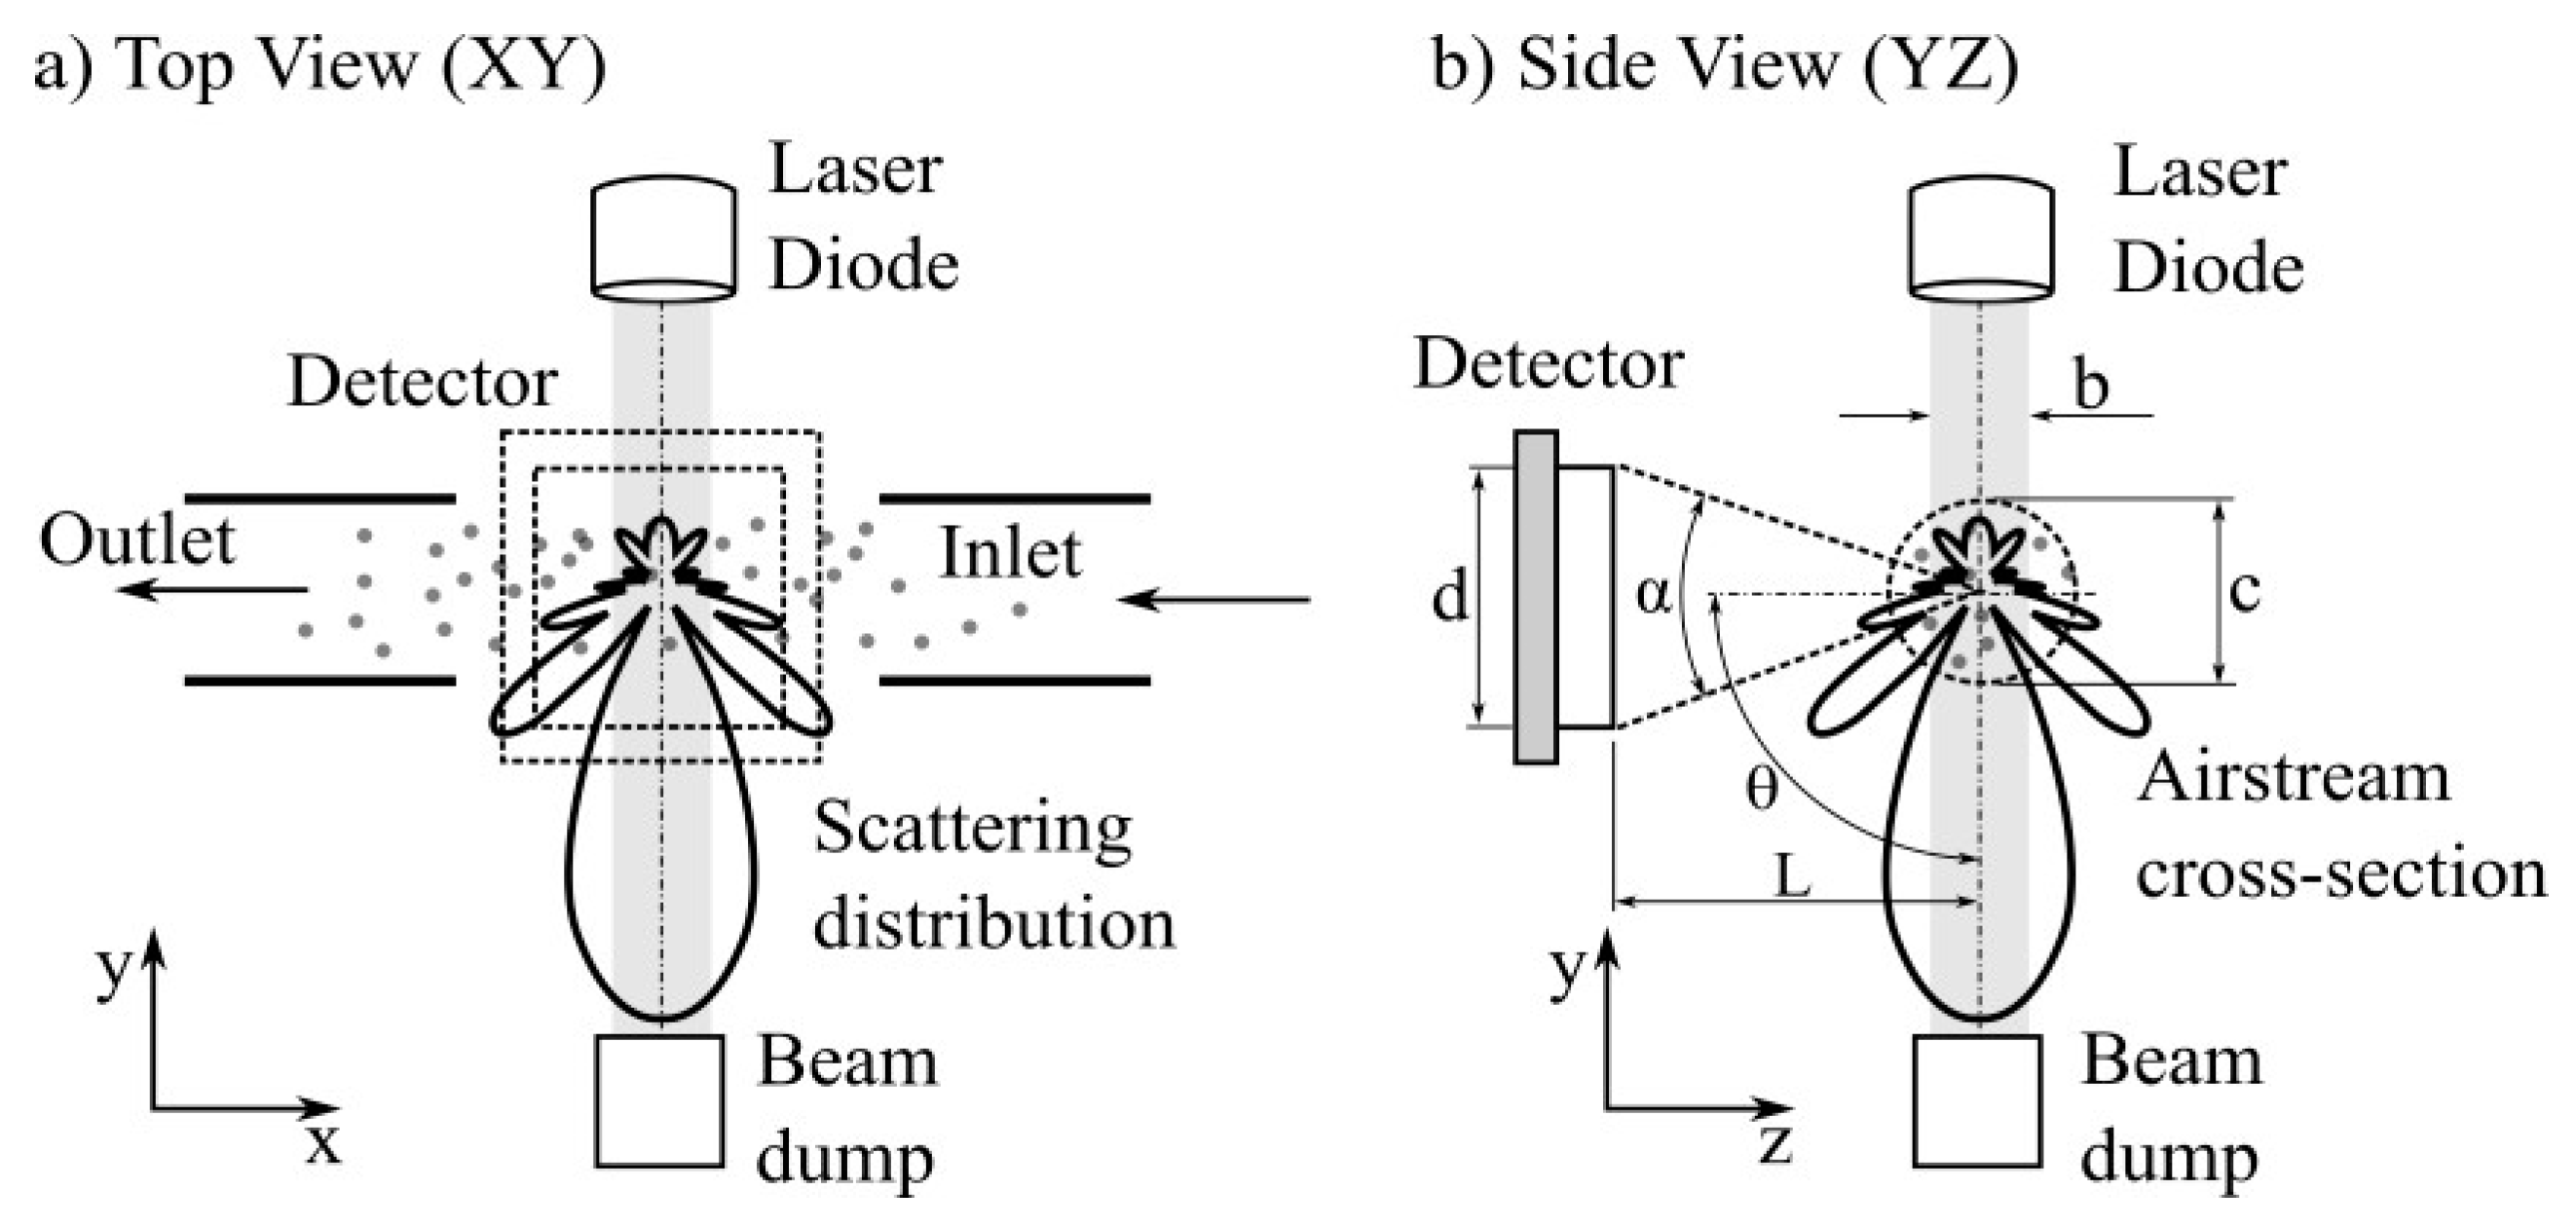
An increased number of studies are indicating the risk that fine particulate matter pose on human health by their ability to penetrate deep into the lungs, pass through the cell membrane and enter blood stream, cause cardiovascular and neurological problems [1]. It is therefore important to maintain ambient air quality at appropriate levels, from where an increased need for personal monitoring of airborne fine particles emerges. Recently, various integrated compact light-scattering optical particle counters have been reported for time- and size resolved measurement of the particles [2,3,4,5]. These designs often avoid the light collection optics on account of the overall sensor footprint and rather collect the light with the photodetector directly [4,6]. A generalized measurement setup of a miniaturized optical particle counters adopted from [4] is depicted in Figure 1. Here, the photodiode is placed close to the airflow channel in order to increase the light collection angle and reduce the photodiode footprint to reduce its dark current. In such configuration, the light collection is defined by the geometry of the detector and the distance of the particle. Any variation of the particle position leads automatically to the light-collection angle variation, changing the response of the sensor in turn leading to the under or overestimation of the particle size. While these effects are negligible at bigger optical particle counters, they are considerably more pronounced in an integrated sensor design due to practical limitations of the air-stream confinement and generally smaller distances between detector and the measurement cavity. In this paper we investigate these effects in more detail using 3D Mie scattering simulations and show that effect of the particle position uncertainty is detrimentally affecting the performance of the miniaturized PM2.5 particle sensors.

2. Lorentz-Mie Scattering Simulations

The scattered radiation of homogenous spherical particles is governed by Mie scattering theory, which provides analytical formulations as solution to the Maxwell equations [7]. In Mie theory, the vertically and horizontally polarized scattered radiation intensities, 𝐼𝜙 and 𝐼𝜃 scattered at an angle (𝜑, 𝜃), are given as:
I 𝜃 = I 0 𝜎 p ( 𝜃 )   sin 2 𝜑 I 𝜙 = I 0 𝜎 s ( 𝜃 )   cos 2 𝜑
Here 𝐼0 is the light intensity of the incident beam and 𝜎′𝑝 and 𝜎′𝑠 the differential scattering cross sections, defined as below:
σ p ( θ ) = λ 2 4   π 2 r 2 r p ( θ )
σ s ( θ ) = λ 2 4   π 2 r 2 r s ( θ )
with rp and rs calculated using complex parameters S1 and S2 from Mie scattering theory [7]:
r p = ( S 1 S 1 * ) 2 r s = ( S 2 S 2 * ) 2
By multiplying both sides of Equation (1) with dA, adding them together and accounting for relation d ω = d A r 2 , we can express the scattered power per solid angle [Wsr−1] as:
E ( θ , φ ) = I 0 λ 2 4 π 2 ( s i n ( φ ) 2   r p ( θ ) + c o s ( φ ) 2 r s ( θ ) )
This formulation is convenient, as it allows an easy estimation of the total scattered power, incident to the photodetector. By integration of Equation (5) over angular region Ω, whose boundaries are found by corresponding to the photodetector, considering the solid angle 𝑑𝜔 = sin(𝜃) 𝑑𝜃𝑑𝜑, we get the total scattered power, incident to the photodetector PΩ in [W] as:
E P Ω = θ , φ   Ω     I 0 λ 2 4   π 2 ( ( S 1 ( θ ) S 1 * ( θ ) ) 2 s i n 2 φ + ( S 2 ( θ ) S 2 * ( θ ) ) 2 c o s 2 φ   ) s i n ( θ )   d θ d φ
Using Equation (6) we can now vary the particle position in 3D Cartesian coordinates, find the corresponding solid light collection angular region Ω and estimate the theoretical sensor response by integration of an angular scattering distribution. This way, we can easily prove different geometrical variants of the sensor and study the effects on the signal response. In our example, we set d/L from Figure 1 to 0.83, set sensor side length to 1000 µm, to account for 45° light collection and varied the particles’ size within ±250 µm from the nominal central position in each of the three Cartesian axes. This way, we obtained three responses for each Cartesian direction—one for central position and two for both positive and negative extremal points (Figure 2a–c). As seen, particle motion along the airstream (x-direction in Figure 1a,b) do not influence the response significantly due to relatively modest asymmetry in the scattered radiation distribution about the light-axis (Figure 2b). On the other hand, the response is stronger affected by the variation of the distance from the detector and position along the beam axis (y-direction in Figure 1a,b), which moves the light collection more to the forward or backward scattering regime (Figure 2c).
Next, we can estimate the particle sizing error, introduced by the particle position variation. For each distinct particle size, we project responses of both extremal particle position horizontally to the nominal one and estimate the horizontal intersection point. This intersection gives us the dmin and dmax, the minimum and maximum estimation of the particle diameter, corresponding to the sizing error for a certain particle size (Figure 2a).
We evaluated the particle sizing error for ±250 µm particle position variation around the nominal central position, different particle diameters (Figure 3a) and all three Cartesian directions. As obvious from Figure 2a–c this error is mostly dominated by the displacement in the detector axis. We then extract the extremal error at each particle diameter and estimated the total particle diameter error for different particle displacement ranges (Figure 3b). From results in Figure 3b we see that the total particle sizing error of 1.5µm particle can exceed 1µm. Comparing to existing sizing error studies [4], the relative sizing error of position is shown to exceed the sizing error of an unknown complex refractive index of particles and therefore one of the biggest sources of error for the integrated optical particle sensor. Since the positional error is systematic, such sensor would have extremely poor sizing performance and would rather be limited to particle counting only.
4. Conclusions

Based on the 3D-Mie scattering simulations, we have analyzed the effect of the particle position in miniaturized optical particle counters and demonstrated its huge detrimental effect on the sizing accuracy. It was shown, that the sensor response is most affected by the variation of the distance between the particle and photodiode. For a case of 1.5 µm particle diameter, 45° light collection angle with 1 mm photodiode side length, a ±250 µm particle displacement leads to a sizing error of 1 µm. This indicates limited sizing performance of integrated optical particle counters, thereby limiting their application to particle counting only. Our future work will be pointed towards the sensor design considerations to circumvent the sizing error arising from particle position.

Author Contributions

J.P. conceived and designed the Mie scatting algorithms, performed the numerical simulations, the required data processing and wrote the paper. G.R. supervised the data analysis and discussed the results.

Acknowledgments

This project was subsidized by the Austrian Research and Promotion Agency (FFG) and carried out as part of the FFG Basisprogramm.

Conflicts of Interest

The authors declare no conflict of interest. The founding sponsors had no role in the design of the study; in the collection, analyses, or interpretation of data; in the writing of the manuscript, and in the decision to publish the results.

References

  1. Xing, Y.-F.; Xu, Y.-H.; Shi, M.-H.; Lian, Y.-X. The impact of PM2.5 on the human respiratory system. J. Thorac. Dis. 2016, 8, 6. [Google Scholar]
  2. Nicoletti, S. Particle Detector and Method for Producing Such a Detector. U.S. Patent 9,518,909 B2, 15 September 2018. [Google Scholar]
  3. Loi, S.; Pagani, A. Integrated Detection Device, in Particular Detector of Particles Such as Particulates or Alpha Particles. U.S. Patent 20160077218A1, 15 September 2018. [Google Scholar]
  4. Njalsson, T.; Novosselov, I. Design and optimization of a compact low-cost optical particle sizer. J. Aerosol. Sci. 2018, 119, 1–12. [Google Scholar] [CrossRef] [PubMed]
  5. Jongseok, K.; Seokwhan, C. Mobile Device Which Senses Particulate Matter and Method of Sensing Particulate Matter with The Mobile Device. US20160025628, 15 September 2018. [Google Scholar]
  6. Dong, M.; Iervolino, E.; Santagata, F.; Zhang, G.; Zhang, G. Integrated Virtual Impactor Enabled PM2.5 Sensor. IEEE Sens. J. 2017, 17, 2814–2821. [Google Scholar] [CrossRef]
  7. Bohren, C.F.; Huffman, D.R. Absorption and Scattering of Light by Small Particles; Wiley-VCH: Weinheim, Germany, 2004. [Google Scholar]
Figure 1. (a) Optical particle sensor system with its components (modified from [4]), viewed from the top, (b) and same sensor viewed from the side. In our example, we set the θ to 90° and α to 53° in both directions.
Proceedings 02 00850 g001
Figure 2. Theoretical response for the nominal and two negative and positive extremal positions for ±250 µm displacement in the direction of the (a) axis of the laser source, (b) axis of the air stream and (c) optical axis of the detector. In (a), the estimation procedure of the particle sizing error is shown. For the sake of this simulation, we set the λ = 650 nm, input intensity to I0 = 5 Kw/m2 and the complex refractive index to m = 1.5 + i0.
Proceedings 02 00850 g002
Figure 3. (a) Graph of sizing error with dmin and dmax diameter estimation for ±250 µm displacement in each of the axis. Here the 45° line indicates the ideal curve of zero sizing error. The gray area indicates the maximal error, obtained by the extremal error estimation of all three responses for each particle, here mostly dominated by the displacement in the detector axis. This way, we obtain a total particle diameter error for each particle, as indicated for 1.5µm particle. (b) Graph of total particle diameter error as a function of particle size for different ranges of displacements ranging from ±50 µm to ±250 µm.
Proceedings 02 00850 g003
Publisher’s Note: MDPI stays neutral with regard to jurisdictional claims in published maps and institutional affiliations.