1. Introduction
It is important to monitor the pollutant NO
x concentration in exhaust and livestock production gases, which has promoted vigorous study on WO
3 for the application to NO
x gas sensors. For this purpose, WO
3 films were prepared by such many techniques as sputtering [
1], thermal evaporation [
2], pulsed laser deposition [
3] and sol-gel [
4,
5] methods. Among them, sol-gel is the most promising candidate method for the capability of low cost fabrication in large area since it is a typical technique of non-vacuum processing. In this study, we fabricated a gas sensor from a WO
3 thin film prepared by a sol-gel method using an aqueous mixture solution of cost-effective popular regents; ammonium metatungstate hydrate (AMT) and poly-vinyl alcohol (PVA).
From the viewpoint of the systematic understanding of sensing mechanism, on the other side, not enough effort is devoted for WO
3-based gas sensors to discuss the detection characteristics using common physicochemical parameters while many works have been concentrated to increase the sensitivity. To contribute to the systematic understanding, we analyzed the detection characteristics of our WO
3-based gas sensor by measuring the response to NO, H
2, and NH
3. NO was chosen as the representative of NOx because it is used as the indicator of photochemical smog and is the precursor of NO
2. Since NO (reducing gas) is rapidly converted to NO
2 (oxidizing gas) in air, we compared the response to NO with that to conventional reducing gases of H
2 and NH
3 to clarify the detection mechanism. We also analyzed the sensing behavior by modeling the resistance change using the Schottky barrier at grain boundaries and the Langmuir isotherm adsorption of ambient gas [
6].
2. Experimental Procedure
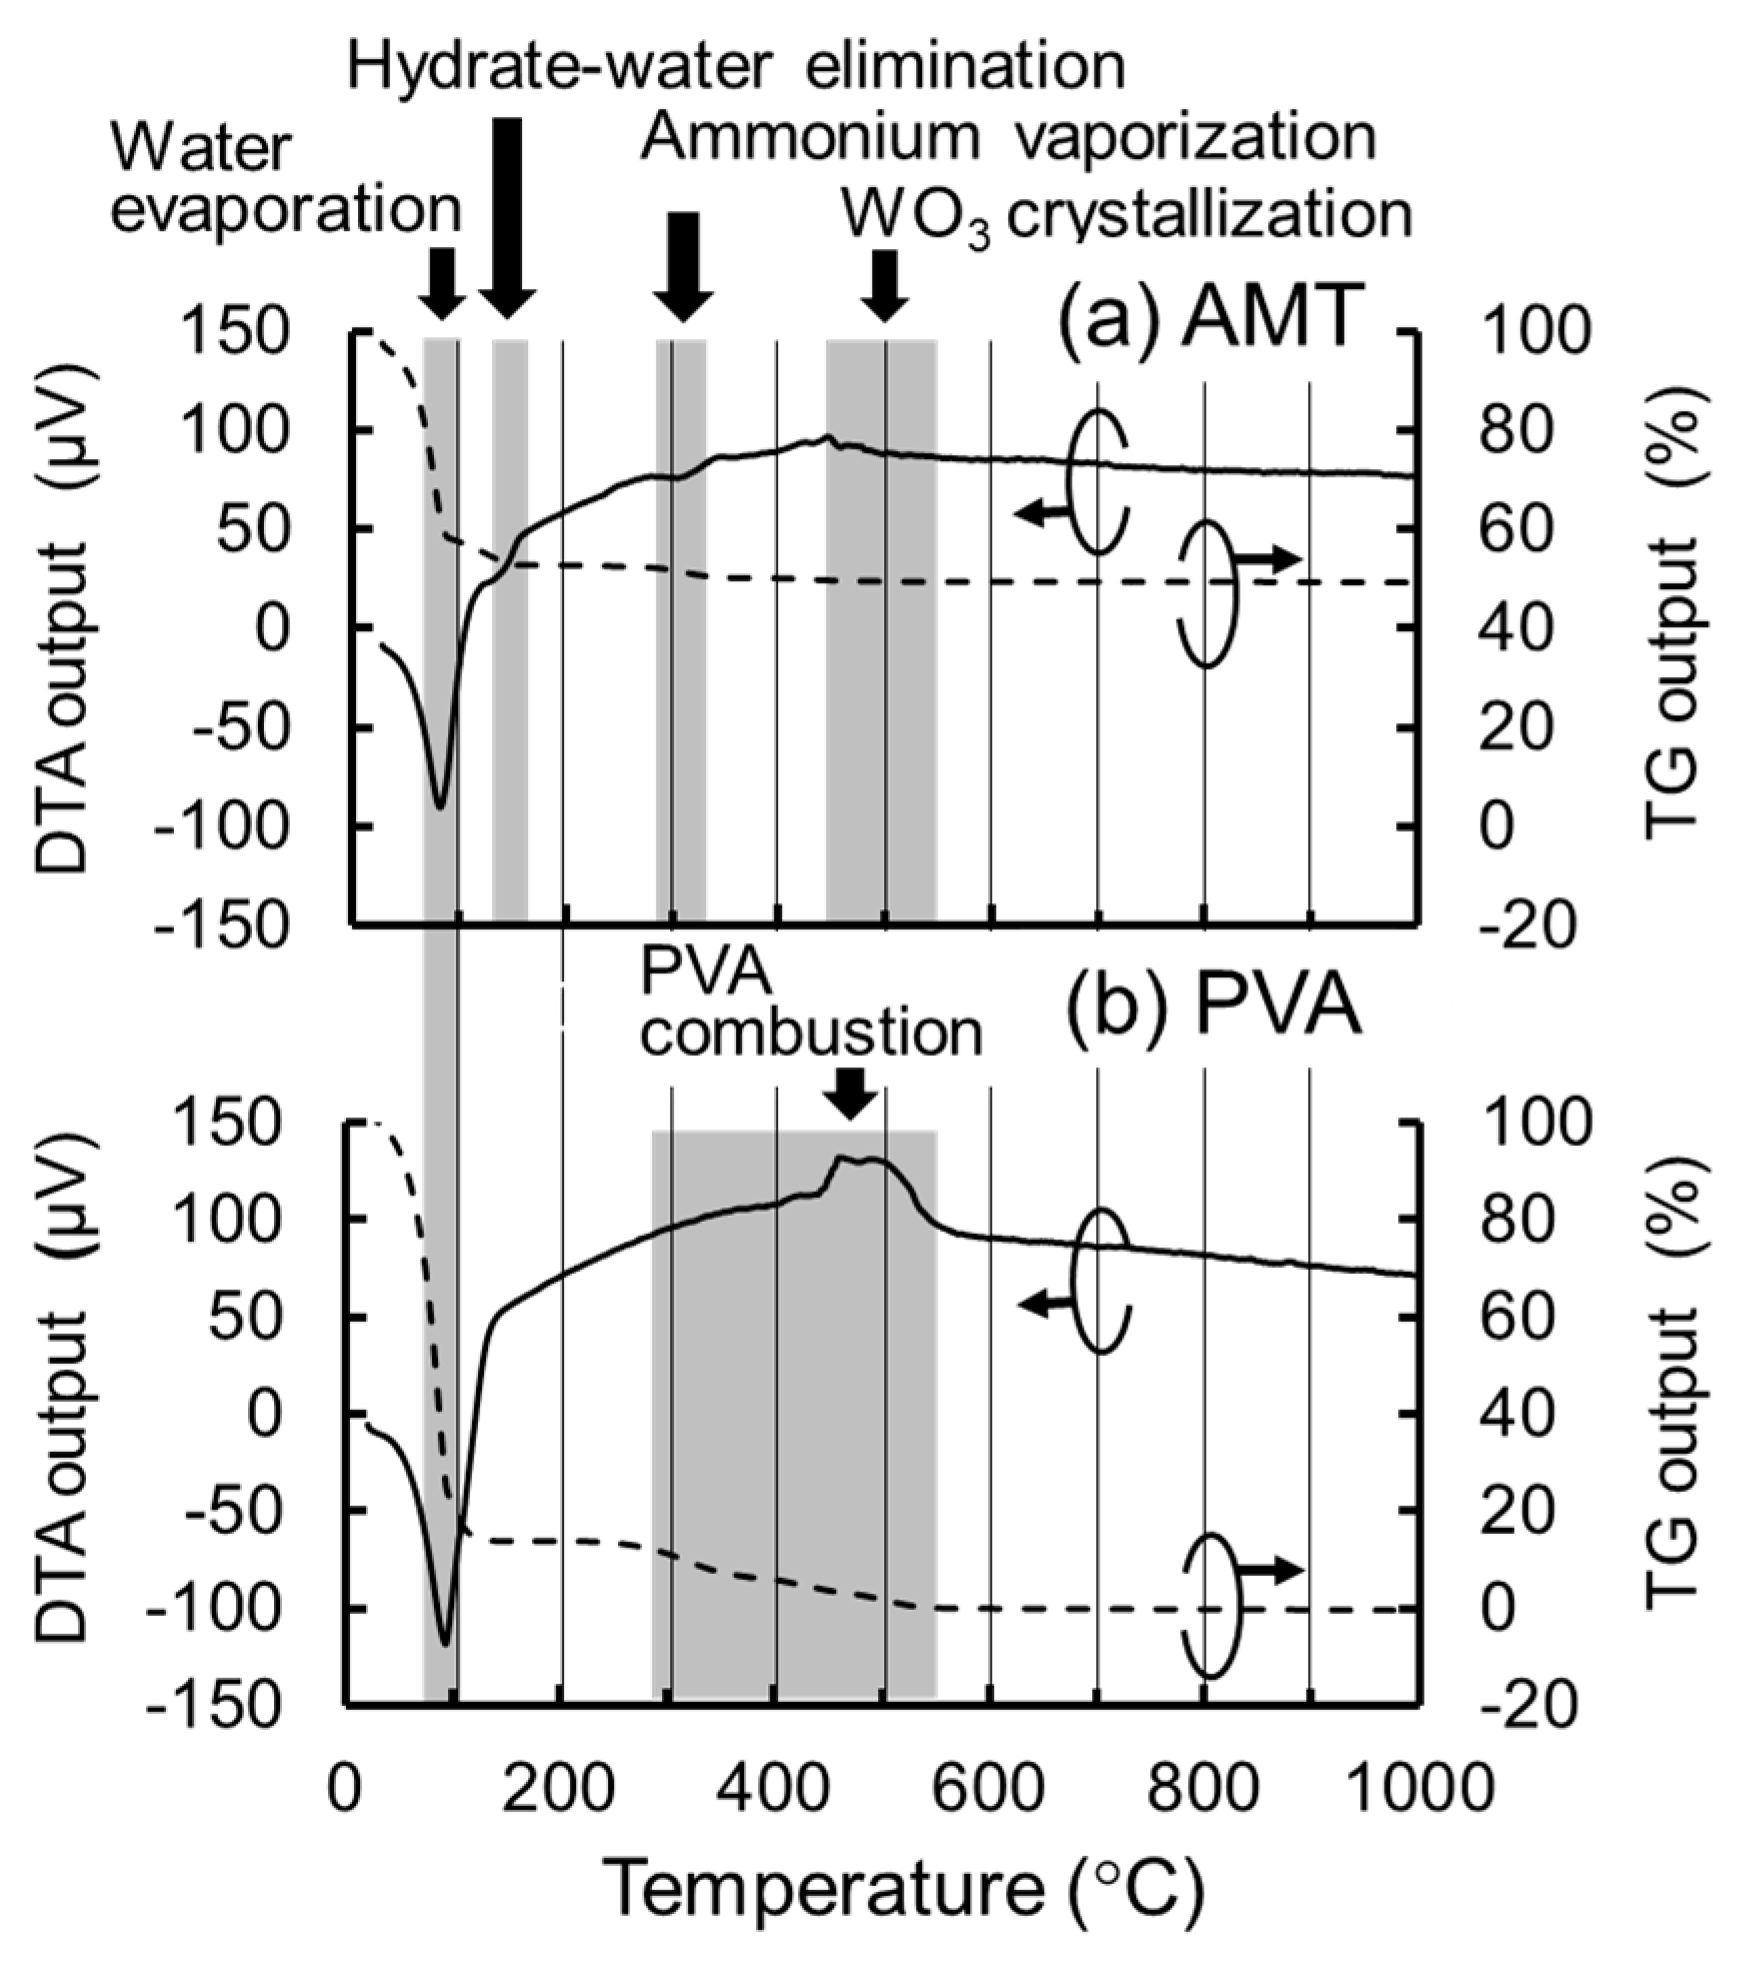
To estimate the optimal calcination temperature of the sol-gel processing, thermogravimetry-differential thermal analysis (TG-DTA) was conducted for 50 w% aqueous solution of AMT (Japan New Metals) and 10 wt % aqueous solution of PVA (Fuji Film Wako) using a Seiko Instruments-made TG-DTA 6300 system. As shown in
Figure 1a,b), water evaporates at around 100 °C for both cases, AMT decomposes at around 300 °C and crystallizes into WO
3 at around 500 °C, and PVA burns out at around 550 °C. From these results, we used 600 °C for the calcination temperature in the following experiment.
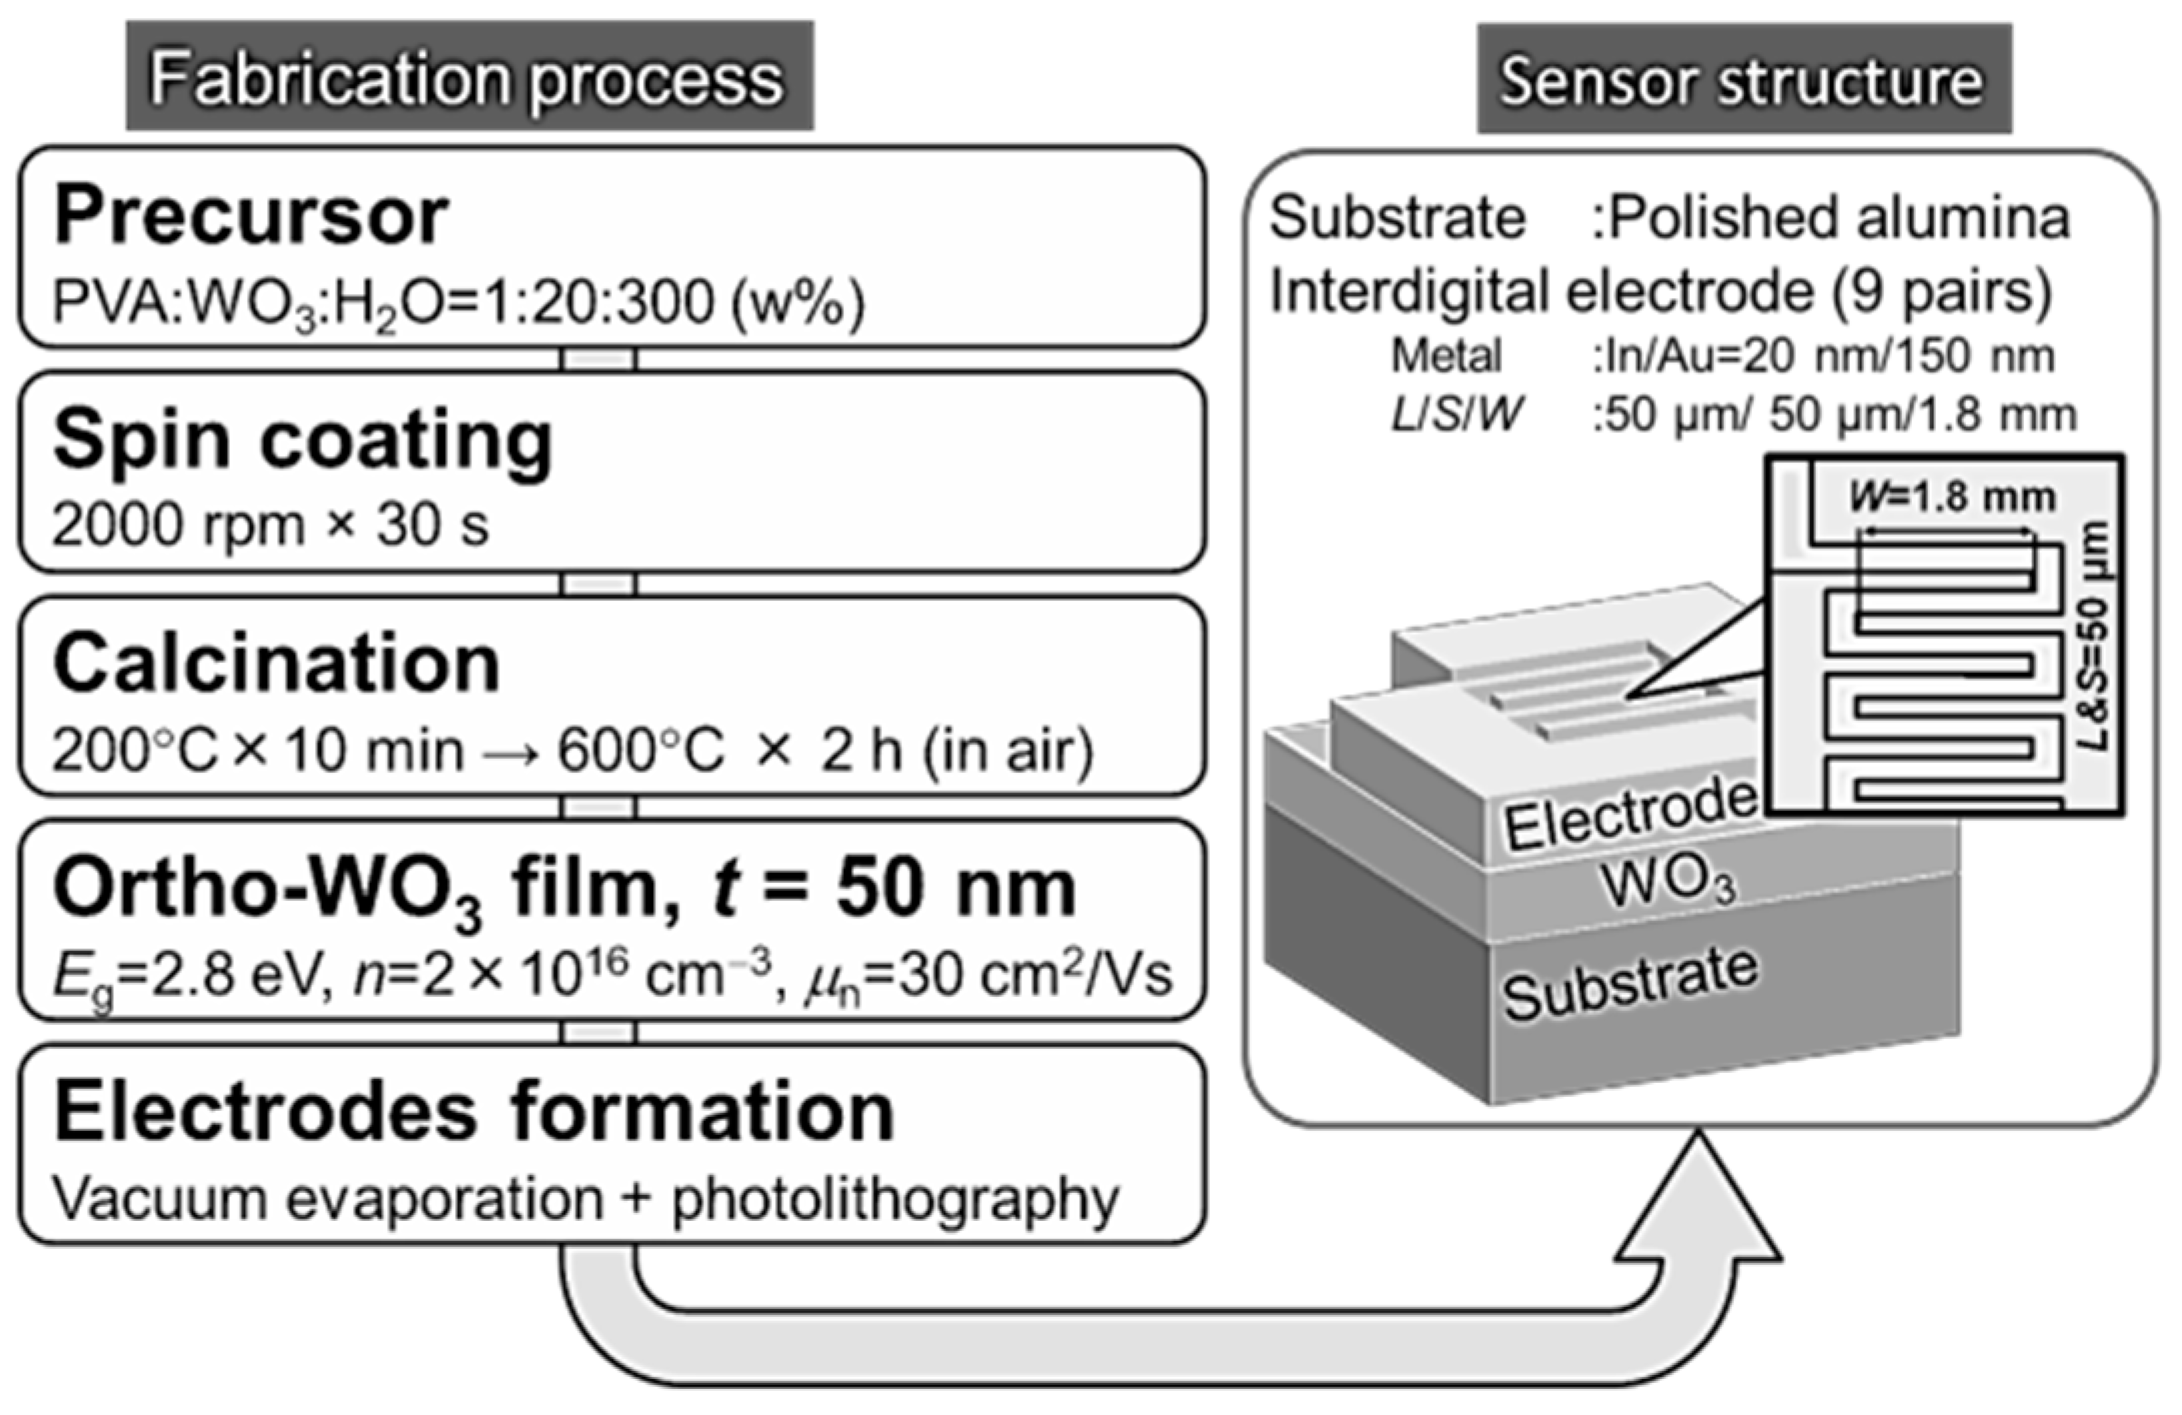
The WO3 film for the gas sensor was prepared on a polished alumina substrate (Maruwa) with 40 nm root-mean-square (RMS) surface roughness. First, an aqueous mixture solution of PVA:AMT:H2O = 1:20:300 (in wt %) was coated on the alumina surface using a spin-coating method at 2000 rpm for 30 s. Then the film was dried at 200 °C for 10 min in air, and the calcination at 600 °C was conducted for 2 h in air, resulting in an approximately 50 nm thick WO3 thin film without cracks.
The following basic properties were obtained for the equivalent WO3 film prepared on a glass substrate (Corning EAGLE XG) using the same fabrication procedure. The X-ray diffraction (XRD) measurement in 2°/ω configuration using a Rigaku-made SmartLab system with Cu K 1 radiation indicated that the WO3 film was crystallized in an a-axis oriented orthorhombic polycrystalline phase. The X-ray reflection measurement using the same XRD system combined with a simulation software (Rigaku GlobalFit) indicated that the film was 47 nm in thickness, 0.79 nm in RMS roughness, and 7.1 g/cm3 in density, in good agreement with the data measured by an atomic force microscope (Shimazu SPM-9700) of 45 nm in thickness and 0.56 nm in RMS roughness, and with the well-known WO3 density of 7.16 g/cm3, showing that the film was solid and neither porous nor granular. The bandgap energy determined by the Tauc plot of the optical transmittance at 300 K assuming indirect transition was 2.8 eV in consistent with the value for bulk WO3. The Hall effect measurement by van der Pauw method indicated that the conduction was n-type with a carrier concentration of about 2 × 1016 cm3 and a mobility of about 30 cm2/Vs.
The fabrication process of the gas sensor with interdigital electrodes (IDEs) is given in
Figure 2. The IDEs were formed by evaporating a Au (150 nm)/In (20 nm) film on the WO3 surface where the In thin layer was inserted to improve contact resistance, and by patterning their nine-pairs of finger electrodes using a lift-off technique combined with standard photolithography. The dimensions of the finger electrodes were 1.8 mm in width and 50 μm in line and space.
The gas sensing characteristics were measured in a flow-type airtight test fixture where the gas sensor was mounted side-by-side with a dummy sample on an alumina- made heating block. We bonded a thermo-couple on the dummy surface and connected it to an outside PID controlled power supply for the heating block. Electrical leads were bonded to the IDEs on the sensor surface to connect with an outside digital multimeter (Keysight 34465A) by using a glass frit Ag glazing paste (Daiken Chemical). The concentration of NO, NH3, and H2 gases (Air Water) was adjusted in the range of 1.0–1000 ppm by using Horiba-made mass-flow controllers and clean air gas (99.99%, 21 vol% O2 in N2) for dilution with a total flow rate of about 1 L/min.
3. Gas Sensing Characteristics
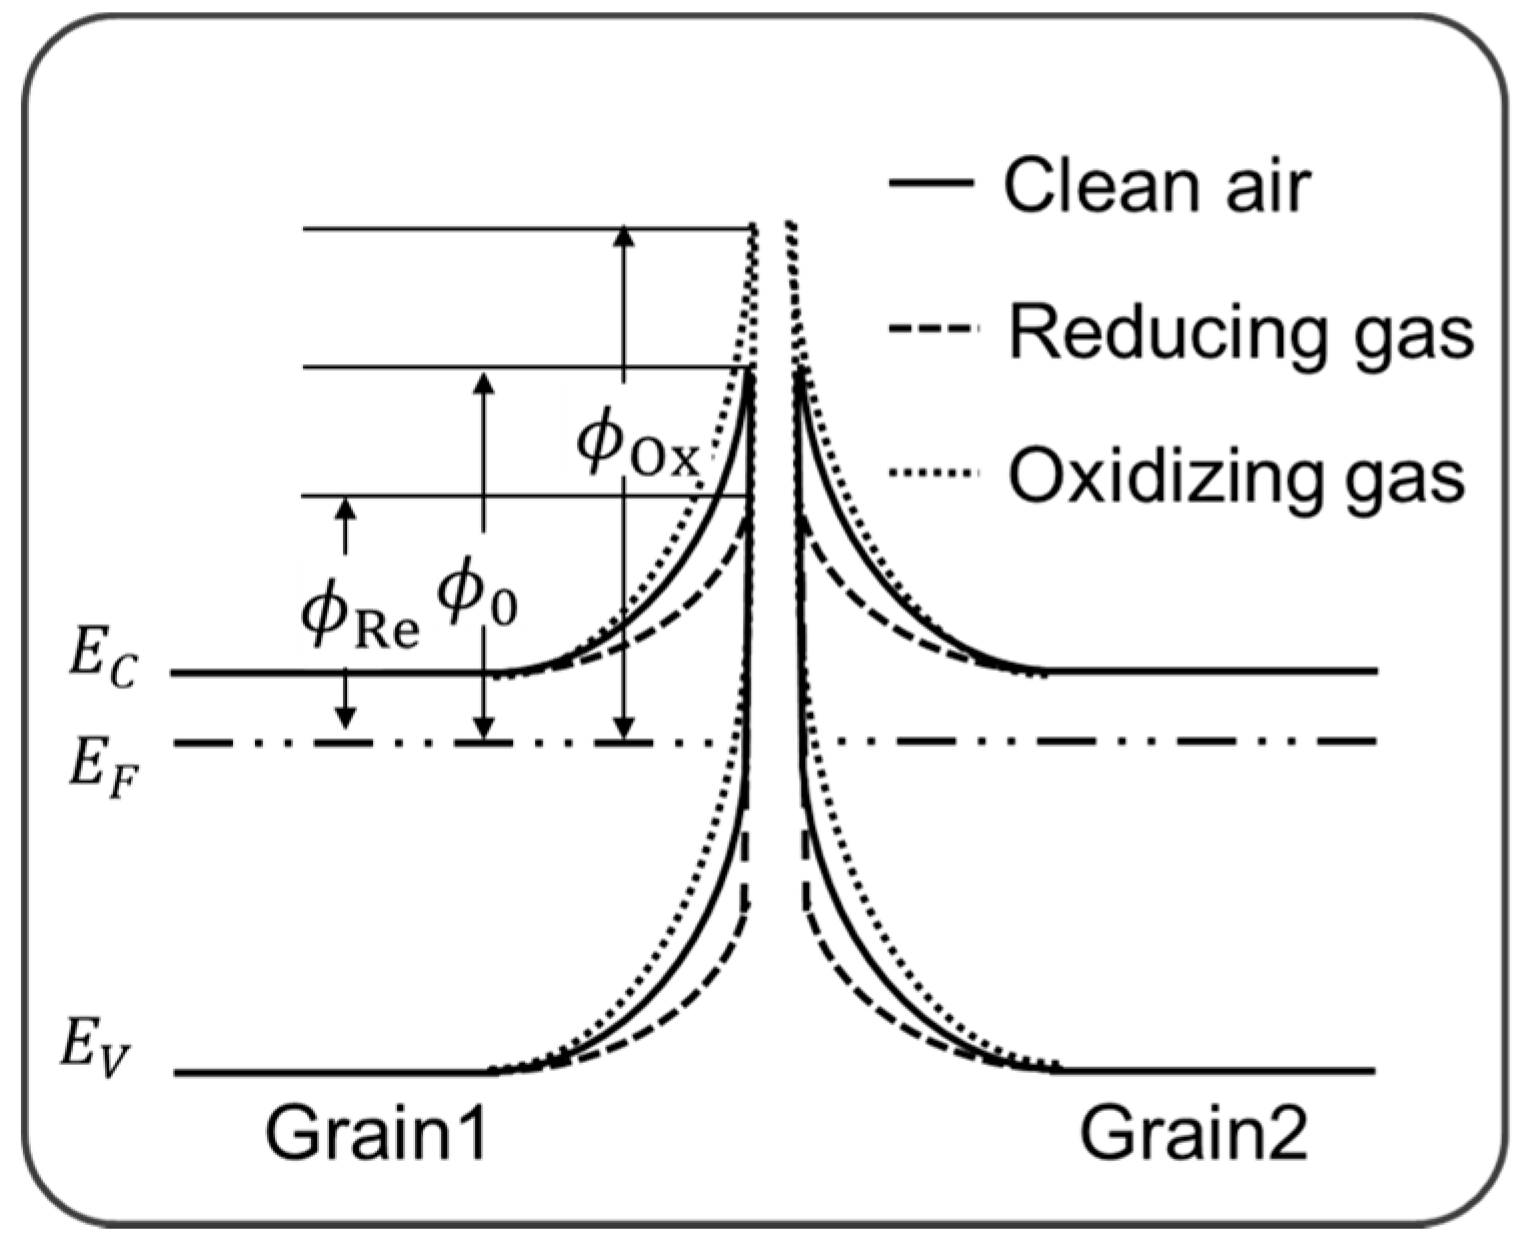
The model band-diagram at the grain boundaries in WO
3 film is depicted in
Figure 3, where the symbols of ∅
0, ∅
Ox and ∅
Re represent the Schottky barrier heights at the stationary states in clean air, oxidizing gas, and reducing gas, respectively. In clean air, a considerable part of the grain surface is covered with oxygen atoms which are negatively charged by capturing the conduction electrons in WO
3. The Schottky barrier with a height of ∅0 is formed to compensate the negative surface charges with the positively charged donors in the depletion layer. When reducing gas reacts with the negatively charged oxygen atoms, the depletion width will be reduced by lowering the barrier height, while the reaction of the grain surface with oxidizing gas enhances the depletion width by increasing the barrier height.
The relationship between the barrier height ∅ and the concentration of the negative charge
C at the grain surface is given by solving the following equations,
where
q is the electron charge,
εs is the dielectric constant of WO
3,
ND is the donor concentration in WO
3,
x is the distance from the surface toward the inside, and
xd is the edge position of the depletion layer. We obtain the relationship,
When the concentration of effective charge is changed from the initial value 𝐶
0 in clean air to 𝐶 = 𝐶
0 + ∆𝐶 after gas adsorption, the increase of the barrier height ∆∅ assuming 𝐶
0 ≫ ∆𝐶 is expressed as
where ∆𝐶 > 0 for oxidizing gas and ∆𝐶 < 0 for reducing gas. Accordingly, the electron concentration
n that can get over the Schottky barrier after gas adsorption is expressed as
where
n0 is the electron concentration that can get over the Schottky barrier in clean air,
k is the Boltzmann constant,
T is the absolute temperature. Assuming that the electron mobility does not depend on
n, the electrical resistance 𝑅G after gas absorption becomes
where 𝑅
0 is the resistance in clean air. Then, we obtain the relationship
Therefore, we can expect that ∆Log𝑅 is directly proportional to ∆𝐶, and that the resistance change in logarithmic scale increases and decreases with the increase of oxidizing and reducing gas adsorption, respectively.
If the change of the effective charge ∆𝐶 is yielded only by the monolayer adsorption and the adsorption sites are distributed randomly on the WO
3 surface, the coverage 𝜃 of the adsorbed gas molecules will be expressed as follows using the Langmuir isotherm equation,
where ∆𝐶
max is the maximum adsorption capability, ∆Log𝑅
max is the resistance change at 𝜃 = 1, 𝐶
G is the equilibrium concentration of oxidizing or reducing gas in air, 1/
K is the dissociation constant. As the result, we can expect a sigmoidal curve for the dependence of ∆Log𝑅 on 𝐶
G.
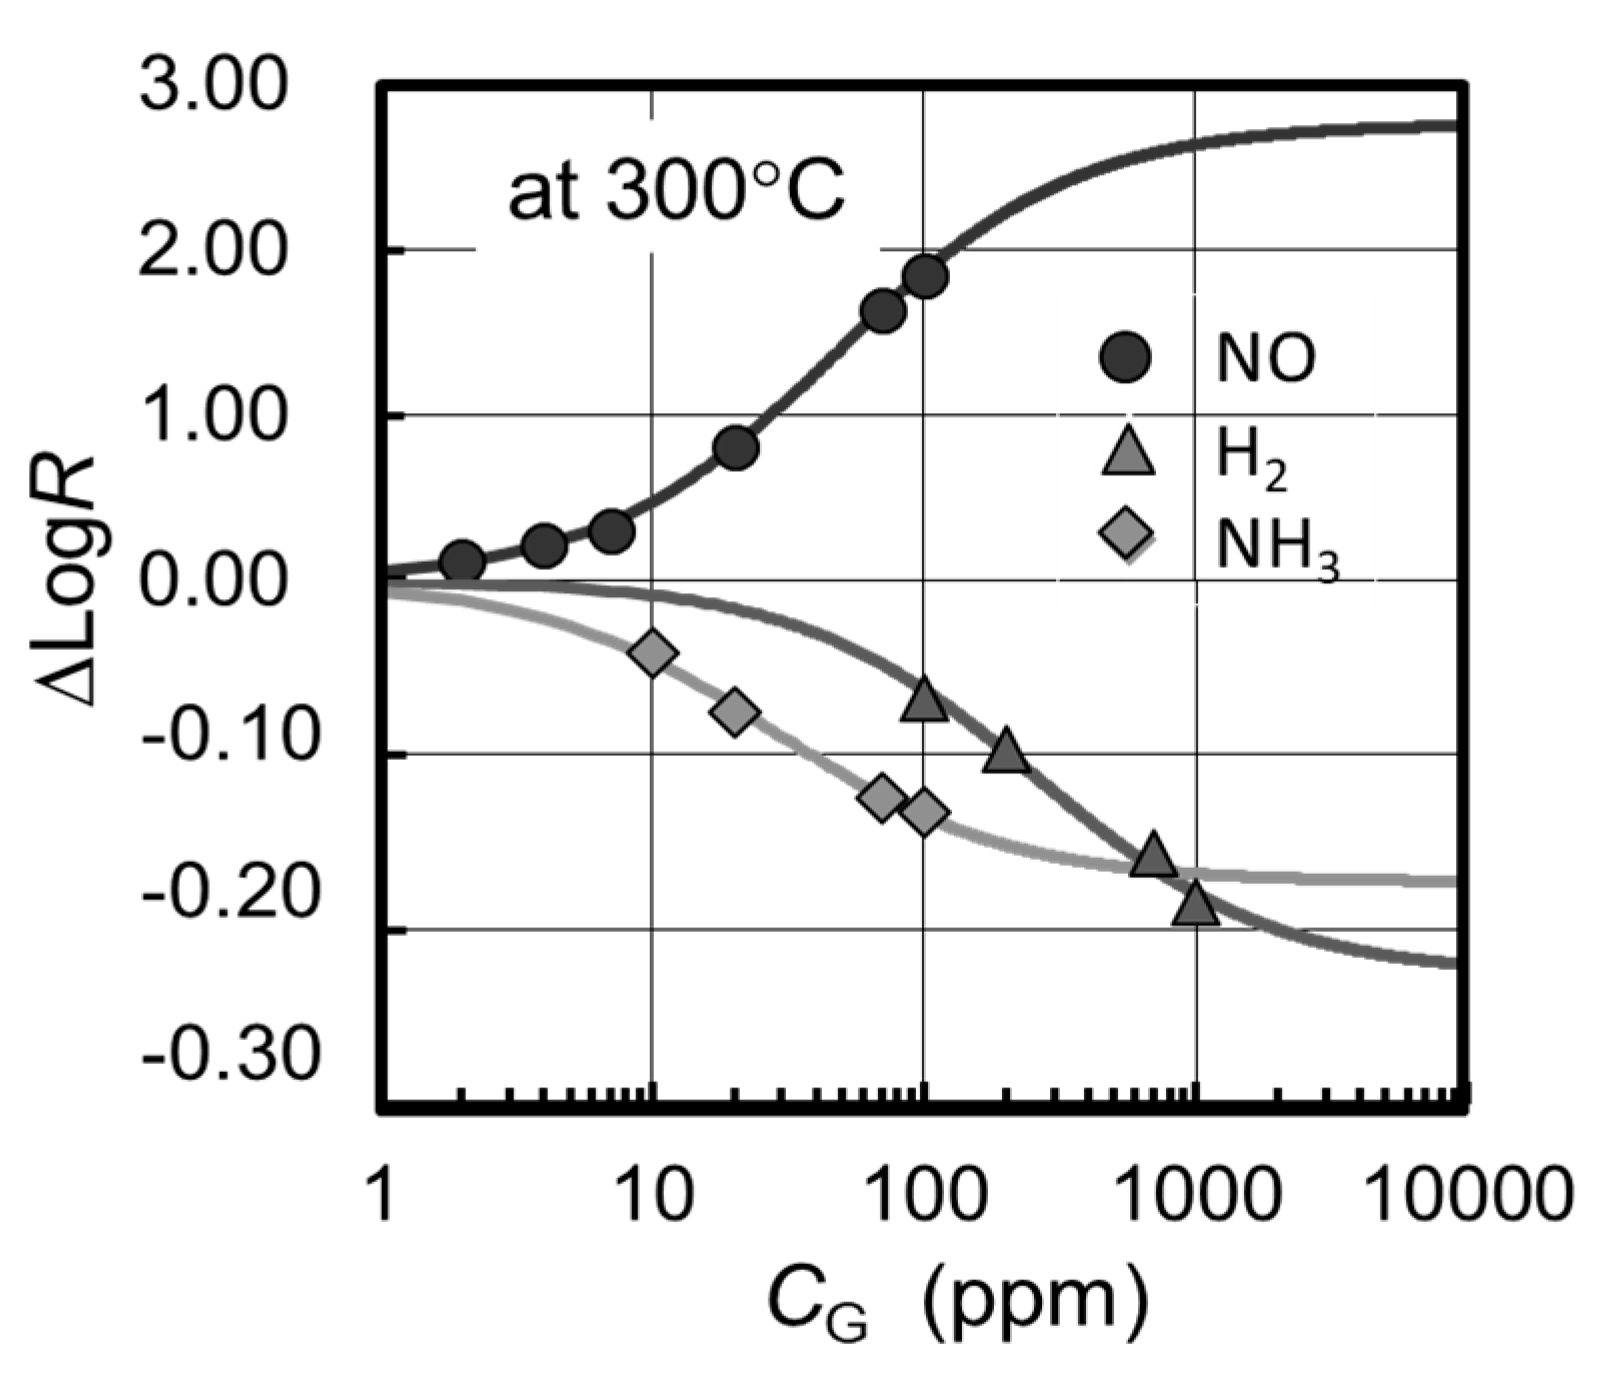
The experimental results at 300 °C are shown by the ∆Log𝑅 plots as a function of 𝐶
G in
Figure 4. Each value of ∆Log𝑅 was obtained by measuring the saturated resistance change after ten minutes or more from the introduction of a certain gas concentration; where the response time required for 63% change in ∆Log𝑅 was less than several minutes. Lines in
Figure 4, on the other hand, are the fitting curves calculated from Equation (7) of which values 1⁄𝐾 and ∆Log𝑅
max are estimated as follows; 1⁄𝐾 = 4.9 × 10
−5 and ∆Log𝑅
max = 2.8 for NO, 1⁄𝐾 = 2.6 × 10
−4 and ∆Log𝑅
max = −0.23 for H
2, and 1⁄𝐾 = 2.9 × 10
−5 and ∆Log𝑅
max = −0.17 for NH
3 by fitting the experimental data to the Hanes-Woolf plot. One can see in
Figure 4 a good agreement of the calculation with the experiment, indicating that the resistance change can be interpreted by the simple model mentioned above.
It is denoted by the positive sign of ∆Log𝑅
max that NO is detected as a kind of oxidizing gas similar to the report by others [
7] presumably due to the immediate oxidization in air/on WO
3 surface, which is very different from the cases of H
2 and NH
3. It is also shown by the much larger ∆Log𝑅max value of NO that WO
3 has a specific sensitivity to NO
x. In order to shift the sigmoidal curve toward the lower gas concentration, reduction of the dissociation constant, 1/
K, by using additives with catalytic function will be effective. As well, the use of nanostructured/porous WO
3 films can be helpful for the improvement of the sensitivity and response time by reducing the contribution from the insensitive deeper layers in WO
3, while the presented data were taken for a solid and flat film without additives to study the basic properties of WO
3-based gas sensors.

