Proceeding Paper

Cryptosporidium & Giardia in Water—Key Features and Basic Principles for Monitoring & Data Analysis †

by
Jerry E. Ongerth
1,* and
Panagiotis Karanis
2
1
Civil Mining & Environmental Engineering, University of Wollongong, Wollongong, NSW 2522, Australia
2
Medical School, University of Cologne, 50937 Cologne, Germany
*
Author to whom correspondence should be addressed.
Presented at the 3rd EWaS International Conference on “Insights on Water-Energy-Food Nexus”, Lefkada Island, Greece, 27-30 June 2018.
Proceedings 2018, 2(11), 691; https://doi.org/10.3390/proceedings2110691
Published: 17 September 2018
(This article belongs to the Proceedings of EWaS3 2018)

Abstract

:
Public health implications of Cryptosporidium and Giardia (C&G) in surface water depend on the characteristics of their occurrence at locations relevant to public water supplies. Recent detailed multi-location and long-term data sets have provided an accurate and complete understanding of occurrence features not previously available. Poisson statistics describe oocyst and cyst concentrations that are characteristically low with respect to the limit of detection of best available analytical methods. The IMS-IFA based analytical methods (e.g., ISO 15553, USEPA 1622/1623) provide reliable data on levels of both C&G in water. Recovery efficiency varies widely and must be measured to give concentration data that can be compared between disparate locations and sampling times. Analysis of samples at a minimum monthly frequency using sufficient sample volumes, e.g., 50 L, has shown that C&G are virtually universal in surface water, continuously, and at levels consistent with catchment conditions. Some basic rules of monitoring and data analysis derived from this background information will ensure that monitoring effort and cost are applied in the most efficient and effective manner.

1. Introduction

Cryptosporidium and Giardia are waterborne pathogens universally acknowledged to cause widespread water related human illness. Waterborne community outbreaks (limited epidemics) attributed to both organisms have occurred in developed regions having high economic and sanitation standards, e.g., Europe, North America, Australia, having well-developed public health regulation and high standards of public water supply and wastewater management [1]. Both organisms have been shown to be present in virtually all surface water world-wide, accordingly their monitoring is of significant importance to public health risk management. Significant effort has been devoted to understanding of the occurrence, sources, distribution, and fate of these organisms in the environment [2,3]. Published data and interpretation on Cryptosporidium and Giardia in water has evolved from very crude and incomplete early in the modern period (1970–1990’s) to the current (2000-present) state of relatively sophisticated technology capable of generating information sufficient to provide reasonably complete understanding of essential characteristics [4]. As the quality and quantity of characterizing information has improved, so has the understanding and interpretation of just what characteristics are essential to permit effective and efficient monitoring to support watershed and water treatment system management [5]. The purpose of this presentation is to review the essential features of Cryptosporidium and Giardia in water, to summarize information available to characterize their presence relevant to public water supply and public health management, and to distill fundamental principles essential to effective and efficient monitoring that will provide for and support effective watershed and water treatment system management.

2. Background

A recent review of the development of monitoring for Cryptosporidium and Giardia [4] identified characteristics of the two organisms that dictate requirements for monitoring including sampling design and analytical procedure. In the 1960’s and 1970’s, waterborne outbreaks of giardiasis prompted earliest efforts to find and characterize Giardia in water [6]. In this period the sources and distribution of Giardia were not thoroughly described and certainly poorly understood in relation to their introduction to, distribution in, and fate in surface water. Early monitoring procedures were crude and inefficient. The sketchy data produced by early efforts to characterize their presence in water suggested, inaccurately, intermittent and limited distribution geographically with sources due to a limited range of animals e.g., the North American beaver. When Cryptosporidium was recognized as a human pathogen of significance in the mid 1980’s during the early phase of the AIDS epidemic, physical and biological similarities to Giardia dictated the early phase of monitoring for it (Cryptosporidium) as well.
Prominent early studies were conducted as geographical surveys, with the collection of single samples at widely spaced locations [7,8]. Until 2000 the most widely used monitoring procedure included filtration of large volumes, typically 100 L, through an inefficient yarn-wound cartridge filter, recovery of organisms by washing the filter medium, and gradient centrifugation, followed by immunofluorescence microscopy (IFA) detection. Due the inefficiency of particle collection and (oo)cyst recovery, apparent concentrations reported were typically low with no organisms found in a significant proportion of samples. After 2000 most analysis for both organisms used analysis based on immuno-magnetic separation (IMS) with IFA detection. Much improved recovery using such analysis (e.g., USEPA Method 1622-23, ISO15553) resulted in widespread adoption of 10 L sample volumes. Analysis of large-scale data sets collected using these conditions [9,10] has propagated the early misleading impression of widespread but intermittent presence of Cryptosporidium and Giardia in surface water.
A more quantitative approach to monitoring using a more efficient filter, applying rigorous positive and negative controls, produced data on Giardia [11] and Cryptosporidium [12] describing continuous presence of both organisms. The rigorous measurement of recovery efficiency and its application to calculating true concentrations provided clear ability to directly compare measurements between different sampling locations and different time periods. The importance of measuring recovery efficiency and its use to express measurements as concentration and not simply as numbers of organisms has been clearly established [13]. Analysis using the analysis suggestions of the earlier quantitative approach [11,12] of the large scale data sets produced under USEPA requirements, the Information Collection Rule (ICR) [14] and the Long Term 2 Enhanced Surface Water Treatment Rule [15] reinforced the interpretation that both organisms are universally distributed in surface water and are continuously present at concentrations near the limit of detection of available analytical technology [2,3].

3. Fundamentals of Monitoring & Data Analysis for Cryptosporidium & Giardia in Surface Water

The following sections are devoted to description of basic features of monitoring and data analysis distilled from work on this subject since the 1970’s. The focus is the typical public water system (PWS) obtaining its water from a surface source. Operation is continuous, 24 h per day, 365 days per year. Water quality at the point of abstraction is highly specific to the watershed and tied directly to the geographic region, its climate, the physiographic characteristics of the watershed and its natural and human activities. The more remote and undeveloped the watershed, typically the higher the water quality and intuitively the lower would be the concentrations of organisms such as Cryptosporidium and Giardia. Particulate constituents in the source are influenced by watershed characteristics with a significant dependence on precipitation and runoff, varying with discharge (flowrate) with seasonal patterns typical of the region. As particulate contaminants, oocysts and cysts would intuitively show evidence of similar effects. A PWS operating a water treatment facility depends on knowledge of the specific water quality characteristics of its source including the range and variation of key parameters, e.g., turbidity, over typical annual cycles. Accordingly, ability to manage the treatment system, and indeed if possible the watershed, for Cryptosporidium and Giardia, requires knowledge both of their level, specifically the concentration, and their typical variations.

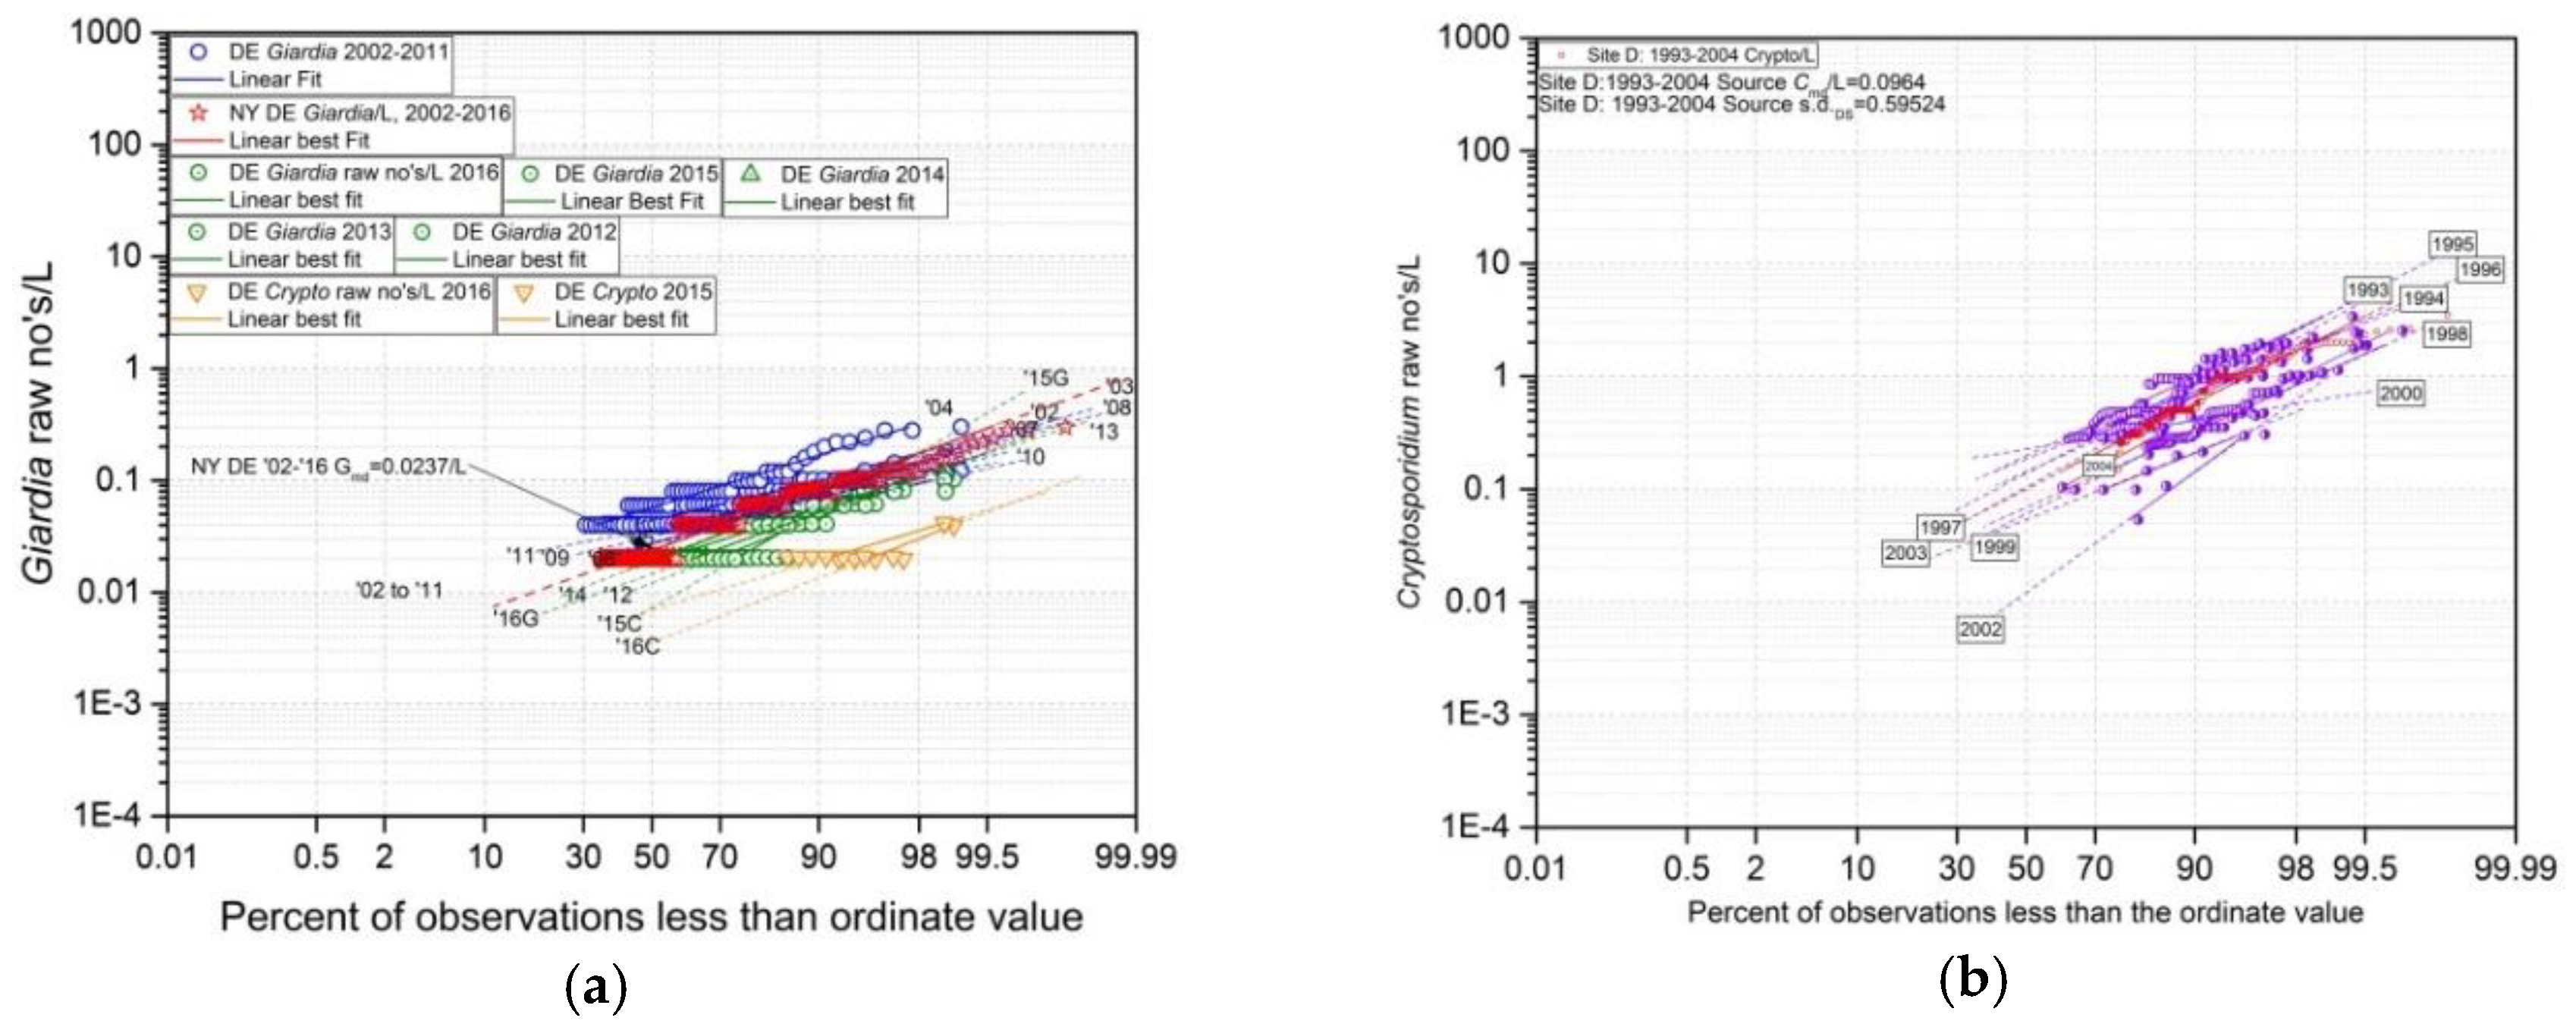
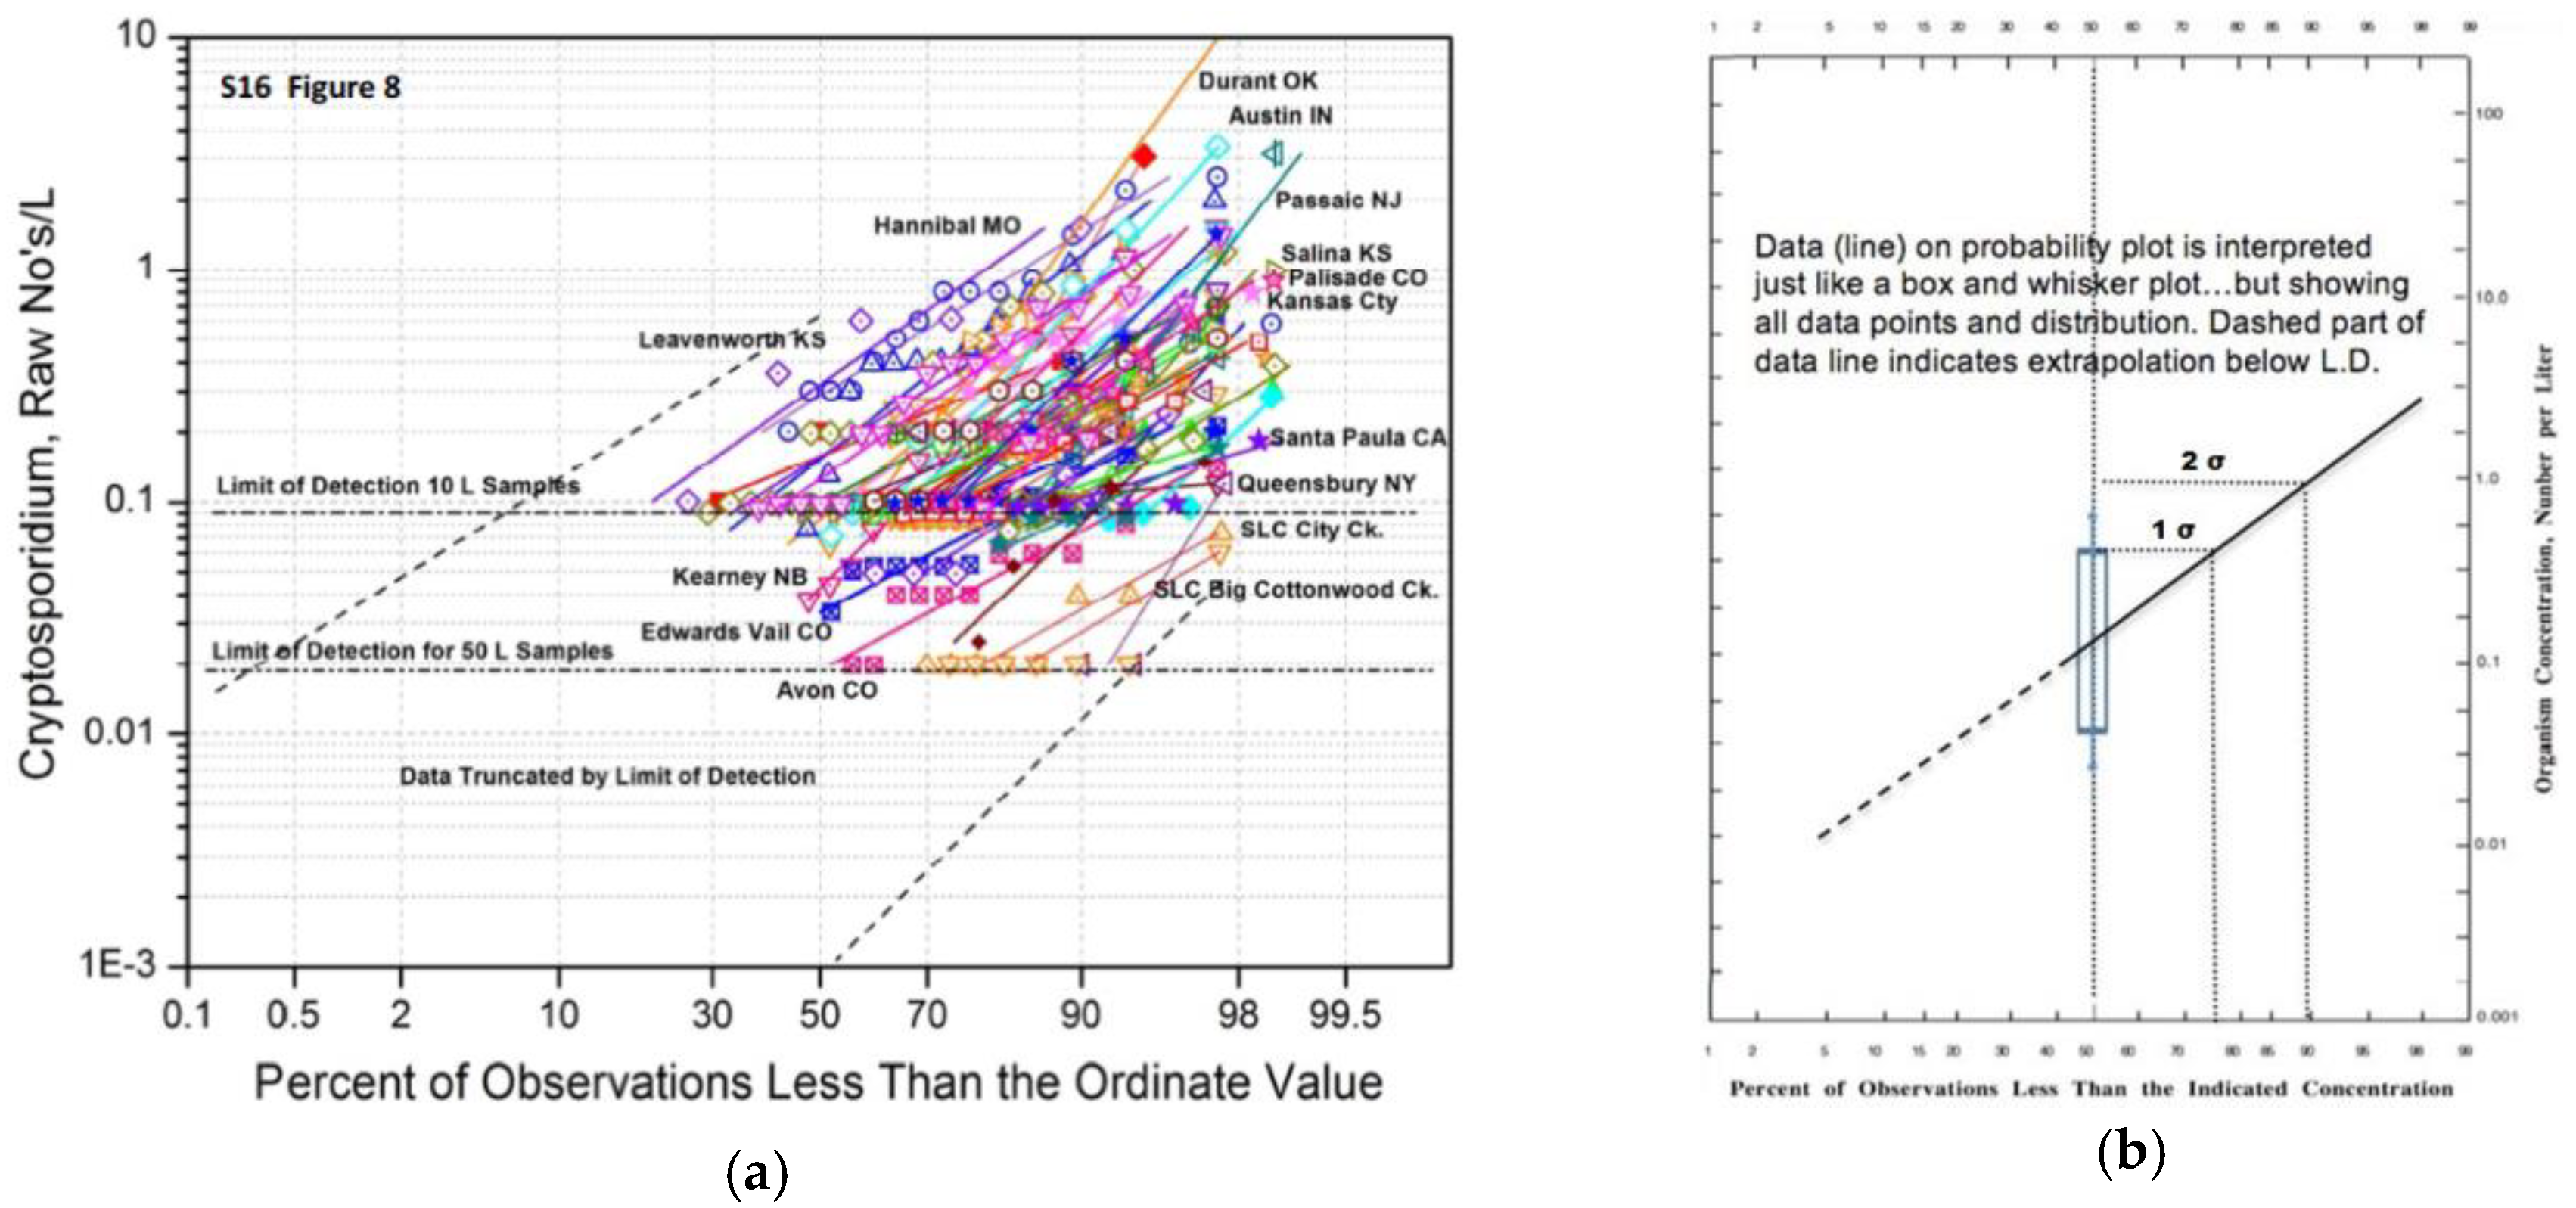
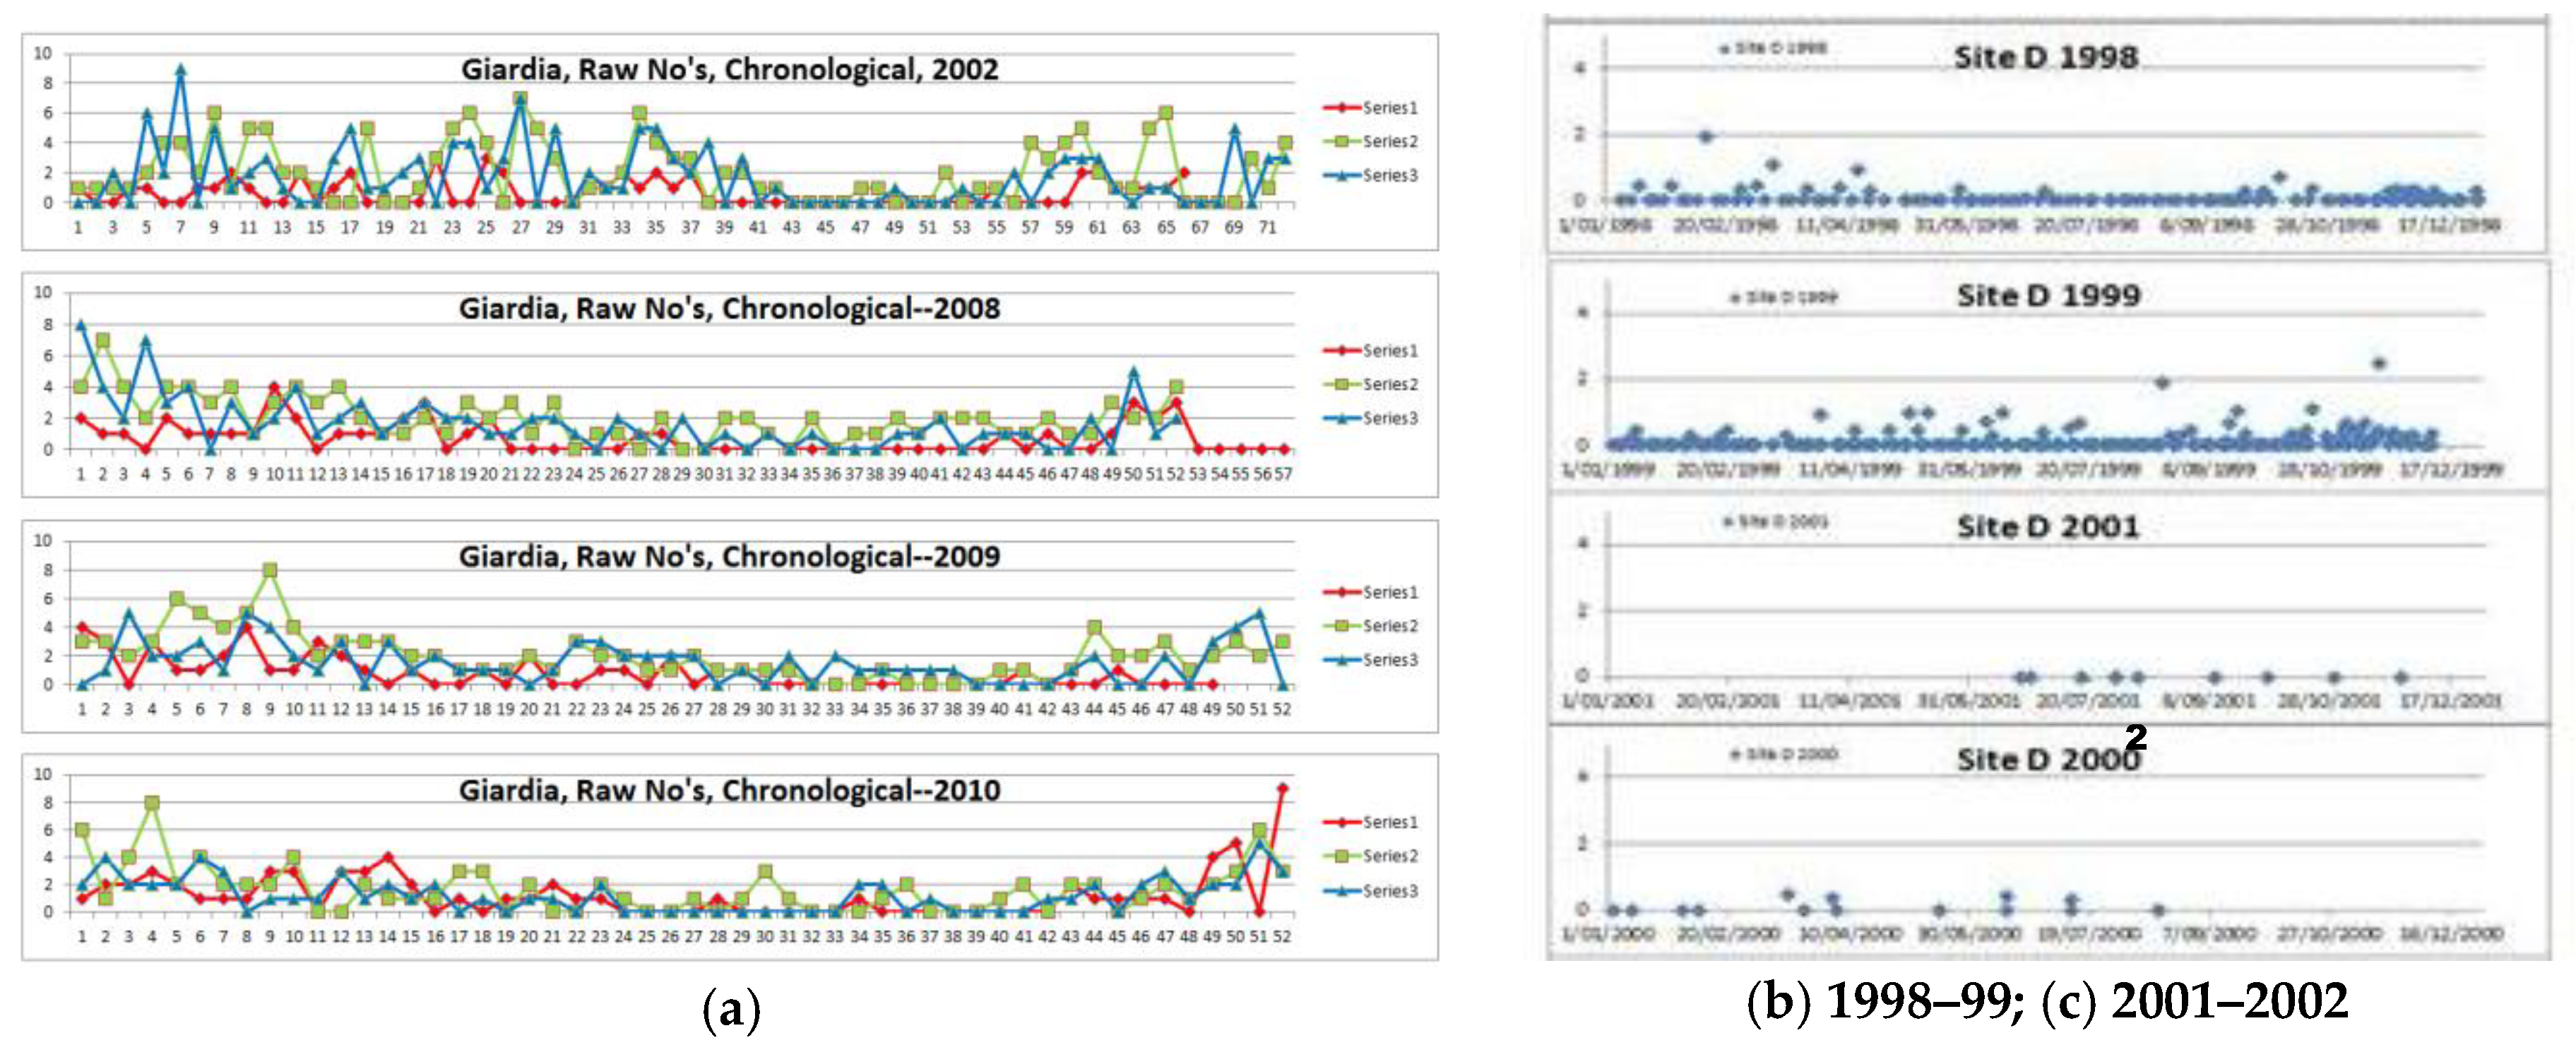
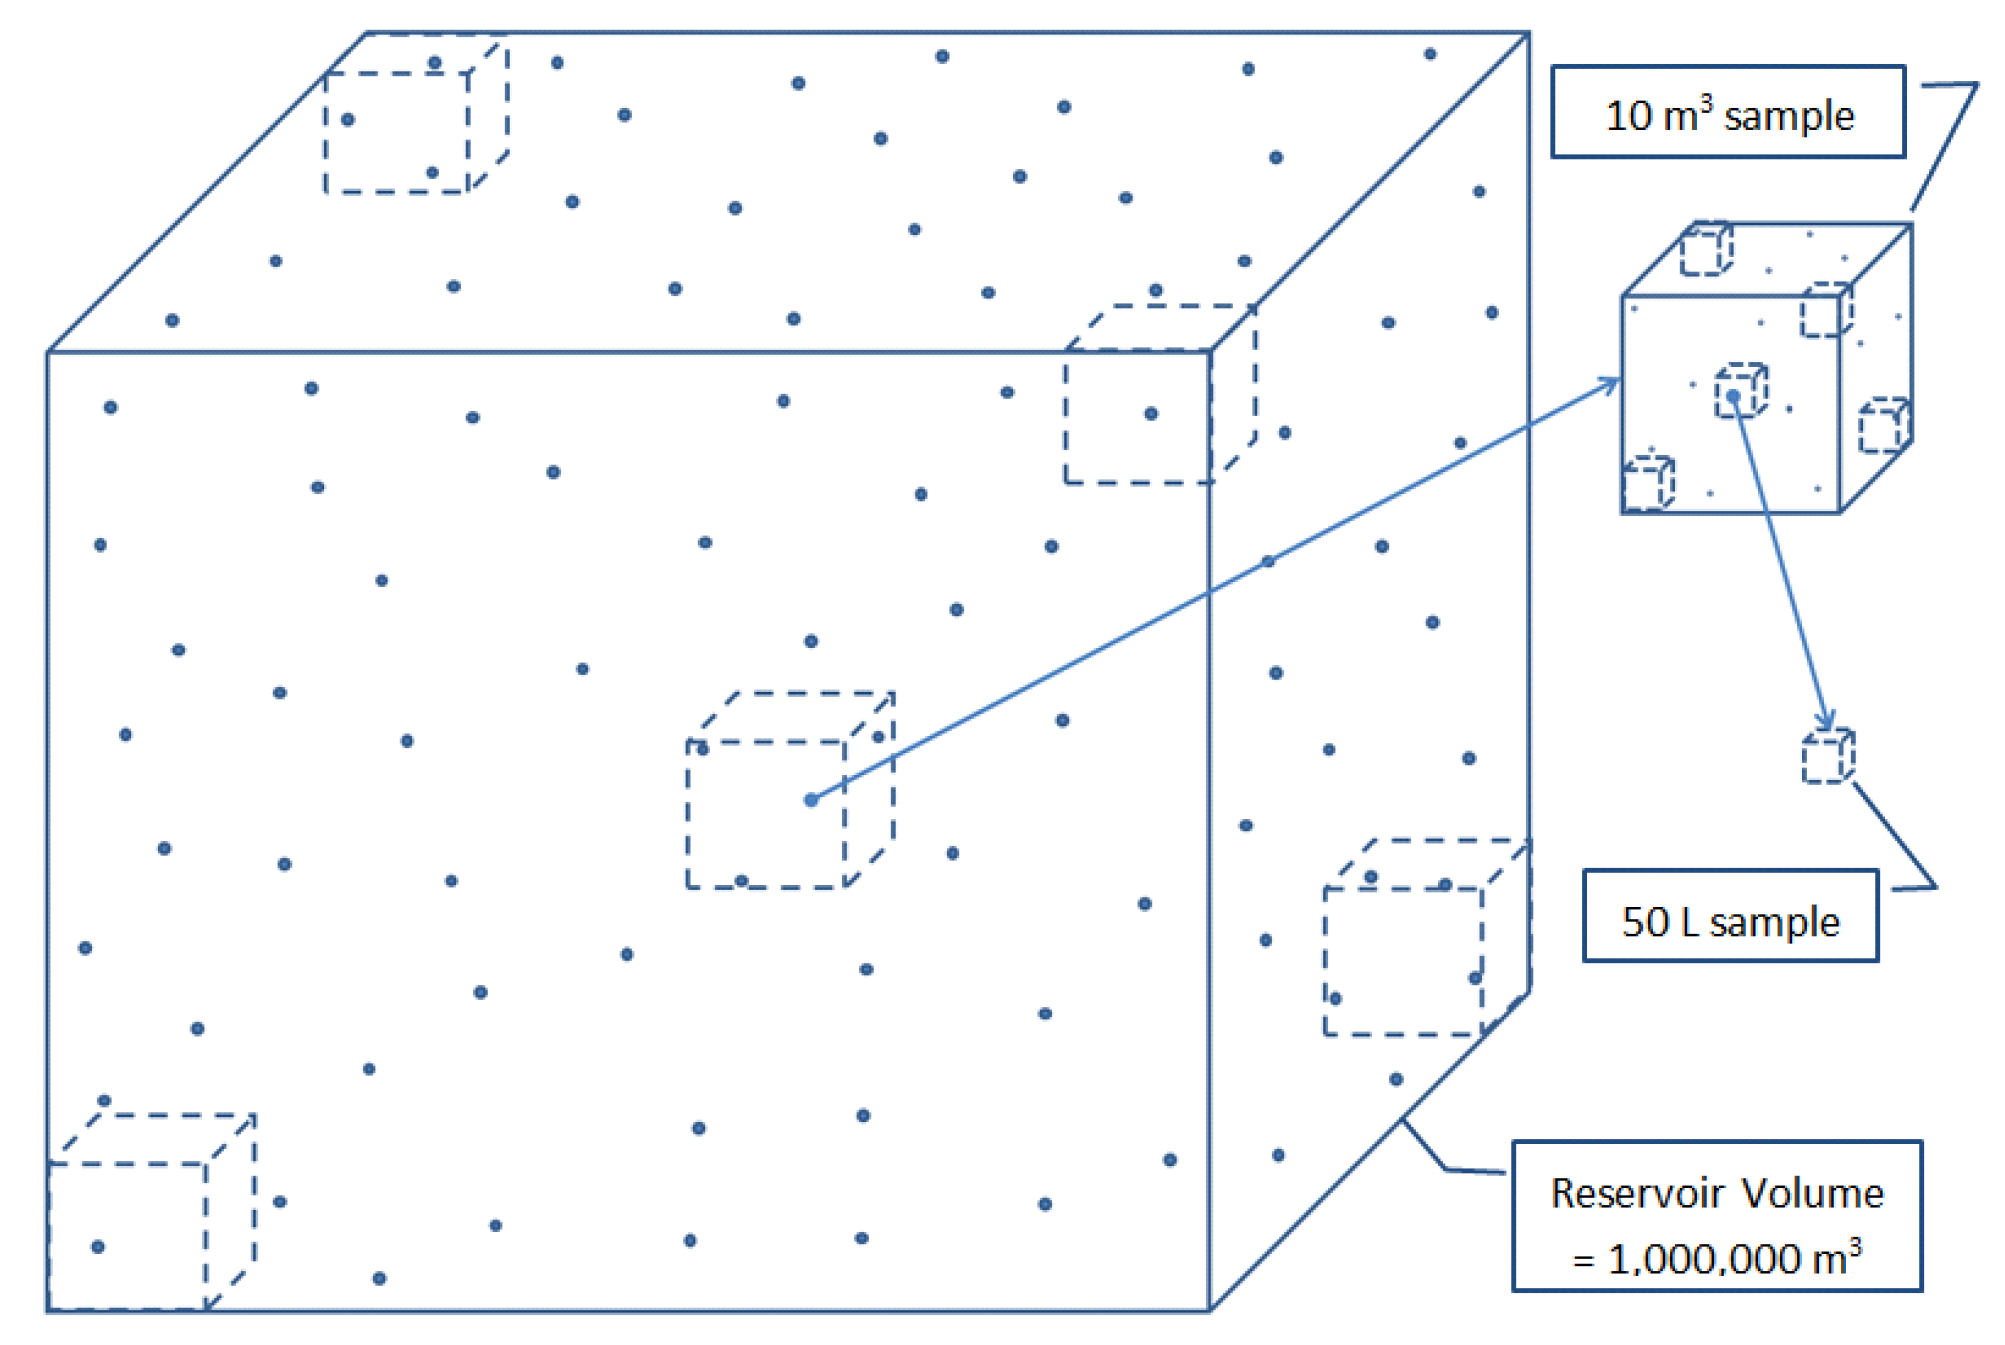
3.1. Observed Features of Cryptosporidium and Giardia in Water

In the limited reports covering annual cycles, e.g., 12 months or multiples, data on levels of Cryptosporidium and/or Giardia typically consist of one or more, rarely more than 4–6, positive values and the remaining zeros, Figure 1a,b. A record comprised of more frequent measurements, as for example biweekly or weekly, over multiple annual cycles, Figure 1b, may reveal typical periods of higher and lower levels that less frequent sampling, Figure 1c, fails to show. If the same type of data are expressed in terms of a cumulative frequency plot, Figure 2a,b, it becomes clear that a data set, dominated by zeros, is simply truncated by the limit of detection that depends only on the recovery efficiency of the analytical procedure and the sample volume. This phenomenon has been shown to result from sample volumes and ambient concentrations that are in the same range as the limit of detection dictating that organisms are distributed according to the skewed Poisson model [16] The Poisson distribution effect on sampling and resulting data is easily illustrated, Figure 3, but poorly understood. In any well-mixed surface water, e.g., reservoir, a large volume, e.g., 106 m3 (ca. 2.5 MG), at a low oocyst or cyst concentration, e.g., 10/m3 or 0.01/L, the total in the 106 m3 will be 107 organisms, and they will be normally (Gaussian) distributed through the reservoir taken as a whole. However, any 10 m3 subvolume will contain 100 organisms and if 50 L samples are collected at random from the 10 m3 volume half of the 50 L samples will not contain ANY organisms, because in 10 m3 are 200 × 50 L subvolumes but only 100 organisms. The Poisson distribution accurately describes this phenomenon and dictates that for true concentrations in the typical ambient range of 0.01 to 0.1/L, if sample volumes of only 10 L are analyzed and if the analytical recovery is 50%, the probability of not finding any organisms is >80% [16].
As illustrated by the typical data sets, Figure 1a,b, when expressed as cumulative frequency plots, Figure 2a,b, the proportion of zeros … analytical results below the limit of detection … truncates the distribution. In data resulting from analysis of 10 L samples, few locations will have ambient concentrations high enough to result in more than 3050% non-zero results, Figure 4a. Although only a proportion of data are non-zero, all data including the zeros are used in forming a cumulative frequency plot Figure 4b. A well-established characteristic of many kinds of environmental measurements are approximately log-normally distributed [17]. This type of presentation of many sets of Cryptosporidium and Giardia data has shown such data to be typically log-normally distributed e.g., Figure 2a,b and Figure 4a. Such data presented in this manner have two outstanding features: (1) the 50 percentile or median provides a measure of “typical” level of the organism at that sampling location for the period of time encompassed by the data; and (2) the slope of the distribution provides a measure of the degree of variability in the measured parameter (oocyst/L or cysts/L) at that location in that time period. Examination of comparable data from many locations, e.g., Figure 4a, gives an idea of the spectrum of both typical levels (medians) and degrees of variability (slopes) over a wide range of surface water locations across the USA [2]. Basic features of a cumulative frequency plot (CFP), Figure 4b, are analogous to the likely more familiar box and whisker plots often used in statistical presentation of this kind of data. An advantage of the CFP presentation is the visual comparison that it provides for data from different time periods e.g., Figure 2a,b, or from different locations, Figure 4a. The use of the entire data set, including zeros, emphasizes the importance of sample volume and recovery efficiency. The dashed line, Figure 4b, showing extrapolation of the data set below the limit of detection implies the continuous distribution of Cryptosporidium and of Giardia emphasizing that although an oocyst or cyst may not have been found in the sample analyzed, had larger samples been analyzed more of the distribution would have been revealed.
The consistency of Cryptosporidium and Giardia appearance in water at any sampling location is of interest in relation to needs for monitoring and in relation to planning and implementation of watershed and treatment system management and operation. Little data showing organism patterns over multiple annual cycles is available. Recently available but previously unpublished data, Figure 1a,b and Figure 2a–c, indicate the nature of observed patterns at locations on major water sysetems in the NE USA and in England. While the median levels and standard deviations vary from year to year they do so within a limited range characteristic of the specific sampling location and as influenced by annual differences in climate-related water quality conditions.

3.2. Monitoring Objectives and Deduced Principles

Monitoring for Cryptosporidium and Giardia concentrations in surface water is motivated by established public health risk assumed to be proportional to concentration. Whether monitoring is required by a regulatory agency or to satisfy the needs of an individual PWS for information essential to manage risk, objectives can be articulated and guiding principles may be described based on understanding derived from previous observations as described above.

3.2.1. Monitoring Objectives

Regulatory agency objectives are fundamentally the same as those of public water systems in relation to management of risk. The role of the agency is oversight and advisory, to understand the spectrum or risk faced by PWS in its area of responsibility, and to provide guidance in relation to management and operation consistent with objective information (data) needed to characterise risk at specific locations.
Public water suppliers require data on Cryptosporidium and Giardia useful to enable formulation of rational management of their watershed if such is possible, and to understand details of water quality and its variation for management and operation of their water treatment facilities.

3.2.2. Monitoring Principles

The underlying requirement of water quality monitoring is to produce information that is fit for purpose: data produced must be accurate and reproducible, supported by standardized procedure. Monitoring of Cryptosporidium and Giardia should conform to widely accepted protocol e.g., USEPA 1622/23, ISO15553. Interpretation of data produced by other procedures must take the effect of any differences in procedure into account.
Cryptosporidium and Giardia data sets consisting of only zeros tell very little and are dangerously misleading if interpreted as organism absence. But, zeros accompanied by at least 3–4 non-zero measurements are essential to establish key properties of the concentration distribution at the sampling location, median level and standard deviation quantifying the degree of variability;
Raw numbers without consistent measurement of recovery cannot be compared because of the significant variation in recovery efficiency at any specific location due to variations in water quality over the typical annual cycle, and due to the independent variation of recovery efficiency and organism levels that are characteristic of individual sample locations.
Ability to manage watersheds or treatment systems requires knowing all Cryptosporidium and all Giardia, not just selected types or the apparently viable fraction. Information on those features of the organisms present at any sampling location or time period may be useful for other purposes. However, the specific types of Cryptosporidium and Giardia that may be pathogenic to humans are not clearly established nor is their presence or viable proportion predictable. Accordingly, to manage sources in a catchment requires monitoring of all organisms regardless of type or condition as the critical parameter. Management of the water treatment facility likewise requires knowledge of the total concentration likely in the raw water. The key features of monitoring important to treatment system management are the typical level present in the source water and the degree of variation. More variable concentrations indicated by higher standard deviation imply greater risk a higher proportion of the year. Knowledge of the typical pattern of variation in concentrations over the annual cycle, as shown in Figure 1a,b, is equally important to treatment system management.
Finally, due to the relatively high cost of monitoring for Cryptosoporidium and Giardia must be efficient. Sample volumes must be sufficient to produce at least 3–4 non-zero results from 12 monthly samples. Additions to a basic monthly monitoring plan can be made to satisfy specific data objectives.

Author Contributions

Authors J.E.O. and P.K. have collaborated for more than 20 years in the development, investigation, and analysis of the information on which this manuscript is based. The writing is the product of a collaborative effort between both authors, coordinated and produced in the final version by author J.E.O. with final editing by author P.K.

Acknowledgments

No funding was received for the preparation of this manuscript.

Conflicts of Interest

The authors declare no conflict of interest.

References

  1. Efstratiou, A.; Ongerth, J.E.; Karanis, P. Waterborne transmission of protozoan parasites: Review of worldwide outbreaks—An update 2011–2016. Water Res. 2017, 110, 14–22. [Google Scholar] [CrossRef] [PubMed]
  2. Ongerth, J.E. The LT2 Cryptosporidium data... What do they tell us about Cryptosporidium in surface water in the USA? Environ. Sci. Technol. 2013, 47, 4029–4038. [Google Scholar] [CrossRef] [PubMed]
  3. Ongerth, J.E. ICR SS Protozoan Data Site-by-Site: A Picture of Cryptosporidium & Giardia in USA Surface Water. Environ. Sci. Technol. 2013, 47, 10145–10154. [Google Scholar] [CrossRef] [PubMed]
  4. Efstratiou, A.; Ongerth, J.; Karanis, P. Evolution of Monitoring for Giardia and Cryptosporidium in Water. Water Res. 2017, 123, 96–112. [Google Scholar] [CrossRef] [PubMed]
  5. Ongerth, J.E. Cryptosporidium and Giardia in Water: Reassessment of occurrence and significance. J. Environ. Eng. 2017, 143, 04016084. [Google Scholar] [CrossRef]
  6. Jakubowski, W.; Hoff, J.C. Waterborne Transmission of Giardiasis: Proceedings of a Symposium, September 18–20, 1978; Office of Research and Development, Environmental Research Center, USEPA: Cincinnati, OH, USA, 1979; EPA-600/9-79-001. [Google Scholar]
  7. Rose, J.B.; Gerba, C.P.; Jakubowski, W. Survey of potable water supplies for Cryptosporidium and Giardia. Environ. Sci. Technol. 1991, 25, 1393–1400. [Google Scholar] [CrossRef]
  8. LeChevallier, M.W.; Norton, W.D.; Lee, R.G. Occurrence of Giardia and Cryptosporidium spp. in surface water supplies. Appl. Environ. Microbiol. 1991, 57, 2610–2616. [Google Scholar] [CrossRef] [PubMed]
  9. USEPA. Occurrence and Exposure Assessment for the Final Long Term 2 Enhanced Surface Water Treatment Rule; Office of Water (4606-M), EPA 815-R-06-002: Washington, DC, USA, December 2005. [Google Scholar]
  10. Messner, M. LT2 Round 1 Cryptosporidium Occurrence Presentation. U.S. EPA. 2011. Available online: http://water.epa.gov/lawsregs/rulesregs/sdwa/lt2/upload/lt2round1crypto.pdf (accessed on 15 September 2015).
  11. Ongerth, J.E. Giardia cyst concentrations in river water. J. Am. Water Works Assoc. 1989, 81, 81–86. [Google Scholar] [CrossRef]
  12. Hansen, J.; Ongerth, J.E. Effects of time and watershed characteristics on the concentration of Cryptosporidium oocysts in river water. Appl. Environ. Microbiol. 1991, 57, 2790–2795. [Google Scholar] [CrossRef] [PubMed]
  13. Ongerth, J.E. The concentration of Cryptosporidium and Giardia in Water—The role and importance of Recovery Efficiency. Water Res. 2013, 47, 2479–2488. [Google Scholar] [CrossRef] [PubMed]
  14. USEPA. National Primary Drinking Water Regulation: Long Term 2 Surface Water Treatment Rule. 2006. Available online: https://www.federalregister.gov/articles/2006/01/05/06-4/national-primary-drinking-water-regulations-lo (accessed on 1 May 2006).
  15. USEPA. National Primary Drinking Water Regulation: Monitoring for Public Water Supplies; Final Rule. Fed. Regist.: Washington, DC, USA, 1996; Volume 61, pp. 24353–24388. [Google Scholar]
  16. Ongerth, J.E.; Saaed, F.M.A. Distribution of Cryptosporidium oocysts and Giardia cysts in water above and below the normal limit of detection. Parasitol. Res. 2013, 112, 467–471. [Google Scholar] [CrossRef] [PubMed]
  17. Chow, V.T. The log-probability law and its engineering applications. Proc. Am. Soc. Civ. Eng. 1954, 80, 80. [Google Scholar] [CrossRef]
Figure 1. Typical C&G monitoring data: (a) 4 separate 1 year records of weekly Giardia measurements in 50 L samples from 3-related reservoir sampling sites (b) Cryptosporidium measurements in 10 L river water samples, weekly in 1998–1999; and (c) monthly in 2001–2002.
Proceedings 02 00691 g001
Figure 2. Cumulative frequency plots of C&G monitoring data: (a) 9 yearly records of Cryptosporidium measurements in 10 L river water samples (see Figure 1b,c); and (b) Giardia measurements in 50 L reservoir water samples from monitoring 2002–2016.
Proceedings 02 00691 g002
Figure 3. Schematic illustration of the Poisson distribution of Cryptosporidium oocysts and Giardia cysts in surface water where ambient concentrations are near the analytical method limit of detection.
Proceedings 02 00691 g003
Figure 4. Cumulative frequency distribution illustrations: (a) Cryptosporidium oocysts in monthly surface water samples for PWS serving >10,000 pop. 150 of 1670 USA locations required by the USEPA [2]; and (b) basic features of a cumulative frequency plot of typically log-normally distributed data showing the two key features: (1) 50%ile or median level; and (2) slope…measure of the standard deviation.
Proceedings 02 00691 g004
Publisher’s Note: MDPI stays neutral with regard to jurisdictional claims in published maps and institutional affiliations.

