Abstract
Measurements of Cryptosporidium and Giardia in water have been compiled from over 50 references comprising data from over 20 countries throughout Europe from Scandinavia to the Mediterranean, from the Atlantic to the Urals. Data predominantly reported after 2000 and mostly by IMS-IFA based analysis clearly demonstrate the distribution of these waterborne pathogens across all parts of the continent. The presence of these organisms at readily detectable levels in surface water used for public water supply corresponds to epidemiological evidence describing the prevalence of cryptosporidiosis and of giardiasis in all countries of Europe. Where the extent of data from individual references has permitted, cumulative frequency analysis has been used to describe typical (median) concentrations and variability (standard deviation). These estimates are presented with accompanying data from elsewhere showing the relation of occurrence levels and degrees of variation as part of a global spectrum.
1. Introduction
There can be little doubt that the protozoan pathogens Cryptosporidium and Giardia are distributed in all surface waters throughout Europe and indeed globally. Recent published reports describe the presence of both organisms in significant proportions of samples analyzed whether from surface water sources, drinking water treatment facilities, or wastewater and treatment facilities. Published reports also document the occurrence of community-scale outbreaks (limited epidemics) of both cryptosporidiosis and of giardiasis in different European locations. Furthermore, European surveillance of communicable disease consistently describes the occurrence of significant numbers of verified cases of cryptosporidiosis and of giardiasis distributed across virtually all countries in and adjacent to Europe. The purpose of this effort is to describe essential features of Cryptosporidium and Giardia levels found in published reports in selected areas of Europe according to essentially randomly distributed investigations. An objective of this compilation is to examine the potential relation between epidemiological evidence, the well-established evidence of Cryptosporidium and Giardia source distribution, and their appearance in surface water. Potential value of this examination may be to highlight features of the presence and distribution that present clear risk of waterborne transmission and that should dictate features of monitoring essential to minimizing risk through effective management of watersheds and water treatment systems.
2. Representative Cryptosporidium and Giardia Observations in Europe
More than 50 reports describing the presence of Cryptosporidium and Giardia in water and wastewater media have been published in the last 20 years. Reports cover more than 20 countries across the length and breadth of Europe. Data have been extracted from representative reports showing the apparent levels and distribution throughout this geographic region, Table 1.

Table 1.
Reported Giardia and Cryptosporidium occurrence levels (cysts/L, oocysts/L) including sample origin, number of samples, percent positive reported range and averages, by country.
The data included, Table 1, are not exhaustive but were selected as illustrative of findings being reported in the literature. Many additional reports may be found for example describing findings of these organisms in various media, recreational water, sources of public water supply, treated water sampled at the tap, raw and treated wastewater (sewage), and in various locations. A significant feature of published reports is their reflection of where individual researchers find the interest and the financial support to conduct these specialized and demanding investigations. A corollary of this observation is that the geographical distribution of such investigations is not tied to these organisms’ actual distribution in the environment. Their actual distribution must be deduced from the scattering of investigations of occurrence in water that have been reported, along with knowledge of the sources, distribution, and fate of such organisms, and the expression of their transmission to the human population as evidenced in epidemiological data.
For those familiar with the literature summarized here, examination of the information presented in Table 1 will raise a number of questions regarding the comparability of the data from such a wide range of sources. Methods used including sampling and analysis covered the range of methods available at the time. Details of methods used were sometimes not clear. The basis of reporting findings varied but all numbers have been reduced to numbers (oocysts or cysts) per L. Only one of the reports included in the table was for wastewater alone (Norway). Although many of the other reports included data on wastewater, none of that data was used in compiling the table. Although some reports referred to recovery efficiency of the analytical method used, the data included here are exclusively only numbers of organism found per L of sample. It has been pointed out elsewhere [22] that comparison of raw numbers may lead to misinterpretation due to the importance of recovery efficiency to expression of concentration and that only by calculation of concentration taking recovery into account can data from different time periods and locations be compared directly.
Despite the range of shortcomings mentioned above, the data describe a clear pattern. There is no question that both Cryptosporidium and Giardia can be found in surface waters throughout Europe at levels that are measurable by skillful application of readily available methods.
3. Representative Cryptosporidium and Giardia Levels and Variation, European Examples
A relatively small number of published reports on Cryptosporidium and Giardia in European surface water include multiple samples over an extended time period permitting analysis to determine the level typical at that location, represented by the median, and the degree of variation provided by the standard deviation. The analysis procedure used here is formation of cumulative frequency distributions (CFD) from which the median and standard deviation can be readily deduced [23].
The four European Cryptosporidium and Giardia monitoring examples permitting cumulative frequency analysis include data from the UK, Figure 1a, from France, Figure 1b, from Italy, Figure 2a, and from Luxembourg, Figure 2b. The data comprising Figure 1a are highly unusual, summarized in Table 1 line 2 (Britain), including over 4000 Cryptosporidium measurements between the 8 locations over a period of more than 10 years [2]. Median concentrations range from 0.02/L to 0.17/L and with standard deviations (slope of the log normal lines of best fit) that are within a narrow range. The data comprising Figure 1b are from an investigation measuring both Cryptosporidium and Giardia in samples collected from 8 sites on the Seine and the Marne Rivers in the vicinity of Paris in 2005–7 [24]. These observations describe median levels in a similar range to those in the UK, although their degrees of variation from site to site was greater. The Cryptosporidium (circles) levels and variation were mostly lower and less variable than those of Giardia (diamonds).
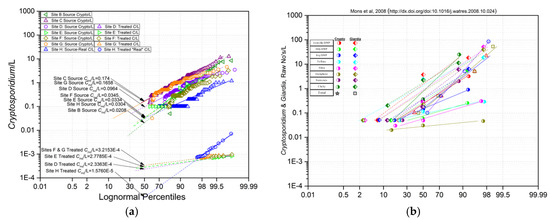
Figure 1.
Cumulative frequency distributions of (a) Cryptosporidium/L at 8 sites in Britain, 1993–2004 (unpublished, from [2]; (b) Cryptosporidium/L and Giardia/L at 12 locations in France in 2005 [24].
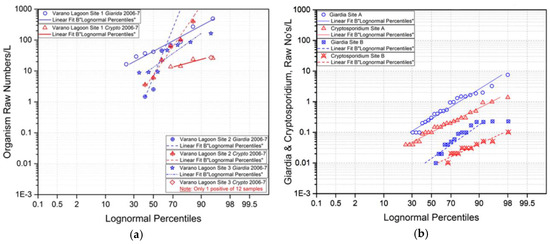
Figure 2.
Cumulative frequency distributions (a) Cryptosporidium/L and Giardia/L at 4 sites in Italy, 2006-2007 [10]; (b) Cryptosporidium/L and Giardia/L at 2 sites in Luxembourg in 2006–2007 [11].
The Cryptosporidium and Giardia monitoring examples from Italy, Figure 2a, and from Luxembourg, Figure 2b illustrate patterns different from those of the UK and France. The Italian example [10] describes levels of Cryptosporidium (red) and Giardia (blue) in significantly higher ranges than in previous examples. Sampling location 1 was of the final effluent from a local secondary sewage treatment facility, location 2 was at the entrance to a coastal receiving lagoon. Observed Giardia levels were typically higher than those of Cryptosporidium although the Cryptosporidium levels in the effluent showed significantly more variation.
The Cryptosporidium and Giardia observations in the Luxembourg example [11] describe levels at upper and middle sampling locations in a relatively long narrow recreational and water supply reservoir. From the CFDs, Figure 2b, typical Giardia levels were higher and somewhat more variable than Cryptosporidium at the respective sites, and the levels of both organisms were significantly lower at the downstream sampling location. Typical (median) levels of both organisms at these reservoir locations were lowest among the four examples.
The value of having concentration data collected at regular intervals e.g., monthly, over extended periods, e.g., annual cycles (12 months), lies in their description of characteristics using the CFD approach that are useful to a public water supply agency in planning and implementing both catchment management and treatment system management related to expected conditions. Sources having higher concentrations are intuitively at higher risk. Sources exhibiting higher variability experience a higher proportion of an annual cycle under higher risk water quality conditions [23].
A broader context for understanding the Cryptosporidium and Giardia occurrence characteristics, shown by the examples in Figure 1a,b and Figure 2a,b, is provided by a compilation of data from sources in the USA Figure 3. With the exception of the sewage-affected sites in Italy, Figure 2b, the European observations all fall within the middle range of the occurrence spectrum reported from elsewhere. While the lowest median levels among the European sites were at the Luxembourg reservoir middle sampling location, ca. 0.01/L, Figure 2b, median levels at the NE and NW USA sites, Figure 3, were significantly lower, and with low variability.
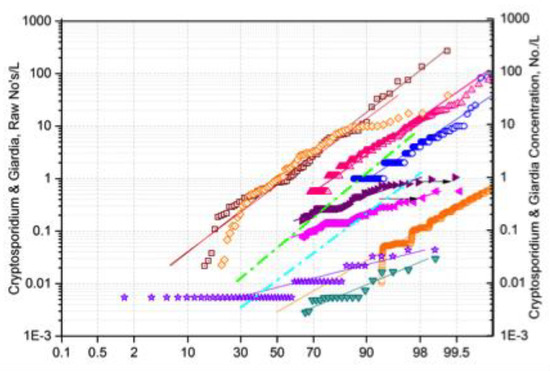
Figure 3.
Cumulative probability distributions of Cryptosporidium (C) and Giardia (G) after Figure 8 [23], in descending order: C&G-66 USA sites, 1990; G-34 USA sites, 2001; C-34 USA sites, 2001; G-1yr USA site, 1992-3; C-1yr USA site 1992-3; C-2yr 1670 USA sites, 2010-12; G-1yr NE USA site, 2003; C-1yr NW USA site, 1996.
4. Epidemiology of Cryptosporidium and Giardia in Europe
The appearance of Cryptosporidium and Giardia related illness in the human population is described by epidemiological statistics compiled by European Center for Disease Prevention and Control (ECDC) publishing regular reports through its publication Eurosurveillance. The most recent reports on cryptosporidiosis [25] and on giardiasis [26] show broad distribution of confirmed cases of both illnesses across Europe, Figure 4a,b. Some important features to note on examination of Figure 4a,b are first of all; compiled data are from only about half of the countries in Europe. Important exceptions include France, Spain, Portugal, Italy, Greece, Ukraine, Russia, Netherlands, and Denmark. Never the less, distribution of illness due to these two organisms throughout Europe is clear. Furthermore, a recent review focused on Cryptosporidium and Giardia in Eastern Europe [27] describes the distribution of both organisms in the animal and human populations throughout this region.
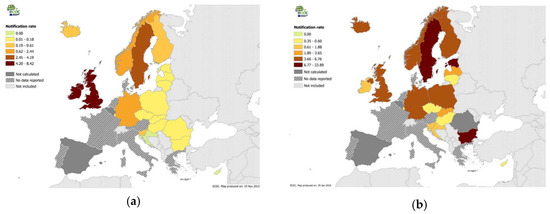
Figure 4.
ECDC 2014 data on the distribution in Europe of reported confirmed cases per 100,000 population of (a) cryptosporidiosis [25]; (b) giardiasis [26].
Although the distributions of cryptosporidiosis and giardiasis across Europe shown, Figure 4a,b, are recent, ECDC incidence rate data compared for the last 5-years shows little trend suggesting relatively consistent occurrence of these illnesses in the European population, Figure 5a,b. An outstanding feature of these data is the consistently greater incidence of giardiasis; more than double that of cryptosporidiosis. This feature alone provides cause for reconsidering the relative importance of these pathogens.
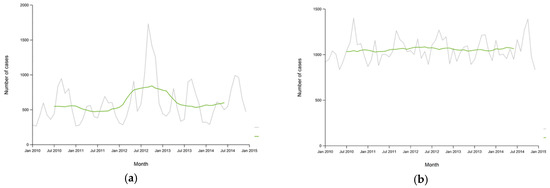
Figure 5.
ECDC 2010–2015 European monthly total reported confirmed cases per 100,000 population with 12-month moving average (green) of (a) cryptosporidiosis [25]; (b) giardiasis [26].
5. Discussion
The general presence of Cryptosporidium and of Giardia in water must be considered of long-standing. Indeed, Giardia is among the earliest of human pathogens described in scientific literature based on its identification in his own stool by van Leeuwenhoek in the 17th century and confirmed as a human pathogen by work associated with severe GI illness in soldiers returning to England from Egypt and Flanders during WWI [28]. The relatively recent (1960’s–1980’s) recognition of both organisms as waterborne pathogens capable of causing community-scale “outbreaks” is due to the development of suitable technology for finding them in the environment [29]. A recent review of waterborne outbreaks due to Cryptosporidium and Giardia [30] makes the point that the distribution of outbreak reports is more a reflection of the existence of surveillance systems and devotion of resources to reporting rather than to the true distribution of these organisms in water supplies and the occurrence of illness due to their transmission through public water supplies.
The general picture of the geographic distribution of Cryptosporidium and Giardia as waterborne pathogens that emerges is that both organisms are clearly present in surface water everywhere, globally. If it should be assumed that they are present, and at levels related to well-understood indicators reflecting the nature and intensity of watershed uses, the question remains how best to provide public health protection. Further investigations will provide benefit to the extent that they are directed to satisfying public water supply agencies’ needs for information useful to the management of watersheds, where such may be possible, and to the well-informed management of water treatment facilities [23]. Ample reports in the literature describe the capabilities of well-designed and well-operated water treatment facilities to effectively control both Cryptosporidium and Giardia. Technology and understanding are available to manage risk associated with their waterborne transmission. Achieving uniformly effective control across Europe will continue to depend on ability to provide for minimum standards regardless of financial limitations. The degree of public health protection will always bear a direct relation to the economic resources of the local population…and to the wisdom of governments in allocating resources.
Author Contributions
Authors J.E.O., J.P., and P.K. have collaborated in the development, and analysis of the information on which this manuscript is based. The concept is the product of continuing effort between the authors, coordinated and produced in the final version by author J.E.O. with final editing and approval by authors J.P. and P.K. All authors have read and agreed to the published version of the manuscript.
Acknowledgments
No funding was received for the preparation of this manuscript.
Conflicts of Interest
The authors declare no conflict of interest.
References
- Hassl, A.G.; Benyr, G.; Sommer, R. Occurrence of Cryptosporidium oocysts in fecal and water samples in Austria. Acta Trop. 2001, 80, 145–149. [Google Scholar] [CrossRef]
- Smeets, P.W.M.H.; van Dijk, J.C.; Stanfield, G.; Rietveld, L.C.; Medema, J. Use of Cryptosporidium monitoring for QMRA of Cryptosporidium in Drinking Water. J. Water Health 2007, 5 (Suppl. 1), 107–118. [Google Scholar] [CrossRef]
- Karanis, P.; Sotiriadou, I.; Kartashev, V.; Kourenti, C.; Thvetkova, N.; Stojanova, K. Occurrence of Giardia and Cryptosporidium in water supplies of Russia and Bulgaria. Environ. Res. 2006, 102, 260–271. [Google Scholar] [CrossRef]
- Dolejs, P.; Ditrich, O.; Machula, T.; Kalousková, N.; Puzová, G. Monitoring of Cryptosporidium & Giardia in Czech drinking water sources. Schriftenr. Ver. Wasser Boden Lufthyg. 2000, 105, 147–151. [Google Scholar]
- Horman, A.; Rimhanen-Finne, R.; Maunula, L.; von Bonsdorff, C.-H.; Torvela, N.; Heikinheimo, A.; Hanninen, M.-L. Giardia, Cryptosporidium and indicator organisms in Surface Water in SW Finland, 2000–2001. Appl. Environ. Microbiol. 2004, 70, 87–95. [Google Scholar] [CrossRef]
- Coupe, S.; Delabre, K.; Pouillot, R.; Houdart, S.; Santillana-Hayat, M.; Derouin, F. Cryptosporidium, Giardia & Enterocytozoon bieneusi in surface water, & recreational areas: A one-year study. FEMS Immunol. Med. Microbiol. 2006, 47, 351–359. [Google Scholar] [CrossRef]
- Gallas-Lindemann, C.; Sotiriadou, I.; Plutzer, J.; Karanis, P. Cryptosporidium and Giardia in wastewater and the surface, drinking and ground waters in the Lower Rhine, Germany. Epidemiol. Infect. 2013, 141, 9–21. [Google Scholar] [CrossRef]
- Karanis, P.; Chronis, I.; Zakas, G.; Kourenti, C.; Sotiriadou, I.; Papadopoulou, C. Preliminary survey of microbiological pollution of major rivers in Northern Greece. Acta Hydrochim. Hydrobiol. 2005, 33, 346–354. [Google Scholar] [CrossRef]
- Plutzer, J.; Tako, M.H.; Marialingeti, K.; Torokne, A.; Karanis, P. Giardia and Cryptosporidium in Hungarian raw, surface and sewage water samples by IFT, PCR and sequence analysis. Int. J. Hyg. Environ. Health 2008, 211, 524–533. [Google Scholar] [CrossRef]
- Giangaspero, A.; Cirillo, R.; Lacasella, V.; Lonigro, A.; Marangi, M.; Cavallo, P.; Berrilli, F.; DiCave, D.; Brandonisio, O. Giardia and Cryptosporidium in flowing water and harvested shellfish in a Lagoon in Southern Italy. Parasit. Int. 2009, 58, 12–27. [Google Scholar] [CrossRef]
- Helmi, K.; Skraber, S.; Burnet, J.-B.; Leblanc, L.; Hoffmann, L.; Cauchie, H.-M. Two-year monitoring of Cryptosporidium parvum and Giardia lamblia occurrence in a recreational and drinking. Environ. Monit. Assess. 2011, 179, 163–175. [Google Scholar] [CrossRef]
- Schets, F.M.; van Wijnen, J.H.; Schijven, J.F.; Schoon, H.; de Roda Hausman, A.M. Pathogens in Surface Waters in Amsterdam, Netherlands, and the Potential Health Risk Associated with Exposure to Cryptosporidium and Giardia in These Waters. Appl. Environ. Microbiol. 2008, 74, 2069–2078. [Google Scholar] [CrossRef]
- Robertson, L.J.; Hermansen, L.; Gjerde, B.K. Occurrence of Cryptosporidium Oocysts and Giardia Cysts in Sewage in Norway. Appl. Environ. Microbiol. 2005, 72, 5297–5303. [Google Scholar] [CrossRef]
- Matuszewska, R.; Szczotko, M.; Bartosik, M.; Krogulskam, B. Water Treatment Effectiveness in Podkarpackie Region by Giardia sp, Cryptosporidium, & Clostridia Occurrence. Ochr. Srodowiska 2013, 35, 49–52. [Google Scholar]
- Julio, C.; Sa, C.; Ferreira, I.; Martins, S.; Oleastro, M.; Angelo, H.; Guerreiro, J.; Tenreiro, R. Waterborne transmission of Giardia and Cryptosporidium at river beaches in Southern Europe (Portugal). J. Water Health 2012, 10, 484–496. [Google Scholar] [CrossRef]
- Imre, K.; Sala, C.C.; Morar, A.; Ilie, M.S.; Plutzer, J.; Imre, M.; Hora, F.S.; Badea, C.; Darabus, G. Prevalence of Cryptosporidium & Giardia in the main rivers of Western Romania & Public Health Significance. J. Biotechnol. 2016, 231, S84–S109. [Google Scholar] [CrossRef]
- Egorov, A.; Paulauskis, J.; Petrova, L.; Tereschenko, A.; Drizhd, N.; Ford, T. Contamination of water supplies with Cryptosporidium & Giardia, and diarrheal illness in selected Russian cities. Int. J. Hyg. Environ. Health 2002, 205, 281–289. [Google Scholar]
- Smith, H.V.; Grimason, A.; Benton, C.; Parker, J. Cryptosporidium oocysts in Scottish waters. Water Sci. Technol. 1991, 24, 169–172. [Google Scholar] [CrossRef]
- Castro-Hermida, J.A.; Garcia-Prasedo, I.; Almeida, A.; Gonzalez-Warleta, M.; Correia Da Costa, J.M.; Mezo, M. Cryptosporidium spp. and Giardia duodenalis in two areas of Galicia (NW Spain). Sci. Total Environ. 2008, 405, 45–53. [Google Scholar] [CrossRef]
- Widerström, M.; Schonning, C.; Lilja, M.; Lebbad, M.; Ljung, T.; Allestam, G.; Ferm, M.; Bjorkholm, B.; Hansen, A.; Hiltula, J.; et al. Large outbreak of Cryptosporidium infection by public water supply, Sweden. Emerg. Infect Dis. 2014, 20, 581–589. [Google Scholar] [CrossRef]
- Ward, P.I.; Deplazes, P.; Regli, W.; Rinder, H. Detection of eight Cryptosporidium genotypes in surface and waste waters in Europe. Parasitology 2002, 129, 359–368. [Google Scholar] [CrossRef]
- Ongerth, J.E. The concentration of Cryptosporidium and Giardia in Water—The role and importance of Recovery Efficiency. Water Res. 2013, 47, 2479–2488. [Google Scholar] [CrossRef]
- Ongerth, J.E. Cryptosporidium and Giardia in Water: Reassessment of occurrence and significance. J. Environ. Eng. 2017, 143, 04016084. [Google Scholar] [CrossRef]
- Mons, C.; Dumetre, A.; Gosselin, S.; Galliot, C.; Moulin, L. Monitoring Cryptosporidium and Giardia River Contamination in Paris Area. Water Res. 2009, 43, 211–217. [Google Scholar] [CrossRef]
- ECDC. Annual Epidemiological Report 2015. Cryptosporidiosis; ECDC: Stockholm, Sweden, 2016. [Google Scholar]
- ECDC. Annual Epidemiological Report 2015. Giaridasis; ECDC: Stockholm, Sweden, 2016. [Google Scholar]
- Plutzer, J.; Lassen, B.; Jokelainen, P.; Djurkovic-Djakovic, O.; Kucsera, I.; Dorbek-Kolin, E.; Soba, B.; Sreter, T.; Imre, K.; Omeragic, J.; et al. Review of Cryptosporidium and Giardia in the eastern part of Europe, 2016. Eurosurveillance 2018, 23. [Google Scholar] [CrossRef]
- Fantham, H.B.; Porter, A. Pathogenicity of Giardia (Lamblia) Intestinalis to men and to experimental animals. Br. Med. J. 1916, 2, 139–140. [Google Scholar] [CrossRef][Green Version]
- Efstratiou, A.; Ongerth, J.E.; Karanis, P. Evolution of Monitoring for Giardia and Cryptosporidium in Water. Water Res. 2017, 123, 96–112. [Google Scholar] [CrossRef]
- Efstratiou, A.; Ongerth, J.E.; Karanis, P. Waterborne transmission of protozoan parasites: Review of worldwide outbreaks—An update 2011–2016. Water Res. 2017, 110, 1–9. [Google Scholar] [CrossRef]
Publisher’s Note: MDPI stays neutral with regard to jurisdictional claims in published maps and institutional affiliations. |
© 2018 by the authors. Licensee MDPI, Basel, Switzerland. This article is an open access article distributed under the terms and conditions of the Creative Commons Attribution (CC BY) license (https://creativecommons.org/licenses/by/4.0/).