Abstract
South Africa is acknowledged to be not particularly endowed with the best hydropower conditions as it might be elsewhere in Africa and the rest of the world, however, large quantities of raw and potable water are conveyed daily under either pressurized or gravity conditions over large distances and elevations. There exists conduit hydropower generation potential in the water supply and distribution systems belonging to municipalities, water supply utilities and mines. Bloemwater, a water utility, constructed a stand-alone turbine, based on the available pressure and flow which generates a constant output ranging between 55 and 96 kW and when sufficient, supplies the head-office. Initially a manual changeover was utilized to switch between the hydropower and the local electricity supplier when the hydropower was insufficient to meet the demand i.e. switching of the full load from the one source to the other. To maximize the utilization of the hydropower, an automatic change over panel was developed to deal with the variable electricity demand from the office. The office building’s electrical distribution was divided into different distribution boards to allow each sector to be supplied and switched individually with 6, PLC controlled, motorized change-over switches. The PLC constantly evaluates and subsequently executes switching actions so that Bloemwater can utilize the maximum renewable hydropower, but also limits power interruptions to a minimum because of these switching actions. This technical paper describes the development of this conduit hydropower plant by evaluating the interrelationship of water supply, electricity demand and operating cycles, providing Bloemwater with the optimum solution with increased resiliency and sustainability.
1. Introduction
South Africa (SA), the country with the second largest installed hydropower capacity in Africa, produces less than 5% of its total electricity generating capacity from hydropower. SA is acknowledged to be not particularly endowed with the best hydropower conditions as it might be elsewhere in Africa and the rest of the world, however, large quantities of raw and potable water are conveyed daily under either pressurized or gravity conditions over large distances and elevations.
Various studies in SA have highlighted the conduit hydropower generation potential in the water supply and distribution systems belonging to municipalities, water supply utilities and mines. Most of these water supply/distribution systems could be equipped with turbines or pumps as turbines, supplementing and reducing the requirements for pressure control valves and generating electricity that may be used onsite, supplied to the national electricity grid or feeding an isolated electricity demand cluster. A number of water authorities throughout the world have realized the potential of conduit hydropower and implemented generating schemes [1,2,3,4].
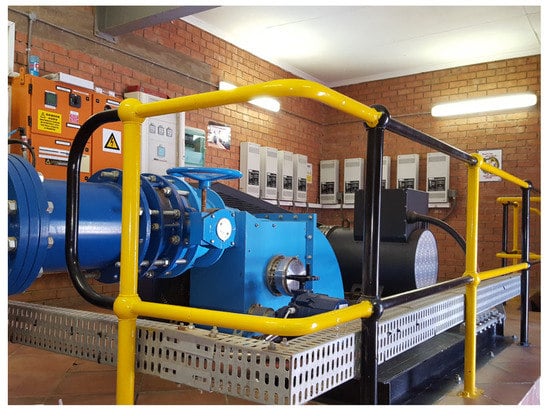
In 2015 the Bloemwater Conduit Hydropower Plant, Figure 1, at Brandkop Reservoir was officially launched. This plant utilizes the Caledon–Bloemfontein potable water supply system to generate up to 96 kW clean, renewable energy [5,6]. The recovered energy used onsite helps to power the operations of the Bloemwater Water Utility’s head office.

Figure 1.
Bloemwater Conduit Hydropower plant.
The development of this conduit hydropower plant has evolved since its launch by evaluating the interrelationship of water supply, electricity demand and operating cycles, providing Bloemwater with the optimum solution with increased resiliency and sustainability.
2. Water Supply to Bloemfontein
The Caledon–Bloemfontein potable water supply system was commissioned in the late 1960’s, operated and owned by the Department of Water and Sanitation. Potable water is supplied via the Caledon/Bloemfontein Pipeline from the Welbedacht Dam in the Caledon River to Bloemfontein (see Figure 2).

Figure 2.
Schematic layout of the Caledon-Bloemfontein Pipeline.
The treated water is pumped with a high lift pump station, 6.7 km to the De Hoek reservoir (22.7 Ml). From here it gravitates via a 50 year old, 1 170 mm Ø pre-stressed concrete gravity mains 47 km to the Uitkijk break water reservoir (9.1 Ml) and a further 58.8 km to the Brandkop Reservoir (136 Ml).
The two segments of the Caledon-Bloemfontein gravity pipeline are controlled at the downstream Uitkijk- and Brandkop Reservoirs respectively by means of pressure control valve stations. In order to determine the energy potential at the inlets into the two reservoirs (Uitkijk and Brandkop) the pipelines were hydraulically assessed. This required field measurements to determine the friction factors as well as surge analyses to determine the impact of the planned installation of hydro turbines on the integrity of the pipeline system. The maximum flow rate in this bulk supply line is ±1.45 m³/s although on average it operates at ±1.0 m³/s and this is ±70% of Bloemfontein’s water demand. These tests indicated that there is approximately 350 to 400 kW available at each of these sites. Bloemwater decided to initially develop a hydropower plant with sufficient capacity to meet the electricity demand of their head office which is situated at the Brandkop Reservoir.
The potable water supply to the City of Bloemfontein via the Brandkop Reservoir is controlled by means of a set of five pressure reducing valves (PRV). These are all opened and closed based on the water level in the reservoir and the hydropower plant acts as a sixth pressure reducing device. To sustain a safe water level of the Brandkop reservoir the operators at the Welbedacht Water Treatment Plant (WWTP), 110 km away also have control over the opening and closing of the PRVs to fill the reservoir. Opening or closing of a PRV changes the flow and subsequently the residual pressure available at the end of the pipeline.
3. Supply from the Turbine
In South Africa the regulation and legislation does not allow for the connecting of an energy generation plant (hydro, solar, biomass etc.) onto the national electricity grid and therefore the generated electricity can only be utilized onsite. The conduit hydropower potential at the Brandkop Reservoir site was greater than the electricity demand required onsite and thus it was decided to construct a 96 kW crossflow turbine installation based on the available budget and the electricity requirements for the site.
There are alternative ways to optimize the turbine installation [7] although here it was decided to select a turbine which will generate a constant output based on the prevailing pressure and flow i.e. not controlled by the demand. The stand-alone turbine, generates a constant output ranging between 55 and 96 kW and when sufficient, supplies the head-office. The pipeline system operates between 0.65 and 1.45 m3/s depending on the Brandkop Reservoir level as well as a small number of off-takes along the pipeline route. The design of the turbine was based on utilizing approximately one third of the average demand and its corresponding pressure i.e., 0.35 m3/s at 40 m pressure head.
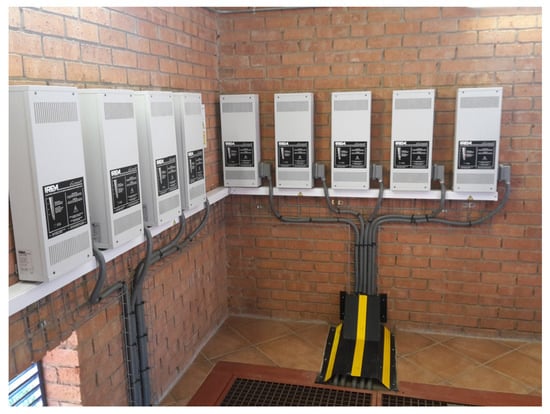
A Banki turbine with automatic flow regulation and a three-phase synchronous self-exciting, brushless generator, 400 Volt at 50 Hz was selected. A set of electronic regulators, sufficient to take the full generating load, essential for dissipation of energy was installed (Figure 3). The regulators keeps the voltage and frequency stable, as the absorption of the energy produced by the turbine-generator group remains constant. The electric control board pro-vides the electric operation parameters (meters, alarms and protective-devices) of the plant.

Figure 3.
Electronic regulating system (9 × RMP 12,000/B with total capacity of 108 kW).
The Bloemwater head office had two potential sources of electricity. The first was from the local electricity service provider, Centlec, and the second was from a backup diesel generator in case of load shedding. Since completion the hydropower plant provided a third electricity source. Initially a manual changeover was utilized to switch between the hydropower and the local electricity supplier or the backup diesel generator when the hydropower was insufficient to meet the demand i.e. switching of the full load from the one source to the other.
4. Electricity Demand of the Office Building
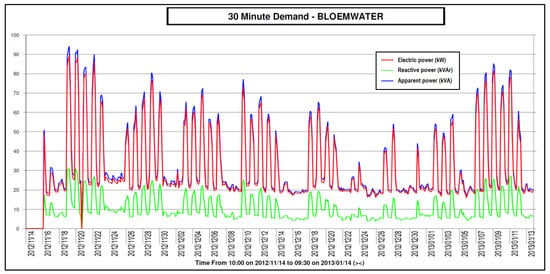
During the design stage of the hydropower plant in 2012/2013 the electricity consumption at Bloemwater’s head office was recorded as shown in Figure 4 which provided some useful information regarding the electricity consumption and patterns.

Figure 4.
Typical energy consumption data of Bloemwater’s head office (14 November 2012 to 14 January 2013).
- (1)
- The 5 working days of the week are clearly visible;
- (2)
- There is a constant base load of approximately 20 kW at the site. This is a constant demand as was visible throughout the recorded period (afterhours and weekends);
- (3)
- The couple of days in the December holiday around Christmas the demand was significantly lower as to be expected; and
- (4)
- The highest recorded active demand was 89.2 kW on 15:00 on 19 November 2012.
The weekly averaged kilovolt-amperes values were between 50 and 60 kVA. This however did include the December holiday period where there were a number of low demands. The demand frequency was determined and it indicates that only 5% of the time the demand is greater than 65 kW. It also indicated that there is a high base load of approximately 20 kW.
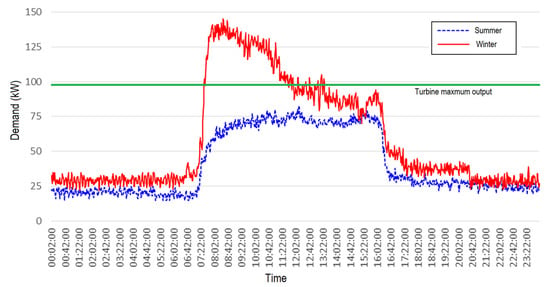
Since its initial design in 2012 and its current operation in 2017, the electricity demand on site has increased significantly. This increase in the average electricity demand is due to the expansion of Bloemwater (offices, personnel and equipment) during the past 5 years as well as increases in the peak demands especially on extreme cold winter days, as shown in Figure 5. When the office demand exceeded the output from the turbine the office experienced voltage drops and it was required for Bloemwater to switch to Centlec and then later, usually by the end of the day, switch back to the hydropower supply. This is shown in a schematic layout, Figure 6, of the electricity supply system. This resulted in the hydropower plant not being utilized and not contributing anything to the electricity demand of the offices for the specific high demand period.

Figure 5.
Typical electricity demand pattern (winter and summer day).

Figure 6.
Schematic layout of originally designed electricity supply system.
The office buildings electrical distribution is divided in 6 distribution boards. The main incomer circuit breaker is feeding 3 distribution boards in the building. Those 3 distribution boards feed each a sub distribution board. With the variables in supply from the turbine and the demand from the office it became difficult to:
- (1)
- Protect the generator from damage with the variances in the reservoir level vs the line pressure to the turbine;
- (2)
- Smooth and effective switching between the generated hydropower and Centlec when the demand from the office exceeds the supply from the turbine; and
- (3)
- Optimally utilize the generated power from the turbine for the office.
An automated protection for the hydropower turbine plant and an automated change over panel to deal with the variable demand from the office was required. This resulted in the development of an automated change over panel that supplies all office distribution boards (DB) individually and switching between Centlec and Hydro as close as possible within the demand and supply range.
5. Optimization and Integration Energy Sources
To maximize the utilization of the hydropower, an automatic change over panel was developed to deal with the variable hydropower supply as well as the variable electricity demand from the office. The office building’s electrical distribution was divided into different distribution boards to allow each sector to be supplied and switched individually. The arrangement of the 6 DB’s supplies had to be changed by extending the supply cables and rerouted via the distribution panel to the new change over panel (schematic shown in Figure 7).

Figure 7.
Schematic layout of newly configured electricity supply system.
For each DB, Centlec and Hydro supply, power meters were installed and the switching is done with 6 PLC controlled, motorized change-over switches. The PLC constantly evaluates the incoming Centlec and Hydro supply against the demand from the office building. Subsequently it executes switching between these two supplies for maximum utilization of the renewable hydropower supply, but also limits power interruptions to a minimum because of these switching actions.
The principle of operation and control philosophy of the Change-Over Panel comprising an Allen Bradley CompactLogix PLC and change-over breakers are as follows:
- The CompactLogix PLC controls 6 off motorized change-over switches which are subsequently supplying power to the various feeder loads. The supply can be individually selected to use Centlec or Hydropower. These feeder loads are as follows: DB-Main, DB-A, DB-B, DB-C, DB-BD & DB-IT (Auxiliary Supply section).
- The CompactLogix PLC controls the selection between the Centlec and the backup generator power via a dedicated motorized change-over switch.
- The CompactLogix PLC controls the selection between the existing Centlec connection and the new dedicated Centlec connection via a motorized change-over switch.
- The Gateway PLC interfaces with the Lovato Genset Controller, via Modbus RTU protocol, and populate the relevant data in mapping registers.
- The PLC re-structures these mapping registers in a readable format and makes it available for the SCADA via Ethernet/IP protocol.
- The PLC starts and stops the backup generator as needed and also caters for adequate cooling down cycle.
- The Gateway PLC interfaces with 9 off energy meters, via Modbus RTU protocol, and populate the relevant data in mapping registers. These energy meters monitor the power and energy on the load side of each of the motorized change-over switches.
- The default position on the motorized change-over switches is Centlec for each of the 6 feeder supply loads, therefore the actual consumed power is monitored over a period to determine minimal and maximum peak values. The PLC then evaluates whether the current hydropower generated is sufficient for delivering power to these load feeders, prior to switching to Hydro.
- The PLC limits the switching action of the same motorized change-over switches to reduce power interruptions to a minimum.
- The PLC execute sequential switching actions from Centlec to Hydro and if certain loads consume more power than the available Hydro, the next in line in the fixed sequence will be evaluated and switching will only take place if adequate power is available from the hydro plant.
- If the load feeder(s) are fed from the Hydro, and the total consumed power increased beyond the available power from the hydropower plant, then the PLC will sequentially change the selection back to Centlec.
6. Optimization and Integration of Turbine and Water Supply
The first facet of the integration related to the optimally matching of the electricity demand to the electricity supply from the turbine, both of which are variable. This was achieved by utilizing of the automatic change-over panel as described in the section above. The second facet of the integration was to evaluate the generation capability of the hydropower plant and align the maximum generating periods with the maximum electricity demands.
A typical data set of a week’s recorded pressure and flow at Brandkop reservoir (Thursday, 24 November 2016 to Wednesday, 30 November 2016) is depicted in Figure 8. The maximum flow rate during this period was 1.27 m³/s whilst the minimum was 0 m³/s with an average flow rate of 0.87 m³/s. The maximum pressure is related to the maximum static pressure at zero flow which is 8.2 bar (some higher peaks were recorded related to the PRV’s instability and generated surge).

Figure 8.
Typical pressure and flow data at Brandkop Reservoir (24–30 November 2016).
Modifying the system for the typical week as depicted in Figure 9, to supply ±0.6 m³/s during the day (06:00 to 18:00) and then increase the flow rate to ±1.25 m³/s from 18:00 until the next morning at 06:00 would provide a very similar average flow of 0.90 m³/s (for the weekdays). This supply pattern to the Brandkop Reservoir would ensure sufficient available pressure at the hydropower plant during the weekdays as illustrated in Figure 9. During the high flow period 55.6 kW could still be generated and during the day (low flow with subsequent higher pressure) the turbine could operate at full generating capacity of 96 kW. During the weekend the flow rate can be kept constant at ±0.9 m³/s or as illustrated in Figure 9, as the electricity demand is only approximately 25 kW (baseload). This modification to the system operation results in a maximum power generation during the periods where the demand for electricity is the highest. In certain peak periods the demand could still exceed the hydro capabilities but this is then controlled with the automated change over panel.

Figure 9.
Simplified supply profile to Brandkop Reservoir (24–30 November 2016).
The Brandkop Reservoir has a capacity of 136 Ml and the smoothing of the supply profile as suggested in Figure 9 did not have a significant influence on the reservoir levels. This is due to the following reasons:
- (1)
- The demand in the City of Bloemfontein does not vary significantly from the weekdays to the weekends.
- (2)
- The average night flow from the Brandkop Reservoir is approximately 0.76 m³/s (as it fills other service reservoirs in the City of Bloemfontein that have been drawn down during the day).
- (3)
- The reservoir capacity is equal to approximately 30 h of demand.
The reservoir level must be between 80% and 85 % of the full supply level at 18:00 as this would mean that during the next 12 h the increase in supply will start to increase the reservoir level but will however not result in the reservoir spilling.
7. Conclusions
Globally countries have been working intensively to improve energy efficiency in all sectors whilst at the same time increasing the use of renewable energies. There is a global drive to become more self-sufficient and sustainable.
This type of energy generation, referred to as conduit hydropower, is different from the conventional hydropower generation usually associated with large dams. The excess energy available in pressurized conduits (pumping or gravity) normally dissipated through PRVs are transformed into clean, renewable hydroelectric energy by means of a turbine.
Approximately 30% of the water supplied via the Caledon–Bloemfontein pipeline is diverted through a conduit hydropower turbine installation and discharged into the Brandkop Reservoir. Control equipment regulates the flow (maximum 0.35 m³/s) and pressure (4 bar) through the turbine and the electronic regulators provide for the generation of clean stable electricity at the correct frequency of 50 Hz and voltage.
The electricity demand is occasionally greater than the maximum generation capability and an automatic change over panel improves the alignment of these. Furthermore the operation of the supply pipeline system resulted in periods where the turbine could not be fully utilized (usually due to low pressures). A rescheduling of the supply pattern to the Brandkop Reservoir resulted in lower flow rates during the day and subsequent higher generating potential (due to the higher pressure) aligning with the greater electricity need for the offices during the day. This project showcased that by evaluating the interrelationship of water supply, electricity demand and operating cycles an optimum solution with increased resiliency and sustainability can be achieved.
Acknowledgments
This research was made possible by the financial support of the Water Research Commission and Bloemwater whose support is acknowledged with gratitude.
Conflicts of Interest
The authors declare no conflict of interest.
References
- Fontana, N.; Giugni, M.; Portolano, D. Losses Reduction and Energy Production in Water-Distribution Networks. J. Water Resour. Plan. Manag. 2012, 138, 237–244. [Google Scholar] [CrossRef]
- National Hydropower Association. Rancho Penasquitos Pressure control and Hydroelectricity Facility, San Diego County Water Authority. Available online: www.hydro.org (accessed on 5 September 2011).
- Möderl, M.; Sitzenfrei, R.; Mair, M.; Jarosch, H.; Rauch, W. Identifying Hydropower Potential in Water Distribution Systems of Alpine Regions. In Proceedings of the World Environmental and Water Resources Congress 2012, Albuquerque, New Mexico, 20–24 May 2012. [Google Scholar]
- White, J. Recovering energy from an existing conduit. Int. Water Power Dam Constr. 2011, 63, 18–20. [Google Scholar]
- Van Vuuren, S.J.; Van Dijk, M.; Loots, I. Conduit Hydropower Pilot Plants; WRC Report No TT596/14; Water Research Commission: Pretoria, South Africa, 2014. [Google Scholar]
- Van Vuuren, S.J.; Van Dijk, M.; Loots, I.; Barta, B.; Scharfetter, B.G. Conduit Hydropower Development Guide; WRC Report No TT597/14; Water Research Commission: Pretoria, South Africa, 2014. [Google Scholar]
- Santolin, A.; Pavesi, G.; Cavazzini, G.; Ardizzon, G.; Pérez-Dfiaz, J.I.; Van Dijk, M. Techno-economic feasibility analysis for energy production by variable speed Francis turbines in water distribution networks. In Proceedings of the Hydro-Africa 2017, Marrakech, Morocco, 14–16 March 2017. [Google Scholar]
Publisher’s Note: MDPI stays neutral with regard to jurisdictional claims in published maps and institutional affiliations. |
© 2018 by the authors. Licensee MDPI, Basel, Switzerland. This article is an open access article distributed under the terms and conditions of the Creative Commons Attribution (CC BY) license (https://creativecommons.org/licenses/by/4.0/).