Proceeding Paper

Simulation of Low Impact Development (LID) Practices and Comparison with Conventional Drainage Solutions †

by
Ioannis M. Kourtis
1,*,
Vassilios A. Tsihrintzis
1 and
Evangelos Baltas
2
1
Centre for the Assessment of Natural Hazards and Proactive Planning & Laboratory of Reclamation Works and Water Resources Management, School of Rural and Surveying Engineering, National Technical University οf Athens, 9 Iroon Polytechniou St., Zografou, 15780 Athens, Greece
2
Department of Water Resources, Hydraulic and Maritime Engineering, School of Civil Engineering, National Technical University of Athens, 9 Iroon Polytechniou St., Zografou, 15780 Athens, Greece
*
Author to whom correspondence should be addressed.
Presented at the 3rd EWaS International Conference on “Insights on the Water-Energy-Food Nexus”, Lefkada Island, Greece, 27–30 June 2018.
Proceedings 2018, 2(11), 640; https://doi.org/10.3390/proceedings2110640
Published: 3 August 2018
(This article belongs to the Proceedings of EWaS3 2018)

Abstract

:
The present work aims at quantifying the benefit of Low Impact Development (LID) practices in reducing peak runoff and runoff volume, and at comparing LID practices to conventional stormwater solutions. The hydrologic-hydraulic model used was the Storm Water Management Model (SWMM5.1). The LID practices modeled were: (i) Green roofs; and (ii) Permeable pavements. Each LID was tested independently and compared to two different conventional practices, i.e., sewer enlargement and detention pond design. Results showed that for small storm events LID practices are comparable to conventional measures, in reducing flooding. Overall, smaller storms should be included in the design process.

1. Introduction

Urban drainage networks contribute to human well-being by preventing flooding, and so are considered as essential infrastructure [1,2,3,4]. As urban areas become larger, denser and more impervious, usually expanding faster than their storm drainage systems, floods become more frequent and more devastating than in the past [5,6,7,8]. During the last years, researchers have posed their concerns and criticism regarding the limited capacity and the flexibility of conventional drainage solutions to flooding (i.e., sewer enlargement; detention pond design etc.), especially for their ability to cope with climate variability and urbanization [9,10,11]. New technologies (i.e., sustainable drainage solutions) have emerged that take into account other aspects of urban stormwater management, such as [1,2,12,13,14]: (i) runoff quality; (ii) visual amenity; (iii) recreational value; and (iv) ecological protection. Nowadays sustainable drainage solutions are widely recommended and applied in different parts of the world [12,15,16,17,18,19,20,21]. They are called Low Impact Development (LID) in the United States and Sustainable Urban Drainage solutions (SUDs) in Europe. As LID practices present high interest in the last years, researchers have focused on evaluating LID hydrological performance and hydraulic behavior on flooding [16,17,18,19,20]. However, little is known regarding LID ability in reducing hydrologic impacts at the watershed scale [12,13,15].
The present work aims to quantify the benefit of LID practices in reducing peak runoff and runoff volume, and to compare their efficiency in reducing flooding with those of two traditional stormwater practices [22]. LID and conventional practices were simulated for 2, 5, 10, and 100-year synthetic design storms. The LID practices tested included Green Roofs (GR) and Permeable Pavements (PP), while the conventional measures included Sewer Enlargement (SE), and Detention Ponds (DP) placed parallel to the drainage network.

2. Materials and Methods
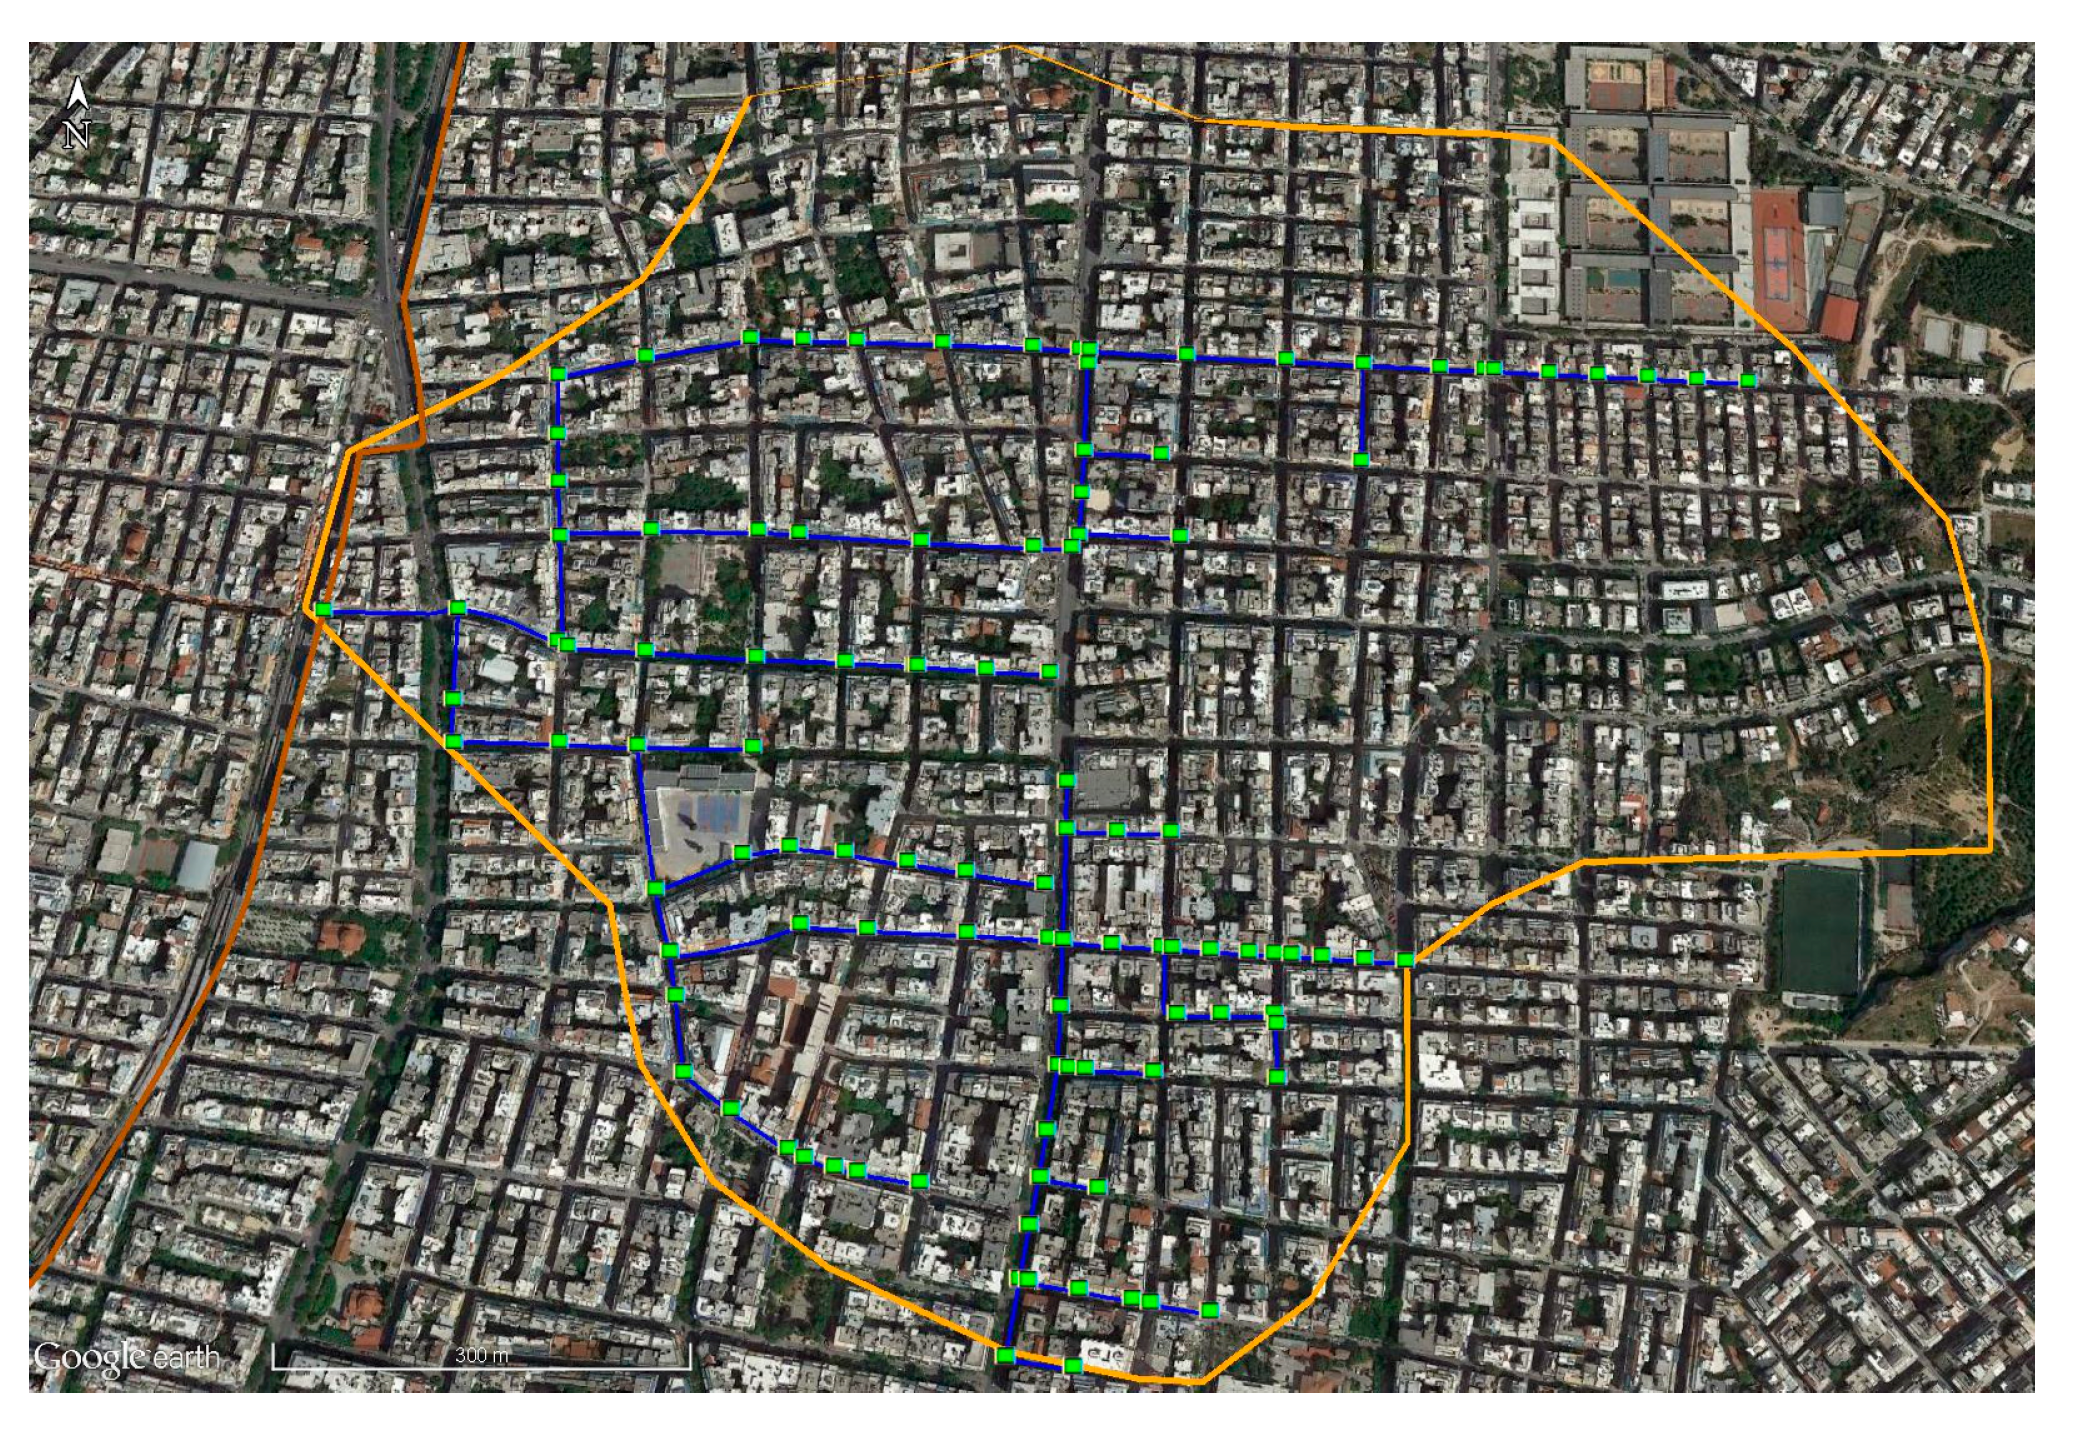
2.1. Study Site

The study site is located in Athens, Greece, and covers an area of 0.89 km2 (89 ha). Most of the drainage area is densely developed (Figure 1). The portion of the combined drainage network corresponding to the catchment consisted of 79 combined pipes and 112 junctions with a total length of 5.34 km. The combined drainage system comprised either egg-shaped sewers with depths ranging from 0.9 m to 2.4 m, or pipes with diameters ranging from 0.3 m to 0.6 m. A full description of the study area is given by Kourtis et al. [22].

2.2. SWMM Model

The software used in modelling conventional measures and LID practices was SWMM5.1 of the U.S. Environmental Protection Agency. SWMM is a fully dynamic rainfall-runoff model used for the simulation of water quantity, quality and LID controls in urban areas [22,23,24,25,26,27]. Infiltration computations for the entire study area were based on the Curve Number method. In hydraulic calculations, the Dynamic Wave model was used with time step fixed at 0.1 s. SWMM software parameters and their variation ranges are presented in Table 1. Subcatchment information, such as area, slope, percent imperviousness and curve number values, were estimated based on the Digital Elevation Model (DEM) and the land uses of the study area using GIS techniques, while typical values from the literature were used for [26,28,29,30]: (i) width; (ii) Manning’s roughness coefficient for overland flow in pervious and impervious surfaces; (iii) depression storage for pervious and imperious areas; and (iv) Manning’s roughness coefficient for storm sewers. As the study site is ungauged, the following IDF curves were used in simulating existing condition, conventional measures and LID practices [31]:
i = 15.39 T0.276 t−0.725,
where i is the rainfall intensity (mm/h), T is the return period (years), and t is the rainfall duration (h).
The Alternating Block Method was used for developing rainfall distributions of 1-h duration [32]. The 2-, 5-, 10- and 100-year return period synthetic storm events were simulated, with respective rainfall depths of 18.63, 24.00, 29.06, and 54.86 mm.

2.3. LID Practices and Conventional Measures

The main objective both of LID and conventional measures was to improve drainage conditions, so that the combined drainage network would be able to handle the runoff of return periods of up to ten years without surface flooding. Conventional measures and LID practices were simulated and compared with the existing condition using EPA SWMM5.1 software.
GR mainly retain part of the rainfall but also lengthen flow paths, thus reducing runoff from impervious surfaces. PP can be used to replace impervious concrete or asphalt pavements covering sidewalks, parking lots, secondary roads etc. The main drawback is that only a few studies in the recent literature have compared observed flow from LID structures to simulated flow, and as a result, parameters need to be estimated in a relative coarse manner [33,34,35,36,37]. In the present study, there are no flow measurements available in the study area, in order for the calibration-validation procedure to take place, and as a result, parameters are estimated from previous studies [17,18,37,38,39,40]. Parameters for the two LID practices simulated in the present study are presented in Table 2.
The GR scenario converted the commercial and residential rooftops into green roofs, while under the PP scenario sidewalks, parking places and secondary roads were converted to permeable surfaces. For determining the available space of the study area to be converted, for both scenarios, the ArcGIS software was utilized. For each subcatchment, total rooftop area, sidewalk area, parking lot area and road area were calculated using aerial imagery. In total, the area converted to green roofs was calculated at about 0.23 km2, covering 35% of the impervious area and 31% of the total study area. Finally, the area that must be replaced in order to become permeable was estimated at about 0.19 km2, covering 18% of the study area and 20% of the impervious area. The details about the setup of the model parameters in modelling the conventional measures (SE and DP) are described by Kourtis et al. [22]. For the SE scenario, a total of 60 sewers were selected for enlargement with the diameter of the new pipes ranging from 0.4 m to 1.2 m, while the height of the sewers ranged from 1.05 to 2.4 m and their width ranged from 1.2 m to 3.0 m. Finally, 29 detention ponds were designed with maximum depth up to 3.0 m and maximum volume capacity ranging up to 1042 m3.

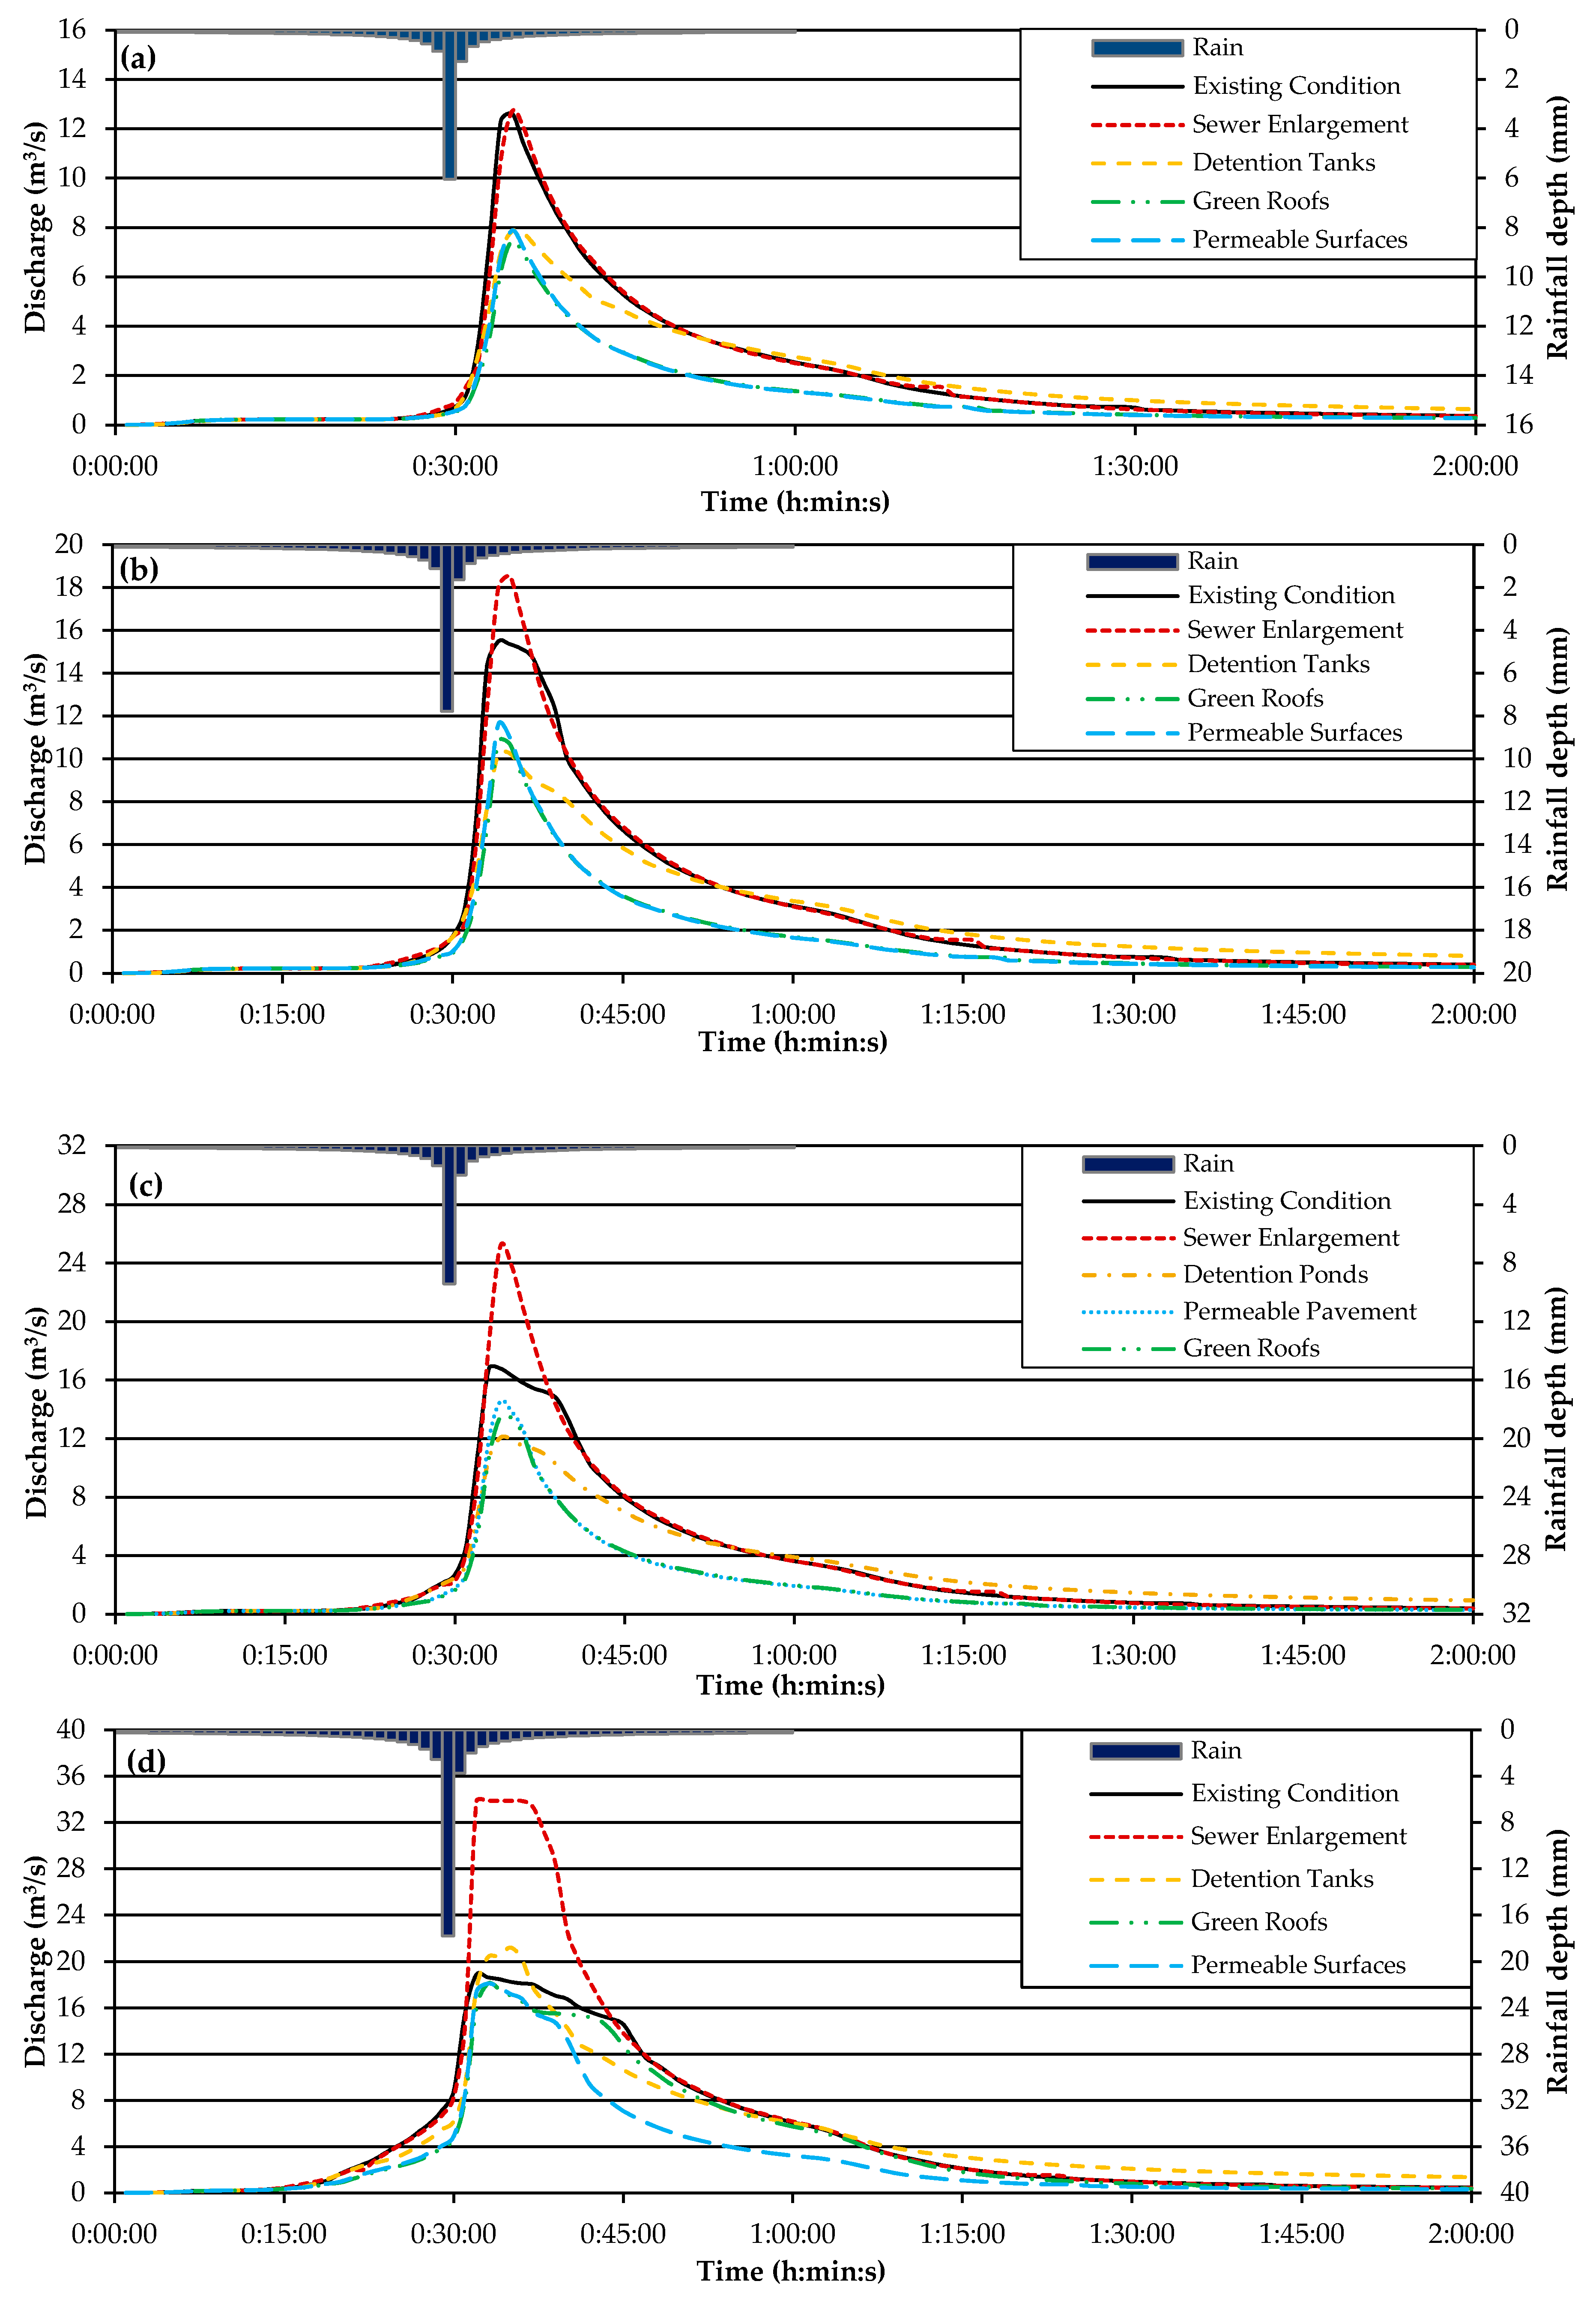
3. Results and Discussion

Even for duration of 1-h and return periods of 2 and 5 years, flooding occurs at two nodes of the system. The total flooding volume was calculated at 28 m3 and 355 m3 for 2-, and 5-year return periods, respectively. All flooding mitigation measures examined herein increased the drainage system capacity, and as a result there was not surface flooding at any node of the system. SE and DP upgraded the system capacity, while on the other hand GR and PP reduced the runoff volume from the subcatchments. Figure 2a,b present the hydrographs at the outlet of the study area for all the scenarios simulated. For SE, a slight increase for the 2-year flood and a significant increase for the 5-year flood of the hydrograph peak are shown, resulting from the additional water entering the storm sewer, which otherwise would end on the street surface. DP, GR and PP give comparable peaks at the exit but the flood volumes for both GR and PP are significantly reduced.
Hydrographs for the existing condition, and all scenarios tested, for duration of 1-h and return period of 10-years, are displayed in Figure 2c. Figure 2c shows that both the peak flow and the total volume are reduced at the outlet due to the implementation of the DP, the GR and the PP. The reduction was in the range of 13.4–28.2% for the peak flow, and 24.5–29% for the total runoff volume. However, in case of DP, the total volume increased about 54%, since additional water, which otherwise would flood the streets, was temporarily stored in the DPs, and then was released back and slowly drained through the storm sewers. GR, PP and DP decreased the peak of the flood hydrograph and the occurrence time of peaks was slightly affected. On the other hand, the flow peak and the total volume increased in case of SE by about 49.7% and by about 15.8%, respectively.
Finally, Figure 2d presents the results for the existing condition and after the implementation of flooding mitigation measures for a large storm event (i.e., return period of 100 years and duration of 1 h). The total surface flooding volume, before the implementation of mitigation measures, was calculated at 12,589 m3 and 44% of the nodes of the combined drainage network flooded. The SE scenario upgraded the system drainage capacity by 79.6% but even in this case there was flooding in the area. The volume of surface flooding was computed at 4640 m3 after SE, reduced by about 63%. The DP mitigation scenario upgraded the system capacity by about 13% and the volume of flooding was reduced 100%. Finally, GR and PP reduced the peak flow at the outlet of the study area by about 4%, while the flooding volume, for the whole study area, was reduced by about 70%. We also have to mention that, for all return periods, the SE scenario caused increases in flow peaks at the outlet of the drainage network which may negatively affect conditions at the receiving river.
In order for engineers, practitioners and stakeholders to be able to effectively manage highly urbanized basins, and moreover, achieve sustainability goals, more frequent storms must be incorporated in the design process, as they may have a significant impact on water quantity and quality, especially in urban areas were combined drainage networks are still in use. The analysis conducted herein indicated that LID practices, such as GR and PP, can operate as effectively as conventional measures, especially for small storm events, while traditional approaches, such as sewer enlargement and detention ponds are more effective in managing runoff from storm events with lower probability of occurrence. LID and conventional practices must be examined in combination in order to achieve both flood mitigation and sustainability goals.
The methodology proposed herein is relatively easy to be transferred and applied in cities with different characteristics. However, one must be careful in choosing the parameters related to the drainage system, and the parameters of the LID and the conventional solutions explored. Moreover, in case of absence of rainfall-runoff measurements, the hydrologist could transfer and use parameters from adjacent calibrated-validated areas with similar characteristics or use a detailed hydrodynamic 1D–2D model for calibration.

4. Conclusions and Recommendations for Future Research

The present paper analyzed the impacts of LID designs on urban flooding in a highly urbanized catchment in Athens, Greece, where two LID practices were modeled and compared with conventional drainage solutions (i.e., sewer enlargement and detention pond design) for stormwater management. The main objective was to improve understanding on how the adoption of LID practices, and in particular green roofs and permeable surfaces, in an already urbanized basin might impact runoff and, therefore, flood risk. It is essential to understand the main conditions under which sustainable stormwater solutions (i.e., LID) could mitigate flooding problems. Mitigation measures must be studied in combination, in order to address runoff volumes and discharges in urbanized basins, and so these modeling scenarios are primarily meant more for providing bounds on LID practices as flooding mitigation measures. Results demonstrated that LID practices are highly effective for small storm events. However, as the probability of the rainfall event reduces, the LID solutions tend to become less effective in reducing runoff volume and peak flow. Green roofs and permeable surfaces delay and attenuate stormwater runoff, at the source, and so they reduce stormwater volume discharges and flooding phenomena in urban regions. The two LID practices examined herein demonstrated that LID are more effective for lower intensity storm events; however, their effect tends to diminish while the magnitude of the rainfall event increases. Overall, it is proposed that smaller storms should be included in the design process in order for stakeholders to be able to evaluate sustainability. Finally, SWMM was found to be a very useful tool in modelling and testing the ability of conventional and LID practices in reducing flooding in a highly urbanized basin. Future research is needed regarding modelling parameters of LID practices and the optimum combinations between the sustainable urban drainage solutions and the conventional measures. Moreover, cost-benefit studies must be included in the design process, in order to determine the feasibility of conventional and LID solutions regarding the achievement of sustainability goals. Extension of such analyses in larger areas could provide a clearer insight on the impact of both LIDs and conventional measures to the urban drainage network. All the methods adopted and implemented in the present work are independent and could easily be applied to urban basins with different sizes and characteristics in order to determine feasibility of sustainable drainage solutions.

Author Contributions

I.M.K. developed and implemented SWMM simulations and wrote the first draft of the paper. V.A.T. contributed to the modelling and writing, critically reviewed the paper, and supervised the work. E.B. contributed to the modelling and critically reviewed the paper.

Acknowledgments

The authors would like to thank the Athens Water Supply and Sewerage Company (EYDAP S.A.) for supplying background information on the combined drainage network of Athens.

Conflicts of Interest

The authors declare no conflict of interest.

References

  1. Larsen, T.A.; Gujer, W. The concept of sustainable urban water management. Water Sci. Technol. 1997, 35, 3–10. [Google Scholar] [CrossRef]
  2. Chocat, B.; Ashley, R.; Marsalek, J.; Matos, M.R.; Rauch, W.; Schilling, W.; Urbonas, B. Toward the sustainable management of urban storm-water. Indoor Built Environ. 2007, 16, 273–285. [Google Scholar] [CrossRef]
  3. Marlow, D.R.; Moglia, M.; Cook, S.; Beale, D.J. Towards sustainable urban water management: A critical reassessment. Water Res. 2013, 47, 7150–7161. [Google Scholar] [CrossRef]
  4. Wong, T.H.F.; Brown, R.R. The water sensitive city: Principles for practice. Water Sci. Technol. 2009, 60, 673–682. [Google Scholar] [CrossRef] [PubMed]
  5. Henonin, J.; Russo, B.; Mark, O.; Gourbesville, P. Real-time urban flood forecasting and modelling—A state of the art. J. Hydroinform. 2013, 15, 717–736. [Google Scholar] [CrossRef]
  6. Schmitt, T.G.; Thomas, M.; Ettrich, N. Analysis and modeling of flooding in urban drainage systems. J. Hydrol. 2004, 299, 300–311. [Google Scholar] [CrossRef]
  7. Chen, J.; Hill, A.A.; Urbano, L.D. A GIS-based model for urban flood inundation. J. Hydrol. 2009, 373, 184–192. [Google Scholar] [CrossRef]
  8. Salvadore, E.; Bronders, J.; Batelaan, O. Hydrological modelling of urbanized catchments: A review and future directions. J. Hydrol. 2015, 529, 62–81. [Google Scholar] [CrossRef]
  9. Krebs, P.; Larsen, T.A. Guiding the development of urban drainage systems by sustainability criteria. Water Sci. Technol. 1997, 35, 89–98. [Google Scholar] [CrossRef]
  10. Roy, A.H.; Wenger, S.J.; Fletcher, T.D.; Walsh, C.J.; Ladson, A.R.; Shuster, W.D.; Thurston, H.W.; Brown, R.R. Impediments and solutions to sustainable, watershed-scale urban stormwater management: Lessons from Australia and the United States. Environ. Manag. 2008, 42, 344–359. [Google Scholar] [CrossRef]
  11. Zevenbergen, C.; Veerbeek, W.; Gersonius, B.; Van Herk, S. Challenges in urban flood management: Travelling across spatial and temporal scales. J. Flood Risk Manag. 2008, 1, 81–88. [Google Scholar] [CrossRef]
  12. Damodaram, C.; Giacomoni, M.H.; Prakash Khedun, C.; Holmes, H.; Ryan, A.; Saour, W.; Zechman, E.M. Simulation of combined best management practices and low impact development for sustainable stormwater management. J. Am. Water Resour. Assoc. 2010, 46, 907–918. [Google Scholar] [CrossRef]
  13. Li, C.; Liu, M.; Hu, Y.; Han, R.; Shi, T.; Qu, X.; Wu, Y. Evaluating the hydrologic performance of low impact development scenarios in a micro urban catchment. Int. J. Environ. Res. Public Health 2018, 15, 273. [Google Scholar] [CrossRef] [PubMed]
  14. Kourtis, I.M.; Tsihrintzis, V.A. Economic Valuation of ecosystem services provided by the restoration of an irrigation canal to a riparian corridor. Environ. Process. 2017, 4, 749–769. [Google Scholar] [CrossRef]
  15. Burszta-Adamiak, E.; Mrowiec, M. Modelling of green roofs’ hydrologic performance using EPA’s SWMM. Water Sci. Technol. 2013, 68, 36–42. [Google Scholar] [CrossRef]
  16. Zhou, Q. A review of sustainable urban drainage systems considering the climate change and urbanization impacts. Water 2014, 6, 976–992. [Google Scholar] [CrossRef]
  17. Palla, A.; Gnecco, I. Hydrologic modeling of low impact development systems at the urban catchment scale. J. Hydrol. 2015, 528, 361–368. [Google Scholar] [CrossRef]
  18. Chui, T.F.M.; Liu, X.; Zhan, W. Assessing cost-effectiveness of specific LID practice designs in response to large storm events. J. Hydrol. 2016, 533, 353–364. [Google Scholar] [CrossRef]
  19. Chen, P.Y.; Tung, C.P.; Li, Y.H. Low impact development planning and adaptation decision-making under climate change for a community against pluvial flooding. Water 2017, 9, 756. [Google Scholar] [CrossRef]
  20. Giacomoni, M.H.; Joseph, J. Multi-objective evolutionary optimization and Monte Carlo simulation for placement of low impact development in the catchment scale. J. Water Res. Plan. Manag. 2017, 143, 04017053. [Google Scholar] [CrossRef]
  21. Wang, M.; Sun, Y.; Sweetapple, C. Optimization of storage tank locations in an urban stormwater drainage system using a two-stage approach. J. Environ. Manag. 2017, 204, 31–38. [Google Scholar] [CrossRef] [PubMed]
  22. Kourtis, I.M.; Tsihrintzis, V.A.; Baltas, E.A. Modelling of a combined sewer system and evaluation of mitigation measures using SWMM. Eur. Water 2017, 57, 12–128. [Google Scholar]
  23. Selvalingam, S.; Liong, S.Y.; Manoharan, P.C. Use of RORB and SWMM models to an urban catchment in Singapore. Adv. Water Resour. 1987, 10, 78–86. [Google Scholar] [CrossRef]
  24. Tsihrintzis, V.A.; Hamid, R.; Fuentes, H.R. Calibration and verification of watershed quality model SWMM in sub-tropical urban areas. In Proceedings of the First International Conference on Water Resources Engineering, ASCE, San Antonio, TX, USA, 14–18 August 1995; pp. 373–377. [Google Scholar]
  25. Tsihrintzis, V.A.; Hamid, R. Runoff quality prediction from small urban catchments using SWMM. Hydrol. Process. 1998, 12, 311–329. [Google Scholar] [CrossRef]
  26. Bellos, V.; Kourtis, I.M.; Moreno-Rodenas, A.; Tsihrintzis, V.A. Quantifying roughness coefficient uncertainty in urban flooding simulations through a simplified methodology. Water 2017, 9, 944. [Google Scholar] [CrossRef]
  27. Kourtis, I.M.; Kopsiaftis, G.; Bellos, V.; Tsihrintzis, V.A. Calibration and validation of SWWM model in two urban catchments in Athens, Greece. In Proceedings of the 15th International Conference on Environmental Science and Technology (CEST 2017), Rhodes, Greece, 31 August–2 September 2017; pp. 1–6. [Google Scholar]
  28. ASCE. Design and Construction of Urban Stormwater Management Systems; ASCE: New York, NY, USA, 1992. [Google Scholar]
  29. Chow, V.T. Open-Channel Hydraulics; McGraw-Hill Book Company, Inc.: New York, NY, USA, 1959. [Google Scholar]
  30. Rossman, L.A. Storm Water Management Model, User’s Manual, Version 5.0.; National Risk Management Research Laboratory, Office of Research and Development, US Environmental Protection Agency: Cincinnati, OH, USA, 2010; p. 276. [Google Scholar]
  31. Mimikou, M.; Baltas, E.; Varanou, E. A study of extreme storm events in Athens greater area. In Proceedings of the a Symposium, the Extreme of Extremes, Extraordinary Floods, Reykjavik, Iceland, 17–19 July 2000; IAHS Publ. No. 271. [Google Scholar]
  32. USBR (U.S. Bureau of Reclamation). Design of Arch Dams; U.S. Government Printing Office: Denver, CO, USA, 1977. [Google Scholar]
  33. Walsh, T.C.; Pomeroy, C.A.; Burian, S.J. Hydrologic modeling analysis of a passive, residential rainwater harvesting program in an urbanized, semi-arid watershed. J. Hydrol. 2014, 508, 240–253. [Google Scholar] [CrossRef]
  34. Guan, M.; Sillanpää, N.; Koivusalo, H. Assessment of LID practices for restoring pre-development runoff regime in an urbanized catchment in southern Finland. Water Sci. Technol. 2015, 71, 1485–1491. [Google Scholar] [CrossRef]
  35. Rosa, D.J.; Clausen, J.C.; Dietz, M.E. Calibration and verification of SWMM for low impact development. J. Am. Water Resour. Assoc. 2015, 51, 746–757. [Google Scholar] [CrossRef]
  36. Brunetti, G.; Šimůnek, J.; Piro, P. A comprehensive numerical analysis of the hydraulic behavior of a permeable pavement. J. Hydrol. 2016, 540, 1146–1161. [Google Scholar] [CrossRef]
  37. Rossman, L.; Huber, W. Storm Water Management Model Reference Manual: Volume III–Water Quality; US Environmental Protection Agency, Office of Research and Development, National Risk Management Laboratory: Cincinnati, OH, USA, 2016. [Google Scholar]
  38. Xie, J.; Wu, C.; Li, H.; Chen, G. Study on storm-water management of grassed swales and permeable pavement based on SWMM. Water 2017, 9, 840. [Google Scholar] [CrossRef]
  39. Zhang, S.; Guo, Y. SWMM simulation of the storm water volume control performance of permeable pavement systems. J. Hydrol. Eng. 2014, 20, 06014010. [Google Scholar] [CrossRef]
  40. Qin, H.P.; Li, Z.X.; Fu, G. The effects of low impact development on urban flooding under different rainfall characteristics. J. Environ. Manag. 2013, 129, 577–585. [Google Scholar] [CrossRef] [PubMed]
Figure 1. Aerial view of the study area (Google earth).
Proceedings 02 00640 g001
Figure 2. Hydrographs of 1-h duration storm at the outlet of the study area for all the scenarios tested, and for return periods of: (a) 2 years; (b) 5 years; (c) 10 years; and (d) 100 years.
Proceedings 02 00640 g002
Table 1. Key Model Parameters.
ParameterUnitsRangeParameterUnitsRange
(1) Areaha0.02–6.68(6) Dstore-Impervmm2.54
(2) Widthm7.93–162.77(7) Dstore-Pervmm6.51
(3) %Imperv%45–90(8) CN-77–94
(4) N-Impervs/m1/30.015(9) Mannings/m1/30.013–0.014
(5) N-Pervs/m1/30.2(10) Time steps0.1
Table 2. Parameters of LID practices.
LayerParameterGreen RoofPermeable PavementDescription
SurfaceBerm height (mm)1000Maximum depth to which water can pond.
Vegetation volume fraction0.20Fraction of the volume within the surface storage depth filled with vegetation.
Surface roughness (s/m1/3)0.250.015Manning’s coefficient for overland flow.
Surface slope (%)11Roof surface slope.
SoilThickness (mm)200-Soil layer thickness.
Porosity (volume fraction)0.5-Volume of pore space relative to total volume of soil.
Field capacity (volume fraction)0.4-Volume of pore water relative to total volume after the soil is fully drained.
Wilting point (volume fraction)0.1-Volume of pore water relative to total volume in fully dried soil where only bound water remains.
Conductivity (mm/h)1000-Hydraulic conductivity for fully saturated soil.
Conductivity slope10-Slope of the curve of log (conductivity) versus soil moisture content.
Suction head (mm)50-Average value of soil capillary suction along the wetting front.
PavementThickness (mm)-150Pavement layer thickness.
Void ratio (Void/Solids)-0.15Volume of void space relative to the volume of solids in the pavement.
Permeability (mm/h)-500Permeability of the concrete or asphalt.
Drainage matThickness (mm)100-Thickness of the mat or plate.
Void fraction0.3-Ratio of void volume to total volume.
Roughness (m/s1/3)0.015-Manning’s coefficient.
StorageThickness (mm)-400Thickness of gravel layer.
Void ratio (Void/Solids)-0.3Volume of void space relative to the volume of solids in layer.
Seepage fate (mm/h)-750Rate at which water seeps into the native soil below the layer.
Publisher’s Note: MDPI stays neutral with regard to jurisdictional claims in published maps and institutional affiliations.

