1. Introduction
Benchmarking similarly as performance indicators for comparing and evaluating water systems and their operators is a fairly new phenomenon, however, it is currently a topical issue worldwide. Benchmarking can be defined as a search for best practices in the industry that leads to better performance [
1]. Furthermore, benchmarking has also been accepted in the public sector. Benchmarking is thus a means by which new practices are discovered and understood, as well as the process of setting goals [
2,
3].
At present, there is a trend not only within the European Union to create a platform to enable to compare the performance of water systems and their operators across countries. The examples of these benchmarking platforms include the World Bank’s “IB-NET” database, which focuses on less developed countries [
4]. Another project aiming at utilizing the management practices to improve the efficiency and production processes—benchmarking—is the European Benchmarking Co-operation project “EBC” [
5]. However, more advanced countries, mainly from Western Europe, are involved in this platform. There are more platforms for benchmarking in the field of water supply and sewerage, however, for any system of comparison, it is absolutely crucial to collect data from which it is possible to make subsequent evaluation. In order to introduce a more comprehensive benchmarking system, for example at EU level, it is essential that in each Member State water utilities have an obligation to provide data in the required range and format. This is a relatively large problem, to some extent, the data provided by EUROSTAT can be used on this purpose, but the limiting factor is a certain superficiality of the data provided, which makes it impossible to carry out a more detailed comparison of the performance of the water supply systems or their operators on their basis.
With regard to benchmarking in the field of water supply and sewerage, the legislation or the requirements laid down by legislation are also highly interlinked. Within the EU, there are several directives on water supply area, such as the Drinking Water Directive, the Water Framework Directive, etc., however none of them harmonises the obligations of water utilities to provide the single required data set. Also, none of the directives harmonizes with a single benchmarking in the water sector within the EU. In some Member States, only the regulator of the branch is responsible for the water sector, and the European Commission stated in 2014 that regulation of the water supply and sewerage sector is entirely within the competence of the national states. It could be very difficult to compare water systems and their operators more in details across EU countries without creating a new organization or platform but as it can be seen later it is possible at least for some indicators.
This article deals with benchmarking and legislative requirements that create or, on the contrary, do not create conditions for the benchmarking use in the selected EU countries—the Czech Republic (CZ), Romania, Poland and Slovakia. There is an attempt to find similarities in the national legislation of each state that would allow a more detailed comparison of water systems and their operators without the need for an additional organization or platform and the introduction of further legislation. For some of these selected indicators, the comparison of individual countries is made here.
2. Case Study
2.1. Czech Republic
In the CZ, the Ministry of Agriculture is responsible for the supply of drinking water, under which it falls. However, this ministry does not establish qualitative parameters for drinking water, as the quality of drinking water is set by the Ministry of Health. The water and sewage amount is approved by the Ministry of Finance. The Water Supply and Sewerage Act No. 274/2001 is the most important law for the supply of drinking water, this Act is established as the regulator by the Ministry of Agriculture, which is rather considered to be a “quasi-regulator”. As a regulator of the sector, on the basis of the Government Resolution [
6], the Coordination Committee for Water Supply and Sewerage Regulation, which currently functions as an advisory body for the Ministry of Agriculture has been created recently. This regulator was developed in the framework of the “Draft of a Conceptual Solution in Water Supply Regulation”, and this proposal declares the requirement to introduce a permanent benchmarking owned and operator entities in the CZ with the aim to provide objective information on water and sewerage annually. Thanks to this, a precise benchmarking methodology for water utilities has already been introduced in the CZ, which is implemented on the basis of the data provided by the water company to state institutions according to the law. An example of how the data provision form looks like is in
Table 1 (small part of bigger form). These type of data are used for approval of water price by the Ministry of Finance.
The largest operating utilities in the CZ are mostly public limited liability utilities owned by large multinational utilities such as VEOLIA, etc. However, the water infrastructure is practically exclusively owned by the public sector, so as the mixed utilities are also owned by a public sector. Operators and owners of water supply systems have their own associations. The operators are associated within the Association of Water Supply and Sewerage “SOVAK” (which is a member of the European Association of EurEau Operators) owners within the Association of Municipalities, owners of Water Management Infrastructure “SOVVI”.
Operators are obliged according to the law to provide information on property and operating records to the Ministry of Agriculture that subsequently compiles an annual report, which is published annually online. In addition, since 2015, a benchmarking project has also been publicly published for each year.
2.2. Romania
The water sector in Romania comprises 44 regional water utilities, denominated as Regional Operators and 2 private water utilities that operate each in the cities of Bucharest and Ploiesti. A separate discussion must be made regarding the Regional Operators, since this very big group of utilities deals with water distribution in most of Romania. Several points have to be made in regards to these utilities:
Each Regional operator comprises several administrative branches, varying from 2 to approx. 50 smaller utilities (usually supplying a small number of localities), depending on each individual configuration
Every Regional Operator is administered by the local county council which typically owns 51% to 100% of the company shares
Typically every Regional Operator comprises one to several big cities and a great number of smaller localities, most of them in the rural area. In the last 5 years, due to EU funded projects, the number of localities supplied increased and it will continue to increase at least until the year 2020.
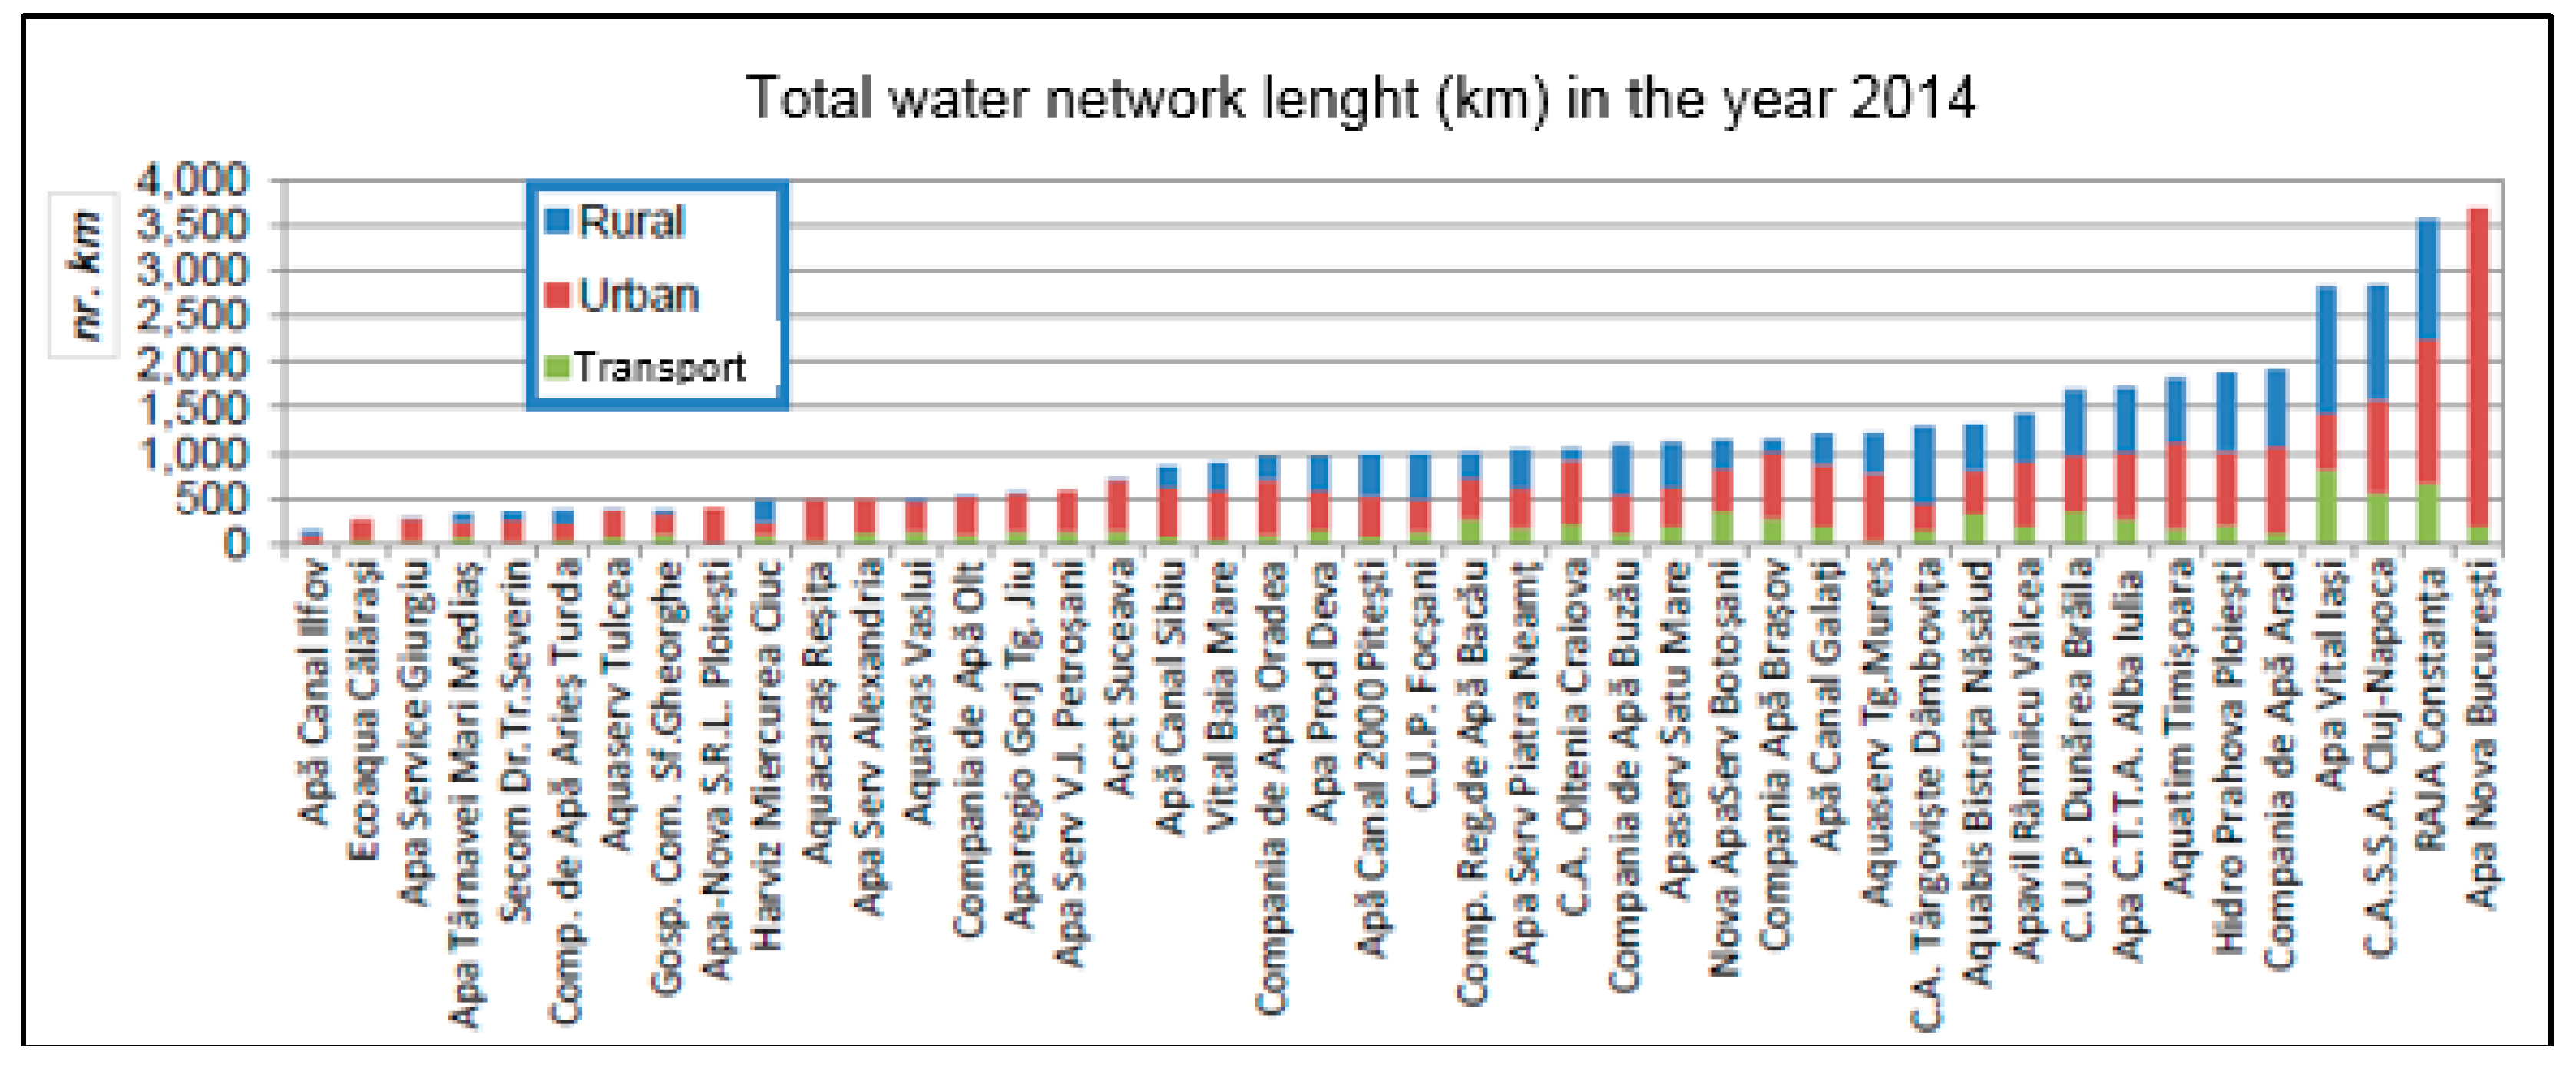
Figure 1 illustrates the total length of water distribution systems according to each water utility in the year 2014. One can observe that each utility has a different ratio regarding the network length in rural and urban areas, as well as the length of transport pipes (usually transporting raw water) [
8].
With regards to data publishing and benchmarking, at this moment all of the water utilities (with the exception of the two private managed utilities) are part of a national benchmarking exercise [
9] that is largely based on the IWA Performance Indicators for Water Supply Services [
10]. The results are not public, but only available to the water utilities and each utility can compare itself with any other participant utility.
2.3. Poland
According to the “Act on commune self-government” [
11] the responsibility for water supply in Poland lies with the local municipality. There are 2478 local municipalities in Poland and 1874 water utilities [
12]. Local municipalities can perform the tasks on their own department or delegate them to the external utilities. Usually main shareholders of water utilities are local municipalities. The public-private partnership model is allowed by the Polish law, but it is not popular—only a few water utilities work in this model.
The most important law acts for the water sector in Poland are Water Law Act No.1566/2017 and The Act on collective water supply and sewage disposal No.2180/2017. These acts address the tasks related to water supply, such as: the obligation to supply water in proper quality and quantity, consumer rights and protection and obligation water utility to cost optimization. The Polish water utility is obligated to receive the license for collective water supply and sewage disposal. In the proposal for license, the water utility is obligated to prepare a proposal of a “Collective water supply and sewage regulation act”. This regulation is then approved by the local government as a local law. This regulation determines detailed standards, indicators and methods of the water utility assessment. Also it is possible to oblige water utilities to use comparative analyse in the “license for collective water supply and sewage disposal” as a local law.
Till the end of 2017, the municipality was also a regulatory body. Municipalities as regulators approved the pricing proposals. According to the law municipalities on their own initiative could lead a comparative analyses and regulatory benchmarking as a process of tariff proposal verification. The new Water Law Act, from 2018 established a central water regulatory body called: “Polish Waters State Water Enterprise-Polish Water” [
13]. Polish Water is responsible for water management in Poland. One of the aims of Polish Water is to approve the “Collective water supply and sewage regulation acts” and tariff proposals. Polish Water has the competence to collect the data from the utility and perform a comparative analysis. The Water Law Act doesn’t specify the range and the methods of comparative analysis. Currently (January 2018), the new regulatory body is in the creation phase and it haven’t approved any tariff proposals yet. Therefore, it is not possible to indicate the benchmarking methodology which will be used by Polish Water. Polish law doesn’t determine any benchmarking systems and methods for comparative analysis on a national scale. The municipality and regulatory body can obligate water utilities to use benchmarking tools in the “Collective water supply and sewage regulation act”.
Comparative analysis in Poland is also conducted by the “Polish Waterworks” Chamber of Commerce (an association of water utilities) as voluntary benchmarking [
14]. This project has been running for 6 years, in 2015, 145 water utilities participated in this project. They represent 7,7% of Polish water utilities operated: 17% of water network lengths and 30% of sewer network lengths, supplied water for 60% of households and collected sewer from 57% of households. During the benchmarking process 35 indicators were calculated divided into four groups: operation (7 indicators), investment and reparation (4 indicators), environmental (11 indicators), financial (13 indicators). A few of Polish water utilities took part in the international benchmarking projects, e.g., IBNET (36 utilities) [
4], European Benchmarking Cooperation (4 utilities) [
5].
2.4. Slovakia
The operation of water utilities in the Slovak Republic (SR) is regulated in several areas, mainly in the areas of environment and the health of the population. Joining the EU, SR has a duty of complying with European legislation. Not only European legislations, but also the national regulations are valid in the SR. In the field of drinking water issues, which affect the activities of water utilities under the authority of the Ministry of Health of the SR and the Ministry of the Environment of the SR, were approved, for example: Act No. 442/2002 Coll., Decree No. 217/2011 Coll., Decree No. 247/2017 Coll., Decree No. 124/2003 Coll. and other important government laws and regulations. There are no regulations for the assessment of water systems and facilities in the SR. In 2005 Water Research Institute (WRI) published the methodology “Methodology of water loss assessment in public water supply systems in the SR”, based on the materials published by the International Water Association IWA. Using this method, unified terminology for recording of losses and a uniform way of balancing water was put into the practice, which is valid for all water utilities in Slovakia [
15].
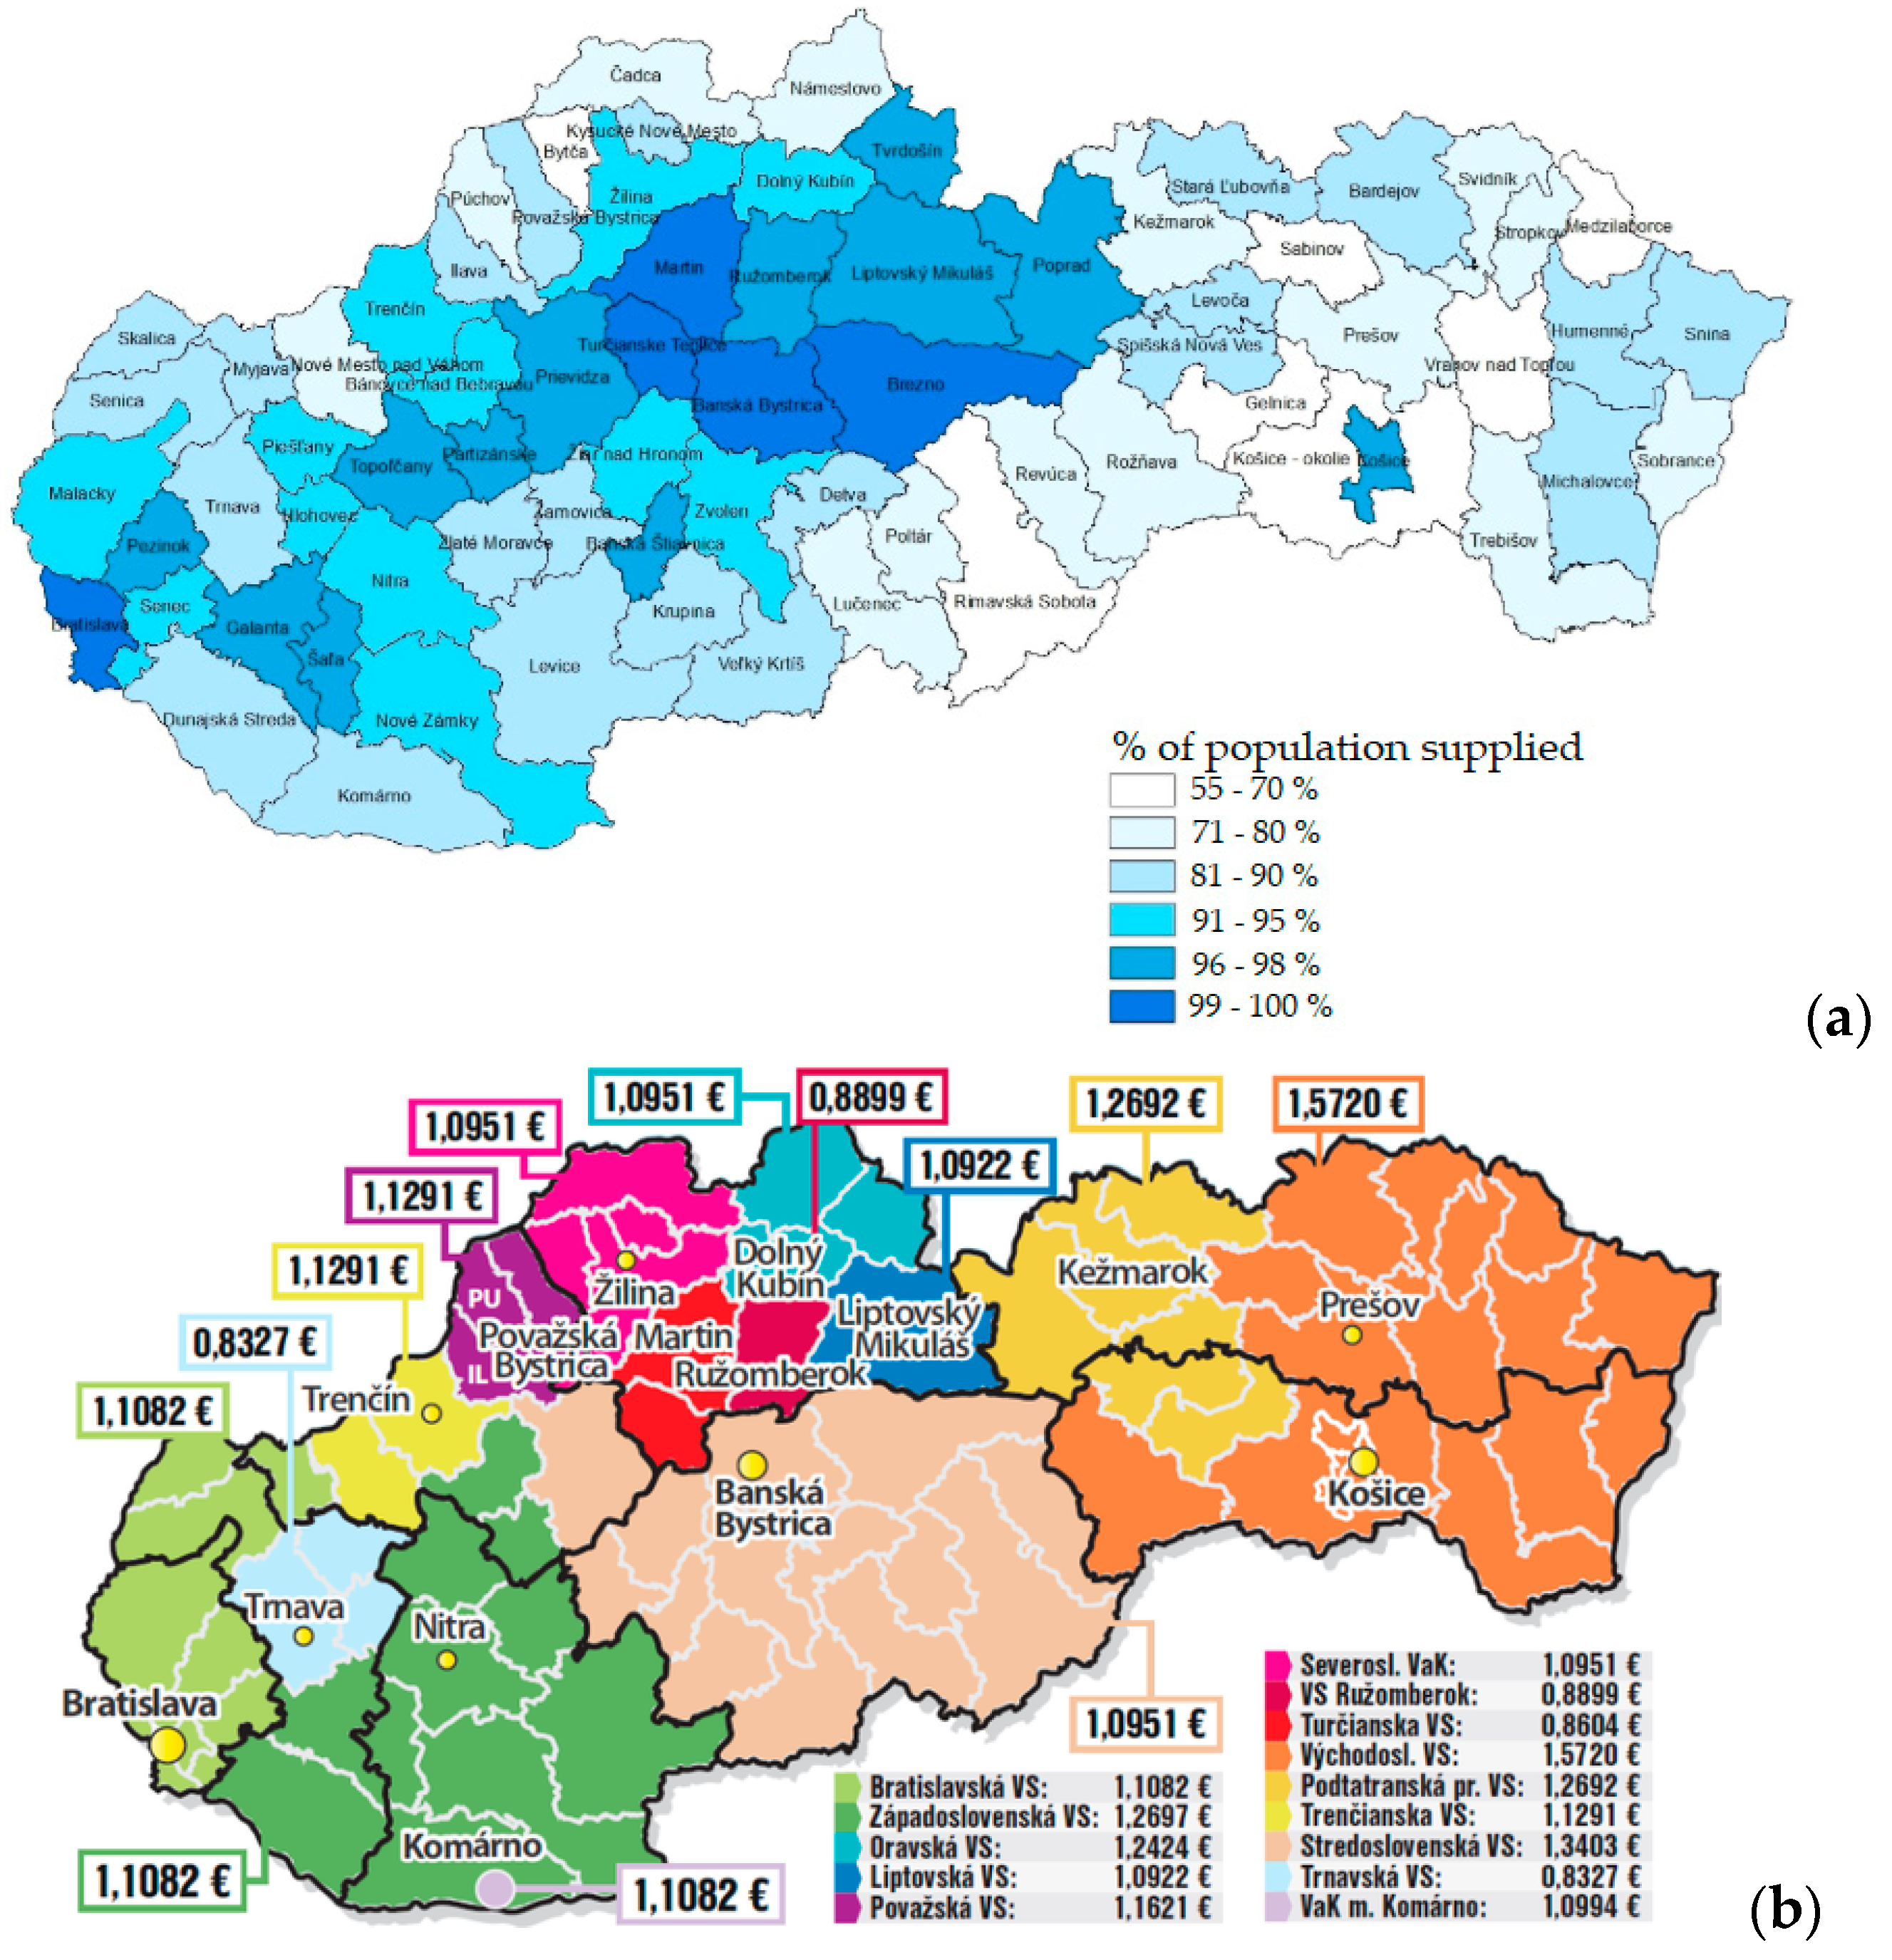
In present, the operation of water supply systems is ensured by 16 water utilities, which are divided into individual regions as it is marked on
Figure 2b, there are 12 mixed utilities and 2 pairs of separate ownerships and operating utilities. Water utilities are centrally managed by the Association of Water utilities (AVS), which is in charge of making it easier to operate and to solve social problems.
Water utilities are required to provide data on water balance, selected technical indicators of water mains and economic indicators of operators to Water Research Institute (WRI). WRI retains this data in the database and serves as the basis for the balances, which are subsequently published in the reports of the state of water management. The Ministry of the Environment of the SR and the Public Health Service are responsible for their accuracy.
On the territory of Slovakia there is the largest natural reservoir of groundwater in Central Europe called Žitný ostrov, with an accumulation of 15 million m
3. The usable flow from this of reservoir is 24.8 m
3.s
−1 [
16]. Drinking water supply in Slovakia has continuous growth, although it is far behind the other European countries. In 2016, approximately 88.6% of population was supplied from the public water, and 11.4% of its own wells as it can be seen on
Figure 2a, where the dark blue colour represents water coverage >99% when the white colour represents coverage <70% [
17].
3. Comparative Analysis
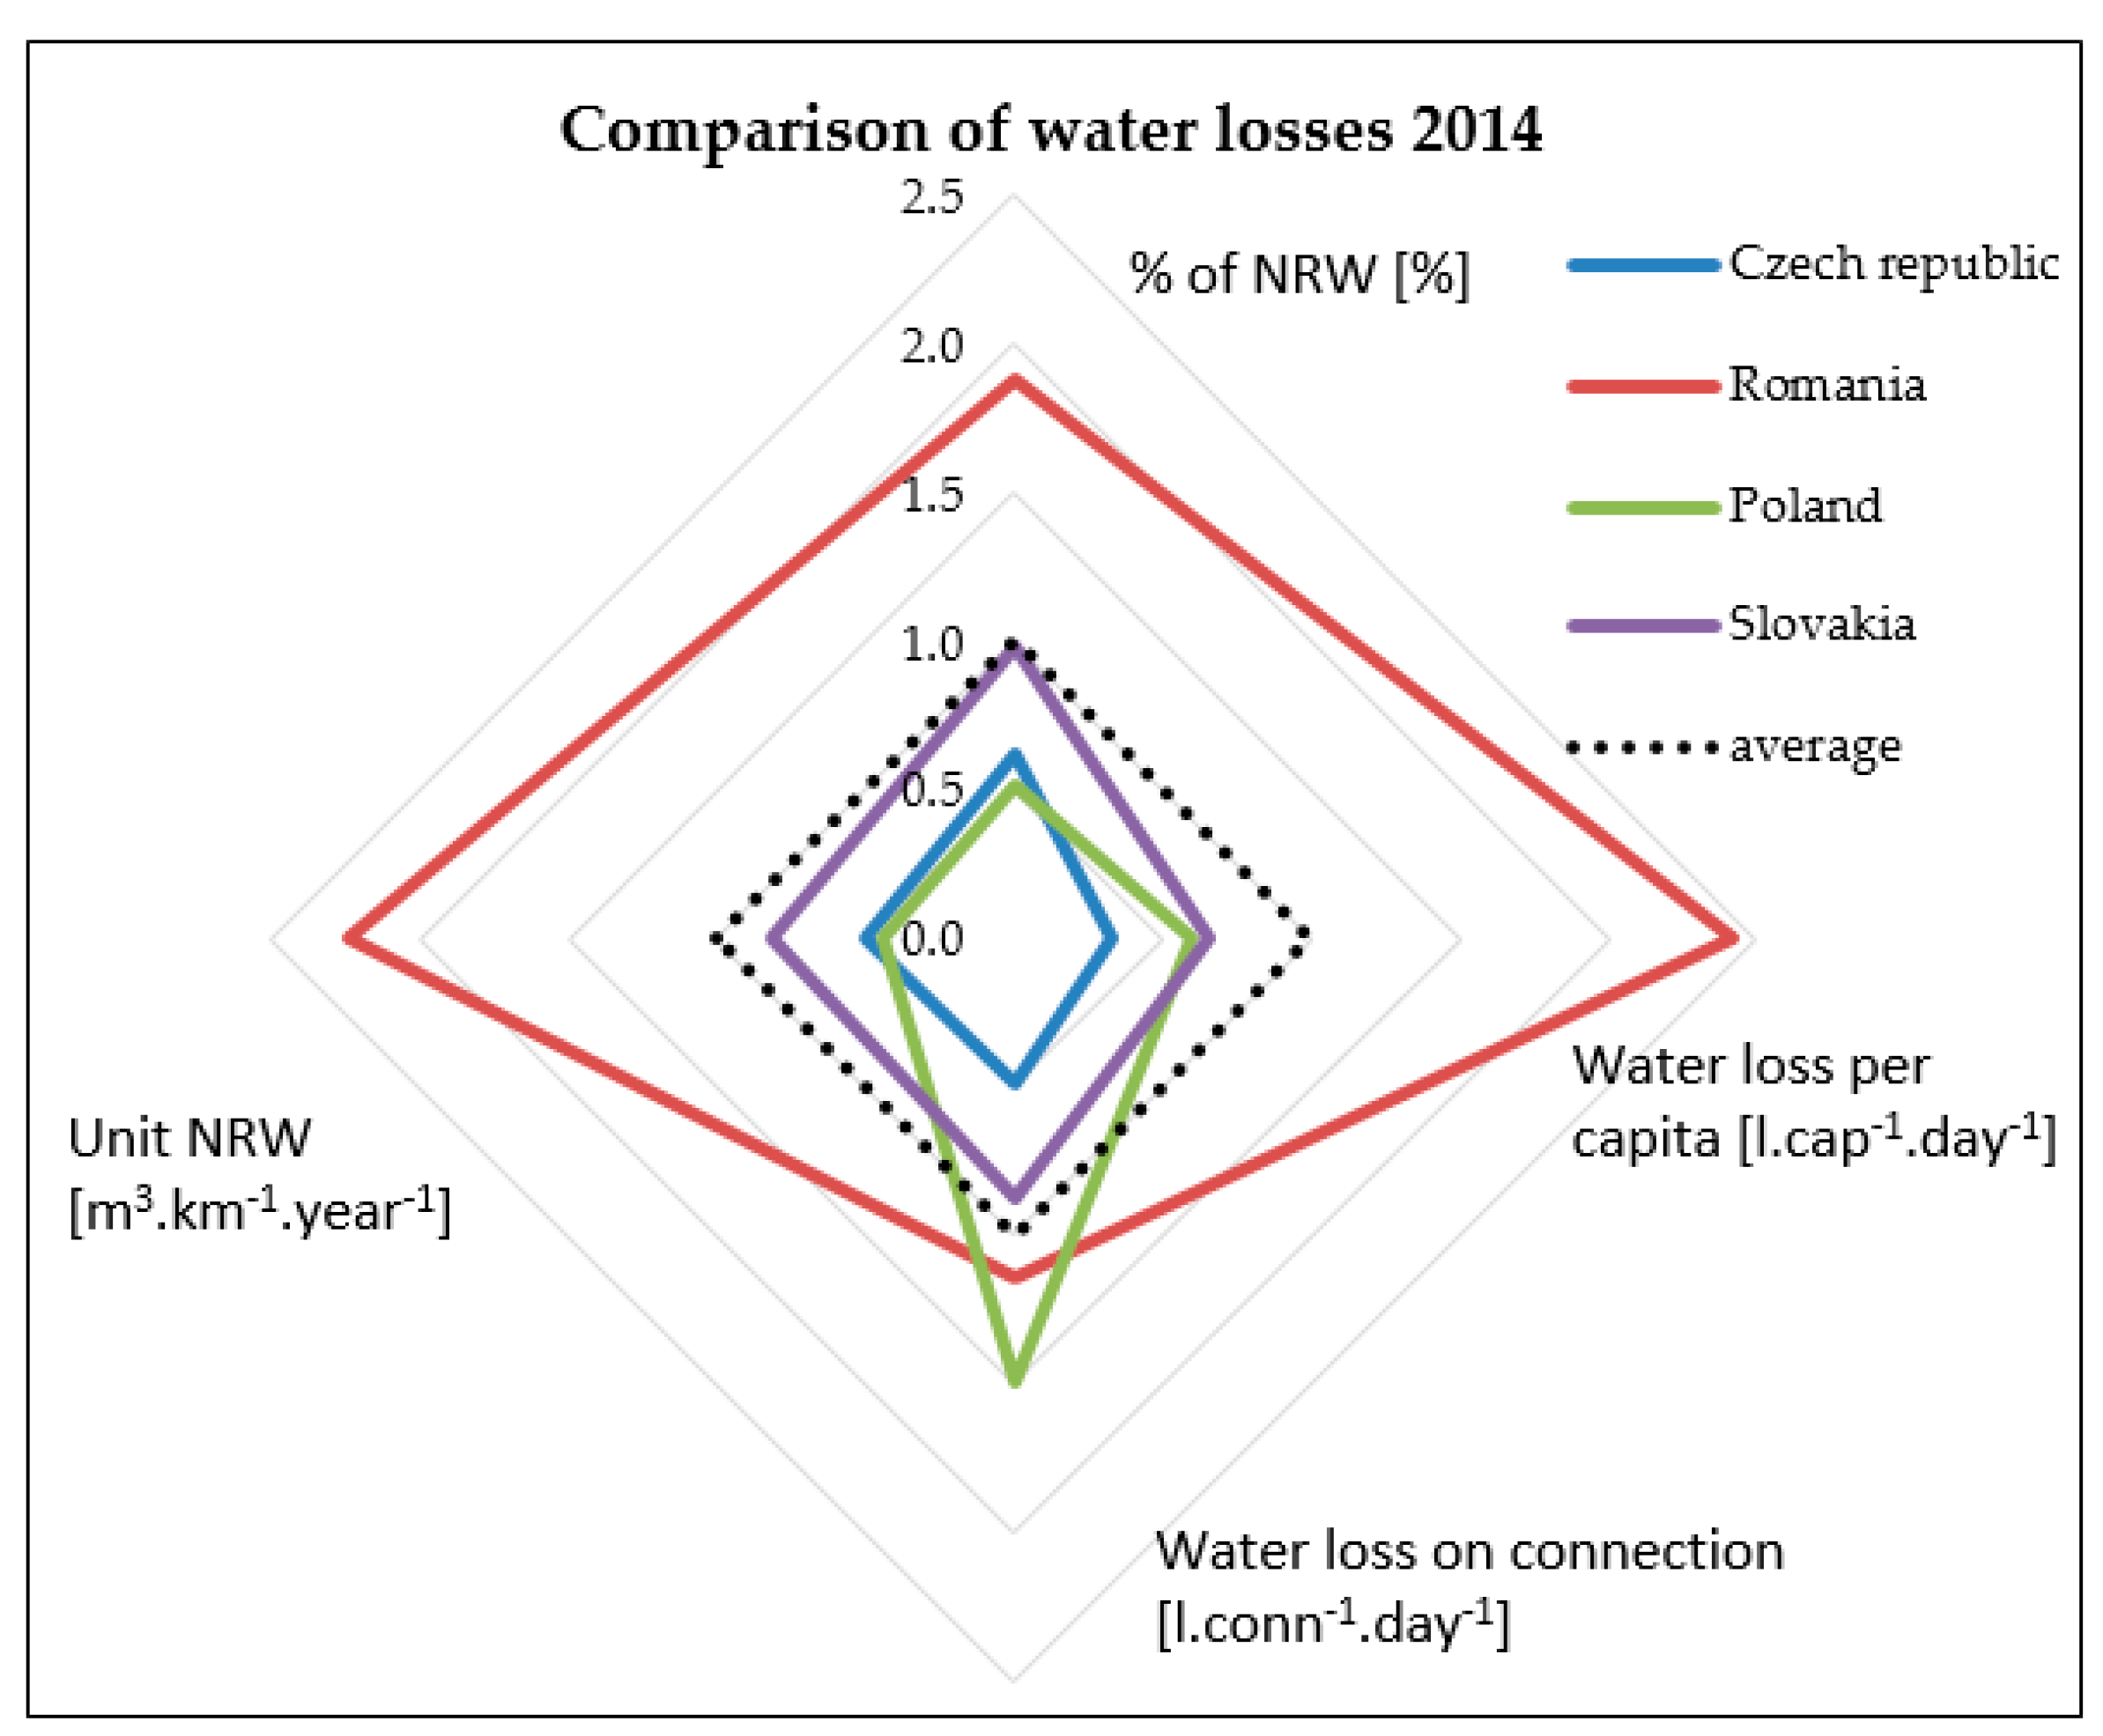
In the comparative analysis, the greatest attention was paid to water losses, as it is one of the biggest problems in water supply worldwide. The issue of water loss is a broad concept, but here it is narrowed down to its reporting, respectively the complexity of its reporting. It is a well-known fact that reporting water losses only in percentages of water produced does not always provide objective results. The assessment and reporting of water losses should be, for example, according to [
18] multicriterial. Four water loss indicators are selected here that allow the multicriterial assessment of losses. Even despite the fact that not all of these indicators are used to report water losses in the countries concerned. All 4 indicators are determined from the publicly available values (and thus the data already provided by the operators). These 4 indicators for assessing water losses are: percentage of the water produced, unit non-revenue water “UNRW”, the loss of water on the connection and the loss of water per capita.
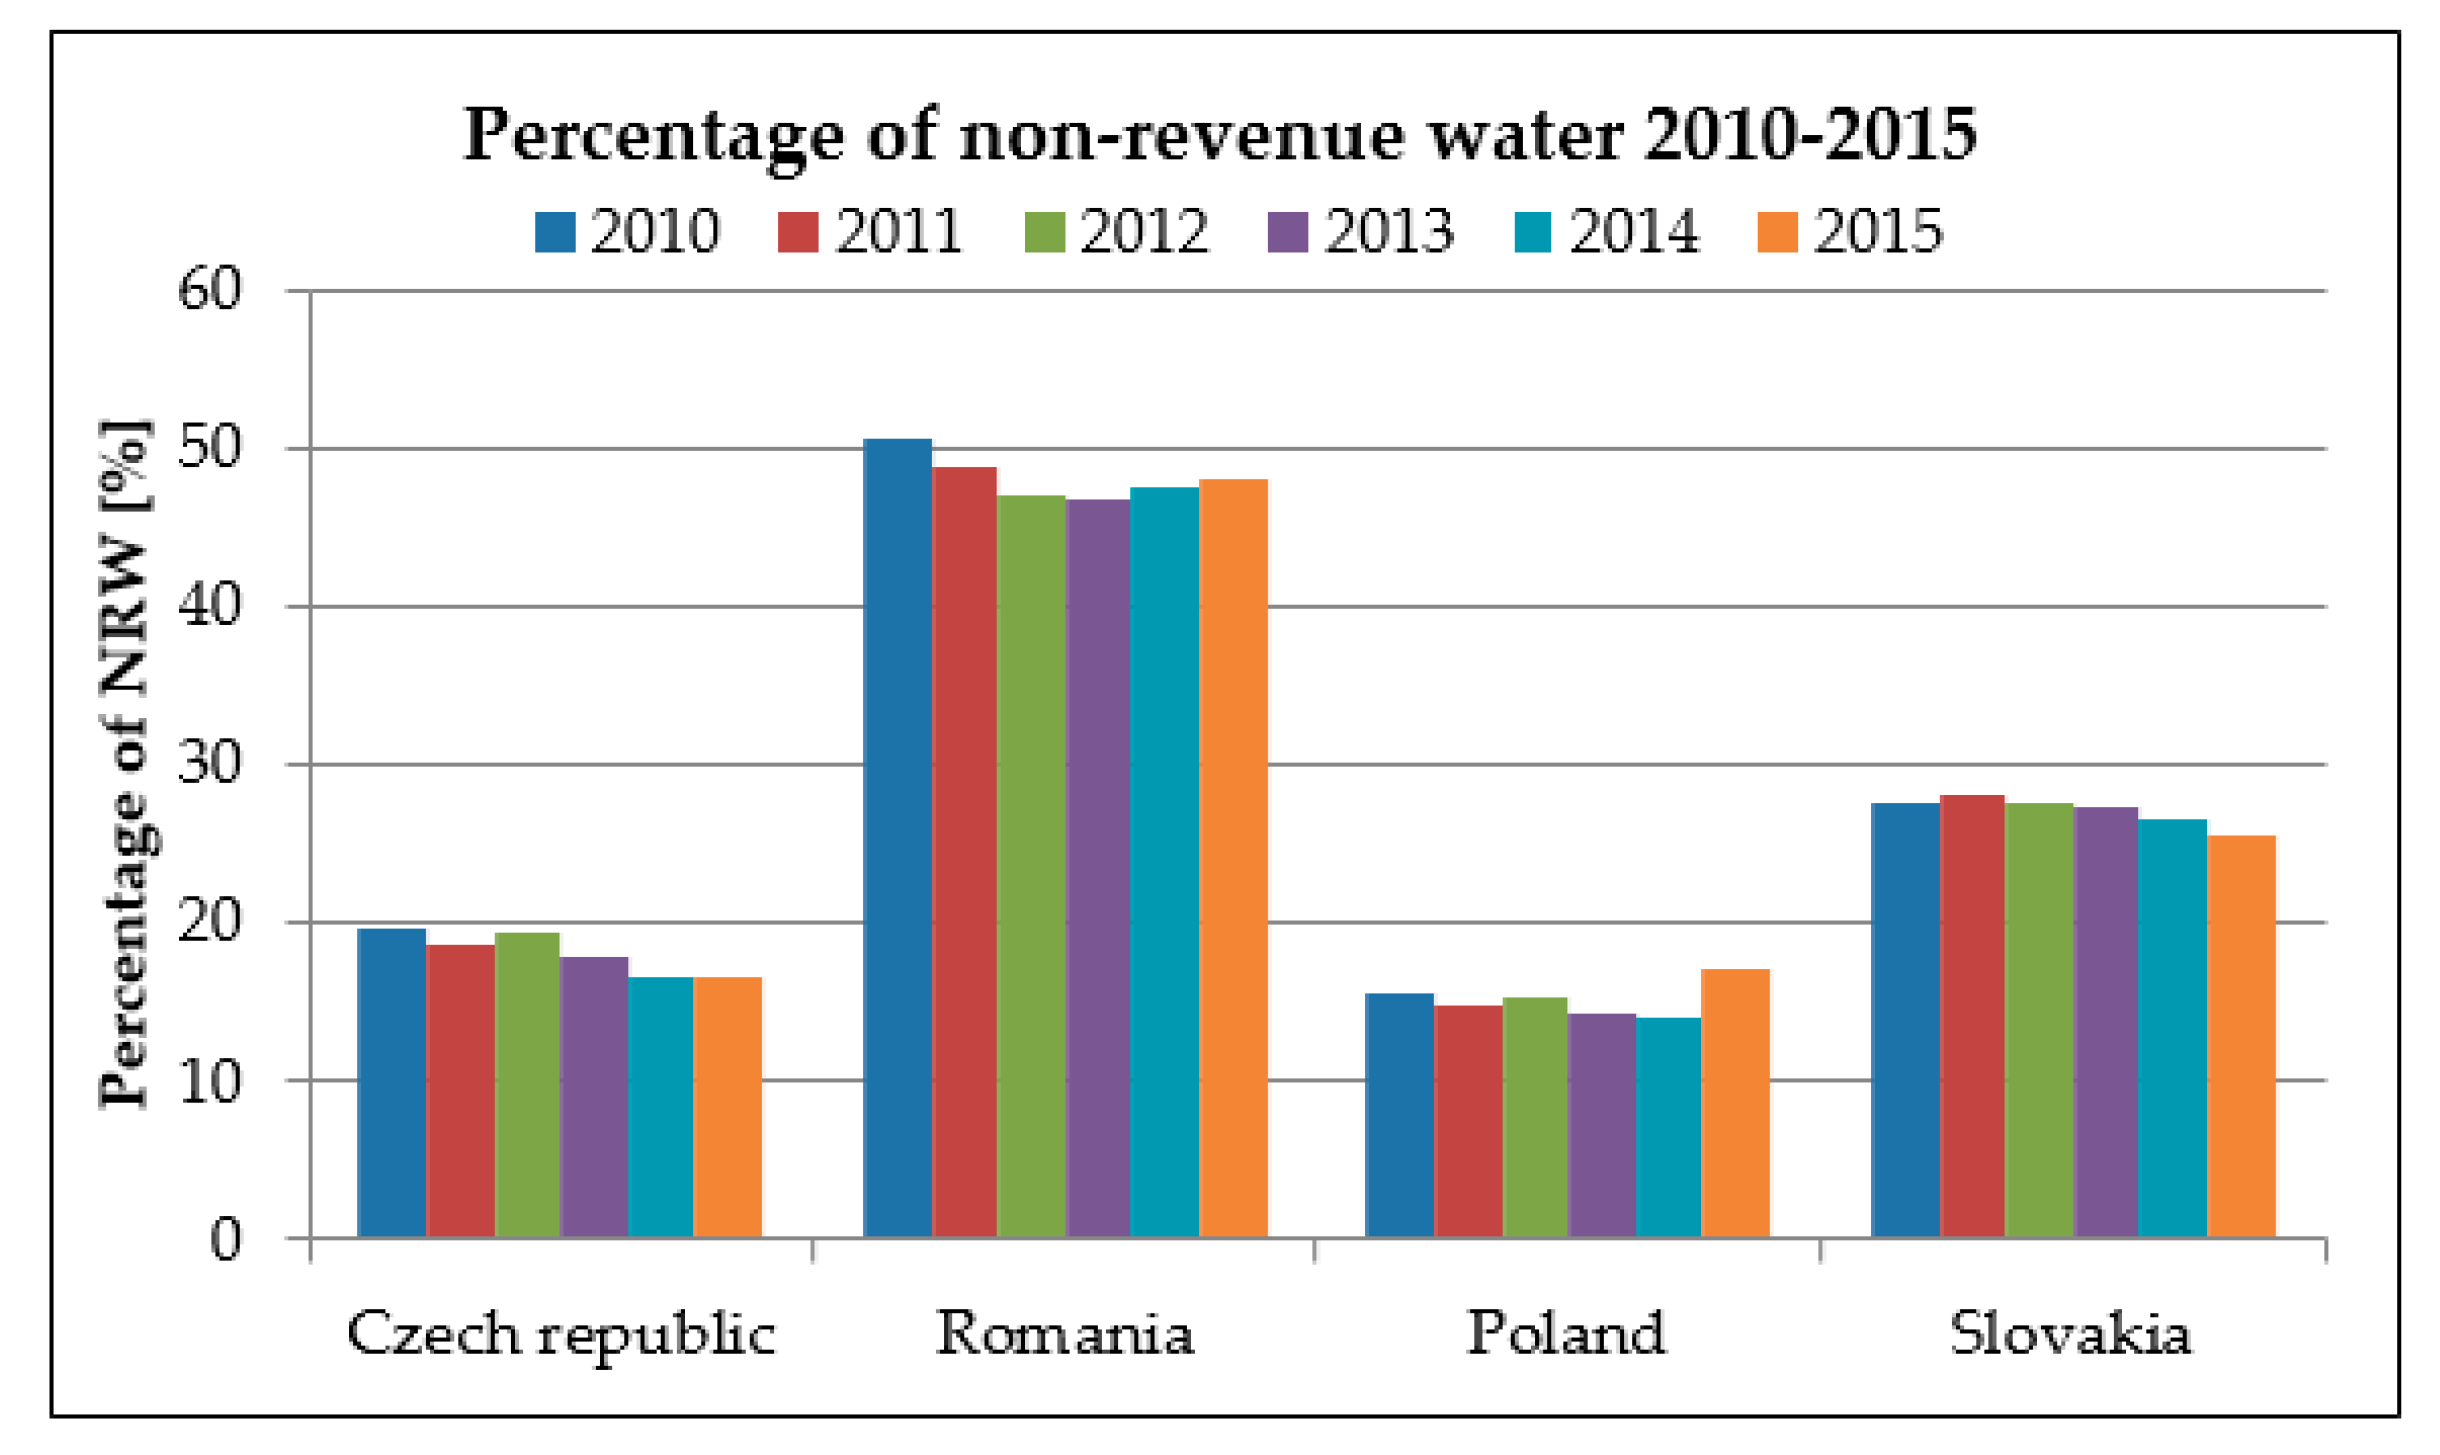
Results presented in
Figure 3 and
Figure 4 have different data sources: CZ [
7], Romania [
8], Poland [
4] and Slovakia [
17].
It can be seen from
Figure 3 and
Figure 4, that when water losses are reported in more ways than just a percentage of the water produced (or percentage NRW of SIV), the results are different, and the system, respectively, the national average with relatively high water loss percentages can achieve better values and evaluation in other indicators for example in water loss on connection for Romania is value relatively better than for Poland. But on the other hand other indicators for Poland are much better than for Romania. Otherwise, if the water loss reaches several indicators of poor value, it is confirmed that the water loss results in really insufficient values and the current state should be improved.
4. Discussion
The problem of benchmarking for all operators in the CZ is their number and size. The number of operators is >2700, with the 50 largest operators supplying approximately 90% of the total revenue water. There is therefore a large number of very small operators, which often lack the professional and technical level, which causes problems with data collection from all operators. However, this does not apply only to small operators. In 2015, the first standardized benchmarking project was carried out, where 1437 operators were evaluated supplying about 1/3 of the total volume of revenue water. This confirms the problems with data collection even from the largest operators. For 2015, the division of benchmarking indicators into four groups of indicators was valid–Basic (10 indicators), Operating (10 indicators), Personnel (4 indicators), Economic (7 indicators), in total 31 indicators.
In Romania all the utilities are regulated by the National Regulatory Authority for Community Services of Public Utilities in terms of water tariffs and water losses. Unfortunately, the only indicator that is taken into account is the non-revenue water “NRW” expressed as percentage of system input volume “SIV”, although the water utilities calculate other water loss indicators as well. Although the water utilities are responsible for the data, their regulator body imposes an external water balance audit in order to validate the information.
In Poland, there are no water utilities benchmarking results available to the public. Data from benchmarking which was conducted by “Polish Waterworks” Chamber of Commerce is available for the water utility which took part in the project. General information about financial and technical indicators can also be found in the tariff proposals which are available to the public. Basic information about water utilities (such as: service coverage, amount of water intake etc.) is also available in “Local Data Bank” which is a web-based tool created by the Central Statistical Office [
19]. “Local Data Bank” is available for public, but their range is limited. The data in the Data in “Local Data Bank” is statistical and don’t refer to the performance of a water utility, but using this data allows for calculating of a few of the performance indicators.
In Slovakia, the benchmarking of water utilities is still under development, for now there is only a methodology that can be used by water utilities. The main problem of benchmarking is the lack of experts who would be interested in this problem, and the technical conditions of the water supply facilities, which affects the loss of water in the water supply system.
5. Conclusions
This article focuses on the benchmarking of water systems and their operators and the related legislation in the countries of Central and Eastern Europe—the CZ, Romania, Poland and Slovakia. The attention has also been paid to water losses and the way they are reported. Based on a detailed examination of the legislative requirements, it was found that in all countries the water losses within the individual states are assessed mainly by the percentage of the water produced. However, the assessment by only this indicator is not objective, and it has been found that it is possible to report, respectively assess the losses in a more advanced manner. This means that it is possible to use more water loss indicators without the need to create an additional platform or an organization or to introduce other legislative requirements. This is very important since, as it was mentioned earlier, there are always problems with the data collection, which would not benefit from the increased amount of data that the operators are obliged to provide to state institutions.


