Metabolic Modelling: A Strategic Planning Tool for Water Supply Systems Management †


Abstract
:1. Introduction
2. Materials and Methods
2.1. Main Features of Watermet2
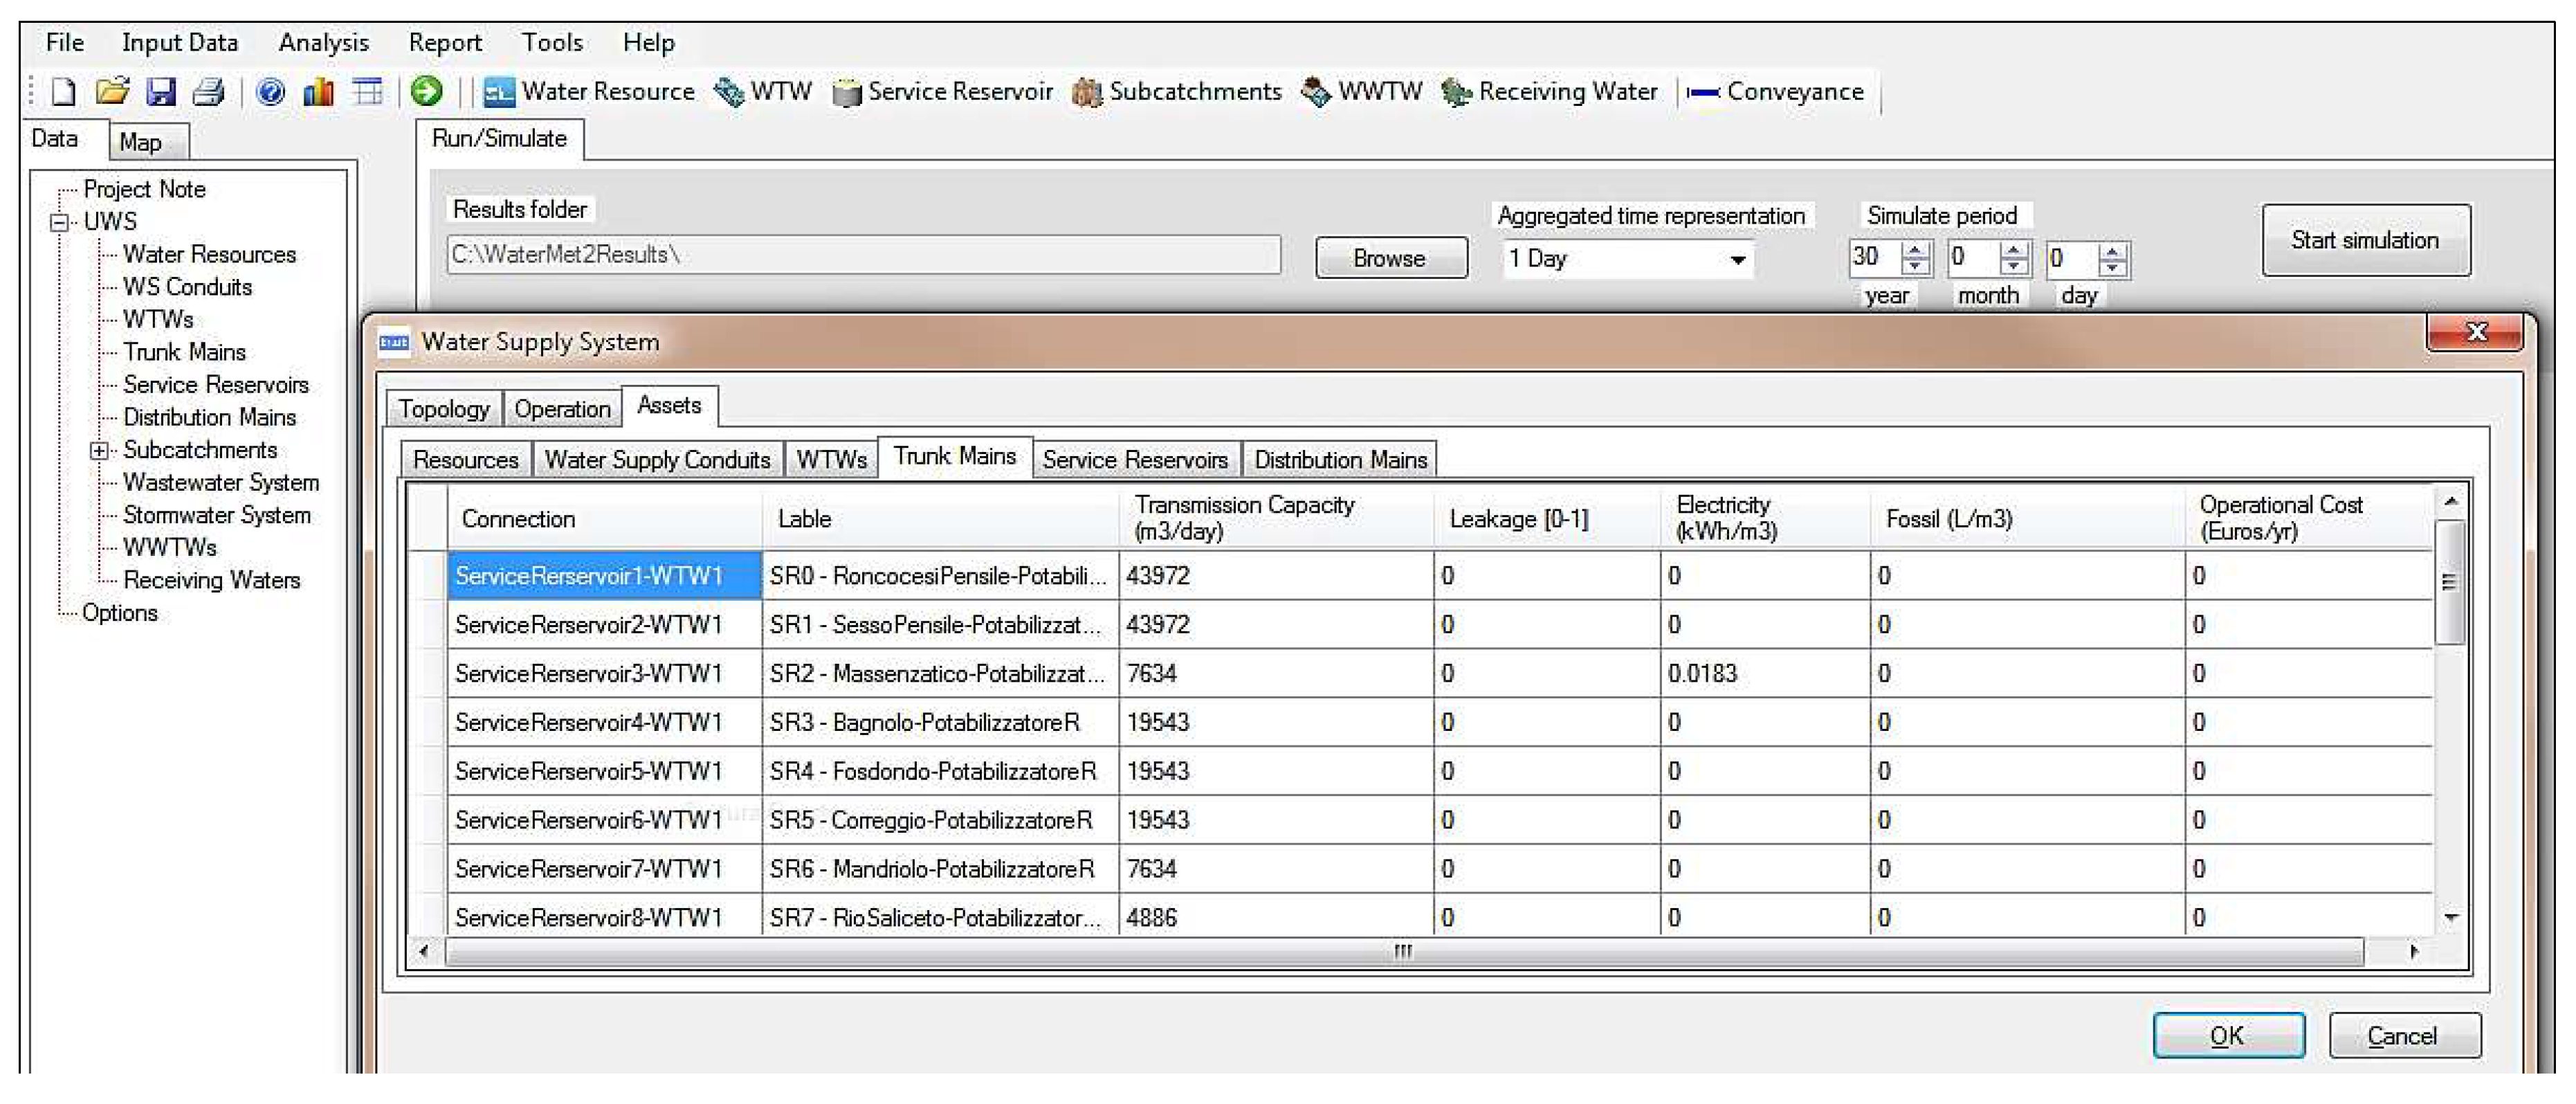
2.2. Graphical User Interface of Watermet2
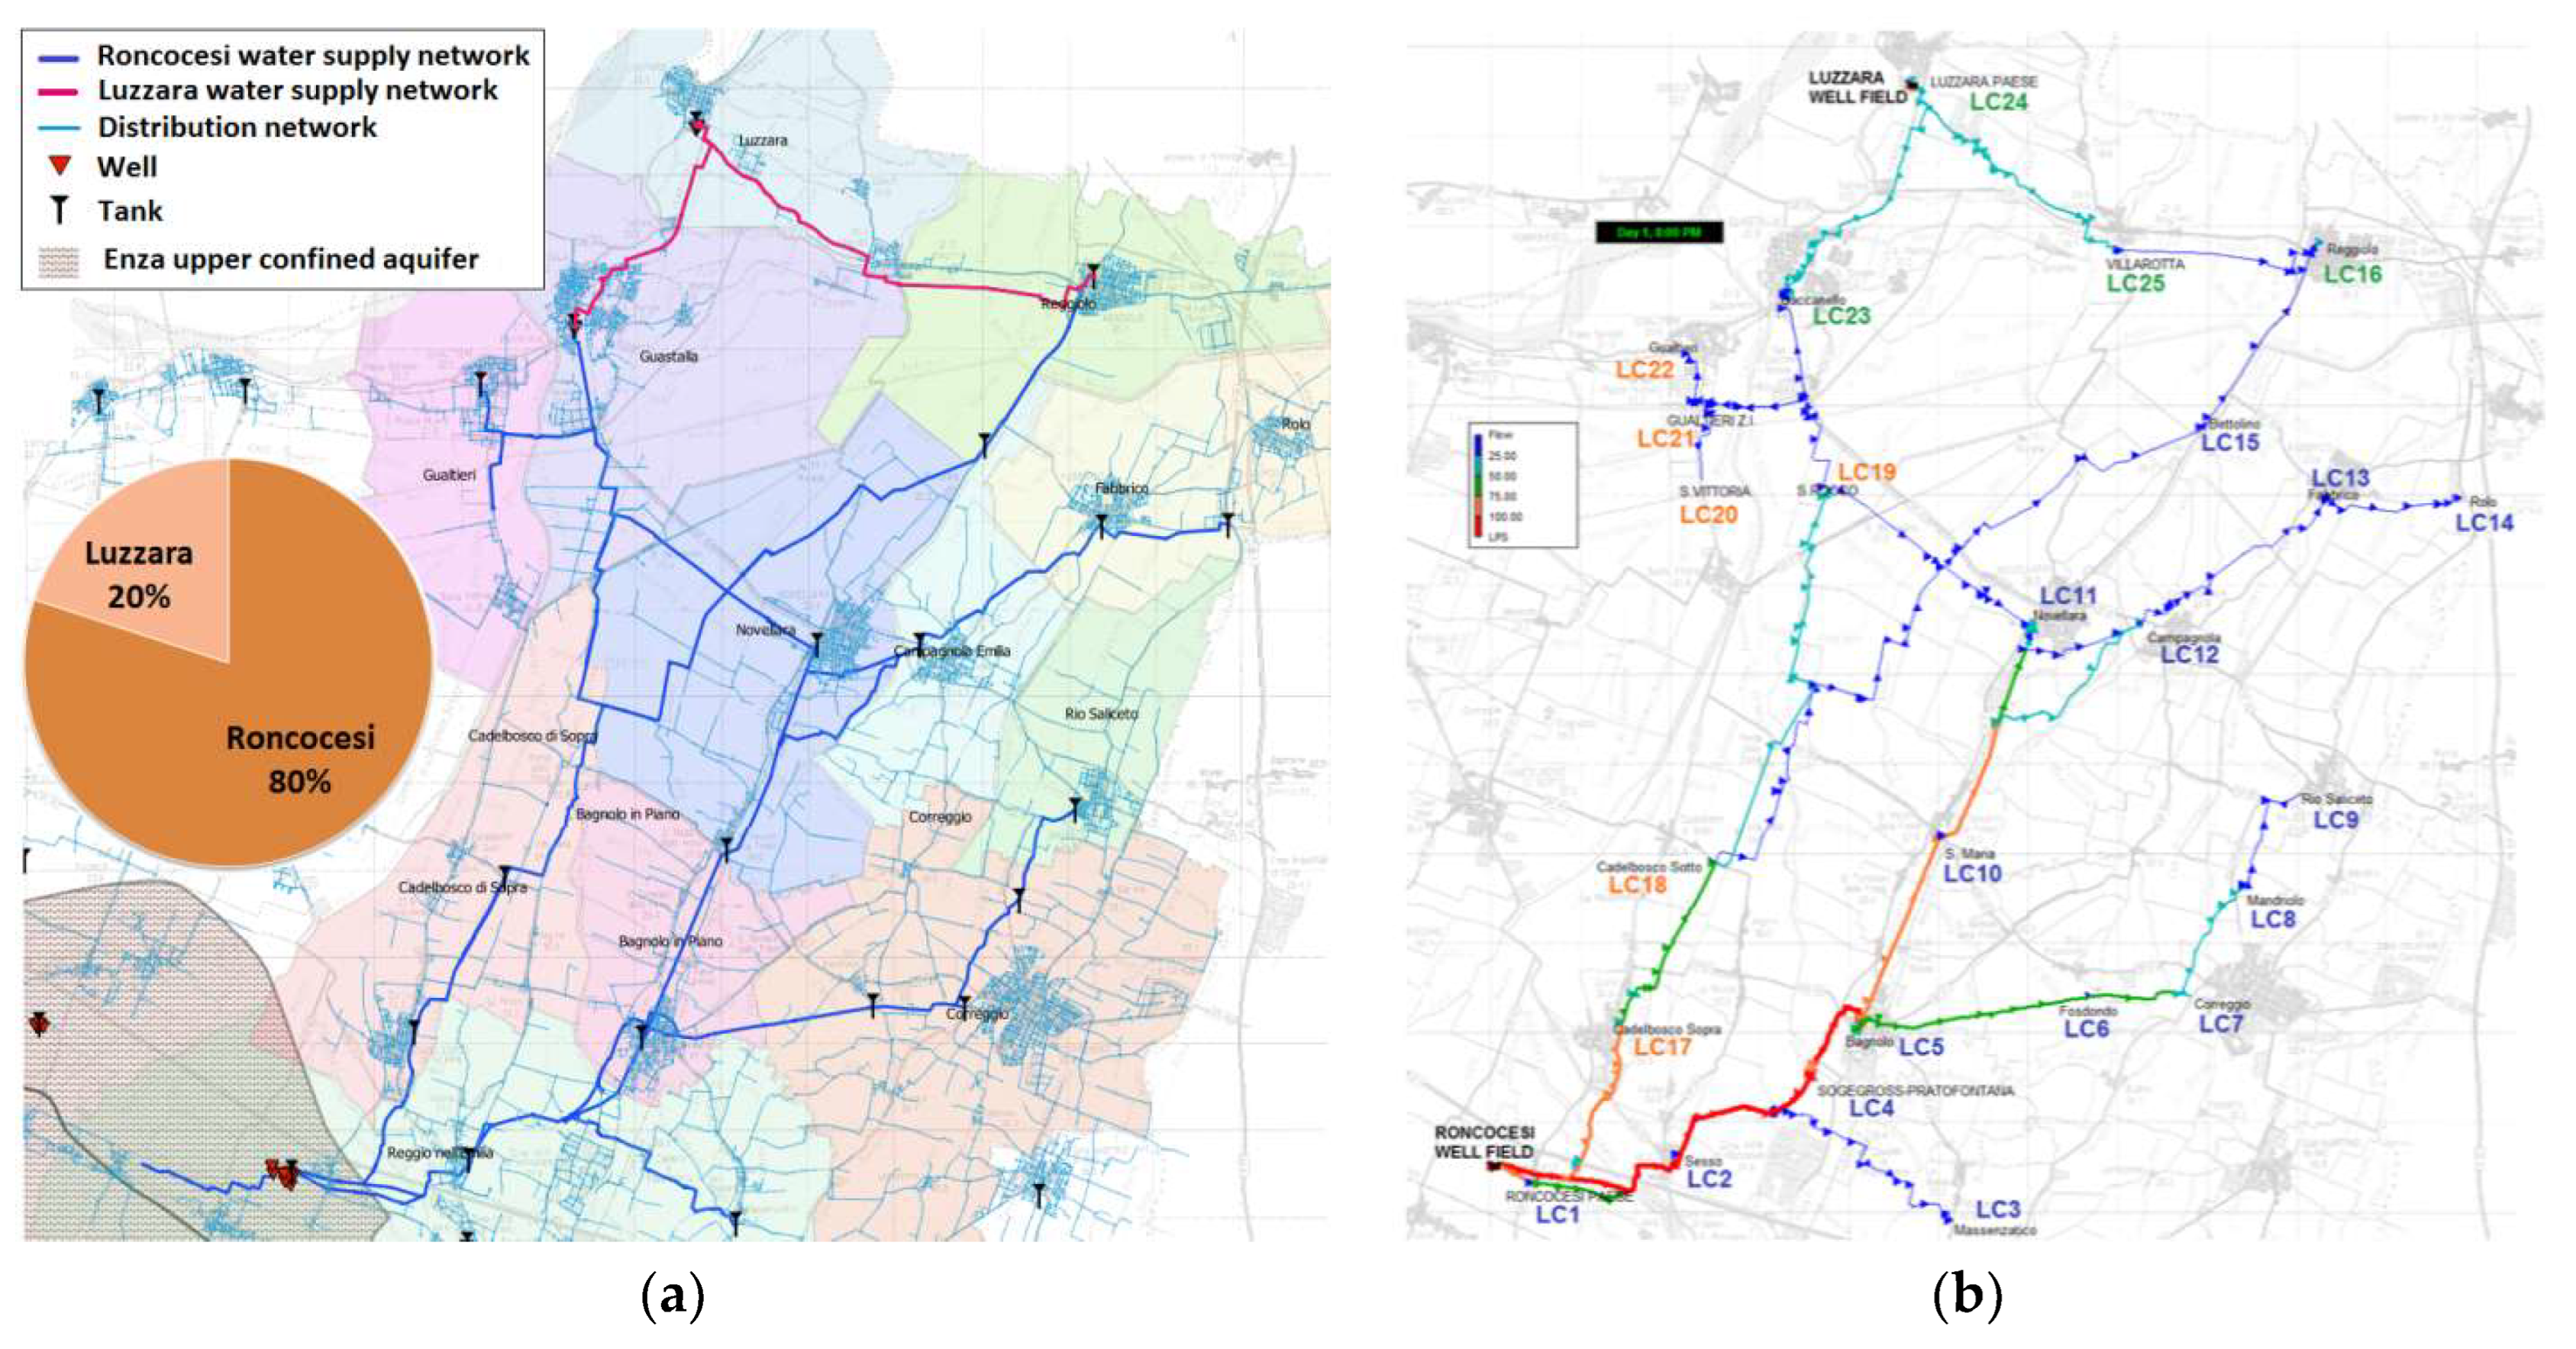
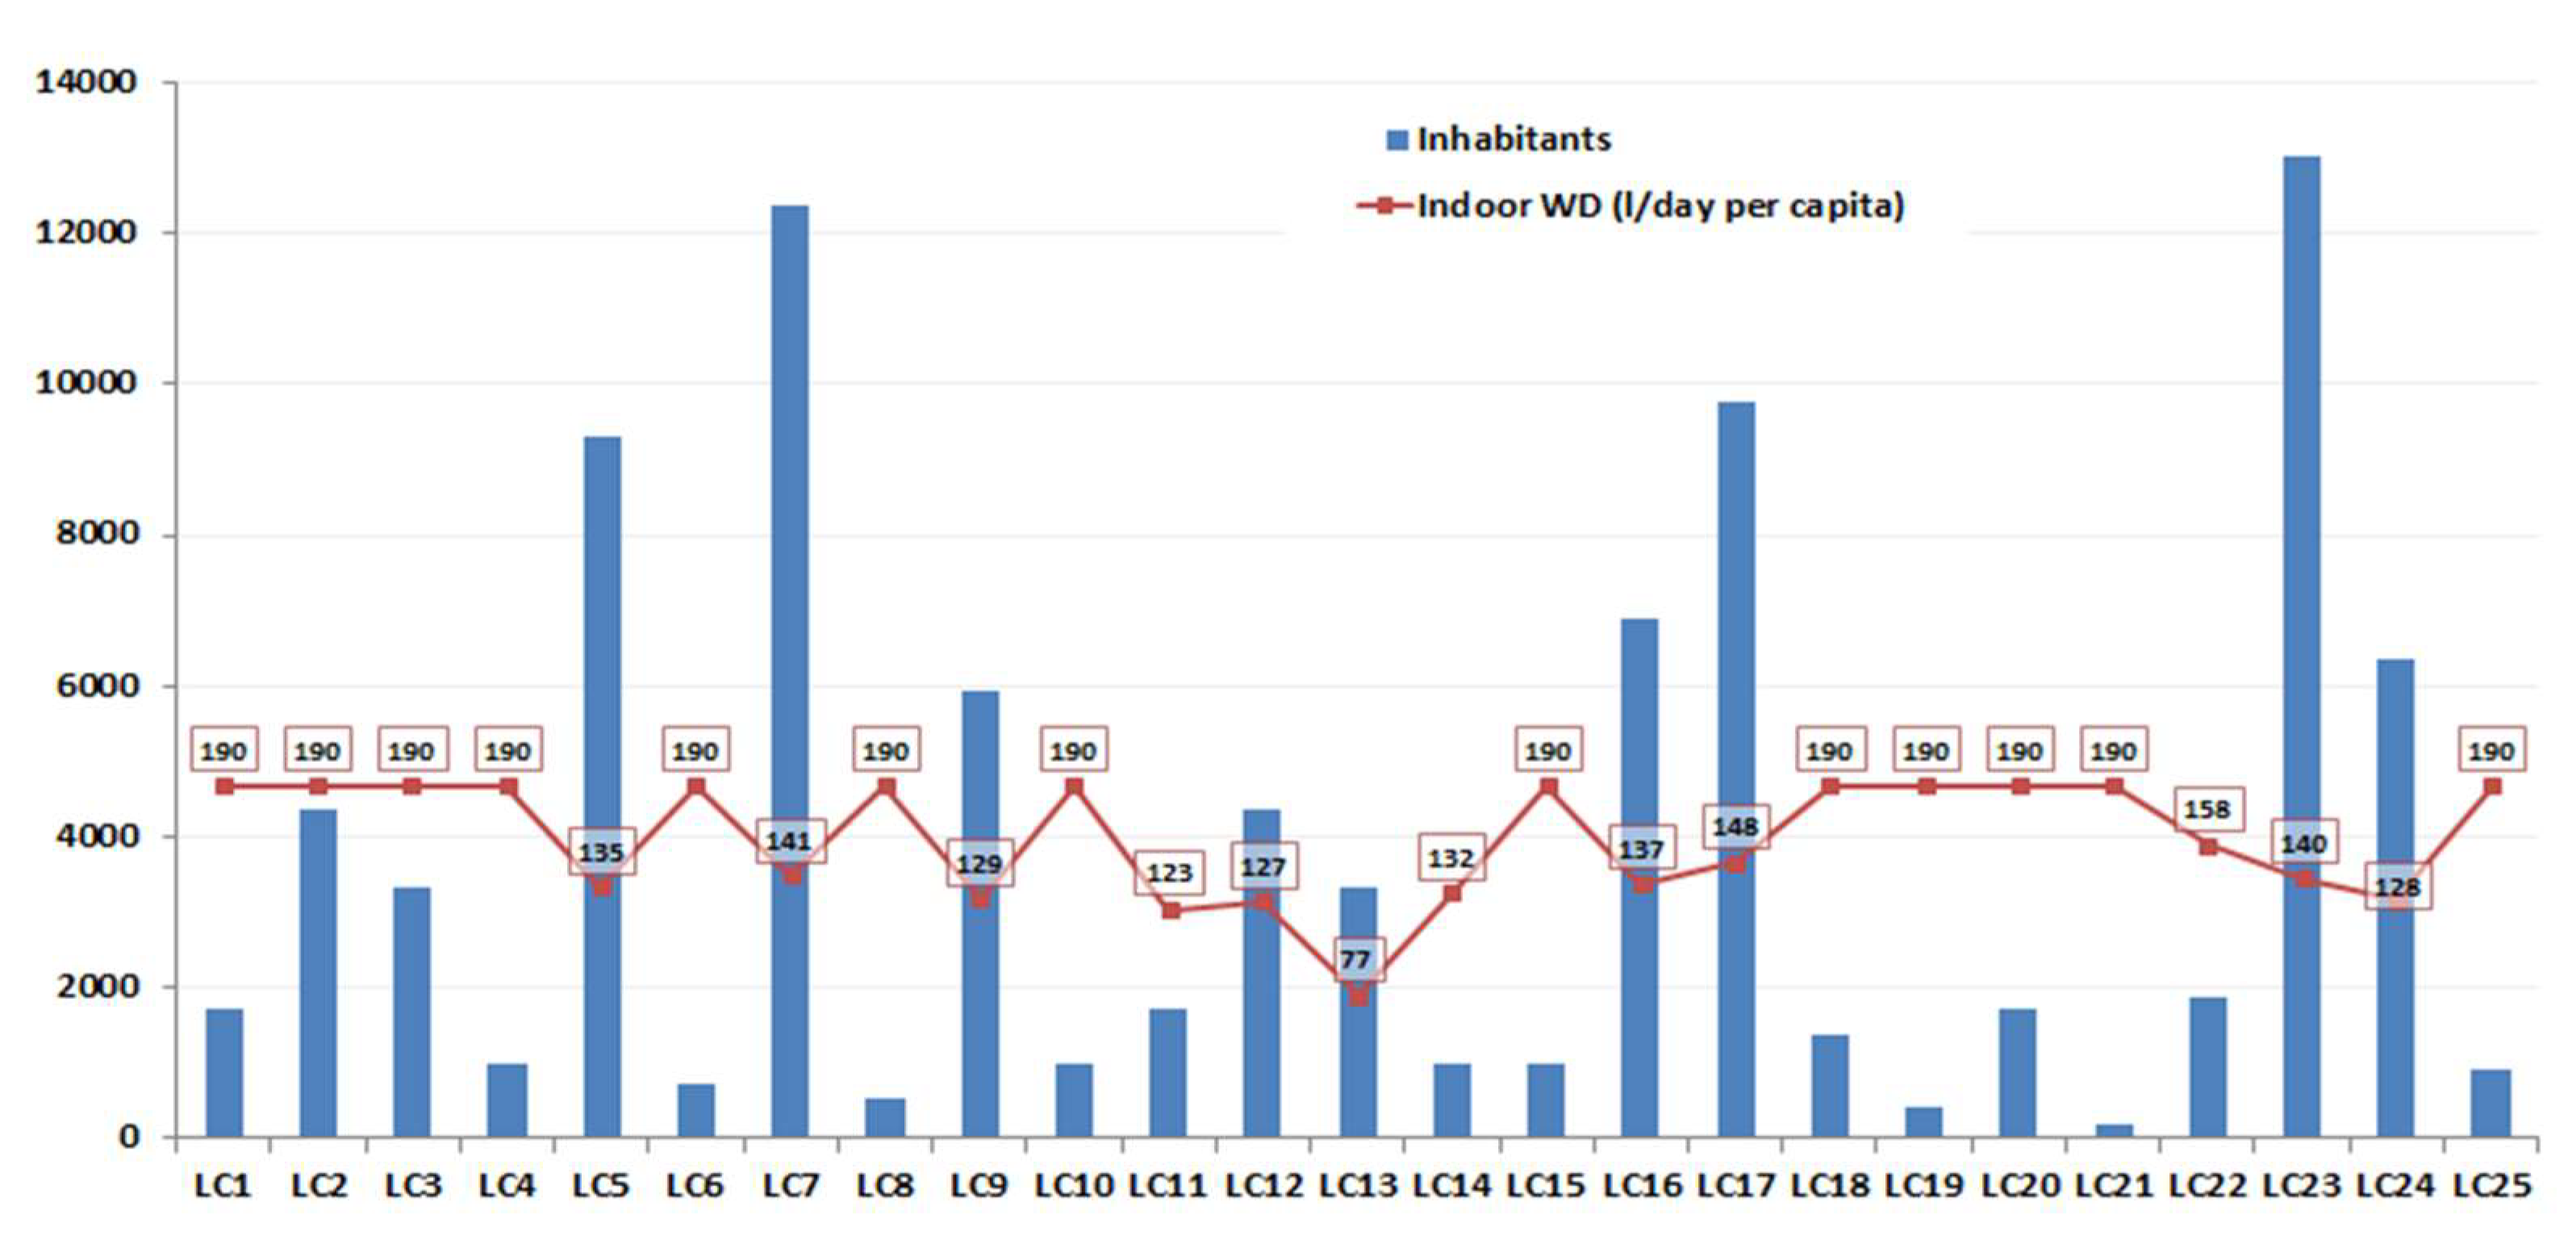
3. Case Study
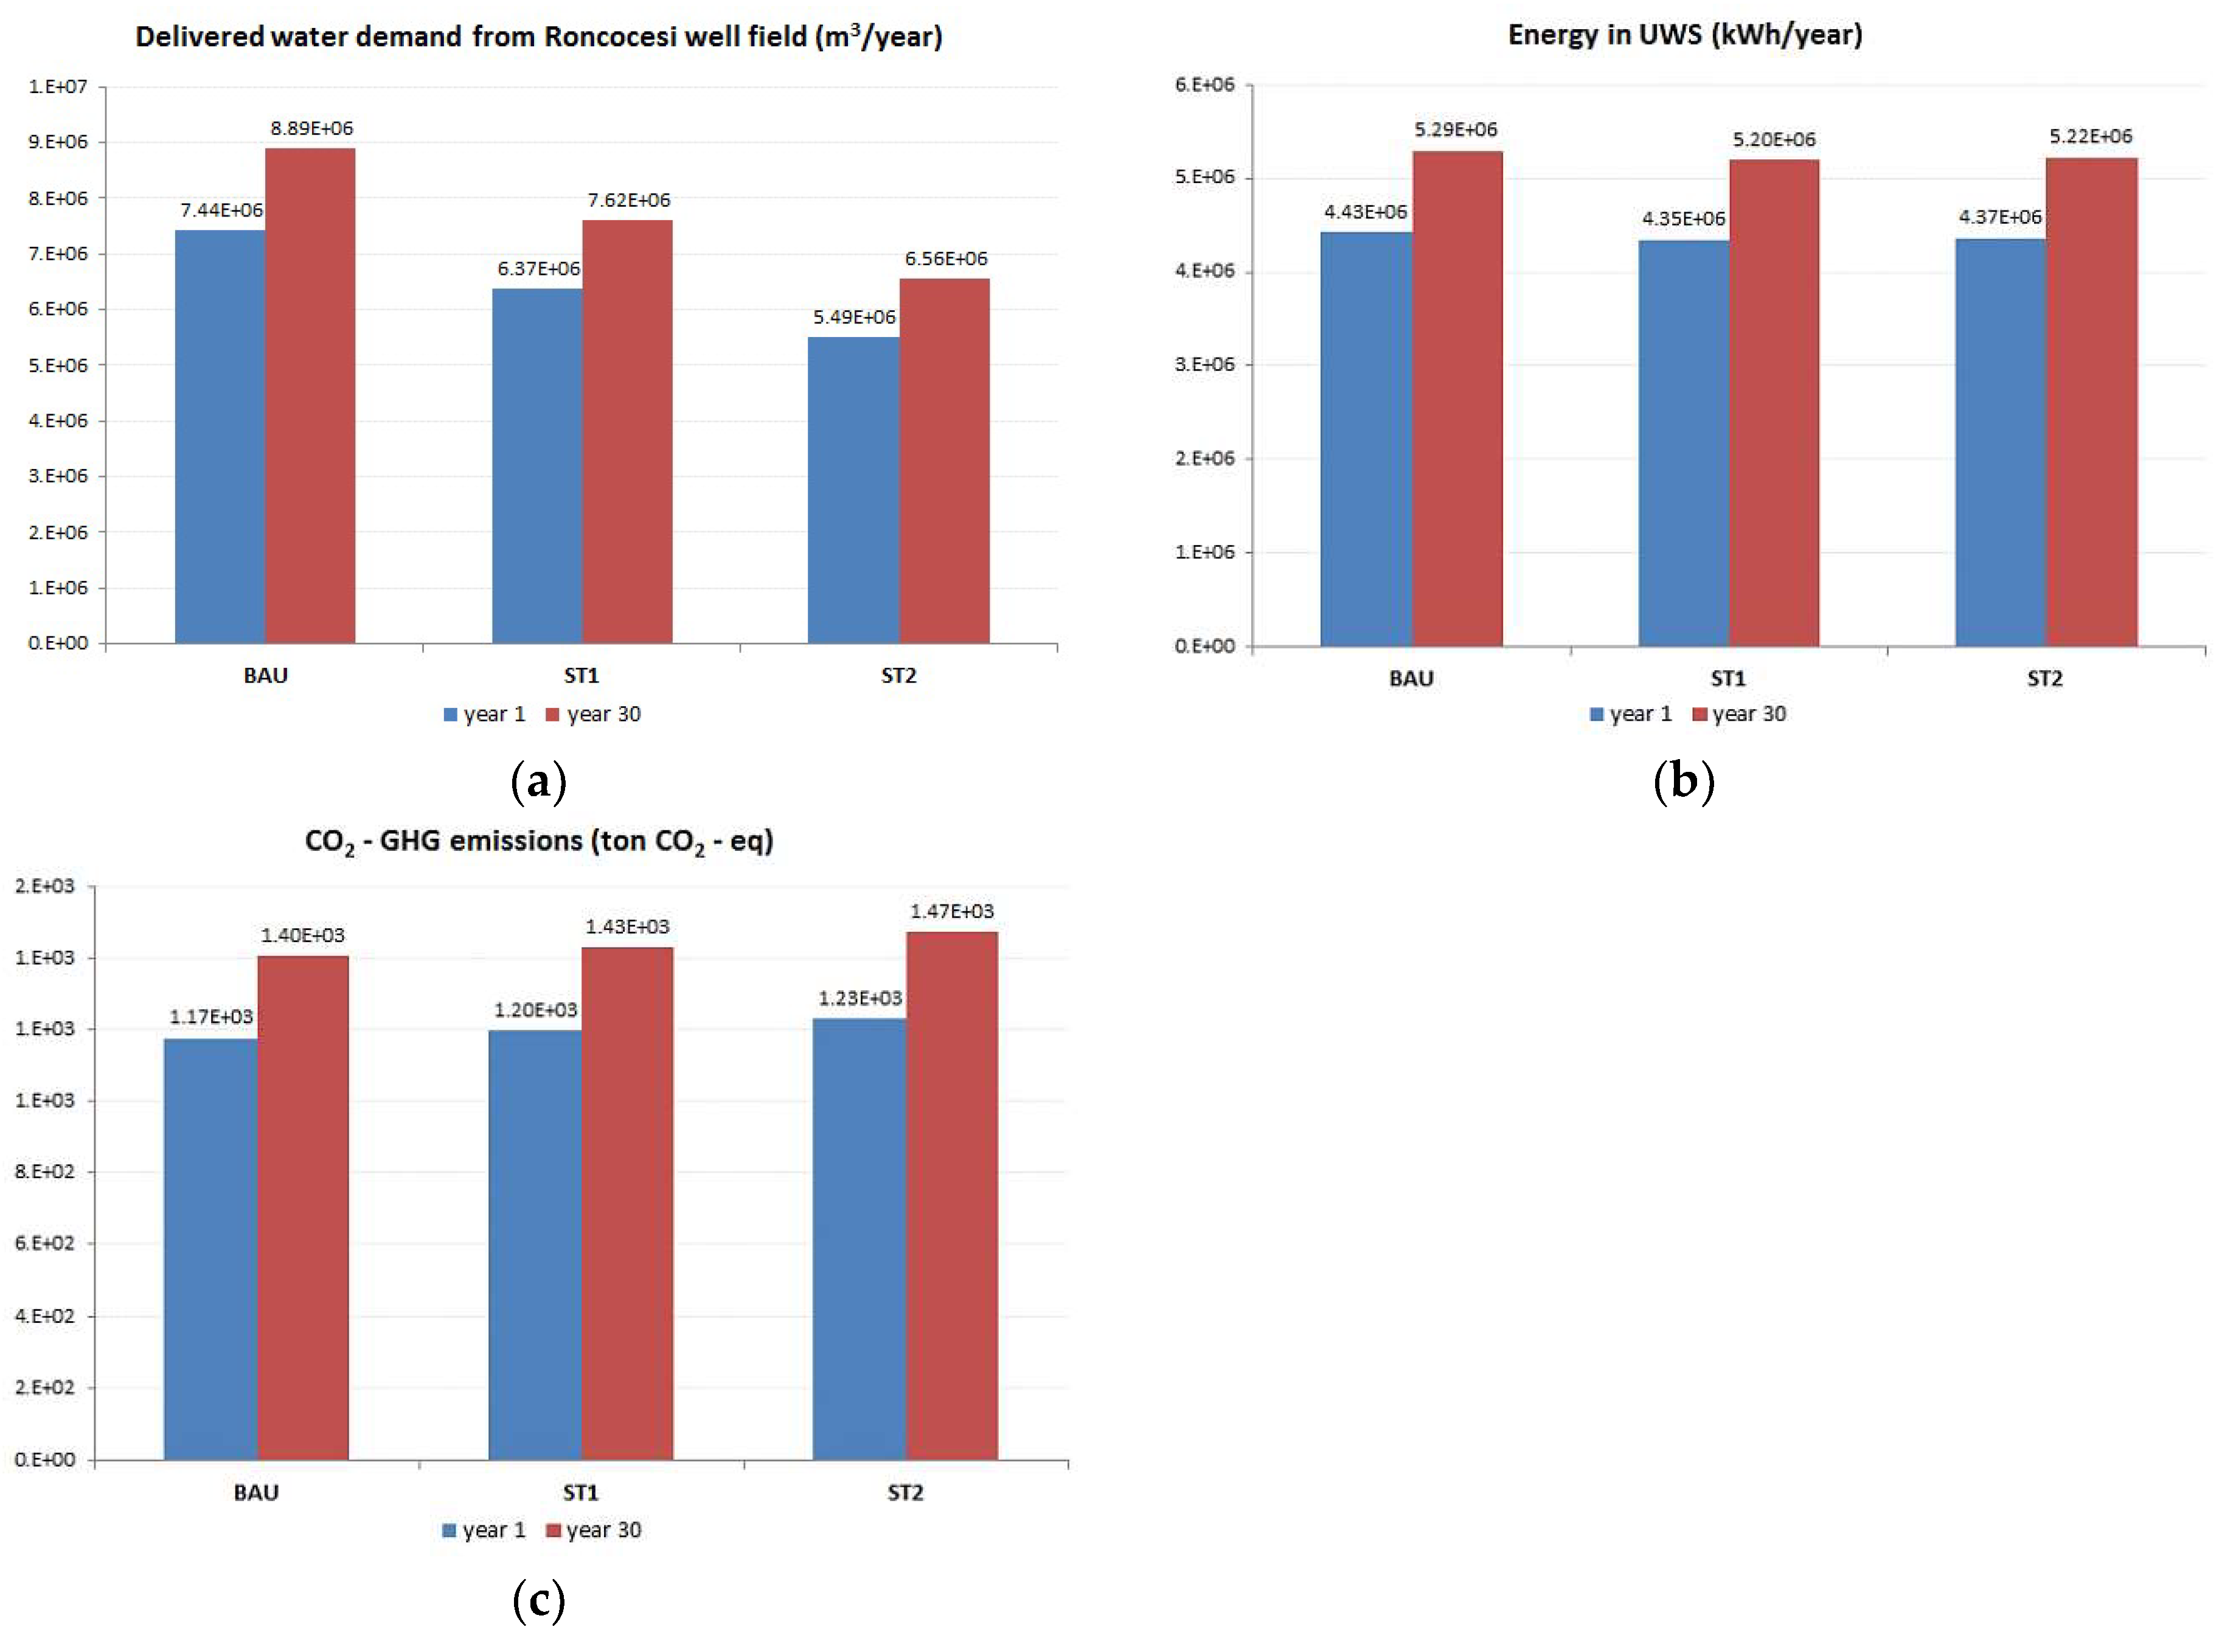
4. Results
5. Conclusions
Author Contributions
Funding
Acknowledgments
Conflicts of Interest
References
- Nair, S.; George, B.; Malano, H.M.; Arora, M.; Nawarathna, B. Water–energy–greenhouse gas nexus of urban water systems: Review of concepts, state-of-art and methods. Resour. Conserv. Recycl. 2014, 89, 1–10. [Google Scholar] [CrossRef]
- Barros, V.R.; Field, C.B.; Dokken, D.J.; Mastrandrea, M.D.; Mach, K.J.; Bilir, T.E.; Chatterjee, M.; Ebi, K.L.; Estrada, Y.O.; Genova, R.C.; et al. Climate Change 2014: Impacts, Adaptation, and Vulnerability. Part B: Regional Aspects. In Climate Change 2014: Impacts, Adaptation, and Vulnerability—Contribution of Working Group II to the Fifth Assessment Report of the Intergovernmental Panel on Climate Change; Cambridge University Press: Cambridge, UK; New York, NY, USA, 2014; p. 688. [Google Scholar]
- Kanakoudis, V.; Tsitsifli, S.; Papadopoulou, A.; Cencur Curk, B.; Karleusa, B. Estimating the Water Resources Vulnerability Index in the Adriatic Sea Region. Procedia Eng. 2016, 162, 476–485. [Google Scholar] [CrossRef]
- Kanakoudis, V.; Tsitsifli, S.; Papadopoulou, A.; Cencur Curk, B.; Karleusa, B. Water resources vulnerability assessment in the Adriatic Sea region: The case of Corfu Island. Environ. Sci. Pollut. Res. Int. 2017, 24, 20173–20186. [Google Scholar] [CrossRef] [PubMed]
- Kanakoudis, V.; Papadopoulou, A.; Tsitsifli, S.; Cencur Curk, B.; Karleusa, B.; Matic, B.; Altran, E.; Banovec, P. Policy recommendation for drinking water supply cross-border networking in the Adriatic region. J. Water Supply Res. Technol. Aqua 2017, 66, 489–508. [Google Scholar] [CrossRef]
- Behzadian, K.; Kapelan, Z.; Morley, M. Resilience-based performance assessment of water-recycling schemes in urban water systems. Procedia Eng. 2014, 89, 719–726. [Google Scholar] [CrossRef]
- Venkatesh, G.; Brattebø, H. Energy consumption, costs and environmental impacts for urban water cycle services: Case study of Oslo (Norway). Energy 2011, 36, 792–800. [Google Scholar] [CrossRef]
- Mitchell, V.G.; Mein, R.G.; McMahon, T.A. Modelling the urban water cycle. Environ. Model. Softw. 2001, 16, 615–629. [Google Scholar] [CrossRef]
- Mitchell, V.; Diaper, C. UVQ: A tool for assessing the water and contaminant balance impacts of urban development scenarios. Water Sci. Technol. 2005, 52, 91–98. [Google Scholar] [CrossRef] [PubMed]
- Makropoulos, C.K.; Natsis, K.; Liu, S.; Mittas, K.; Butler, D. Decision support for sustainable option selection in integrated urban water management. Environ. Model. Softw. 2008, 23, 1448–1460. [Google Scholar] [CrossRef]
- Mackay, R.; Last, E. SWITCH city water balance: A scoping model for integrated urban water management. Rev. Environ. Sci. Biotechnol. 2010, 9, 291–296. [Google Scholar] [CrossRef]
- Venkatesh, G.; Sægrov, S.; Brattebø, H. Dynamic metabolism modelling of urban water services—demonstrating effectiveness as a decision-support tool for Oslo, Norway. Water Res. 2014, 61, 19–33. [Google Scholar] [CrossRef] [PubMed]
- Behzadian, K.; Kapelan, Z. Advantages of integrated and sustainability based assessment for metabolism based strategic planning of urban water systems. Sci. Total Environ. 2015, 527, 220–231. [Google Scholar] [CrossRef] [PubMed]
- Behzadian, K.; Kapelan, Z.; Venkatesh, G.; Brattebø, H.; Sægrov, S. WaterMet2: A tool for integrated analysis of sustainability-based performance of urban water systems. Drink Water Eng. Sci. 2014, 7, 63–72. [Google Scholar] [CrossRef]
- Behzadian, K.; Kapelan, Z.; Venkatesh, G.; Brattebø, H.; Sægrov, S.; Rozos, E.; Makropoulos, C. Quantitative UWS Performance Model: Watermet2; TRansition to Urban water Services of Tomorrow (TRUST) Technical report D33.2; TRUST (TRansitions to the Urban Water Services of Tomorrow) Project, 2014. [Google Scholar]
- Kanakoudis, V.; Tsitsifli, S.; Papadopoulou, A. Integrating the Carbon and Water Footprints’ Costs in the Water Framework Directive 2000/60/EC Full Water Cost Recovery Concept: Basic Principles Towards Their Reliable Calculation and Socially Just Allocation. Water 2012, 4, 45–62. [Google Scholar] [CrossRef]
- Kanakoudis, V.; Papadopoulou, A. Allocating the cost of the Carbon Footprint produced along a supply chain, among the stakeholders involved. J. Water Clim. Chang. 2014, 5, 556–568. [Google Scholar] [CrossRef]
- Kanakoudis, V. Three alternative ways to allocate the cost of the CF produced in a water supply and distribution system. Desalin. Water Treat. 2014, 54, 2212–2222. [Google Scholar] [CrossRef]
- Loucks, D.P.; Van Beek, E.; Stedinger, J.R.; Dijkman, J.P.; Villars, M.T. Water Resources System Planning and Management: An Introduction to Methods, Models and Applications; UNESCO: Paris, France, 2005; p. 680. [Google Scholar] [CrossRef]
- Iren, A.G. Acquedotti: Dati Tecnici E Risultanze Analitiche Relative All’anno 2014; Internal Report; IREN Acqua Gas: Genoa, Italy, 2015. [Google Scholar]
- ISTAT. Previsioni Demografiche—Anni 2011–2065-dati pre-Censimento 2011 di Fonte Anagrafica. Available online: http://dati.istat.it/Index.aspx?DataSetCode=DCIS_PREVDEM (accessed on 31 May 2018).
- Arredi, F. Costruzioni Idrauliche, 2nd ed.; UTET: Torino, Italy, 1988. [Google Scholar]

Publisher’s Note: MDPI stays neutral with regard to jurisdictional claims in published maps and institutional affiliations. |
© 2018 by the authors. Licensee MDPI, Basel, Switzerland. This article is an open access article distributed under the terms and conditions of the Creative Commons Attribution (CC BY) license (https://creativecommons.org/licenses/by/4.0/).
Share and Cite
Felisa, G.; Lauriola, I.; Ciriello, V.; Federico, V.D. Metabolic Modelling: A Strategic Planning Tool for Water Supply Systems Management. Proceedings 2018, 2, 585. https://doi.org/10.3390/proceedings2110585
Felisa G, Lauriola I, Ciriello V, Federico VD. Metabolic Modelling: A Strategic Planning Tool for Water Supply Systems Management. Proceedings. 2018; 2(11):585. https://doi.org/10.3390/proceedings2110585
Chicago/Turabian StyleFelisa, Giada, Ilaria Lauriola, Valentina Ciriello, and Vittorio Di Federico. 2018. "Metabolic Modelling: A Strategic Planning Tool for Water Supply Systems Management" Proceedings 2, no. 11: 585. https://doi.org/10.3390/proceedings2110585
APA StyleFelisa, G., Lauriola, I., Ciriello, V., & Federico, V. D. (2018). Metabolic Modelling: A Strategic Planning Tool for Water Supply Systems Management. Proceedings, 2(11), 585. https://doi.org/10.3390/proceedings2110585