Proceeding Paper

Metabolic Modelling: A Strategic Planning Tool for Water Supply Systems Management †

Department of Civil, Chemical, Environmental and Materials Engineering (DICAM), University of Bologna, Viale Risorgimento 2, 40136 Bologna, Italy
*
Author to whom correspondence should be addressed.
Presented at the 3rd EWaS International Conference on “Insights on the Water-Energy-Food Nexus”, Lefkada Island, Greece, 27–30 June 2018.
Proceedings 2018, 2(11), 585; https://doi.org/10.3390/proceedings2110585
Published: 2 August 2018
(This article belongs to the Proceedings of EWaS3 2018)

Abstract

:
Water resources are essential for the economic development and sustenance of human activities belonging to the civil, agricultural and industrial sectors. Increasing water stress conditions, mainly due to climate change and population growth, imply the need to improve the resilience of water supply systems and account for sustainability of water withdrawals. Metabolic modelling approaches represent a flexible tool able to provide a support to decision making in the medium-long term, based on sustainability criteria. Here, these concepts are adopted to analyse part of the water supply network in the Province of Reggio-Emilia (Italy). Different water withdrawals scenarios are considered to account for a potential decrease in water resources availability from a quantitative perspective. As a second step, these scenarios are compared by means of a set of key performance metrics able to identify the most sustainable long-term strategy for a dynamic management of the water supply system. Results of these analysis allow to increase the resilience of the network under future scenarios, while protecting the water resources.

1. Introduction

Increasing urban water demand and the availability of water resources not uniformly distributed in space and time, represent major concerns for water companies [1]. At the same time, the population growth and climate change are responsible of increasing water stress conditions at the global level [2,3,4,5]. As such, it is critical to increase the resilience of water supply systems, in terms of infrastructures and environmental compliances. Along with a satisfactory level of services for Urban Water Systems (UWSs), sustainability targets must be ensured [6]. This goal can be achieved by analysing the UWS in an integrated manner, where the impact of interactions between all the components is measured concurrently on the whole system.
Metabolic modelling approaches represent flexible tools able to support decision making in the long-term, based on sustainability criteria [7]. These models mimic the water supply network through a set of material and energy fluxes that interact and influence each other. By analysing these fluxes, a suite of key performance indicators (KPI) is evaluated in order to identify interventions that may be applied to increase the sustainability of the system. This approach aims to meet the need for a holistic and sustainable management approach.
In the recent decades, several models have been developed in order to attain this goal. Some recent tools are Aquacycle as a water balance model [8], and its further modification UVQ [9], UWOT as sustainable water management tool for the selection of combinations of water-saving technologies [10], CWB as city water balance model [11], and DMM as a dynamic metabolism model [12]. However, all these models fail to represent a truly holistic approach for both studying the main resource flows and their impacts on the future performance of the UWS, and comparing possible intervention strategies over a predefined long-term horizon. To this end, the WaterMet2 metabolic model, developed in the context of the EU Project TRUST (TRansitions to the Urban Water Services of Tomorrow) [13], is selected.
This paper presents the application of WaterMet2 to the water supply networks of Roncocesi and Luzzara, in the Reggio-Emilia Province (Italy). Different alternative scenarios are evaluated and compared, including a reduction of water withdrawals from the main well field (Roncocesi), as a consequence of a possible decrease in water availability due to climate change or diffuse pollution from agricultural activities. Based on KPI, sustainable long-term strategies for a dynamic management of the water supply system are identified.

2. Materials and Methods

WaterMet2 is an integrated conceptual mass-balance-based model, able to quantify proper KPI related to the UWS, with focus on sustainability-related issues over a long-term planning horizon. The main idea is to use a metabolic approach and consider all kind of flows (i.e., water, energy, material fluxes) required to fulfil the business-as-usual UWS function [14]. The integrated modelling strategy implies the simulation of processes and components of urban water services as a complex and interrelated system. WaterMet2 returns a set of indicators, e.g., delivered water demand, GHG-emissions produced, electricity, operational costs, in order to support decision making of water companies.
Impact of climate change can be included in the WaterMet2 model by providing climate time series (properly projected over the time horizon of interest) and evaluating the decrease in water resources availability. These analysis are not developed inside the software, but represent input information that have to be derived through preliminary analysis and based on the climate projections provided by the IPCC. In the following, a summary of the software features is presented.

2.1. Main Features of Watermet2

WaterMet2 mimics the entire UWS through the definition of three major subsystems dealing with water supply, stormwater and wastewater [15]. This is done by means of four spatial scales to simulate the main flows and processes: (i) indoor area; (ii) local area (LC); (iii) subcatchment area (SC); (iv) system area. The smallest spatial scale, i.e., the indoor area, represents a single property, without any surroundings, and indoor water demand profiles are defined at this level, on the basis of daily average water demand per capita or detailed information on water consumption for residential appliances and fittings. A local area contains any number of indoor areas with the same per capita water demand: at this scale, it is possible to handle different type of water demands, rainfall-runoff and on-site treatment options. Higher spatial levels involve subcatchment and system area. In particular, the subcatchment represents a group of neighbouring local areas, and it serves as “collection points” in both simplified water supply and separate/combined sewer system. The system area consists of different subcatchments, grouped on the basis of similar features in the urban drainage system, i.e., topology, gravity, in stormwater/wastewater collection systems.
WaterMet2 is able to consider different flows involved in the UWS, that can be aggregated temporally and spatially to derive the basic performance metrics [15]. The main flows are: (i) water flow, including potable water, storm water, grey water, green water, recycling water, and wastewater; (ii) energy flux, i.e., the energy consumed for each component of the UWS for transmission, operation and on-site water treatment options; (iii) greenhouse gas (GHG) emission [16,17,18]; (iv) acidification/eutrophication flux, for all type of GHG emissions; (v) material flux, i.e., annual fluxes of materials over the analysed planning horizon, linked to the UWS assets and their characteristics, with focus on the water distribution and sewer pipelines; (vi) chemical flux of individual chemicals used in the different UWS components.
The WaterMet2 model adopts a “source to tap” modelling. Elements required for the water supply subsystem are: (i) storage components, divided in raw water resources, water treatment works (WTWs), and service reservoirs; (ii) principal flow “routes”, such as water supply conduits, trunk mains, and distribution mains; (iii) subcatchments (SC), assumed to be the water consumption points.
Simulation of the water supply system in WaterMet2 is carried out in two steps [19]. First, daily water demand in the modelled components (local areas/subcatchments) is evaluated starting from the most downstream point and aggregated towards the most upstream point (water resources), considering leakages of the conveyance elements [9]. The daily volume of water demand for water resource i and day t (RDi,t) is given by:
RDi,t = ∑j=1÷m CFi,j × WDj,t (1 + CLi,j/100)
where WDj,t is the water demand of WTWj at day t; CFi,j is the percentage of water demand in resource i, transferred by each water supply conduit ij feeding a single WTWj; m is the number of WTWs; CLi,j the leakage percentage pertaining to water supply conduit ij to the water demand of the conduit.
The second step involves water withdrawal and conveyance to downstream elements sequentially. Here, governing equations refer to the capacity control of storage elements. The released/abstracted water is distributed among subcatchments and finally provided to water consumers. Mass balance relationship is applied to compute the water volume of a storage component in consecutive days:
Si,t+1 = Si,t + Ii,t − Di,t
where Si,t and Si,t+1 are the volume of component i for day t and t + 1, respectively; Ii,t is the inflow to component i for day t, and Di,t is the output for component i for day t.

2.2. Graphical User Interface of Watermet2

Figure 1 depicts the graphical user interface of the WaterMet2 model. The Topology and Operation tabs allow representing the schematization of the entire UWS, and the relative distribution of flows inside the network. In the Assets tab, each component of the UWS is characterized through the transmission capacity, for conveyance components, or the volume, for storage components, and also electricity and concentration of chemicals if relevant. In the Subcatchment tab, local areas are added, together with water demands (indoor, industrial, and agricultural) that are defined by means of time series in the time horizon of interest. At this level, the number of properties, or number of inhabitants, can be set, in order to evaluate the overall water demand from each local area.

3. Case Study

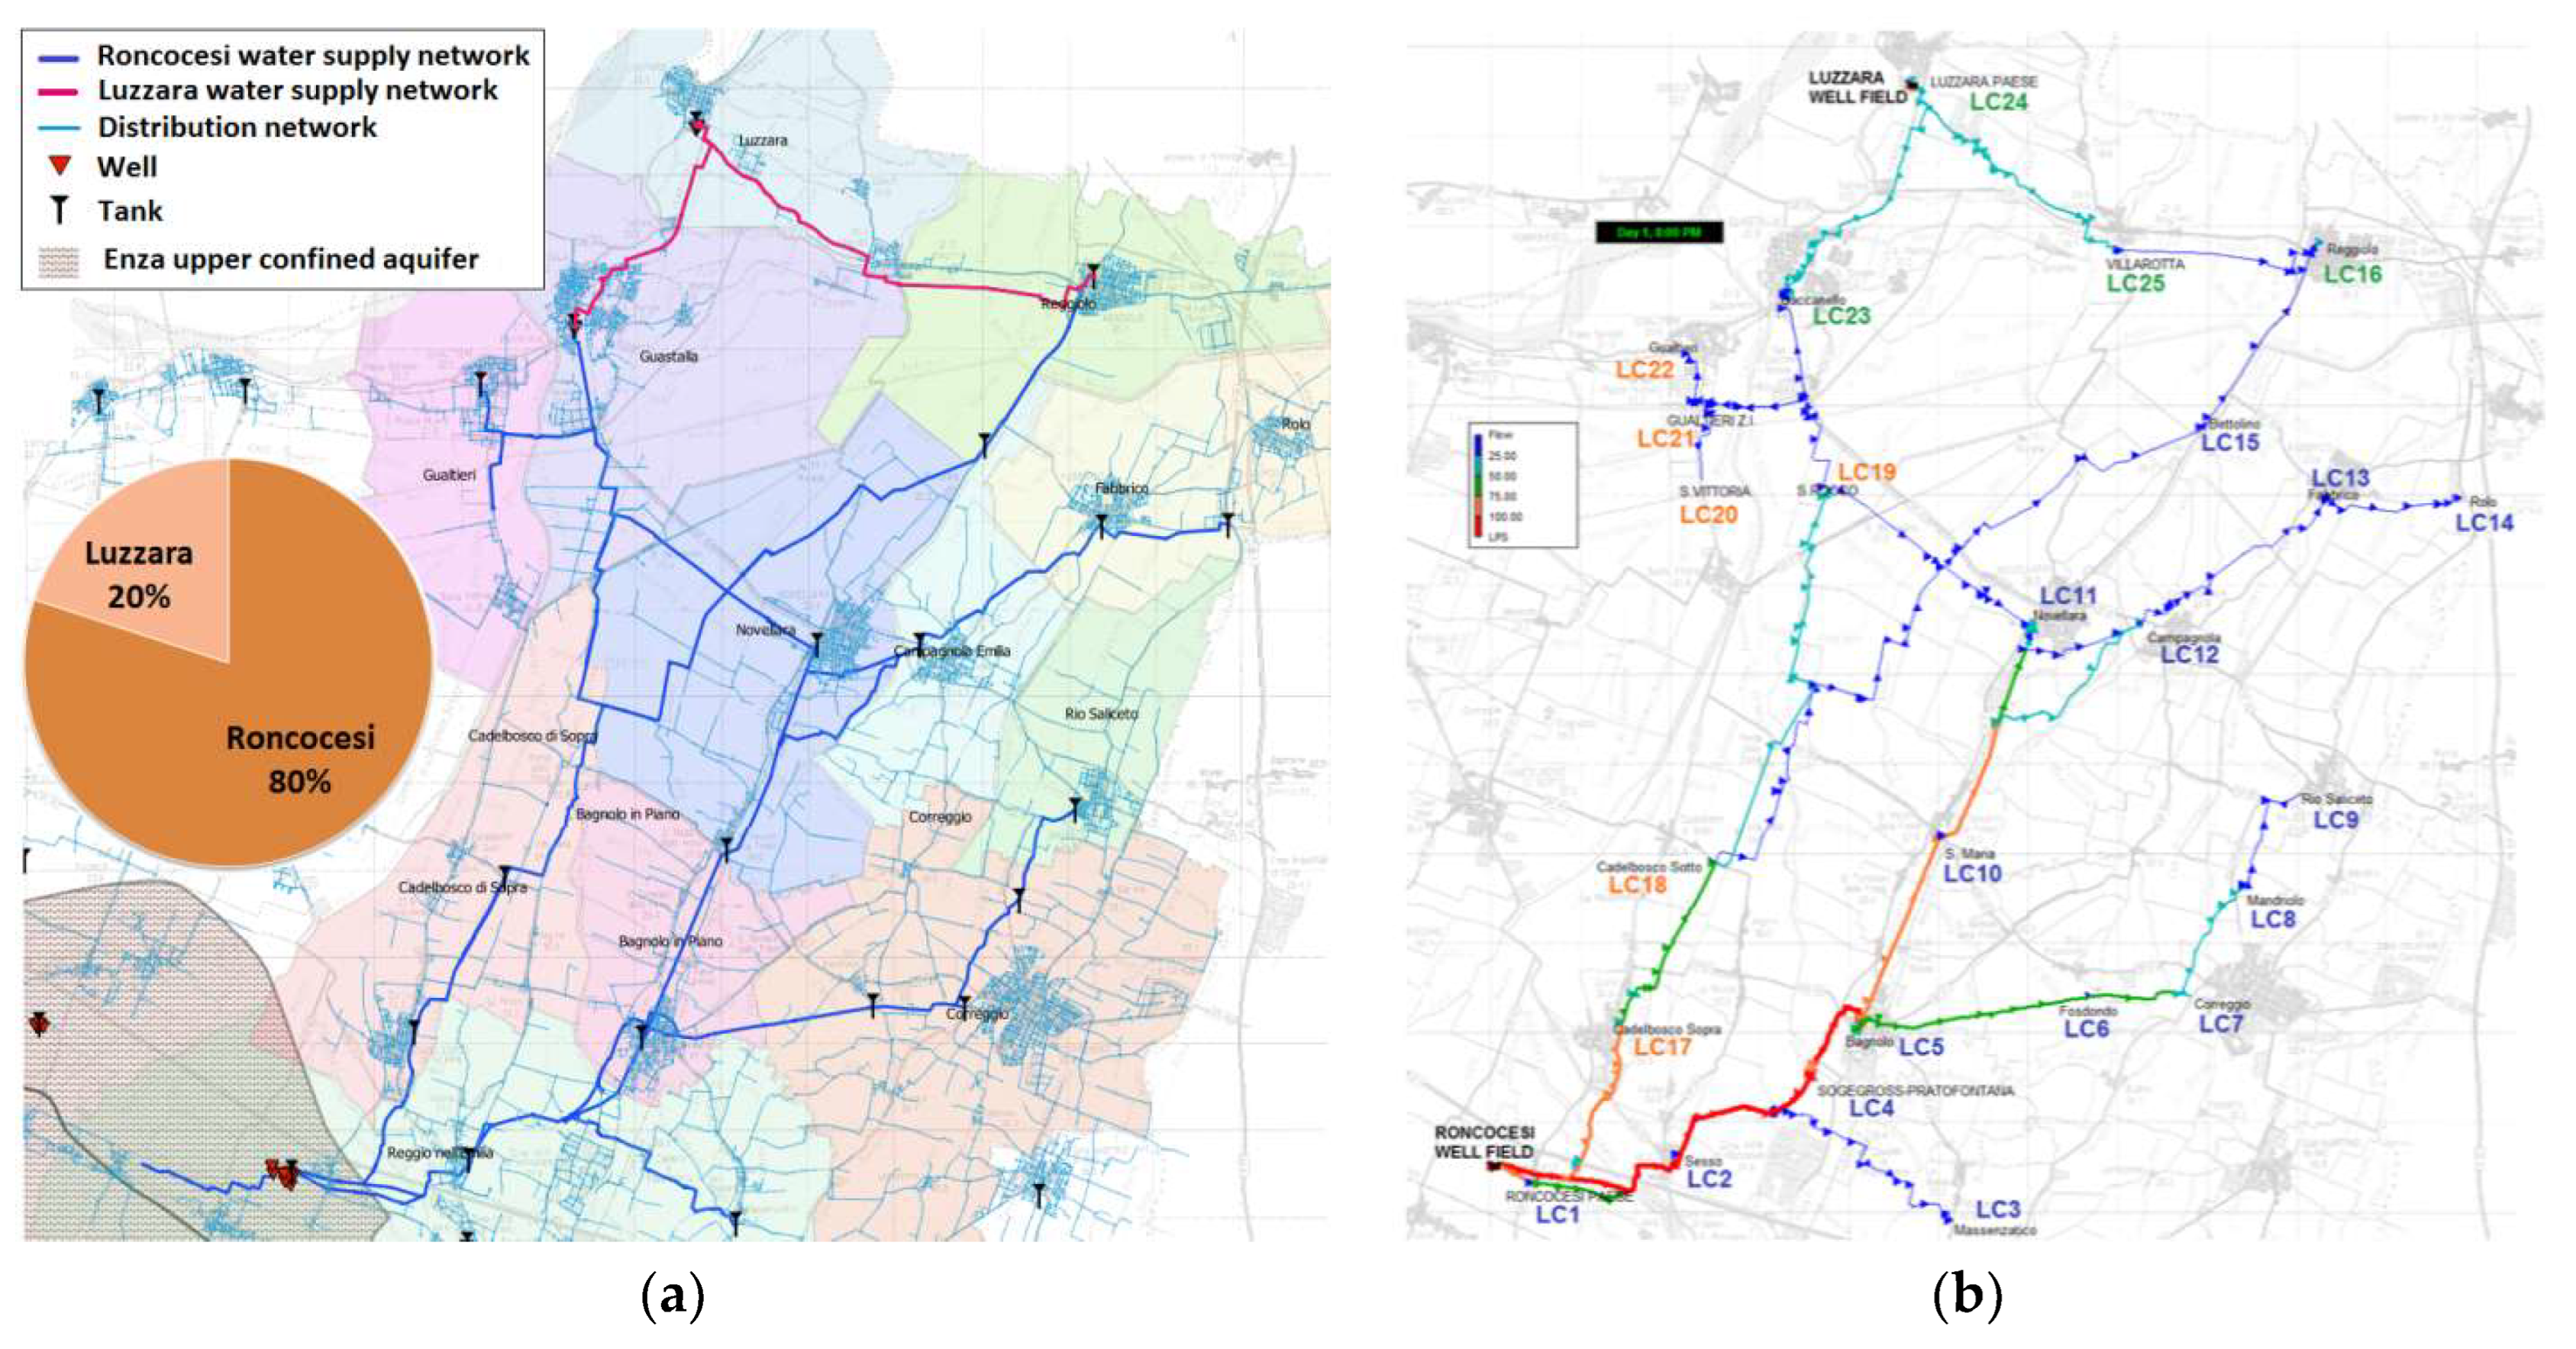
Application of WaterMet2 is demonstrated here for the water supply networks of Roncocesi and Luzzara, in the Reggio-Emilia Province (Italy) [20]. Water withdrawals of the Roncocesi well field, from the Enza alluvial fan (Figure 2a), are intensive even if, during the last 10 years, their trend is decreasing due to interconnections with near aqueducts, including Luzzara, which derives water from the aquifer of the Po River. These networks together served about 111,000 inhabitants in 2014, but this value will increase according to the projections of the Italian National Statistics Institute (ISTAT) [21]. In the medium-long term, this would lead to higher water withdrawals in particular from the Roncocesi well field.
Figure 2b presents the schematization of the water supply system. According to the WaterMet2 conceptualization, each reservoir is directly linked to the water distribution network, and fed by one of the two main reservoirs located at the Roncocesi and Luzzara well fields. The water demand for each local area, has been evaluated in order to: (i) compute the overall water demand (RD) related to the different water resources and (ii) compare this value with the total delivered water circulating in the network. The topology of the system and the assets of the main components have been derived by GIS data and data provided by Water Company IRETI, while distribution of flows inside the water supply network have been computed by means of Epanet simulations. In particular, in order to account for the most onerous conditions for the UWS, simulations with hourly time step have been realized over the day of higher consumption in 2013. This is relevant because Epanet simulations allow to identify: (i) the adequacy, in terms of pressures and velocities, of the alternative design scenarios, and (ii) the flow directions within the network, that represent an input information for WaterMet2.
Respect to the business as usual scenario (BAU), where the only factor affecting water demand is the population growth in the area of interest, a reduction of water withdrawals from the Roncocesi well field is assumed in two alternative scenarios, due to the potential impact of climate changes and nitrate contamination affecting the Enza aquifer. Here, the groundwater availability is supposed to decrease of a specified amount in 30 years. The first alternative scenario (hereinafter Strategy 1) consists in the realization of a new well field, deriving water from the aquifer of the Po River, able to counteract a slight reduction of water availability from Roncocesi well field and accommodate a given number of local areas previously served by Roncocesi network (Figure 3a). Epanet simulations revealed that, under this configuration, it would be possible to decrease the total amount of withdrawals from Roncocesi of about 14%. A greater reduction could be obtained if, in addition to the realization of the new well field, a new trunk main is constructed, connecting the well field directly to a reservoir as depicted in Figure 3b. Under this scenario (hereinafter Strategy 2), it is possible to decrease the amount of water withdrawals from Roncocesi of about 26%, as quantified by means of Epanet.
For the BAU scenario, as well as for the two alternative strategies, the water demand related to each resource is assessed with WaterMet2 through a mass balance that starts from the average per capita water consumption data, associated with each local area, and deducted from both Epanet simulations and available water consumption reports. For the selected case study, 25 local areas have been identified within 3 subcatchments, as depicted in Figure 2b. The annual population -increasing rate assumed for the analysis represents a medium growth scenario, derived by ISTAT [21]. Variation of the indoor water demand follows the population growth on a yearly basis, according to available predictions; in addition, monthly coefficients are applied in order to mimic seasonal variations [22]. In the simulations, the per capita water consumption, the leakage and the other water demands, e.g., industrial and commercial, are assumed constant within the selected time horizon.
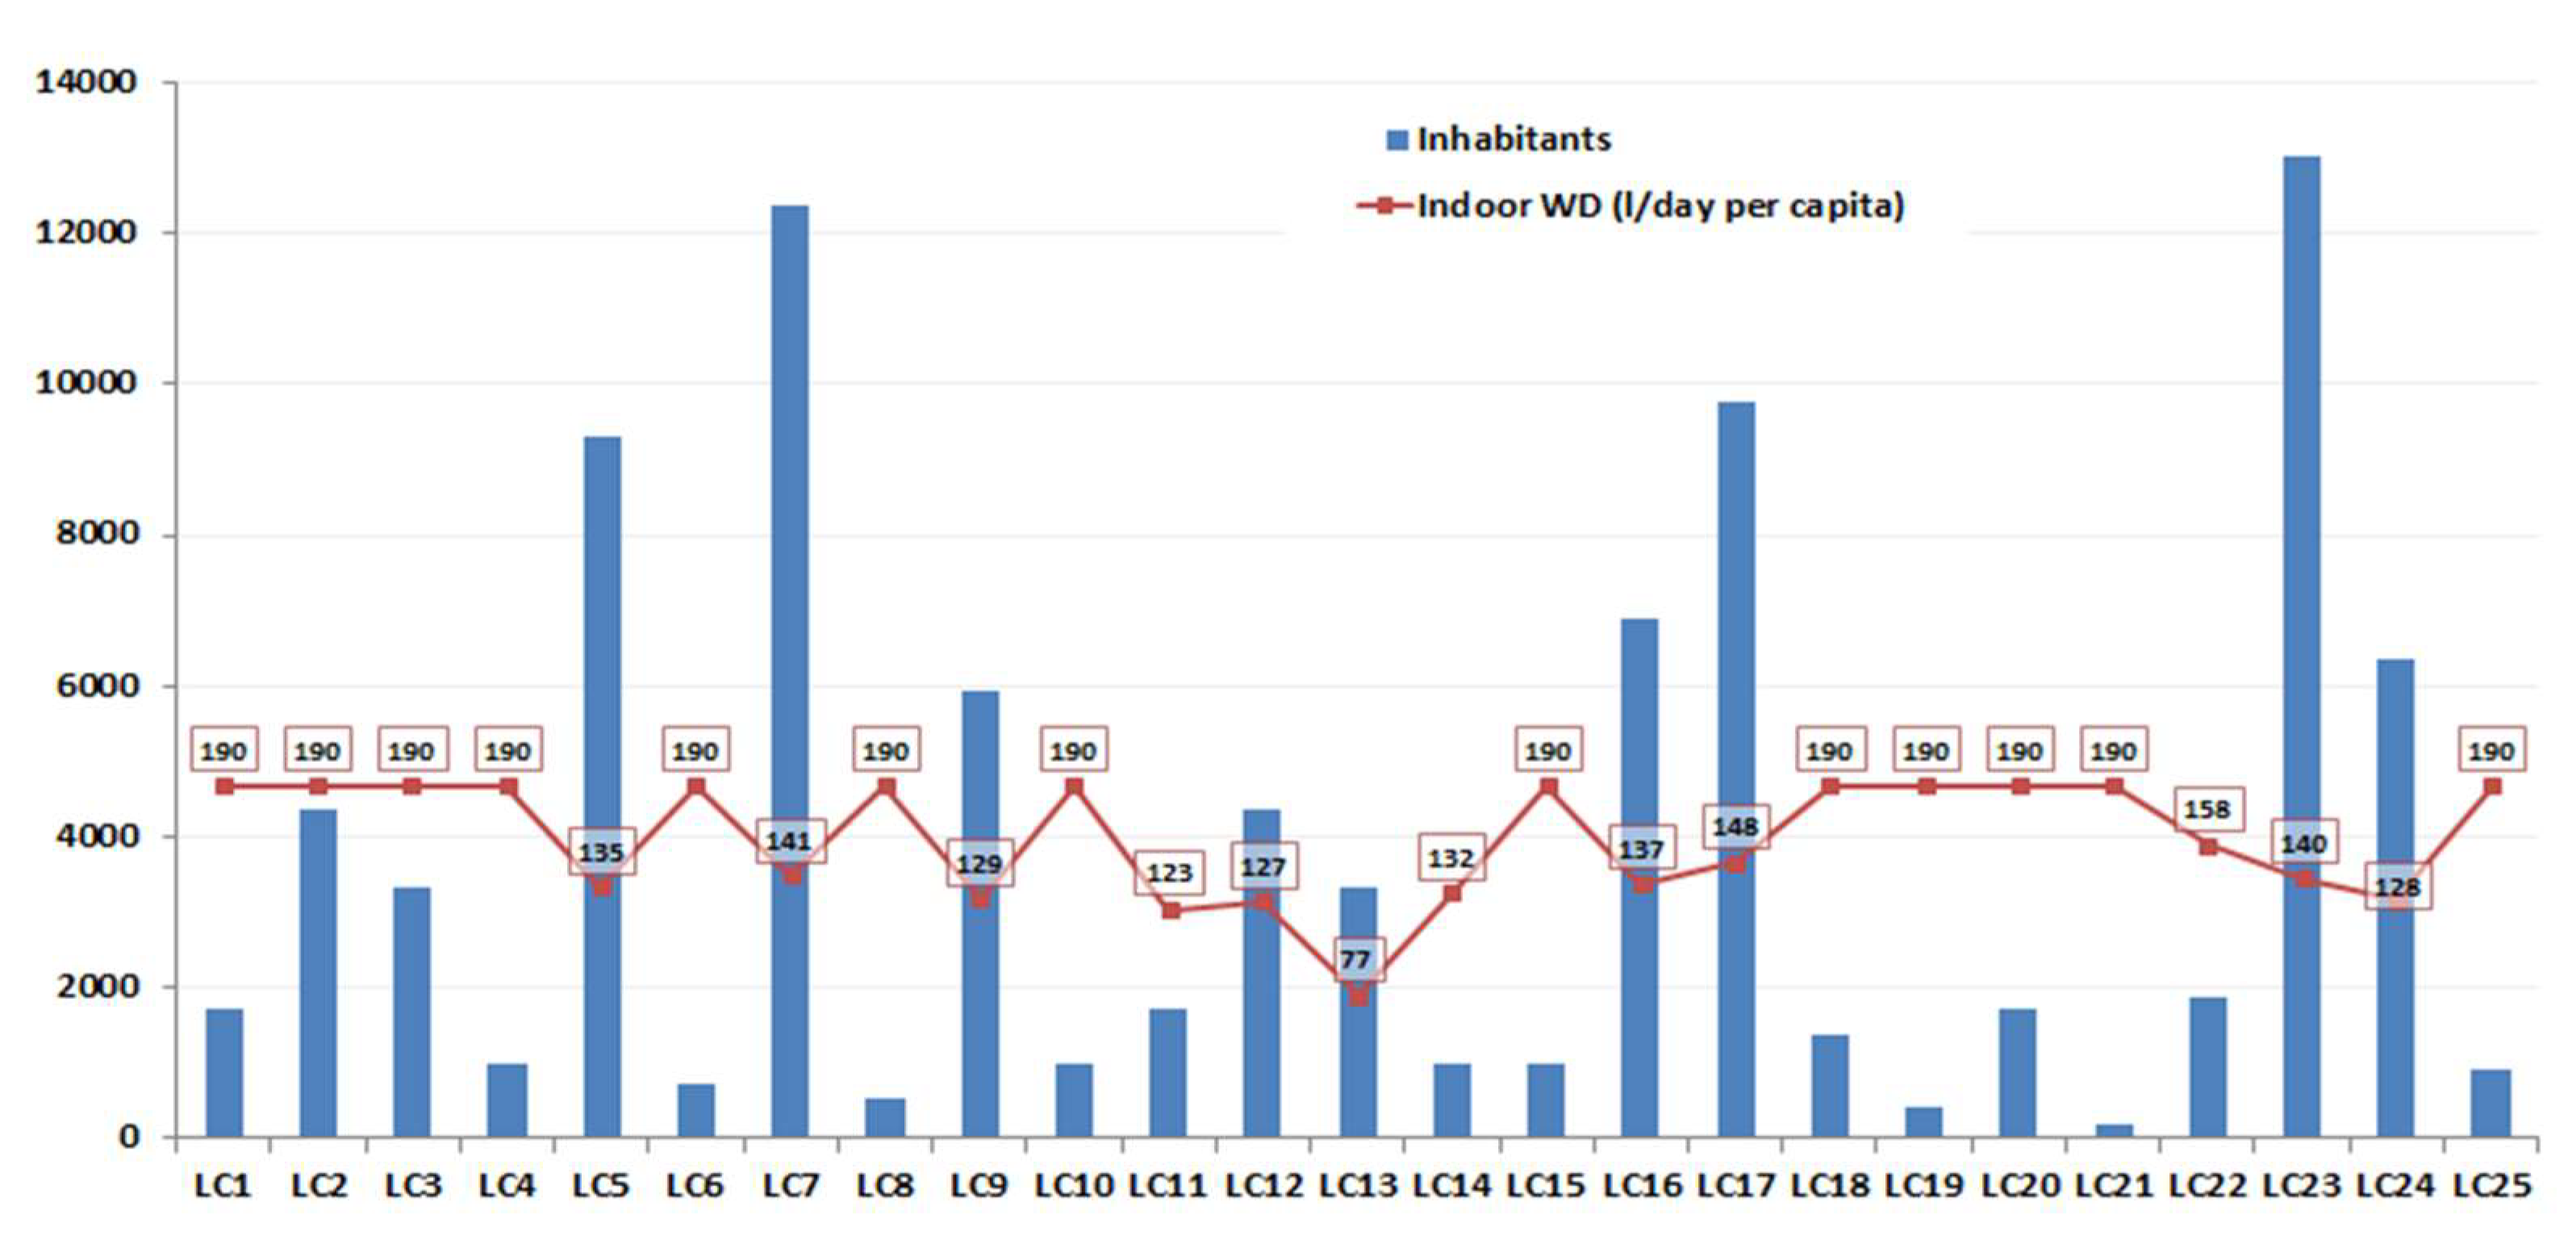
Figure 4 shows the number of served inhabitants, indoor water demand (L/day per capita), for each local area.

4. Results

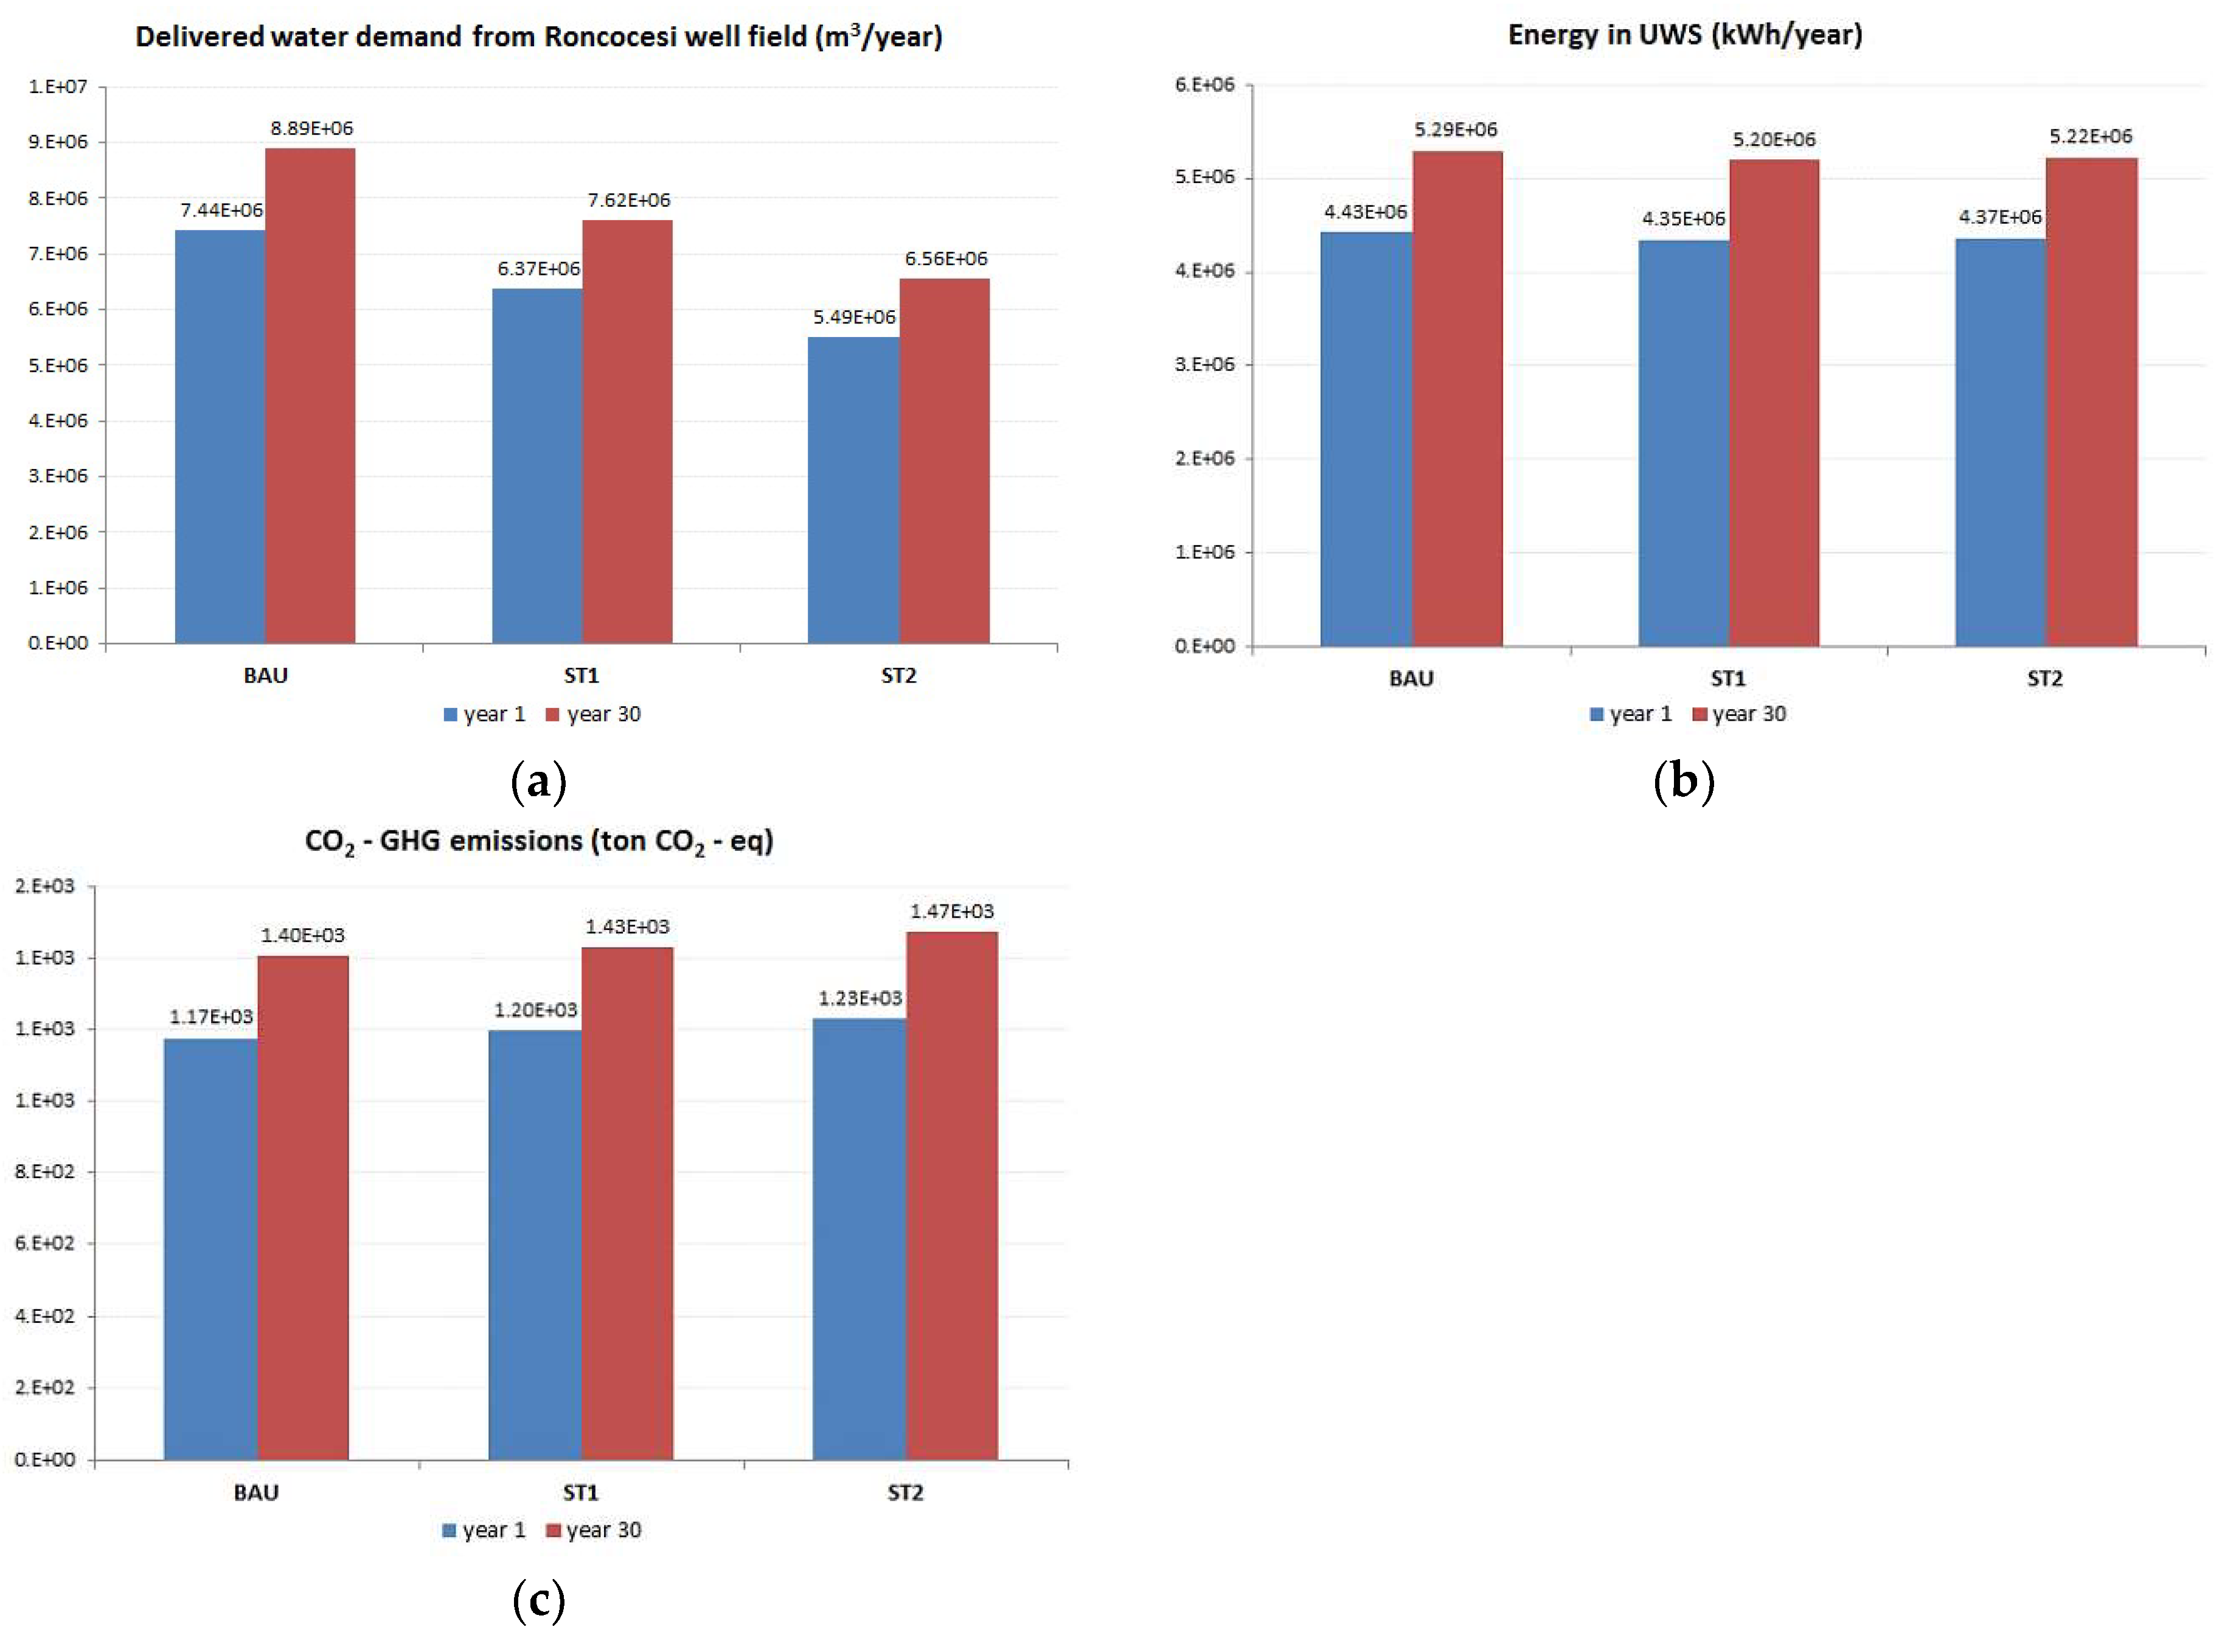
A 30-years time horizon has been simulated with WaterMet2 with a daily time step to compare the BAU and two alternative scenarios by means of proper KPIs. These mainly refer to water, energy and chemicals consumption that are related to costs and emissions in turn. In order to provide some examples for the selected case study, Figure 5a shows the delivered water demand from the Roncocesi well field, under the three possible configurations, confirming the expected reduction in water withdrawals from the Enza fan resulting from the insertion of the new well field. Results are depicted for the first and last year of simulation and it is possible to observe that the decrease of 14% (Strategy 1) and 26% (Strategy 2) is maintained over the entire simulation period. Contemporary, the increment in the delivered water demand in time (assumed equal to 20% over 30 years), corresponds to the increment in the indoor water demand that is affected by population growth [21,22].
Figure 5b presents the total energy consumed by the UWS including electricity and embodied energy in materials and chemicals. Electrical energy is mainly consumed by pumping activities in the well fields, within potable water treatments, and by local pumping for transmission of water to service reservoirs. The total energy is obtained by multiplying a predefined constant (in kWh/m3), derived by Epanet simulations and technical data, by the volume of water in each component of interest, i.e., resources, water supply conduits, WTWs, trunk mains, service reservoirs and distribution mains. It decreases of 3% if comparing BAU and Strategy 1, against a decrease of the total energy of about 2%. When comparing BAU and Strategy 2, the electrical energy decreases of 4% while the total energy of about 1%. These variations are produced by the presence of the new well field and by the correspondent decrease in the amount of local pumping. The embodied energy increases in both the alternative configurations due to new materials associated with the new well field (both Strategys 1 and 2) and pipes (Strategy 2).
In order to complete the comparison, Figure 5c similarly shows the carbon dioxide (CO2) emissions produced by the UWS due to fossil fuel combustion and embodied in materials and chemical in all UWS components. Greenhouse gas (GHG) emissions are determined by multiplying the amount of energy, chemical and material consumed by proper conversion coefficients depending on that specific energy, chemical and material. Conversion factors are expressed as kg of CO2 equivalent per consumption unit. Respect to the BAU scenario, Strategy 1 shows an increase of CO2 emissions of 2%, while Strategy 2 produces an increase of 3%. As for the embodied energy, this is attributable to the increase in materials and chemicals associated with Strategies 1 and 2.

5. Conclusions

The two alternative strategies, respect to the BAU scenario, not only achieve a reduction of water withdrawals from the Roncocesi well field, as required to avoid groundwater overexploitation, but also are more efficient in terms of energy consumption.
The KPIs selected in the study are limited to a number of main technical and environmental metrics, of considerable importance for water companies to manage the water supply system. Based on this kind of indicators it is possible to compare the different management strategies and understand their environmental and economic sustainability. Other criteria, e.g., social impacts, are not considered in this study, and would need to be quantified by other tools. Nevertheless, it is possible to use the indicators provided by WaterMet2, together with other selected metrics, within a Multi Criteria Analysis, to further support decision-making.
The adoption of a comprehensive approach to the UWS requires, in general, simplified models based on mass balance analysis such as WaterMet2; while this choice introduces a simplification in the schematization of the real behavior of the network, this approach turns out to be a powerful tool for long-term strategic analysis, as alternative scenarios can be easily compared under multiple perspectives.

Author Contributions

G.F. and V.C. developed the WaterMet models. G.F. and I.L. performed the Epanet simulations. V.D.F. supervised the findings of this work.

Funding

This research was supported by “Definizione e applicazione di criteri di sostenibilità nei sistemi idrici urbani gestiti da IREN Acqua Gas a supporto delle decisioni strategiche di lungo periodo”, a two-years research agreement between the Department of Civil, Chemical, Environmental and Materials Engineering (DICAM), University of Bologna, and IREN Acqua Gas.

Acknowledgments

The authors wish to acknowledge IREN Spa, for providing the data about Roncocesi and Luzzara water supply systems; P. Pedrazzoli, C. Ziveri, G. Panini and F. Ferretti for their kind support and for the fruitful discussions about the water supply systems functioning; Kourosh Behzadian, for his kind support with WaterMet2 and his useful suggestions.

Conflicts of Interest

The authors declare no conflict of interest.

References

  1. Nair, S.; George, B.; Malano, H.M.; Arora, M.; Nawarathna, B. Water–energy–greenhouse gas nexus of urban water systems: Review of concepts, state-of-art and methods. Resour. Conserv. Recycl. 2014, 89, 1–10. [Google Scholar] [CrossRef]
  2. Barros, V.R.; Field, C.B.; Dokken, D.J.; Mastrandrea, M.D.; Mach, K.J.; Bilir, T.E.; Chatterjee, M.; Ebi, K.L.; Estrada, Y.O.; Genova, R.C.; et al. Climate Change 2014: Impacts, Adaptation, and Vulnerability. Part B: Regional Aspects. In Climate Change 2014: Impacts, Adaptation, and Vulnerability—Contribution of Working Group II to the Fifth Assessment Report of the Intergovernmental Panel on Climate Change; Cambridge University Press: Cambridge, UK; New York, NY, USA, 2014; p. 688. [Google Scholar]
  3. Kanakoudis, V.; Tsitsifli, S.; Papadopoulou, A.; Cencur Curk, B.; Karleusa, B. Estimating the Water Resources Vulnerability Index in the Adriatic Sea Region. Procedia Eng. 2016, 162, 476–485. [Google Scholar] [CrossRef]
  4. Kanakoudis, V.; Tsitsifli, S.; Papadopoulou, A.; Cencur Curk, B.; Karleusa, B. Water resources vulnerability assessment in the Adriatic Sea region: The case of Corfu Island. Environ. Sci. Pollut. Res. Int. 2017, 24, 20173–20186. [Google Scholar] [CrossRef] [PubMed]
  5. Kanakoudis, V.; Papadopoulou, A.; Tsitsifli, S.; Cencur Curk, B.; Karleusa, B.; Matic, B.; Altran, E.; Banovec, P. Policy recommendation for drinking water supply cross-border networking in the Adriatic region. J. Water Supply Res. Technol. Aqua 2017, 66, 489–508. [Google Scholar] [CrossRef]
  6. Behzadian, K.; Kapelan, Z.; Morley, M. Resilience-based performance assessment of water-recycling schemes in urban water systems. Procedia Eng. 2014, 89, 719–726. [Google Scholar] [CrossRef]
  7. Venkatesh, G.; Brattebø, H. Energy consumption, costs and environmental impacts for urban water cycle services: Case study of Oslo (Norway). Energy 2011, 36, 792–800. [Google Scholar] [CrossRef]
  8. Mitchell, V.G.; Mein, R.G.; McMahon, T.A. Modelling the urban water cycle. Environ. Model. Softw. 2001, 16, 615–629. [Google Scholar] [CrossRef]
  9. Mitchell, V.; Diaper, C. UVQ: A tool for assessing the water and contaminant balance impacts of urban development scenarios. Water Sci. Technol. 2005, 52, 91–98. [Google Scholar] [CrossRef] [PubMed]
  10. Makropoulos, C.K.; Natsis, K.; Liu, S.; Mittas, K.; Butler, D. Decision support for sustainable option selection in integrated urban water management. Environ. Model. Softw. 2008, 23, 1448–1460. [Google Scholar] [CrossRef]
  11. Mackay, R.; Last, E. SWITCH city water balance: A scoping model for integrated urban water management. Rev. Environ. Sci. Biotechnol. 2010, 9, 291–296. [Google Scholar] [CrossRef]
  12. Venkatesh, G.; Sægrov, S.; Brattebø, H. Dynamic metabolism modelling of urban water services—demonstrating effectiveness as a decision-support tool for Oslo, Norway. Water Res. 2014, 61, 19–33. [Google Scholar] [CrossRef] [PubMed]
  13. Behzadian, K.; Kapelan, Z. Advantages of integrated and sustainability based assessment for metabolism based strategic planning of urban water systems. Sci. Total Environ. 2015, 527, 220–231. [Google Scholar] [CrossRef] [PubMed]
  14. Behzadian, K.; Kapelan, Z.; Venkatesh, G.; Brattebø, H.; Sægrov, S. WaterMet2: A tool for integrated analysis of sustainability-based performance of urban water systems. Drink Water Eng. Sci. 2014, 7, 63–72. [Google Scholar] [CrossRef]
  15. Behzadian, K.; Kapelan, Z.; Venkatesh, G.; Brattebø, H.; Sægrov, S.; Rozos, E.; Makropoulos, C. Quantitative UWS Performance Model: Watermet2; TRansition to Urban water Services of Tomorrow (TRUST) Technical report D33.2; TRUST (TRansitions to the Urban Water Services of Tomorrow) Project, 2014. [Google Scholar]
  16. Kanakoudis, V.; Tsitsifli, S.; Papadopoulou, A. Integrating the Carbon and Water Footprints’ Costs in the Water Framework Directive 2000/60/EC Full Water Cost Recovery Concept: Basic Principles Towards Their Reliable Calculation and Socially Just Allocation. Water 2012, 4, 45–62. [Google Scholar] [CrossRef]
  17. Kanakoudis, V.; Papadopoulou, A. Allocating the cost of the Carbon Footprint produced along a supply chain, among the stakeholders involved. J. Water Clim. Chang. 2014, 5, 556–568. [Google Scholar] [CrossRef]
  18. Kanakoudis, V. Three alternative ways to allocate the cost of the CF produced in a water supply and distribution system. Desalin. Water Treat. 2014, 54, 2212–2222. [Google Scholar] [CrossRef]
  19. Loucks, D.P.; Van Beek, E.; Stedinger, J.R.; Dijkman, J.P.; Villars, M.T. Water Resources System Planning and Management: An Introduction to Methods, Models and Applications; UNESCO: Paris, France, 2005; p. 680. [Google Scholar] [CrossRef]
  20. Iren, A.G. Acquedotti: Dati Tecnici E Risultanze Analitiche Relative All’anno 2014; Internal Report; IREN Acqua Gas: Genoa, Italy, 2015. [Google Scholar]
  21. ISTAT. Previsioni Demografiche—Anni 2011–2065-dati pre-Censimento 2011 di Fonte Anagrafica. Available online: http://dati.istat.it/Index.aspx?DataSetCode=DCIS_PREVDEM (accessed on 31 May 2018).
  22. Arredi, F. Costruzioni Idrauliche, 2nd ed.; UTET: Torino, Italy, 1988. [Google Scholar]
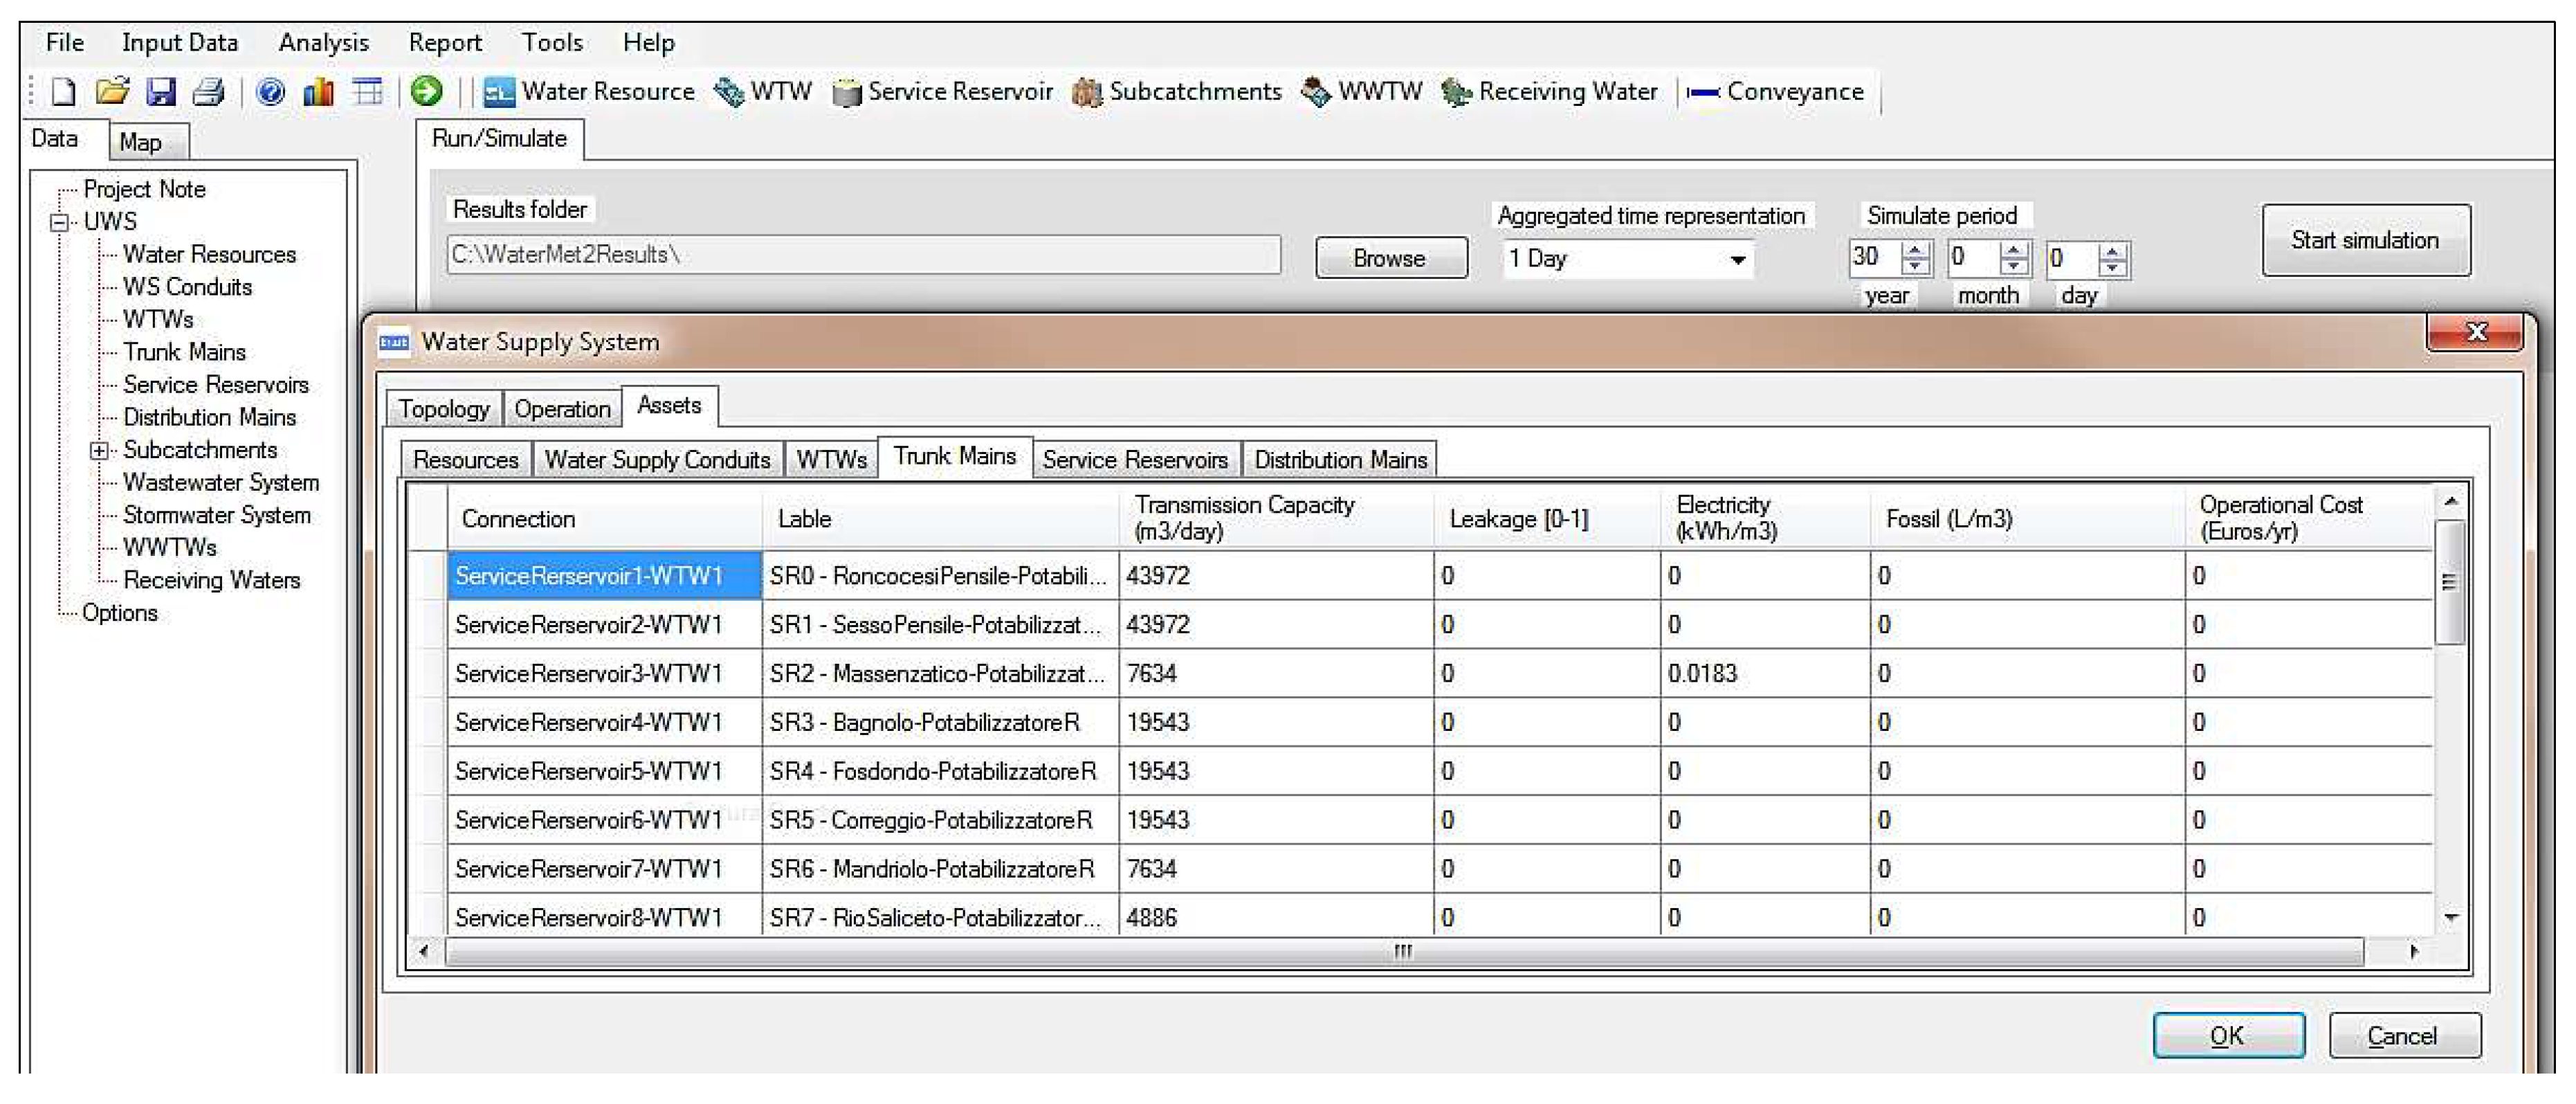
Figure 1. WaterMet2 interface: on the left, the main tabs available in the model, each one defining a component of the UWS. In the centre, the Trunk Main tab, where the main features are defined.
Proceedings 02 00585 g001
Figure 2. (a) Location of Roncocesi and Luzzara water supply systems in Reggio Emilia province, with the percentage of distributed water by each aqueduct; (b) Distribution of local areas according to WaterMet2 model, with flows derived by Epanet simulations. Here, the different colors of local areas (LC) represent the distribution among the subcatchments (LC1-LC15: SC1, LC17-LC22: SC2; LC16, LC23-25:SC3).
Proceedings 02 00585 g002
Figure 3. (a) Alternative strategy in order to decrease water withdrawals from Roncocesi well field of 14% (Strategy 1); (b) Alternative strategy in order to reduce water withdrawals from Roncocesi well field of 26% (Strategy 2). For both interventions, the percentage of distributed water by each aqueduct is computed.
Proceedings 02 00585 g003
Figure 4. Local areas served by the UWS, with correspondent inhabitants and water demand resulting from indoor consumption.
Proceedings 02 00585 g004
Figure 5. (a) Delivered water demand (m3/year) from the Roncocesi well field for the 1st and last simulation years and for the three alternative configurations (BAU, ST1, ST2); (b) same as (a) but referred to the total energy (kWh) consumed by the UWS; (c) same as (a) but referred to CO2 emissions (ton CO2-eq) produced by the UWS.
Proceedings 02 00585 g005
Publisher’s Note: MDPI stays neutral with regard to jurisdictional claims in published maps and institutional affiliations.