Proceeding Paper

Experiments and Numerical Analysis of Flow in an Open Channel with Gravel Bed †

by
Nikolaos Michalolias
1,
Evangelos Keramaris
1,*,
Dorothea Kasiteropoulou
1,
Antonios Liakopoulos
1 and
George Pechlivanidis
2
1
Department of Civil Engineering, University of Thessaly, PedionAreos, 38334 Volos, Greece
2
Department of Civil Engineering T.E, Alexander Technological Educational Institute of Thessaloniki, Sindos, 57400 Thessaloniki, Greece
*
Author to whom correspondence should be addressed.
Presented at the 3rd EWaS International Conference on “Insights on the Water-Energy-Food Nexus”, Lefkada Island, Greece, 27–30 June 2018.
Proceedings 2018, 2(11), 581; https://doi.org/10.3390/proceedings2110581
Published: 30 July 2018
(This article belongs to the Proceedings of EWaS3 2018)

Abstract

:
In this study laboratory experiments and numerical simulations of flow in an open channel with gravel bed of 2 cm thickness are presented and compare. The experimental results were obtained using 2D Particle Image Velocimetry (PIV). For the numerical simulation of gravel bed, a porous layer of thickness 2 cm and appropriate porosity (ε = 0.80, volume of fluid over total porous medium volume) was used. In order to validate the results of the CFX based numerical model, computed quantities are compared with experimental data from PIV measurements. Vertical distributions of velocity above the permeable layer are presented for different total flow depths. The determination of the velocity profiles is of practical importance in the design of open channels. The findings are supported by both laboratory measurements and numerical modelling results and can be useful for engineering applications. In all cases there is a good agreement between experimental and numerical results.

1. Introduction

The type of an impermeable bed influences significantly the turbulent characteristics of the flow. The interaction between the turbulent flow and the roughness of a gravel permeable bed influences the vertical transfer of mass and momentum in aquatic flows. Transport of sediments above gravel bed rivers is common in mountainous areas [1,2]. There are a lot of studies regarding the behavior of permeable bed in an open channel flow.
In the study of [3] the characteristics of turbulent flow above porous beds (porous filter and rods bundle) are studied experimentally with the use of hot-film anemometry (TSI cross hot film connected with IFA 100). The experimental results show many differences in both mean and turbulence characteristics between the two bed materials used.
Ref [4] studied experimentally the characteristics of turbulent flow in an open channel above the permeable bed (grass vegetation and gravel bed) using a part a PIV. Hydraulic characteristics such as distributions of velocities, turbulent intensities and Reynolds stress are investigated and the results show that the bed type can significantly influence the turbulent characteristics of the flow.
In the study of [5] the turbulent characteristics of the flow in an open channel with horizontal and inclined impermeable bed were studied experimentally using a PIV. The channel slope influences significantly the turbulent characteristics of the flow such as the variation of longitudinal turbulent intensity the variation of vertical turbulent intensity, the turbulent kinetic energy and Reynolds stresses.
The influence of transition from vegetation to gravel bed and vice versa [6] and the effects on the velocity distribution of turbulent flow in a half-separated (impermeable and permeable) bed [7] in open channel is investigated experimentally. In the first case results show that the influence on the turbulent characteristics of transition from vegetation to gravel bed is different in comparison with those of transition from gravel to vegetated bed. This is due to the fact that the presence of gravel bed increases the turbulent characteristics of the flow in regard to the vegetated bed due to the great roughness which is observed near the interface gravel bed-water because of the presence of the gravel bed and this increase the turbulence. In the second case results show that the presence of half-separated impermeable and permeable bed influences the values of velocity distribution in comparison with situations over permeable or impermeable bed. The comparison with the same experiments when it has transition from permeable to impermeable bed and vice versa shows that there are a lot of differences on velocity distribution.
Ref [8] first solves the Navier–Stokes–Forchheimer (NSF) equation for laminar vegetated flow and then modifies the obtained velocity distribution for turbulent flow. It demonstrates that (i) for flows through emergent and over submerged vegetation, the laminar velocity distributions are expressed by the Jacobi elliptic functions for which the parabolic law is recovered for zero vegetation; (ii) for flow through emergent vegetation, the laminar velocity distribution exhibits a typical boundary-layer profile, while its turbulent counterpart is simply uniform; and (iii) for flow over submerged vegetation, both laminar and turbulent velocity distributions are similar to those in conventional channel flows for the water layer, but both are approximated by hyperbolic sine laws for the vegetation layer. The laminar solutions meet the NSF equation and all boundary conditions; and the turbulent solutions agree with laboratory and field data.
In the study of [9] they undertake a series of novel experimental observations in order to provide a framework for characterizing the hydrodynamic processes that determine mass and momentum transfer across the Sediment-Water Interface (SWI). The experimental data will reveal the variation of the mean flow and turbulence across the SWI as a function of a dimensionless permeability. These experimental results will also clarify the limitations of both the diffusive boundary layer model and the slip model by evaluation of the assumptions that underpin them.
As regards the numerical studies initially [10,11] developed a method for the determination of the velocity profile which separates the flow region in two layers, one inside the vegetation and the other over the vegetation. This theory was based on the two layer method. Contrary to the theory of [10,12] developed a model for the calculation of mean velocity and turbulent characteristics of the flow in an open channel with vegetation. Their theory was based on the fact that the vegetation resistance has an impact not only in the momentum equation but and in k-ε model equations.
Ref [13] modified these two models in order to examine the vegetation geometry and the drag resistance as a function of the flow depth. In this theory they added the turbulent kinetic energy equation for two layers model. Ref [14] used 3D finite element program (SSIM) for the study of the vegetation influence in velocity distribution. This model solves the momentum and continuity equations for each element and uses the k-ε model for the turbulence modeling.
In the study of [15] in order to experimentally and numerically investigate the turbulent flow in an open channel with porous (vegetation) and impermeable bed, 2D PIV and a CFX model were used. For the simulation of the porous bed grass vegetation was used. Vertical distributions of velocities above the impermeable bed and above the vegetation for the porous bed for the same different total heights were evaluated. Results show that there is a good agreement between experimental and numerical study.
In the study of [16] in order to experimentally and numerically investigate the turbulent flow in an open channel with flexible vegetation, 2D PIV and a numerical model (in the ANSYS-CFX environment) were used. For the simulation of the porous bed a grass-like of flexible vegetation of: (a) 2 cm thickness and (b) 6 cm thickness were used. Vertical distributions of velocities above the flexible vegetation for the same different total heights were evaluated. Results show that there is a good agreement between experimental and numerical study. Small differences are observed only in the case flexible vegetation of lower thickness for the maximum discharge and for the higher total flow depths. This is due to the fact that the major discharge and the high total flow depth provide much turbulence which reduces the horizontal velocities over the vegetation bed and the model overestimates the velocities in these cases.
In this study experimental and numerical analysis of flow in an open channel with gravel bed is presented. Gravel bed rivers represent an important stream type in the fluvial environment and are the dominating river type in mountainous areas. The experimental results were obtained using 2D PIV. For the numerical simulation of gravel bed, a porous layer of thickness 2 cm and appropriate porosity (ε = 0.80, volume of fluid over total porous medium volume) was used. Vertical distributions of velocity above the permeable layer are presented for different total flow depths. The findings by laboratory measurements and numerical modelling results are in a good agreement.

2. Experimental Procedure—Measurements

Experiments were conducted in a channel (Figure 1) with 6.5 m length, 7.5 cm width and 25 cm height in the laboratory of Hydraulics in the department of Civil Infrastructure Engineering of Alexander Technological Educational Institute of Thessaloniki, Greece. The width of the channel is only 7.5 cm but doesn’t influence the magnitude of the velocities. Ref [17] carried out experiments to investigate the impact of lateral walls on the velocity profile in an open channel with the width of 7.5 cm. Results from these experiments showed that the lateral walls influence the velocities only in a distance of 0.4 cm from the walls. This result indicates that the wall doesn’t influence the instantaneous velocities in the central area of the channel in which the velocity measurements are usually conducted. The impact of the lateral walls on the flow dynamics in the rest of the channel is negligible.
Totally twelve (12) experiments were carried out for the gravel bed with a porosity of ε = 0.80. Three (3) different discharges Q (0.735, 0.845, 0.970 L/s) was used at four (4) different total flow depths h = 7, 9, 11 and 13 cm for gravel bed with hv = 2 cm (Figure 2). The morphology of the porous bed is illustrated in Photograph 1. Reynolds number (Re = Umean*h/ν), (Umean = mean velocity, h = total flow depth and ν = kinematic viscosity), ranges between 8500 and 17,000 which means that the flow was fully turbulent.
Measurements of velocity were taken for horizontal channel slope with the use of 2DParticle Image Velocimetry (PIV). PIV is an optical method of fluid visualization and is used to obtain instantaneous velocity measurements and related properties in fluids. The fluid is seeded with tracer particles which, for the purposes of PIV, are generally assumed to faithfully follow the flow dynamics. The motion of the seeding particles is used to calculate the velocity profile of the flow. The experimental uncertainty of the measured velocity with this technique is approximately ±2 %.
The measurements were conducted at a 4 m distance from the channel’s entrance and above the top of the vegetation, where the flow is considered fully developed. The full development of the flow was confirmed comparing the velocity distributions above the vegetation in two vertical sections with a 60 cm separation distance. The uniformity of the flow was checked measuring the flow depth with point gauges at two cross-sections (4 m between the two sections). The desirable flow depth in the downstream section could be controlled using a sluice gate at the channel’s outlet. The error of the measured flow depth with the point gauge was ±0.1 mm. The total discharge was measured at the channel’s outlet using a triangular tank.

3. Mathematical Model and Numerical Simulation

3.1. Mathematical Model

The mathematical model of the turbulent flow in this study consists of the Reynolds-Averaged Navier-Stokes (RANS) equations coupled with the k-ε turbulence model. Each primitive flow variable ( u , v , w , p ) is decomposed to an averaged-in-time part and a fluctuation term., i.e.,
u = u ¯ + u , v = v ¯ + v , w = w ¯ + w , p = p ¯ + p
The use of mean values (in time) in the mass and momentum conservation equations leads to the Reynolds-Averaged Navier-Stokes (RANS) equations:
u ¯ x + v ¯ y + w ¯ z = 0
ρ [ u ¯ t + u ¯ u ¯ x + v ¯ u ¯ y + w ¯ u ¯ z ] = p ¯ x + ρ g x + μ [ 2 u ¯ x 2 + 2 u ¯ y 2 + 2 u ¯ z 2 ] ρ [ u 2 ¯ x + u v ¯ y + u w ¯ z ]
ρ [ v ¯ t + u ¯ v ¯ x + v ¯ v ¯ y + v ¯ v ¯ z ] = p ¯ y + ρ g y + μ [ 2 v ¯ x 2 + 2 v ¯ y 2 + 2 v ¯ z 2 ] ρ [ v u ¯ x + v 2 ¯ y + v w ¯ z ]
ρ [ w ¯ t + u ¯ w ¯ x + w ¯ w ¯ y + w ¯ w ¯ z ] = p ¯ z + ρ g z + μ [ 2 w ¯ x 2 + 2 w ¯ y 2 + 2 w ¯ z 2 ] ρ [ u w ¯ x + u w ¯ y + w 2 ¯ z ]
Most of engineering work is based on Boussinesq’s hypothesis which is a turbulence closure model that relates the Reynolds stresses (turbulent stresses) with the mean velocity field. For incompressible flow, the 3-D formulation of the Boussinesq’s hypothesis is written in indicial notation as:
u i u j ¯ = 2 3 k δ i j v T ( u ¯ i x j + u ¯ j x i )
where v T is a scalar quantity called kinematic turbulent viscosity or kinematic eddy viscosity and k is the mean turbulence kinetic energy:
k = 1 2 ( u 2 ¯ + v 2 ¯ + w 2 ¯ ) = 1 2 u i   u i ¯
Equation (4) can be rewritten in the form:
R = 2 v T S
where R = u i   u j ¯ 2 3 k 1 , S = 1 2 ( u ¯ j x i + u ¯ i x j ) and 1 is the unit tensor. The tensor S is the symmetric part of the mean velocity gradient tensor and R is an anisotropic tensor defined above. In this work the calculation of the turbulent viscosity at each point of the flow field is accomplished using the k-ε model. The k-ε model is a two differential equation model where the kinematic eddy viscosity is calculated by:
v T = C μ k 2 ε
Here C μ is a dimensionless quantity. The turbulence kinetic energy per unit, k , and the rate of turbulence dissipation per unit mass, ε , are calculated by concurrently solving two transport equations [18]:
k t + u ¯ i k x i = τ i j u ¯ i x j ε + x i ( v T σ k k x i ) + v 2 k
ε t + u ¯ i ε x i = C ε 1 ε k τ i j u ¯ i x j C ε 2 ε 2 k + x i ( v T σ ε ε x i ) + v 2 ε
The standard values of the constants that appear in Equations (7)–(9) are: C μ = 0.09 , C ε 1 = 1.44 , C ε 2 = 1.92 , σ κ = 1.0 , σ ε = 1.3 . Variations of these values appear in the literature.

3.2. Boundary Conditions and Mesh Design

Simulations were performed for a computational domain of length equal to 2.0 m. The remaining geometric parameters are equal to those described in the experimental setup. Periodic boundary conditions were assumed in the streamwise direction and free slip boundary condition was specified at the free surface. No-slip boundary conditions were imposed at channel solid walls. The flow velocity inside the porous layer is small. Therefore an approximate treatment is adopted by displacing the impermeable bottom planar surface to an elevation close to the upper boundary of the porous layer and assuming there a rough impermeable horizontal wall. This approximation results to a sharp interface between the homogeneous water layer and the saturated porous layer.
To achieve grid independence, a sequence of mesh designs was used. The number of tetrahedral elements used is shown in Table 1. Sensitivity to global quantities, such as mass conservation was helpful in judging approximate convergence of the solutions.

4. Results

The effect of gravel bed on flows in open channels of height above the gravel bed 5, 7, 9 and 11 cm was investigates by using the CFX solver and the experiments. Comparisons between the numerical simulation and the experiments are performed. The entries in Table 1 show that the experimental and numerical results regarding the cross-sectional mean velocities and Reynolds number are in good agreement.
Turning now to the mean velocity profile we remind the reader that a universal logarithmic behavior appears in a variety of almost parallel flows such as the boundary layers that develop over flat walls. The standard model for the mean velocity profile in a turbulent boundary layer is the three-zone model developed in the 1930s based on the work of Prandtl (inner law), von Karman (outer law) and Millikan (overlap or intermediate law). In a series of publications Barenblatt and W.K. George argued against the validity (and universality) of the logarithmic law and proposed its replacement by forms of power-law. Finally we mention that composite turbulent velocity profiles have been proposed in [19,20]. The effect of wall roughness has been studied extensively and empirical models have been developed. In addition, the flow over a porous layer situated above a horizontal impermeable wall is an active area of research.
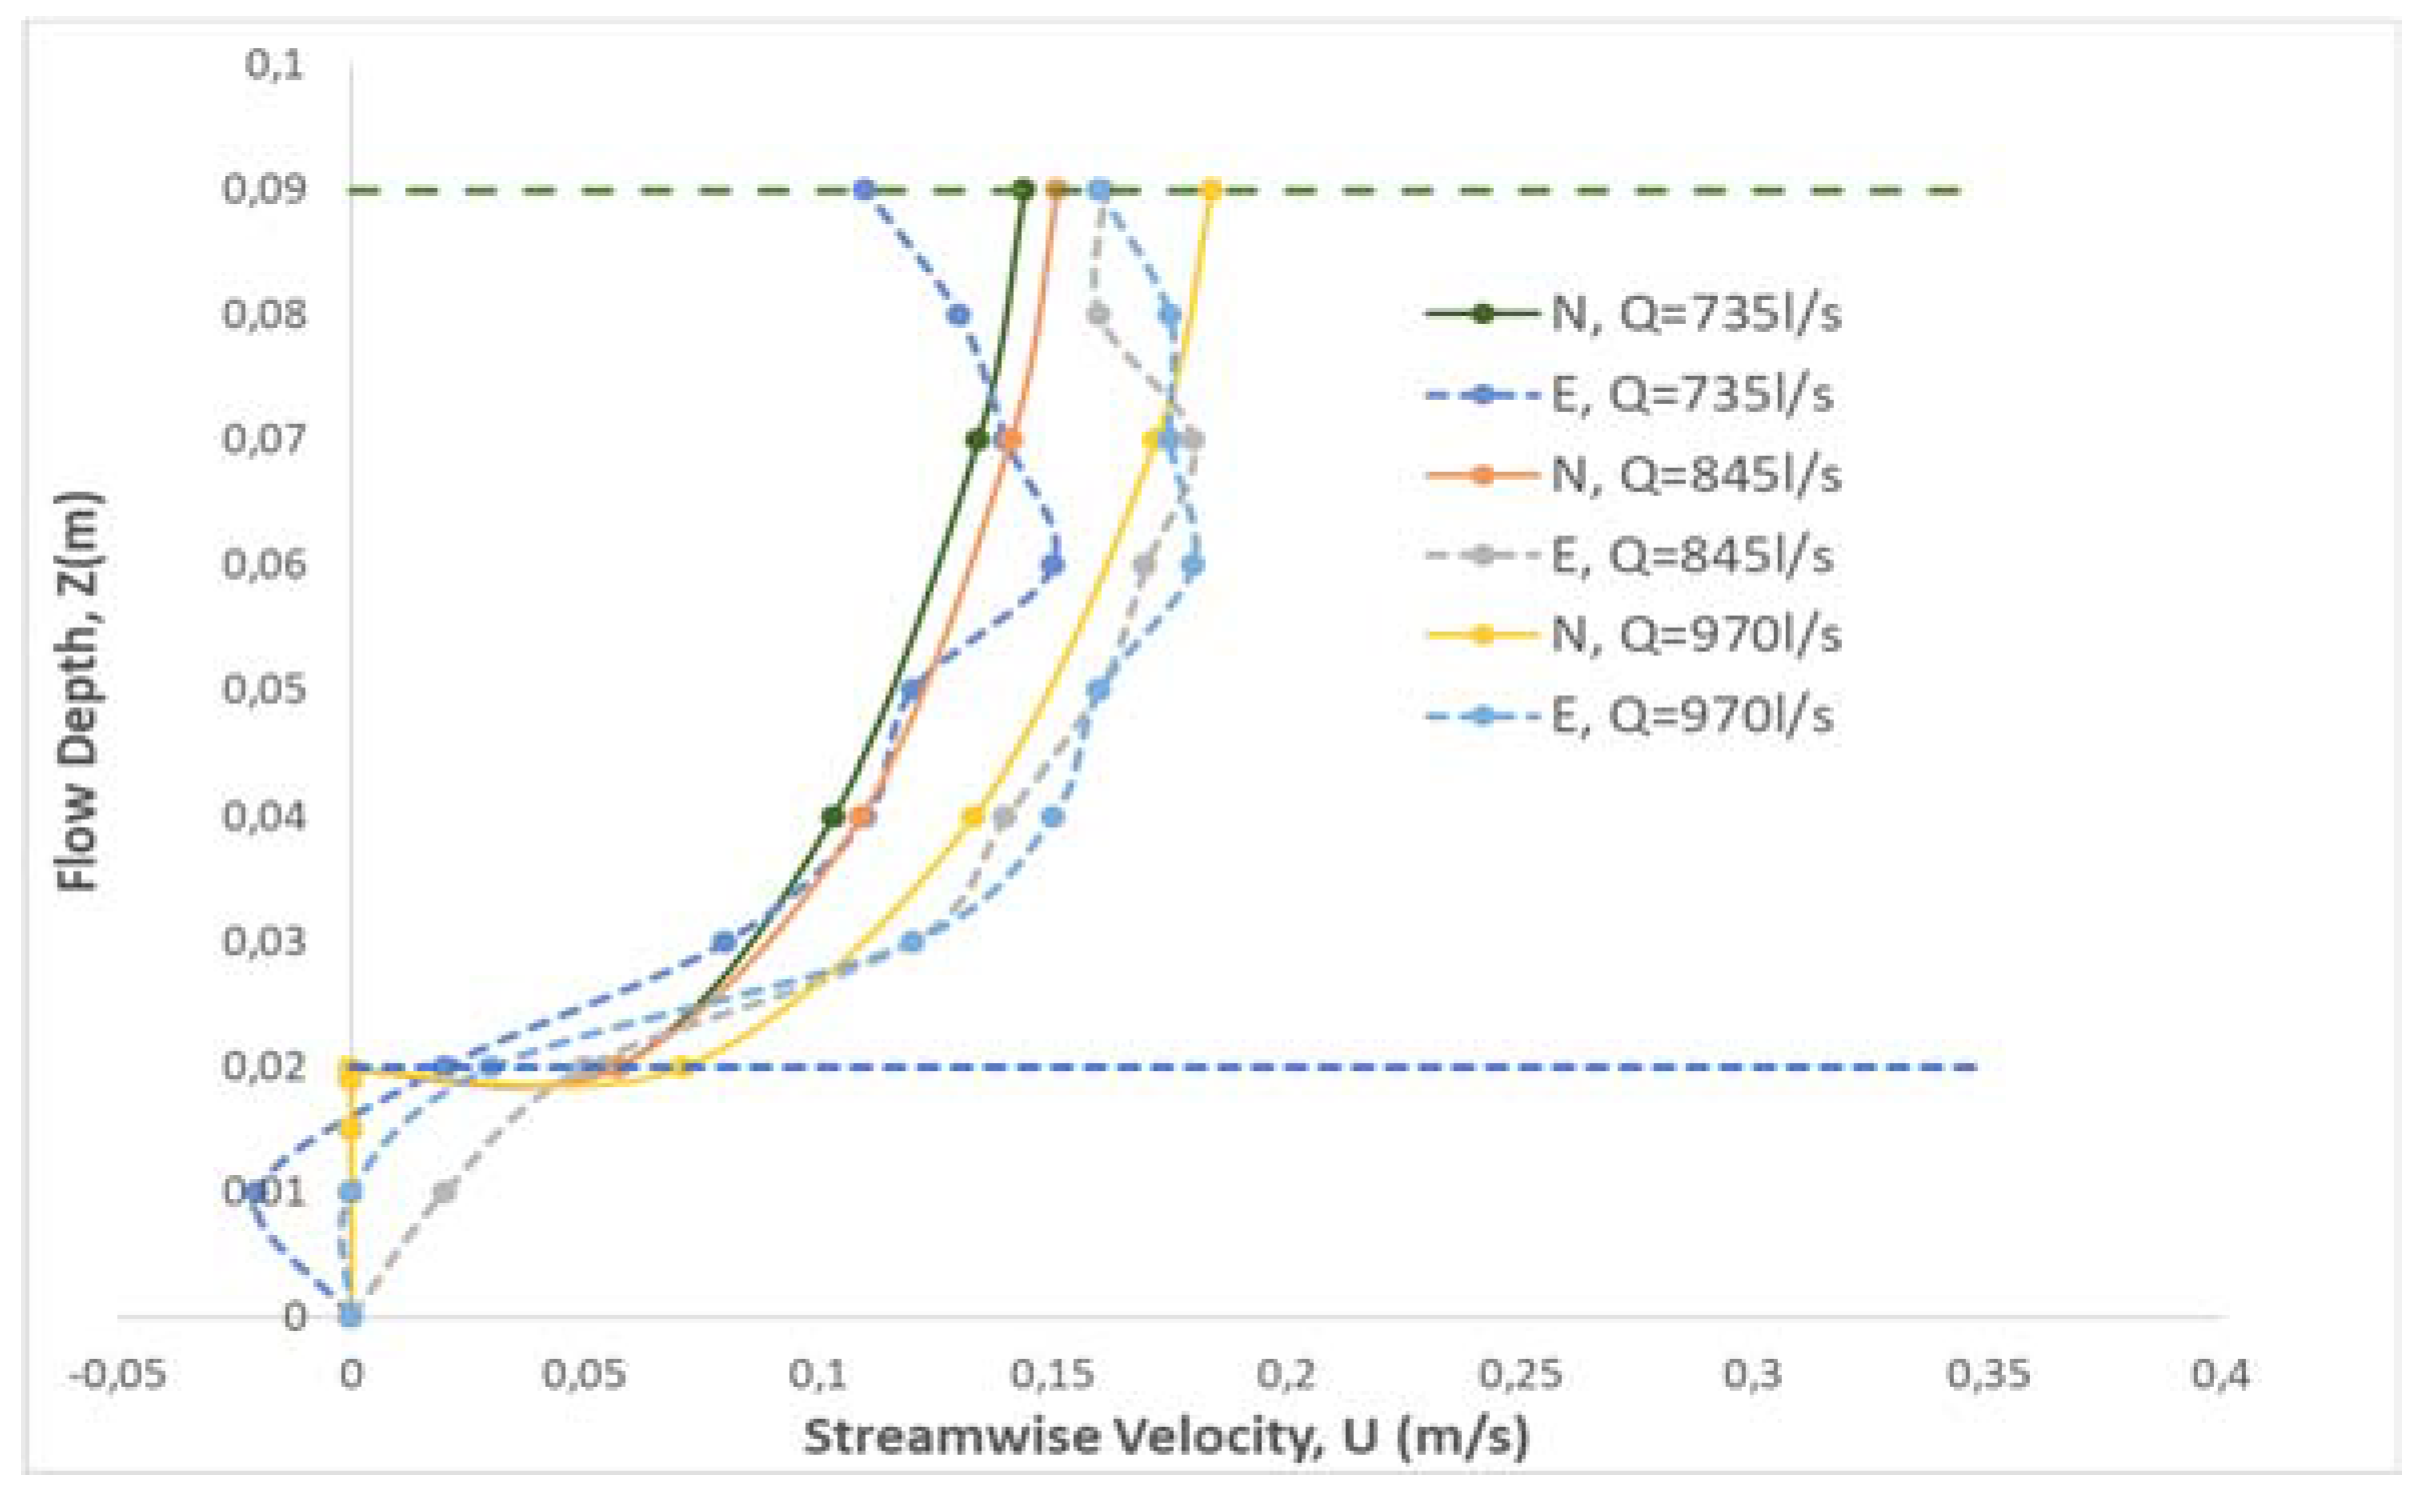
Regarding the velocity profiles, Figure 3 shows that between numerical results and experiments (for the case of h = 9 cm) there is a good agreement with very small differences (up to 7 % in all cases), regarding the profiles of mean velocity. Also in all cases (Table 1) the differences are also small (up to 15 % in all cases). The greatest difference is in the case with the major discharge Q = 0.970 L/s and with the minor flow depth h = 7 cm (14.46 %). This is normal because the amount of discharge and the water height influences the roughness of the flow with a result the increase of the differences between experimental and numerical results.
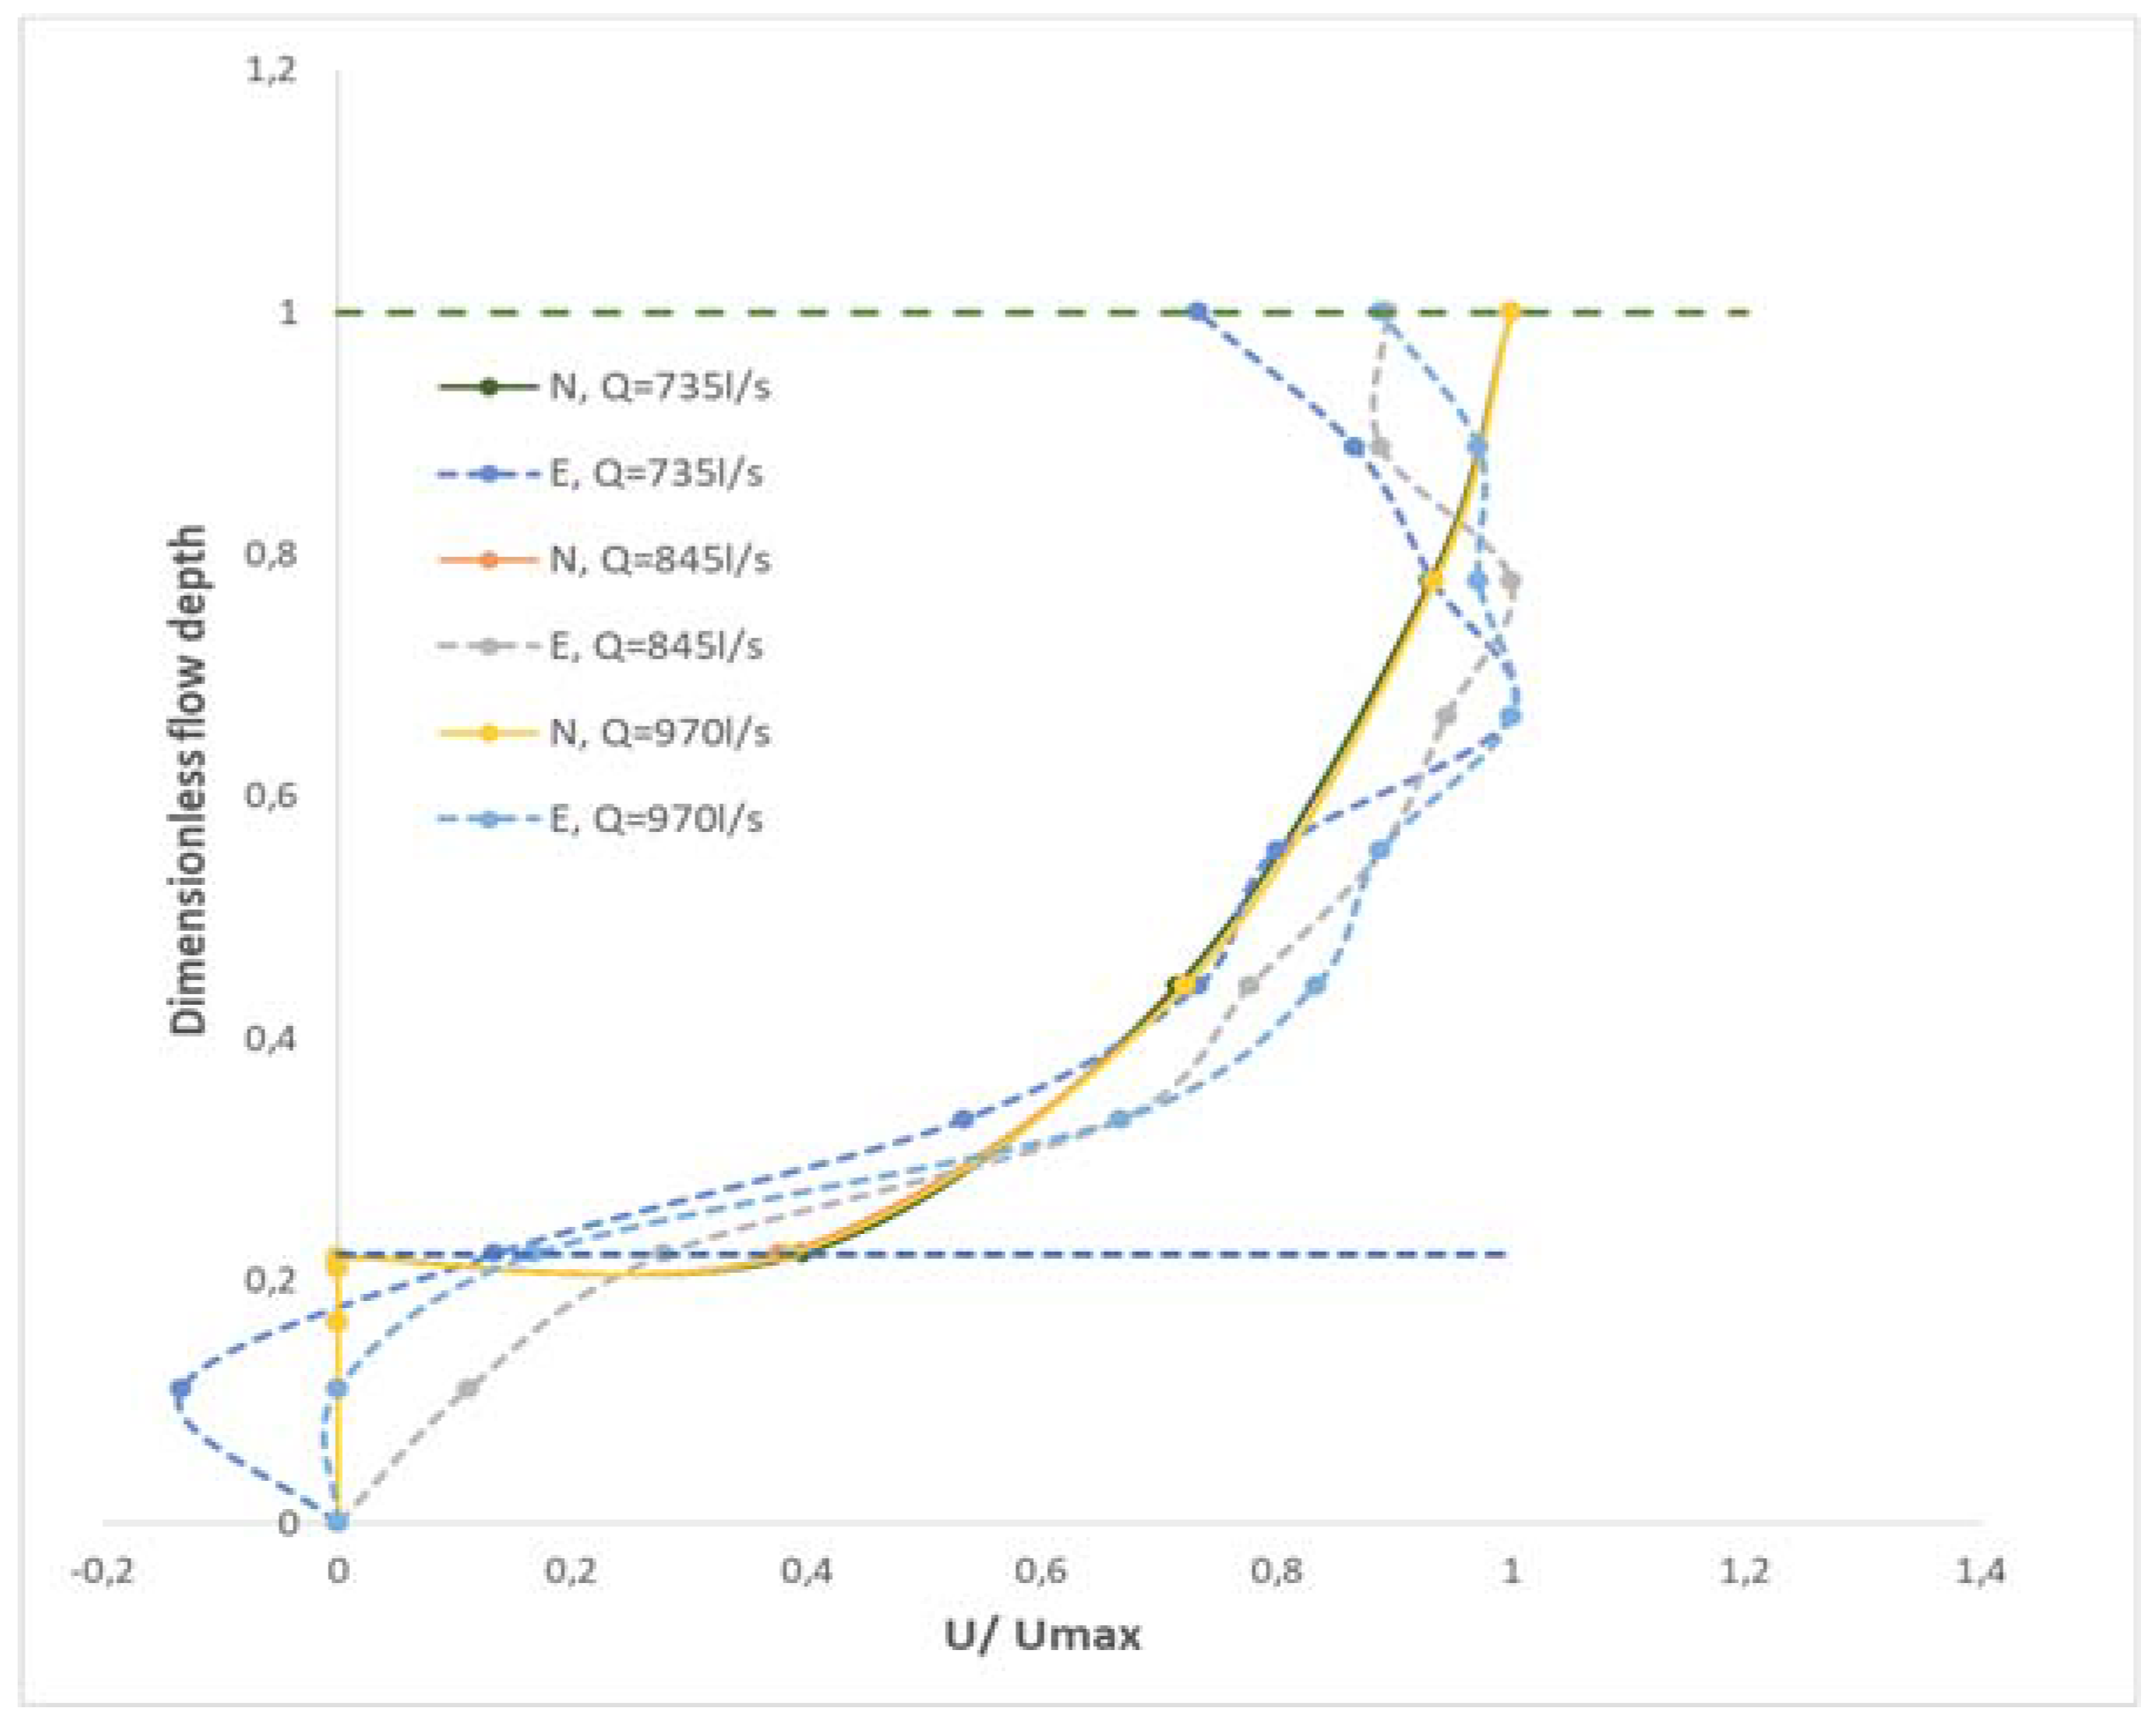
In Figure 4 the dimensionless velocity U* is plotted against the dimensionless height h*. The velocity U is made dimensionless with the maximum velocity and the height h with the maximum height h. As it shown in Figure 4 the results are very satisfactory with very small differences in all cases.

5. Conclusions

In this study the turbulent flow in an open channel with gravel bed was investigated experimentally and numerically. The flow over a porous layer of thickness 2 cm is studied by 2D PIV and a 3D CFX model. Vertical distributions of velocities above the gravel bed for different total heights were compared. The comparison shows that there is a good agreement between experimental and numerical results regarding the velocity profiles, Reynold numbers and dimensionless comparisons. In all cases the differences are lower than 15%, regarding the mean velocity. The mathematical model adopted in this work assumes a sharp interface at a displacement height close to the upper boundary of the porous layer and an equivalent roughness height. If one wants to develop a more elaborate model of the flow under study one has to solve the Navier-Stokes equations in the homogeneous fluid region and the Darcy or Forchheimer, or Brinkman equation in the porous medium with appropriate interface conditions. To avoid the disadvantages of the isotropic turbulence models based on Boussinesq’s assumption we believe that an LES-based model will be appropriate for the problem at hand. Post processing the LES solution with a Proper Orthogonal Decomposition (POD) methodology [21,22,23,24] will reveal the vortical structures that develop near the interface.

Author Contributions

G.P. and E.K. conceived and designed the experiments; G.P. and E.K. performed the experiments; A.L., N.M. and D.K. conceived and designed the numerical simulations; N.M. and D.K. analyzed the data; E.K. and A.L. wrote the paper.

References

  1. Schalchi, U. The clogging of coarse gravel river beds by fine sediment. Hydrobiologia 1992, 235, 189–197. [Google Scholar] [CrossRef]
  2. Brunke, M.; Gonser, T. The ecological significance of exchange processes between rivers and groundwater. Freshw. Biol. 1997, 37, 1–33. [Google Scholar] [CrossRef]
  3. Keramaris, E. Comparison between different porous bed (porous filter and rods bundle) in open channels. J. Porous Media 2010, 13, 183–193. [Google Scholar] [CrossRef]
  4. Pechlivanidis, G.; Keramaris, E.; Pechlivanidis, I. Experimental Study of the Effects of Permeable Bed (Grass Vegetation and Gravel Bed) on the Turbulent Flow Using Particle Image Velocimetry. J. Turbul. 2015, 16, 1–16. [Google Scholar] [CrossRef]
  5. Keramaris, E. Effects of inclined impermeable bed on turbulent characteristics of the flow using particle image velocimetry. J. Turbul. 2015, 16, 540–554. [Google Scholar] [CrossRef]
  6. Keramaris, E.; Pechlivanidis, G. The influence of transition from vegetation to gravel bed and vice versa in open channel using the PIV method. Water Utility J. 2015, 10, 37–43. [Google Scholar]
  7. Keramaris, E.; Pechlivanidis, G.; Pechlivanidis, I. The different impact of a half-separated gravel and vegetated bed in open channels. Environ. Process. 2015, 2, 123–132. [Google Scholar] [CrossRef]
  8. Guo, J.; Zhang, J. Velocity distribution in laminar and turbulent vegetated flow. J. Hydraul. Res. 2016, 54, 117–130. [Google Scholar] [CrossRef]
  9. Voermans, J.J.; Ghisalberti, M.; Ivey, G.N. The variation of flow and turbulence across the sediment-water interface. J. Fluid Mech. 2017, 824, 413–437. [Google Scholar] [CrossRef]
  10. Klopstra, D.; Bameveld, H.J.; Van Noortwijk, J.M.; Van Velzen, E.H. Analytical model of hydraulic roughness of submerged vegetation. Proceedings of the 27th IAHR Congress, San Francisco, CA, USA, 10–15 August 1997; American Society of Civil Engineers: New York, NY, USA, 1997; pp. 775–780. [Google Scholar]
  11. Meijer, D.G.; Van Velzen, E.H. Prototype-scale flume experiments on hydraulic roughness of submerged vegetation. In Proceedings of the 28th IAHR Congress, Graz, Austria, 22–27 August 1999; Institute of Hydraulics and Hydrology, Technical University of Graz: Graz, Austria, 1999; p. 221. [Google Scholar]
  12. Lopez, F.; Garcia, M. Mean flow and turbulence structure of open channel flow through non-emergent vegetation. J. Hydraul. Eng. 2001, 127, 392–402. [Google Scholar] [CrossRef]
  13. Defina, A.; Bixio, A. Mean flow and turbulence in vegetated open channel flow. Water Resour. Res. 2005, 41, 1–12. [Google Scholar] [CrossRef]
  14. Wilson, C.A.M.E.; Yagci, O.; Rauch, H.P.; Olsen, N.R.B. 3D numerical modeling of a willow vegetated river/floodplain system. J. Hydrol. 2006, 327, 13–21. [Google Scholar] [CrossRef]
  15. Keramaris, E.; Pechlivanidis, G.; Kasiteropoulou, D.; Michalolias, N.; Liakopoulos, A. Experimental and numerical analysis in open channel turbulent flow. Procedia Eng. J. 2016, 162, 381–387. [Google Scholar] [CrossRef]
  16. Keramaris, E.; Kasiteropoulou, D.; Liakopoulos, A.; Michalolias, N.; Pechlivanidis, G. A study of flow in open channels with vegetation: Experiments and numerical models. Spec. Top. Rev. Porous Media 2017, 8, 109–129. [Google Scholar] [CrossRef]
  17. Keramaris, E.; Pechlivanidis, G.; Pechlivanidis, I.; Samaras, G. The impact of lateral walls on the velocity profile in an open channel using the PIV method. In Proceedings of the 13th International Conference on Environmental Science and Technology, Athens, Greece, 5–7 September 2013. [Google Scholar]
  18. Liakopoulos, A. Fluid Mechanics; Tziolas Publication: Thessaloniki, Greece, 2010. (In Greek) [Google Scholar]
  19. Liakopoulos, A. Explicit Representations of the Complete Velocity Profile in a Turbulent Boundary Layer. AIAA J. 1984, 22, 844–846. [Google Scholar] [CrossRef]
  20. George, W.K.; Castillo, L. Zero-pressure-gradient turbulent boundary layer. Appl. Mech. Rev. 1997, 50, 689–729. [Google Scholar] [CrossRef]
  21. Lumley, J.L. Stochastic Tools in Turbulence; Academic: New York, NY, USA, 1971; pp. 54–82. [Google Scholar]
  22. Sirovich, L. Turbulence and the Dynamics of Coherent Structures, Parts I–III. Q. Appl. Math. 1987, 45, 561–590. [Google Scholar] [CrossRef]
  23. Cipolla, K.; Liakopoulos, A.; Rockwell, D.O. Quantitative Imaging in Proper Orthogonal Decomposition of Flow Past a Delta Wing. AIAA J. 1998, 36, 1247–1255. [Google Scholar] [CrossRef]
  24. Kim, Y.; Rockwell, D.; Liakopoulos, A. Quantitative flow interpretation of vortex buffeting on an aircraft tail via proper orthogonal decomposition (POD). AIAA J. 2005, 43, 550–559. [Google Scholar] [CrossRef]
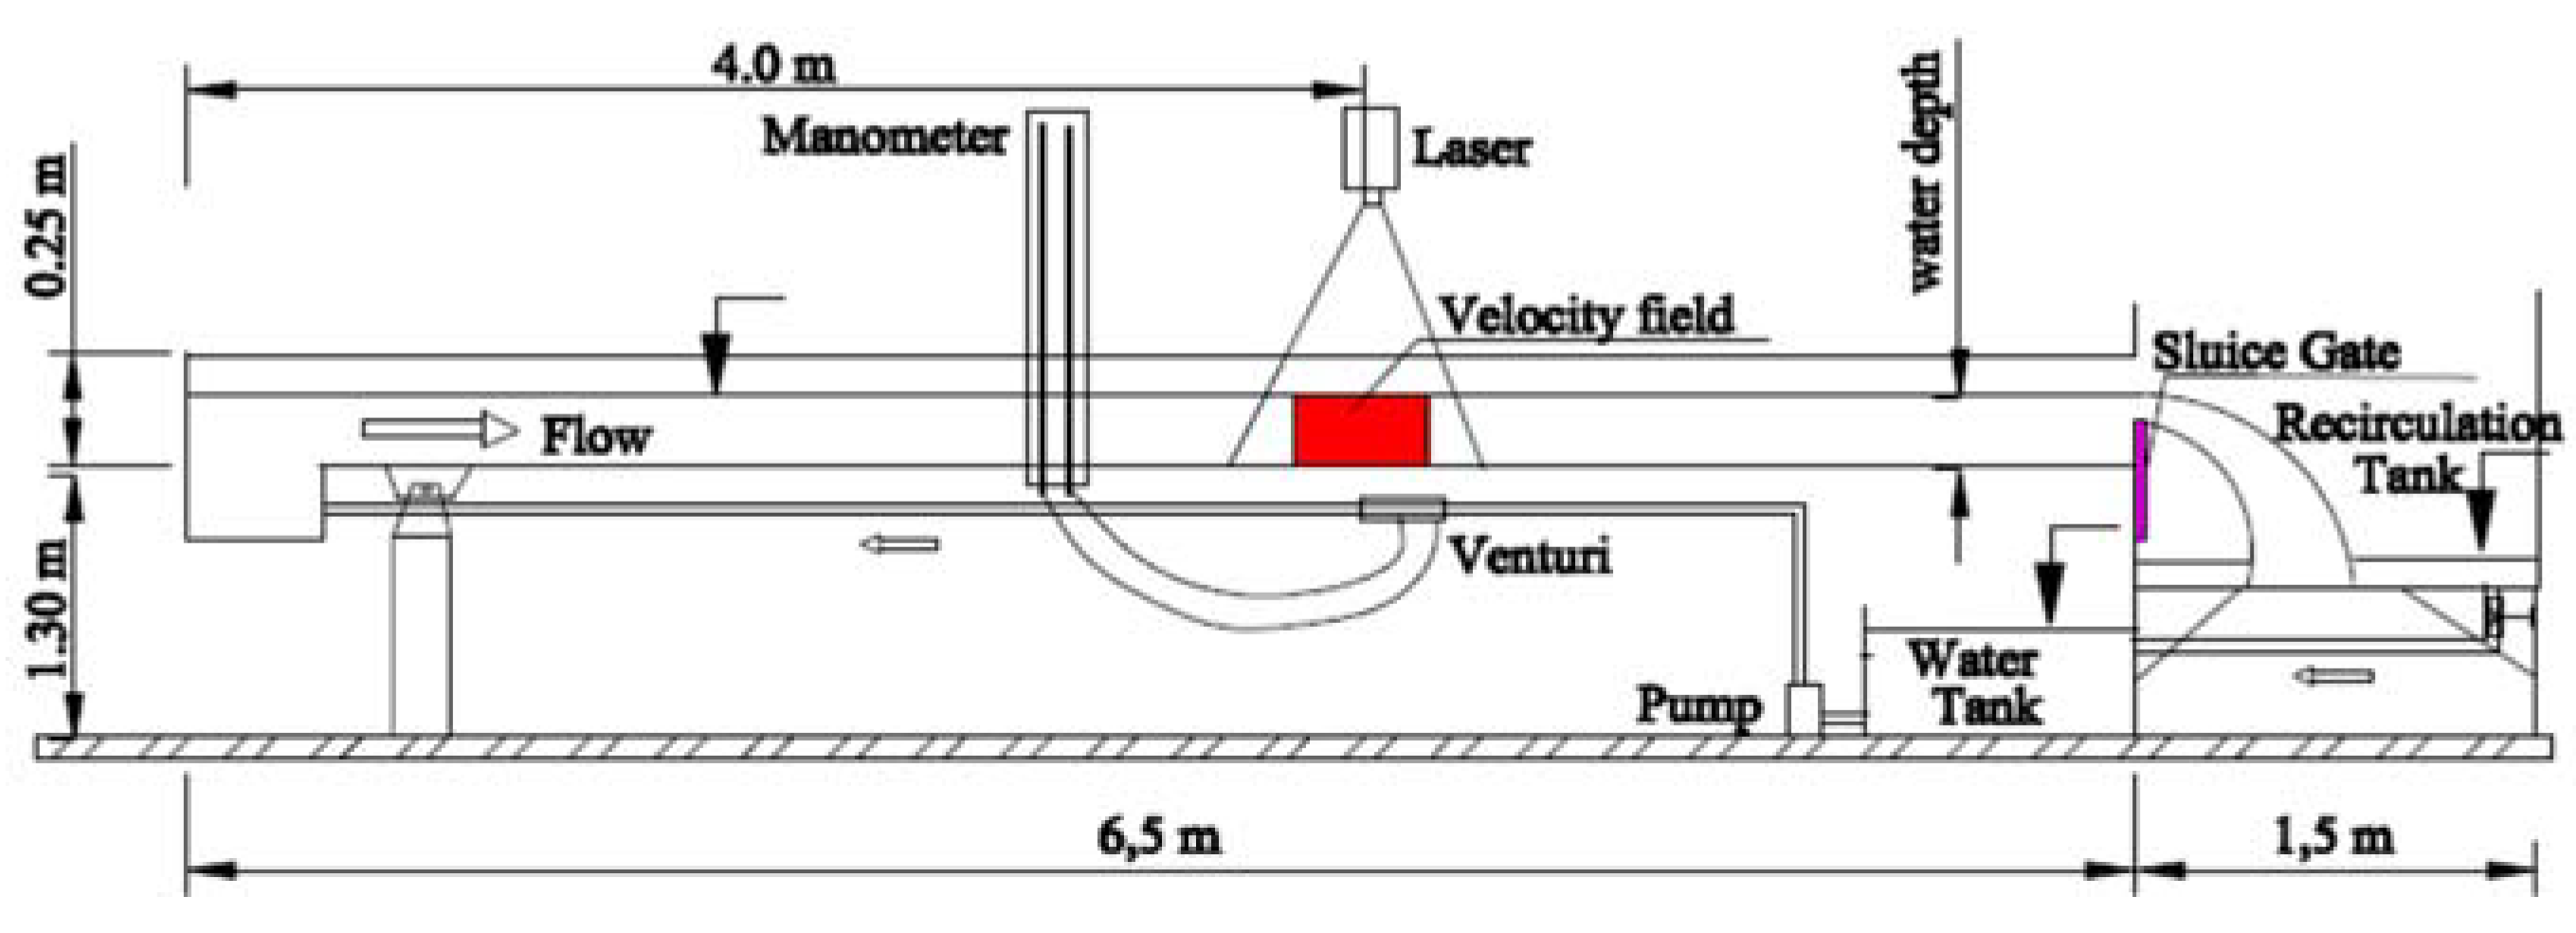
Figure 1. Experimental set-up.
Proceedings 02 00581 g001
Figure 2. Turbulent flow characteristics Photogragh 1. Gravel bed with hv = 2 cm.
Proceedings 02 00581 g002
Figure 3. Velocity profiles for h = 9 cm, (N) for numerical results, (E) for experimental results.
Proceedings 02 00581 g003
Figure 4. Dimensionless comparisons for h = 9 cm.
Proceedings 02 00581 g004
Table 1. Mesh parameters and comparison between experimental and numerical results.
Discharge (L/s)h (cm)Umean (m/s) Exp/NumRe Exp/NumDifferences (%)Number of NodesNumber of Tetrahedra
0.73570.145/0.13610,150/95206.2019,65886,468
0.73590.106/0.1139540/10,1706.6024,163110,949
0.735110.090/0.0919900/10,0101.1128,244134,197
0.735130.067/0.0708710/91004.4732,713158,558
0.84570.167/0.16111,690/11,2703.5919,65886,468
0.84590.133/0.12711,970/11,4304.5124,163110,949
0.845110.103/0.09911,330/10,8903.8828,244134,197
0.845130.083/0.08210,790/10,6601.2032,713158,558
0.97070.235/0.20116,450/14,07014.4619,65886,468
0.97090.163/0.15414,670/13,8605.5224,163110,949
0.970110.129/0.11514,190/12,65010.8528,244134,197
0.970130.105/0.09513,650/12,3509.5232,713158,558
Publisher’s Note: MDPI stays neutral with regard to jurisdictional claims in published maps and institutional affiliations.