Abstract
This study presents the results of laboratory experiments that were performed to simulate the positions of mussel shocks which were selected aiming at the optimization of the quality of mussels’ production in mussel farming areas. The mussel shocks were studied in natural scale. Velocity measurements were taken upstream of two successive mussel shocks and for different positions in relation to the central axis of the channel and different distances between the shocks for three different mean velocities. Based on the results of several numbers of experiments, the main conclusion of this study was that the position and the distance between the mussel shocks play a significant role to the quality of mussels’ production in mussel farming areas. This is due to the fact that the different distances between the mussel shocks influence the velocities and the eddies around them.
1. Introduction
Several studies based on the Navier-Stokes equations have been done, trying to offer a sound base in understanding the motion of the fluids. Although numerical approaches have been successfully investigated by many researchers, there are only a few experimental studies to compare the experimental with the numerical results.
The interaction between two circular cylinders in tandem and side-by-side arrangements was studied experimentally by some researchers. Initially it was investigated how the flows around two circular cylinders, displaced in a plane normal to the free stream, interact as the two bodies are brought close together [1]. Correlation measurements of hot-wire outputs indicate how mutual interference influences the formation of vortex streets from the two cylinders. Spanwise correlation measurements show that the correlation length doubles as the cylinders are brought into contact.
Ko and Wang (1973) [2] studied the flow interference between two circular cylinders of different diameters in tandem and staggered arrangements. The flow patterns are related to their spacing and Reynolds number and similar flow regions are established as in the case of cylinders of equal diameter. Their investigation concerns the interference between two circular cylinders of different diameters in various arrangements.
Moryia et al. (2002) [3] showed experimental results in detail for the time-averaged drag and lift coefficients of two circular cylinders in tandem arrangement. They reported that the values of the drag and lift coefficients suddenly change when a spacing ratio S/D (S is the spacing between the centers of the cylinders, D is the diameter of the cylinders) is equal to 4 and, especially, showed that large variations of the fluctuating drag and lift coefficients on the leeward cylinder appear in the range of smaller spacing than the critical spacing.
The productivity in an organized mussel culture area is closely related to the hydrodynamics in the area where the mussel units are located. More specifically, the performance seems to be directly influenced from a number of factors among which we can refer the pattern of the layout and the extent of the unit, the topographic, geological and hydrodynamic characteristics of the cultivation area as well as physicochemical and biological parameters of the marine environment.
Plew (2005) [4] in the framework of his doctoral research, conducted both field and laboratory experiments, however the latter experiments were based on the use of cylinders. The flow over two in-line cylinders, in laminar and turbulent regime was also studied with the help of numerical simulations by [5]. Furthermore, Gawad et al. 2013 [6] studied the turbulent-flow characteristics and the mechanism of vortex shedding behind one and two square obstacles centered inside a 2-D channel. The study was based on the use of large eddy simulation and finite-element technique.
Konstantinou et al. (2011) [7] presented a comparison between two proposed methods of assessing the capability of a longline mussel farm to conserve the quality of the mussels in relation to the characteristics of the farm and the hydrodynamic conditions. These methods resulted to coefficients related to the aforementioned capability of each farm layout to efficiently support the mussels’ production and consequently the viability of the mussels farming activity. Also, Konstantinou et al. (2015) [8] introduced a first approach of numerical parameterization of a mussel shock as a porous medium for the better understanding and description of the interaction between the farming structures and the seawater circulation.
Recently, Pechlivanidis et al. (2017) [9] performed experiments using the natural scale of a shock and using current velocities in the entrance of the channel that were usually recorded in the field. The specific positions for the measurements, the depth of the flow and the velocity currents were also determined. A basic research parameter used in the experiment was the distance between the mussel shocks. The final goal was the determination of the velocity field in the areas around the shocks. The results showed that the distance between the mussel shocks influences significantly the velocity distribution around and through the mussel shocks.
In this study, further laboratory experiments in the aforementioned open channel for the turbulent simulation of the flow around and through the mussel shocks were performed. The laboratory experiments were realized using two successive shocks, where the second shock was either in the same line of the central axis of the channel, i.e., parallel to the flow direction, or forming an angle between the line of the two shocks and the flow direction. Thus, velocity measurements downstream of the first mussel shock and upstream of the second one for different distances between the shocks and also for different positions of the shocks in relation to the central axis of the channel were taken, for three different mean velocities.
2. Materials and Methods
2.1. Experimental Procedure
The laboratory experiments were realized using the natural scale of a shock and using current velocities in the entrance of the channel that were usually recorded in the field. Velocity measurements in front of two successive mussel shocks for horizontal distance between the shocks L = 500 mm were taken for three different mean velocities U (5, 7 and 9 cm/s). Figure 1a shows a sketch of the physical model in the laboratory with the mussel shocks (blue circles) and the areas for the description of the velocity field upstream (position 1) and downstream (position 2) in the middle of a cross section normal to the flow (red rectangular box). Figure 1b shows the next step of the laboratory experiments where the second mussel shock and the corresponding area of the captured velocity in front of this, are not on the central axis of the channel, as in the case of Figure 1a. Similarly to the first group of experiments of Figure 1a, velocity measurements in front of the two mussel shocks with horizontal distance at x axis between the shocks L = 500 mm and the vertical distance at y axis K = 150 mm were studied (Figure 1b) for three different mean velocities U (5, 7 and 9 cm/s). The experimental set-up and a photograph of a mussel shock are shown in Figure 2.
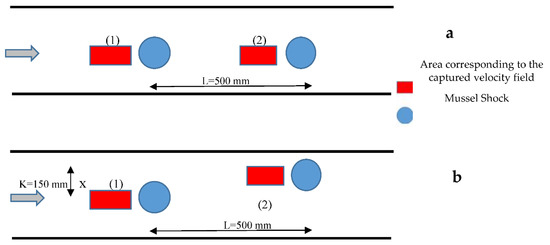
Figure 1.
Mussel shocks and the area for the description of the velocity field in front of two successive mussel shocks. (a) corresponds to the case with the shocks on the central axis of the channel, while (b) corresponds to the case where the line connecting the two shocks forms an angle with the central axis of the channel.
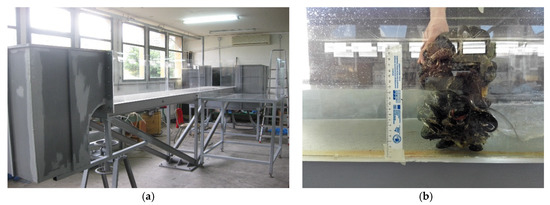
Figure 2.
(a) Experimental set-up and (b) a photograph of a mussel shock.
The mean velocity values used in the experiment corresponded to 0.5 V, 3.0 V and 3.5 V, respectively. The depth of the flow was 20 cm and was specified with the help of a sluice gate in the downstream part of the channel’s water reservoir.
Measurements of the velocity were taken for the horizontal plane of the channel’s bottom. PIV is an optical method of fluid visualization and is used to obtain instantaneous velocity measurements and related properties in fluids. The fluid is seeded with tracer particles, which in PIV are generally assumed to faithfully follow the flow dynamics. The motion of the seeding particles is used to calculate the velocity profile of the flow. The experimental uncertainty of the measured velocity with this technique is approximately ±2%. The measurements were conducted at a 4 m distance from the channel’s entrance and above the top of the vegetation, where the flow is considered fully developed. The full development of the flow was confirmed by comparing the velocity distributions above the vegetation in two vertical sections with a separation distance of 60 cm. The uniformity of the flow was checked by measuring the flow depth with point gauges at two cross sections (4 m between the two sections). The desirable flow depth in the downstream section was controlled by using a sluice gate at the channel’s outlet. The error of the measured flow depth with the point gauge was ±0.1 mm. The total discharge was measured at the channel’s outlet by using a triangular tank.
2.2. Measurements
The Particle Image Velocimetry (P.I.V.) technique was used successfully from the researchers of this study in their previous researches [10,11,12]. The PIV system which was used for the measurement of the velocity distribution in the flow domain, was a two-dimensional one consisting of a twin pulsed Nd: Yag lasers (532 nm wavelength, 300 mJ/pulse at 10 Hz), a cross correlation 8 bit 1 K × 1 K CCD camera (Kodak, MEGAPLUS ES 1.0), a synchronizer, a computer, an image acquisition system and a PIV analysis software (Insight 3G). The laser beams were combined and formed a 1 mm wide sheet by using semi-cylindrical optics. The camera image size had 1600 × 1192 pixel array and the dimension of the velocity field was kept to 291 mm × 214 mm for all the experiments. It means that the resolution of the captured images was typically 5.5 pixel/mm or that the pixel length was 0.1818 mm. The laser was installed above the tank at a distance of 50 cm from the illuminated water free surface, while the camera viewed from an orthogonal direction. Twin images were recorded with a time separation of 1.5 ms. The plane photographs were divided into interrogation spots measuring 32 × 32 pixels (5.79 mm × 5.79 mm). 200 pairs of images were captured in each experiment.
The image evaluation methods are necessary to derive the displacement information from raw particle images. The preferred evaluation method in PIV is to capture two images on two separate frames, and perform multistep cross correlation analysis. This cross correlation function has a significant peak, providing the magnitude and direction of the velocity vector without ambiguity. The correlation methods are commonly based on digital Fast Fourier Transform (FFT) algorithms for calculating the correlation functions. In the FFT-based correlation analysis, we have to pad the interrogation window with zeros and get correlation map of the right size and avoid aliasing problem.
The cross correlation between the interrogation spots determined the mean displacement of the particles and thereof the velocity vector. The cross correlation operation was based on the correlation theorem, stating that the correlation on the spatial domain becomes multiplication on the frequency domain. Correlation made use of the FFT. Adjacent interrogation spots were overlapped by 50%, providing a resolution of about 3 mm. After that calculation, the velocity data were filtered with a signal-to-noise filter, a peak height filter, and global and local filters in order to remove error vectors. The correlation signal-to-noise-ratio (SNR) metrics calculated from the correlation plane can be used to quantify the quality of the correlation and the resulting uncertainty of an individual measurement. In this case, the correlation peak representative of the displacement reading is compared to the first noise peak in the correlation map. A low ratio of the peak heights may point to an inadequately seeding area and a higher likelihood that the measured displacement is questionable. In terms of validation, it is less effective because mismatched areas may have high correlation coefficients especially when seeding levels are low.
Global filtering removes the obvious outliers, i.e., the vectors, the length of which is larger than the mean of the flow field plus 3 times its standard deviation. These are global outliers in the statistical sense. Local filtering is performed on small neighborhoods of vectors, e.g., 3 × 3 or 5 × 5, in order to find local outliers—the vectors that are dissimilar from the close neighbors. There are about 5% of erroneous vectors and these are removed and later the missing values are interpolated from the neighbor vector values [13].
The fluid was seeded with tracer particles which, for the purposes of PIV, were generally assumed to follow the flow dynamics. These particles had size of about 10 μm in clean water. The motion of the seeding particles was used to calculate the velocities in magnitude and phase. The distance between two neighbor velocity vectors was 3 mm. The experimental uncertainty of the measured velocity with this technique was approximately ±2% [14].
The processing algorithm maintains a spatial displacement accuracy of less than approximately 0.1 px, so that the spatial displacement error is on the order of less than 2.5% for a particle displacement of four pixels. The error associated with temporal variations in the laser pulse synchronization due to the jitters of the electronics is negligible since it is several orders of magnitude smaller [15,16].
In the present study, the curves of the velocity profiles along x and y axis were commuted, as well as the resultant velocities. In this way, the water flow around and through the shocks was described.
3. Analysis of Results
In Figure 3 and Figure 4, the velocity profiles for position 1 and position 2 in front of the two successive mussel shocks, on the central axis of the channel, are shown. The main difference between these two figures is that in the upstream position near the mussels, eddies are formed and for this reason backward movements of the fluid are observed. The horizontal distance between the shocks and the initial mean velocity in each case are: (a) L = 500 mm, U = 5 cm/s (b) L = 500 mm, U = 7 cm/s and (c) L = 500 mm, U = 9 cm/s. The mean velocities, as it is shown in Figure 3 are very low (<1 mm/s). The presence of negative velocities is due to the creation of eddies in the region of the mussels which have as a result the backward movements of the fluid.
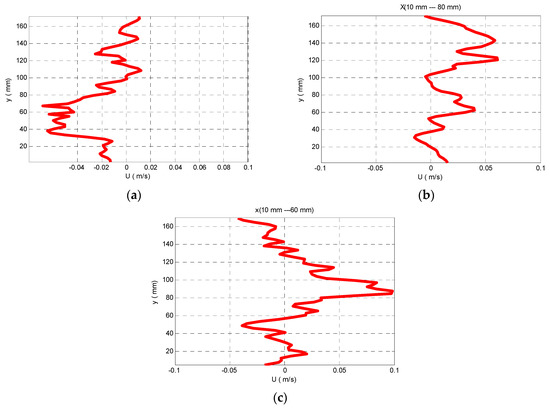
Figure 3.
Velocity profiles upstream of the first mussel shock for velocity at the entrance of the channel (a) 5 cm/s, (b) 7 cm/s and (c) 9 cm/s.
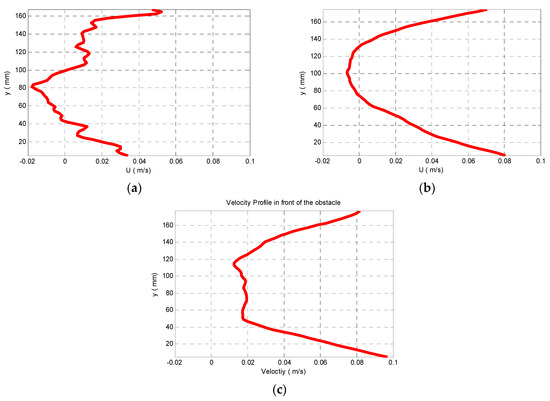
Figure 4.
Velocity profiles downstream (position 2) in front of the second mussel shock, when the shocks are on the central axis of the channel, for distance between the shocks L = 500 mm and velocity (a) 5 cm/s, (b) 7 cm/s and (c) 9 cm/s.
As given by [10], Figure 4 shows the velocity profiles for the position 2, downstream of the first shock, i.e., upstream of the second shock. The two successive shocks are in line with the central axis of the channel and the horizontal distance between the shocks is L = 500 mm, while the initial mean velocity varies between (a) U = 5 cm/s (b) U = 7 cm/s and (c) U = 9 cm/s.
In the present research the investigation was focused mainly on the case where the line connecting the two shocks form an angle with the central axis of the channel and thus with the main stream of the channel (Figure 2b). The velocity profiles for horizontal distance between the shocks L = 500 mm and initial velocity currents 5, 7 and 9 cm/s are shown in Figure 5.
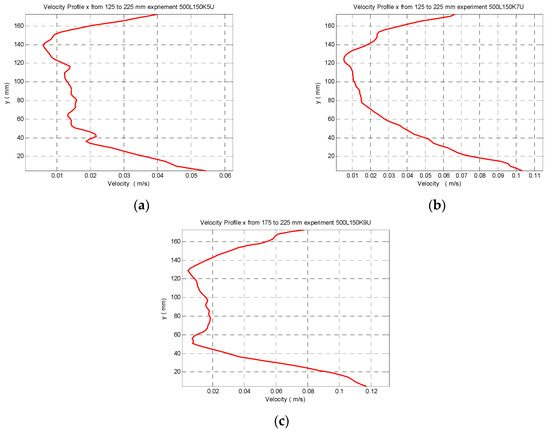
Figure 5.
Velocity profiles downstream (position 2) in front of the second mussel shock, when the line connecting the shocks form an angle with the central axis of the channel (and thus with the main stream) for velocity at the entrance of the channel (a) 5 cm/s, (b) 7 cm/s and (c) 9 cm/s.
From the comparison of the velocity profiles between these two spatial formations of the mussel shocks it is obvious that the velocities referring to the case of the angle between the main flow direction and the line of the successive shocks, are slightly greater than these where the shocks are in line with the flow direction as studied by [10]. From this conclusion it is obvious that the position of the second mussel shock in relation to the first mussel shock, plays a significant role regarding the mean velocities in the downstream area. The presence of the second mussel shock influences significantly the mean velocities behind the position of the first mussel shock. More specifically, the second case of an angle between the flow direction and the line of the two shocks, seems that presents a slightly better hydraulic behavior than the first case, since it entails largest percentage for the class 5–10 cm/s, which is the most suitable current speed for the mussel farming activity according to [17].
4. Conclusions
In this study, laboratory experiments in an open channel for the turbulent simulation of the flow around and through the mussel shocks were performed. The main conclusions are as follows:
In the area before the first mussel shock, the mean velocities are very low (approximately 1 mm/s). This is due to the fact that in the upstream position near the mussels, eddies are formed and for this reason backward movements of the fluid are observed and this fact reduces significantly the mean velocities.
The presence of negative velocities in the area before the first mussel shock is due to the formation of eddies in the region of the mussels.
In the area between the first and the second mussel shock the mean velocities are much greater in comparison with these in the upstream area.
The position of the second mussel shock in relation to the first mussel shock plays a significant role regarding the mean velocities in the downstream area. The mean velocities in the case of the two mussels in the same horizontal line and parallel to the flow are lower than these in the case at which the line between the two mussels forms an angle with the direction of the flow. This is due to the fact that the presence of mussel shocks in the same direction creates eddies that reduce the mean velocities in front of the mussel shocks.
Author Contributions
G.P. and E.K. conceived and designed the experiments; G.P. and E.K. performed the experiments; G.P., E.K. and Y.S. analyzed the data; E.K. and Y.S. wrote the paper.
Acknowledgments
Success project has received funding from the European Union’s H2020 program under grant agreement No. 635188ll.
References
- Bearman, P.W.; Wadcock, A.J. The interaction between a pair of circular cylinders normal to a stream. J. Fluid Mech. 1973, 61, 499–511. [Google Scholar] [CrossRef]
- Ko, N.W.M.; Wang, P.T.Y. Flows past two circular cylinders of different diameters. J. Wind Eng. Ind. Aerodyn. 1973, 41–44, 563–564. [Google Scholar] [CrossRef]
- Moriya, M.; Sakamoto, H.; Kiya, M.; Arie, M. Fluctuating fluid forces of two circular cylinders in tandem arrangement at close spacing. Trans. Jpn. Soc. Mech. Eng. 2002, 68, 1400–1406. (In Japanese) [Google Scholar] [CrossRef]
- Plew, D.R. The Hydrodynamic Effects of Long-Line Mussel Farms. Ph.D. Thesis, Department of Civil Engineering, University of Canterbury, Christchurch, New Zealand, 2005. [Google Scholar]
- Ghadiri, D.B.; Sarvghad, M.H.; Houri, J.H. Numerical simulation of flow over two circular cylinders in tandem arrangement. J. Hydrodyn. 2011, 23, 114–126. [Google Scholar]
- Gawad, A.F.A.; Mohamed, N.A.; Mohamed, S.A.; Matbuly, M.S. Investigation of the channel flow with internal obstacles using large eddy simulation and finite-element technique. Appl. Comput. Math. 2013, 2, 1–13. [Google Scholar] [CrossRef]
- Konstantinou, Z.; Savvidis, Y.; Kombiadou, K.; Krestenitis, Y. Mussel farm layout scenarios as management alternatives. In Proceedings of the Tenth International Conference on the Mediterranean Coastal Environment, Rhodes, Greece, 25–29 October 2011; pp. 735–746. [Google Scholar]
- Konstantinou, Z.; Kombiadou, K.; Krestenitis, Y. Effective mussel-farming governance in Greece: Testing the guidelines through models, to evaluate sustainable management alternatives. Ocean Coast. Manag. 2015, 118, 247–258. [Google Scholar] [CrossRef]
- Pechlivanidis, G.; Antoniou, A.; Savvidis, Y. Experimental-laboratory study of the flow around mussel shocks. Int. J. Eng. Res. Sci. 2017, 3, 76–83. [Google Scholar] [CrossRef]
- Keramaris, E.; Pechlivanidis, G. PIV measurements over a permeable and an impermeable bed. J. Porous Media 2013, 16, 21–28. [Google Scholar] [CrossRef]
- Keramaris, E. Effects of inclined impermeable bed on the turbulent characteristics of the flow using particle image velocimetry. J. Turbul. 2015, 16, 540–554. [Google Scholar] [CrossRef]
- Savvidis, Y.; Keramaris, E.; Pechlivanidis, G.; Koutitas, C. Optimum design of the entrance of the fishpond laterally to the main stream of an open channel. Environ. Sci. Pollut. Res. 2017, 24, 20122–20133. [Google Scholar] [CrossRef] [PubMed]
- Raffel, M.; Willert, C.; Wereley, S.; Kompenhans, J. Particle Image Velocimetry: A Practical Guide; Springer: Berlin, Germany, 2007. [Google Scholar]
- Wereley, S.T.; Meinhart, C.D. Recent advantages in micro-particle image velocimetry. Annu. Rev. Fluid Mech. 2010, 42, 557–576. [Google Scholar] [CrossRef]
- Adrian, R. Particle-imaging techniques for experimental fluid mechanics. Annu. Rev. Fluid Mech. 1991, 23, 261–304. [Google Scholar] [CrossRef]
- Adrian, R. Dynamic ranges of velocity and spatial resolution of particle image velocimery. Meas. Sci. Technol. 1997, 8, 1393–1398. [Google Scholar] [CrossRef]
- Inglis, G.J.; Hayden, B.J.; Ross, A.H. An. Overview of Factors Affecting the Carrying Capacity of Coastal Embayments for Mussel Culture; NIWA Client Report; National Institute for Water and Atmospheric Research Ltd.: Auckland, New Zealand, 2000; p. 38. [Google Scholar]
Publisher’s Note: MDPI stays neutral with regard to jurisdictional claims in published maps and institutional affiliations. |
© 2018 by the authors. Licensee MDPI, Basel, Switzerland. This article is an open access article distributed under the terms and conditions of the Creative Commons Attribution (CC BY) license (https://creativecommons.org/licenses/by/4.0/).