Abstract
Urban areas are rapidly changing all over the world and, therefore, continuous mapping of the changes is essential for urban planners and decision makers. Urban changes can be mapped and measured by using remote sensing data and techniques along with several statistical measures. The urban scene is characterized by very high complexity, containing objects formed from different types of man-made materials as well as natural objects. The aim of this study is to detect urban growth which can be further utilized for urban planning. Although high-resolution optical data can be used to determine classes more precisely, it is still difficult to distinguish classes, such as residential regions with different building type, due to spectral similarities. Synthetic aperture radar (SAR) data provide valuable information about the type of scattering backscatter from an object in the scene as well as its geometry and its dielectric properties. Therefore, the information obtained using SAR processing is complementary to that obtained using optical data. This proposed algorithm has been applied on a multi-sensor dataset consisting of optical QuickBird images (RGB) and full polarimetric L-band UAVSAR (Unmanned Aerial Vehicle Synthetic Aperture Radar) image data. After preprocessing the data, the coherency matrix (T), and Pauli decomposition are extracted from multi-temporal UAVSAR images. Next, the SVM (support vector machine) classification method is applied to the multi-temporal features in order to generate two classified maps. In the next step, a post-classification-based algorithm is used to generate the change map. Finally, the results of the change maps are fused by the majority voting algorithm to improve the detection of urban changes. In order to clarify the importance of using both optical and polarimetric images, the majority voting algorithm was also separately applied to change maps of optical and polarimetric images. In order to analyze the accuracy of the change maps, the ground truth change and no-change area that were gathered by visual interpretation of Google earth images were used. After correcting for the noise generated by the post-classification method, the final change map was obtained with an overall accuracy of 89.81% and kappa of 0.8049.
1. Introduction
An urban area is a location characterized by high population density and many built-up features in comparison to its surrounding areas [1]. Due to the expansion of urbanization over the past few decades, changes in the urban area are evident through the application of change detection techniques [2]. Urban change detection is used for urban planning. Using different methods of change detection and applying them to radar and optical data has advantages and disadvantages. Combining these methods and datasets can allow us to overcome their disadvantages and complement each other [3]. For this purpose, in this paper, a decision-level fusion method based on the majority voting algorithm is proposed to combine the change maps made by different methods applied to two optical and polarimetric datasets.
It has been stated that due to the ability of radar satellite to regularly acquire data in every pass, SAR data are suitable for analyzing the changes [4]. When using optical sensors with moderate resolution, such as Landsat in urban areas, many man-made features appear spectrally similar [5]. Also, optical sensors with high resolution, such as QuickBird, are not efficient in discriminating among man-made objects which are constructed using different materials [6]. On the other hand, several of these objects can be distinguished based on their geometrical and dielectric properties by using radar images [7]. Walls of buildings, for example, have a relatively strong backscattering signal due to the corner reflectors as these walls being oriented orthogonally in the radar-looking direction while the surface of bare soil has a low backscattering signal because it acts as a specular surface which reflects the signal away from the radar [8].
Post-classification change detection is carried out after classification into land cover or land use. In this method of change detection, the classification results of two imageries are compared [9]. The accuracy of post-classification change detection strongly depends on the accuracy of classification [10], and the detection results contain large amounts of noise due to the classification errors of individual images [11].
In 2008, Sanli et al. [12] determined land use changes using polarimetric and optical images, and monitored their environmental impacts. In this research, the urban development of the Admiralty region in Turkey between 1971 and 2002 was determined using remote sensing techniques. The contribution of SAR images to optical images in defining land cover types was investigated to improve the accuracy of land use/cover maps. Landsat-5 and Radarsat-1 were fused to prepare the land use map for 2002. Comparisons with the ground truth reveal that land use maps generated using the fuse technique are improved about 6% with an accuracy of 81.20%.
In 2012, Longbotham et al. [13] conducted research on the discovery of flooded areas by fusing optical and polarimetric images with high spatial resolution. In this research, the goal was not only to identify the best algorithms (in terms of accuracy), but also to investigate the further improvement derived from decision fusion. The goal was not only to identify the best algorithms (in terms of accuracy), but also to investigate the further improvement derived from decision fusion. The majority voting algorithm was applied to improve the provided results. The statistical significance of the change detection maps was evaluated with the McNemar test and all the results were statistically significant (to the 95% confidence level).
In 2014, Mishra and Susaki [14] applied Landsat, PALSAR, and AVNIR-2 images between 2007 and 2011 to automatically detect patterns of change using optical and SAR data fusion. The experiment was carried out in an outskirts of Ho Chi Minh City, one of the fastest growing cities in the world. The improvement of the change detection results by making use of the unique information on both sensors, optical and SAR, was also noticeable by visual inspection and the kappa index was increased by 0.13 (0.75 to 0.88) in comparison to only optical images.
Optical images have been independently applied in the majority of studies to detect urban changes or determine urban growth [15,16,17]. Improvements have been made in research that exploits both optical and radar data [18,19]. In this research, a new post-classification approach has been presented to extract urban land use/cover changes information from UAVSAR imagery. Also, the change maps obtained from optical and polarimetric images with high spatial resolution were fused together to achieve better results.
2. Experiments
After applying the necessary preprocessing, optical and polarimetric data are classified using the SVM algorithm and the change detection is then performed using a number of conventional methods. After obtaining the change maps, they are fused using the majority voting method and the final change map is obtained.
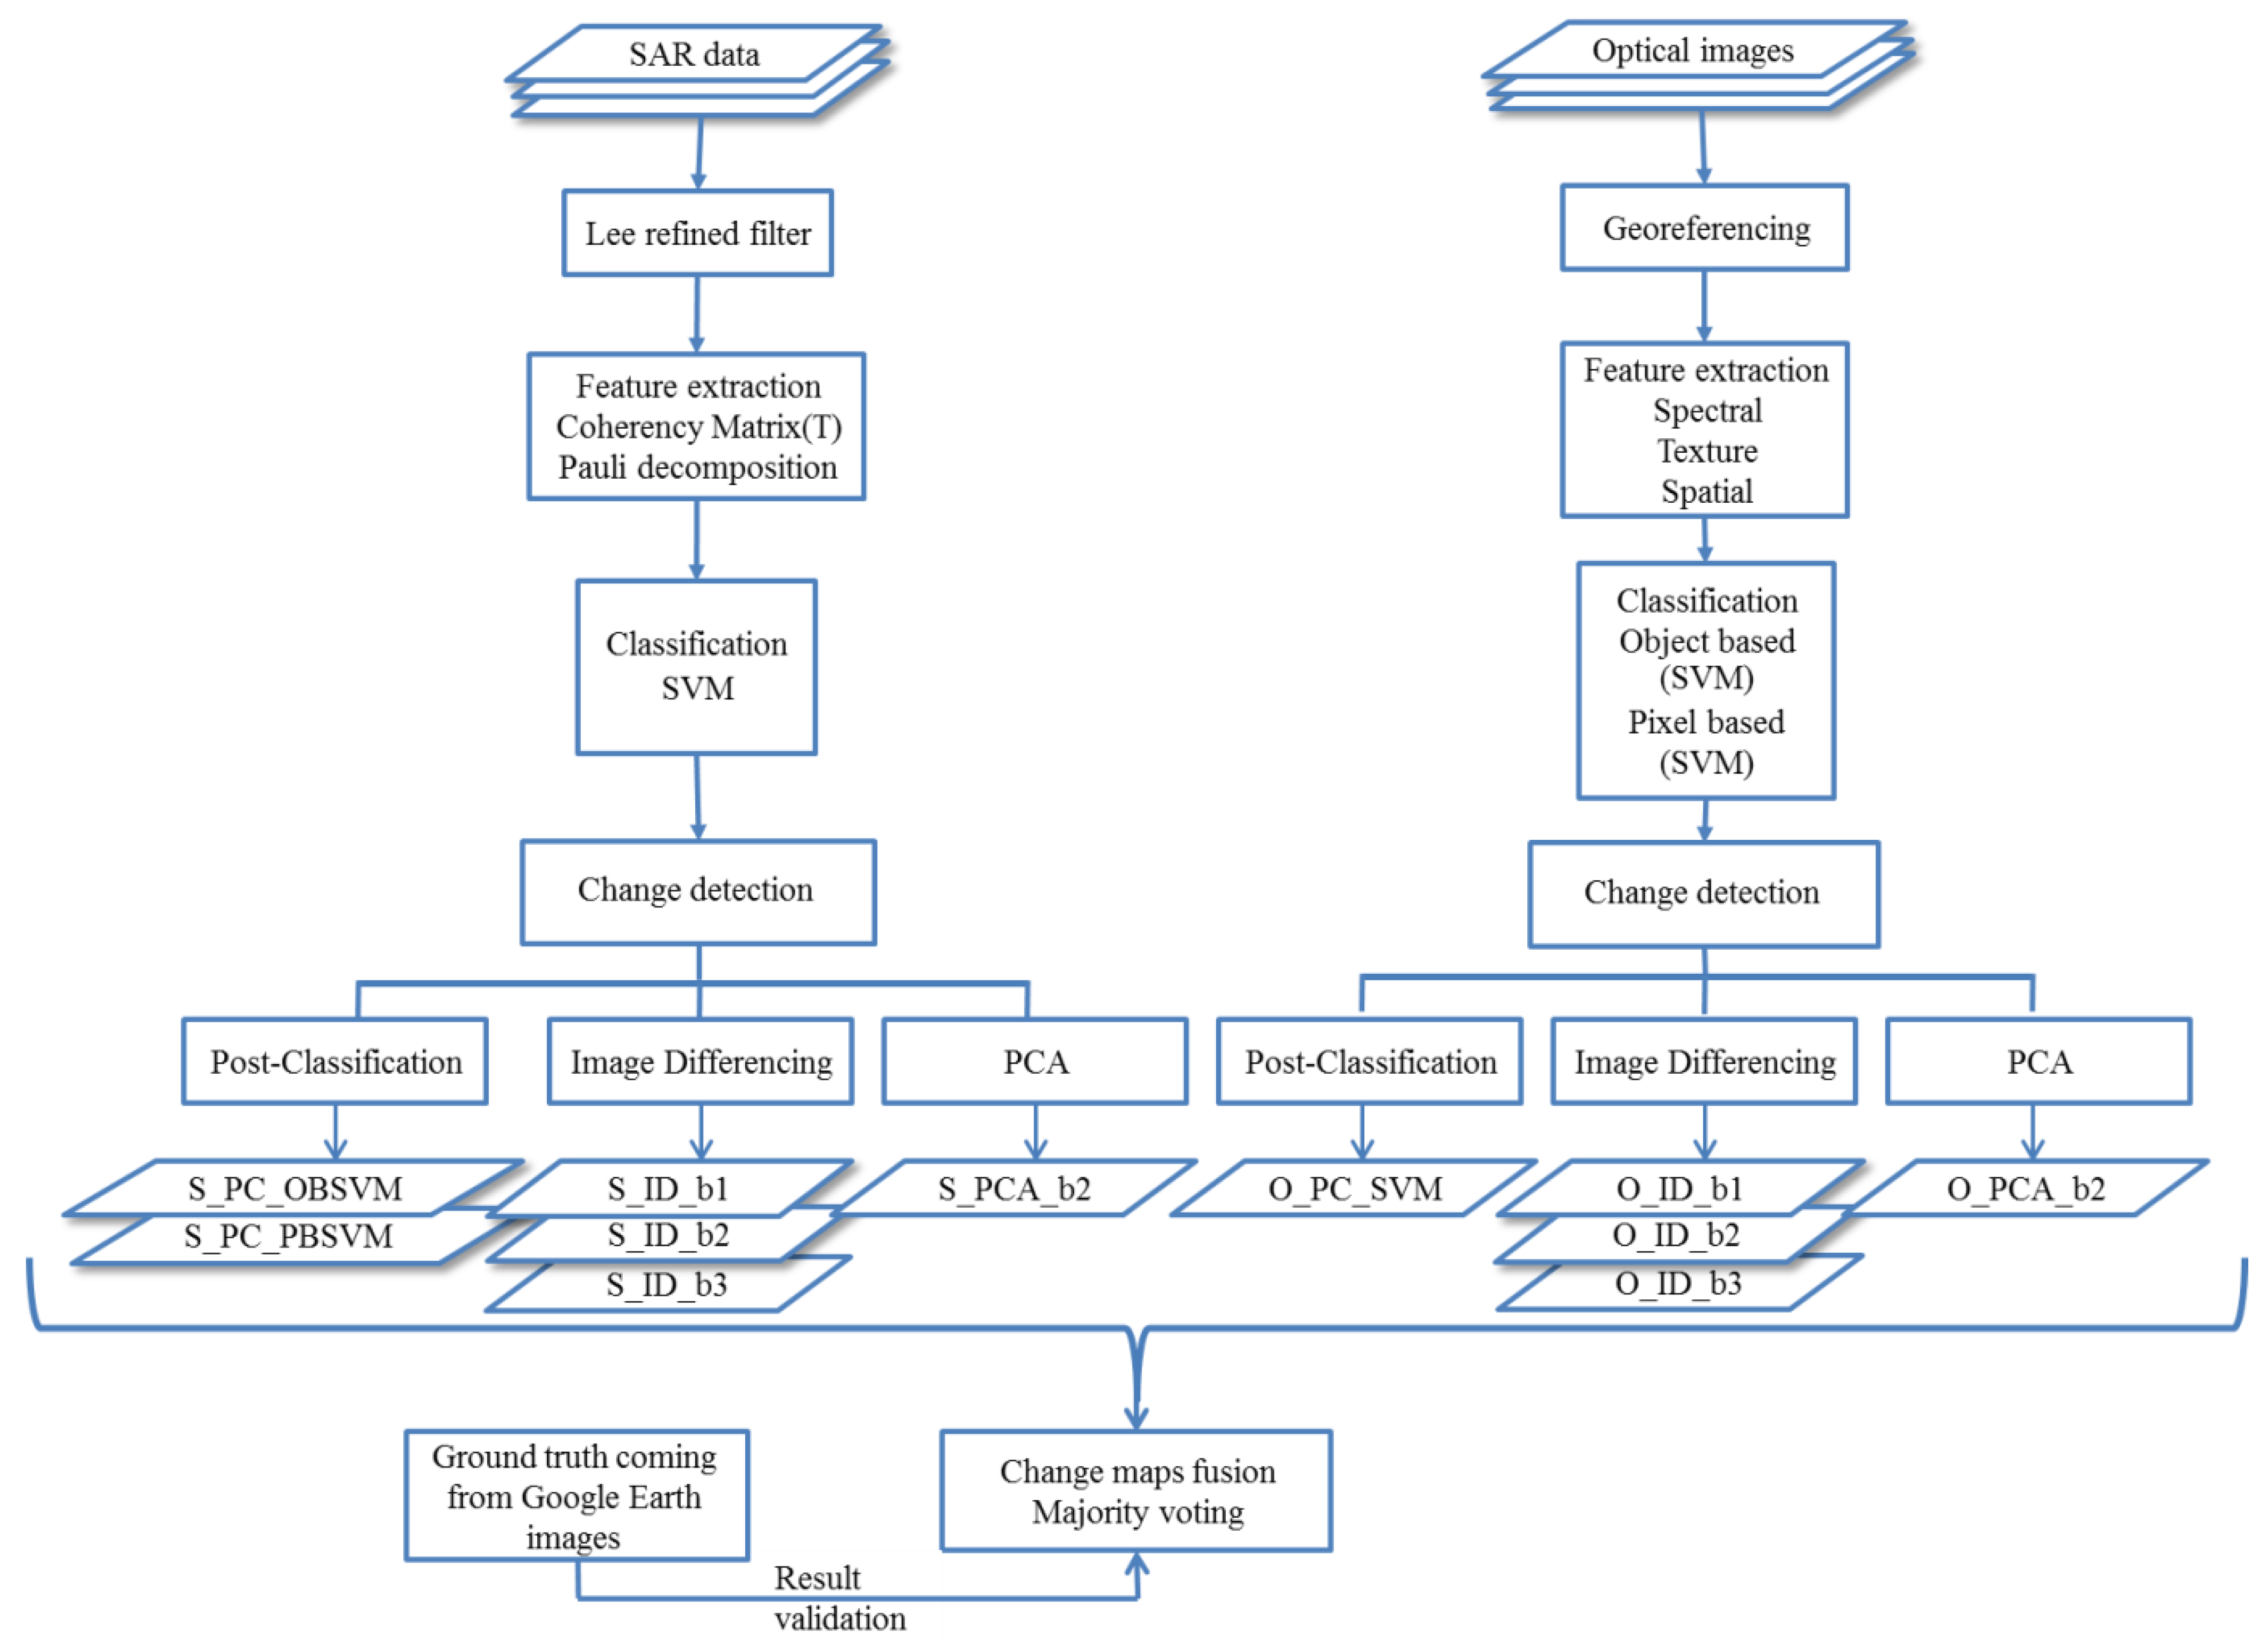
In order to improve the accuracy of urban change detection and the application of both optical and polarimetric data, a suitable method was proposed, as shown in Figure 1.
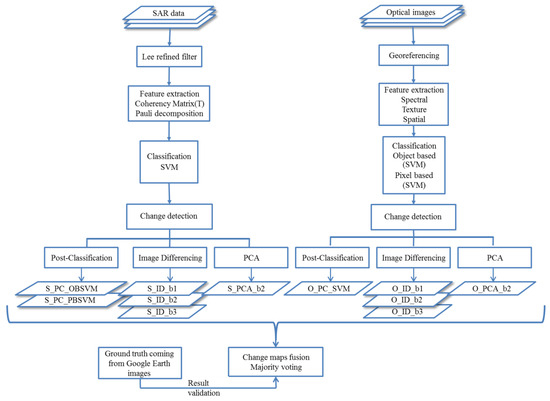
Figure 1.
The proposed framework of the change detection algorithm.
For a preliminary validation of the proposed change detection (CD) strategy, we investigated two datasets from Oakland in California. In the period 2010 to 2017, the region was affected by urban expansion, deforestation, and land use change. We consider the pair of SAR data acquired by the UAVSAR satellite mission and the pair of optic data acquired by the QuickBird satellite over the region in 2010 and 2017, respectively, as the input dataset. Table 1 lists the data specification such as acquisition date (before and after changes), band specifications, and spatial resolution.

Table 1.
Data specification.
Change detection in urban areas is difficult due to the high degree of similarity between some classes, including bare land, building, and road. The probability of an error in the separation between these ground cover classes increases because of the high spectral similarity between these classes and the low number of bands. In this research, feature extraction is used to increase the number of bands and the ability to separate classes. For each dataset used in this study, different features are produced. Spectral, textual, and spatial features can be used to improve the separation of classes in optical data due to limitations in the number of bands, and the provision of indices such as NDVI is not possible due to lack of NIR bands. The features provided for polarimetric data are the coherency matrix and Pauli target decomposition. Coherency matrix elements are applied to classify polarimetric images. Pauli target decomposition is used to detect changes by image differencing and principal components analysis methods.
After providing the multitemporal optical and polarimetric images, the optical images were coregistered to each other and the refined Lee filter was used to reduce the noise in the polarimetric data. Two classification methods for optical images are applied. In the pixel-based method, the train sample for the five classes for each date are selected separately and then classified using the support vector machine algorithm. In the object-based method, the images are first segmented, and then by selecting segments of the five classes as a train sample, the images are classified using the support vector machine algorithm using the spatial, textual, and spatial features of the images.
In order to classify the polarimetric images, the train samples for the three classes were extracted using the Pauli decomposition technique. Then, using the components of the coherency matrix and the support vector machine algorithms, the polarimetric images are classified.
In the final stage, the obtained change maps are fused by the majority voting method into four forms. These four categories are selected as follows:
- All maps of the changes obtained from optical and polarimetric images.
- All maps of changes made from optical images.
- All maps of changes made from polarimetric images.
- Chart maps are carefully evaluated.
The pixel-level classification produces maps producing a sort of “salt and pepper” noise driven by valid spectral information. This noise can be eliminated through methods such as morphological post-processing or the removal of clusters of pixels smaller than certain values [7]. At the end, the final change map is improved by removing pieces less than 300 pixels, and noise on the map is deleted.
3. Results and Discussion
The change maps obtained from image differencing, principal components analysis, and post-classification methods were evaluated using two kappa coefficients and overall accuracy. In the change maps of post-classification derived from the object-based method, there are segments that have been mistakenly identified as a change due to errors in the classification of these pieces. This is not the case, however, in the change maps made by the pixel-based methods. According to the results shown in the Table 2, the urban change detection using the post-classification method with the pixel-based algorithm is more accurate.
Table 2.
Evaluation of optical image change detection.
The limitation of polarimetric images is a lower spatial resolution than the optical images. The advantage of these images is the number of bands and polarizations, and the ability to detect and differentiate the features. This limitation and advantage of polarimetric images have made the range of precision in polarimetric and optical images close to each other. As shown in Table 3, the results of PolSAR image change detection contain approximately the same accuracy.
Table 3.
Evaluation of PolSAR image change detection.
According to the results shown in the Table 4, by fusion of the change maps obtained from the polarimetric images, the accuracy is better than the individual methods of change detection. In the fusion of optical images, the precision will also produce the best results. The results showed that fusing the change maps obtained from different algorithms will cover the defects and take advantage of these methods.
Table 4.
Evaluation of fused change maps.
Fusing all change maps of polarimetric and optical images gives better results than fusing only the change maps made by polarimetric or optical images. This shows that the results of combining two optical and polarimetric datasets give better precision than the results of combining only one optical or polarimetric data. In order to achieve the best combination for fusing change maps, two kappa coefficients and overall accuracy criteria are used to select the best change map. The five change maps that have been selected for the best combination include a post-classification map derived from the pixel-based algorithm and the object-based algorithm, and the image differencing of band 3 from the optical and the post-classification map derived from polarimetric image. Also, the salt and pepper noise reduction can be seen caused to increase the accuracy of the final change map.
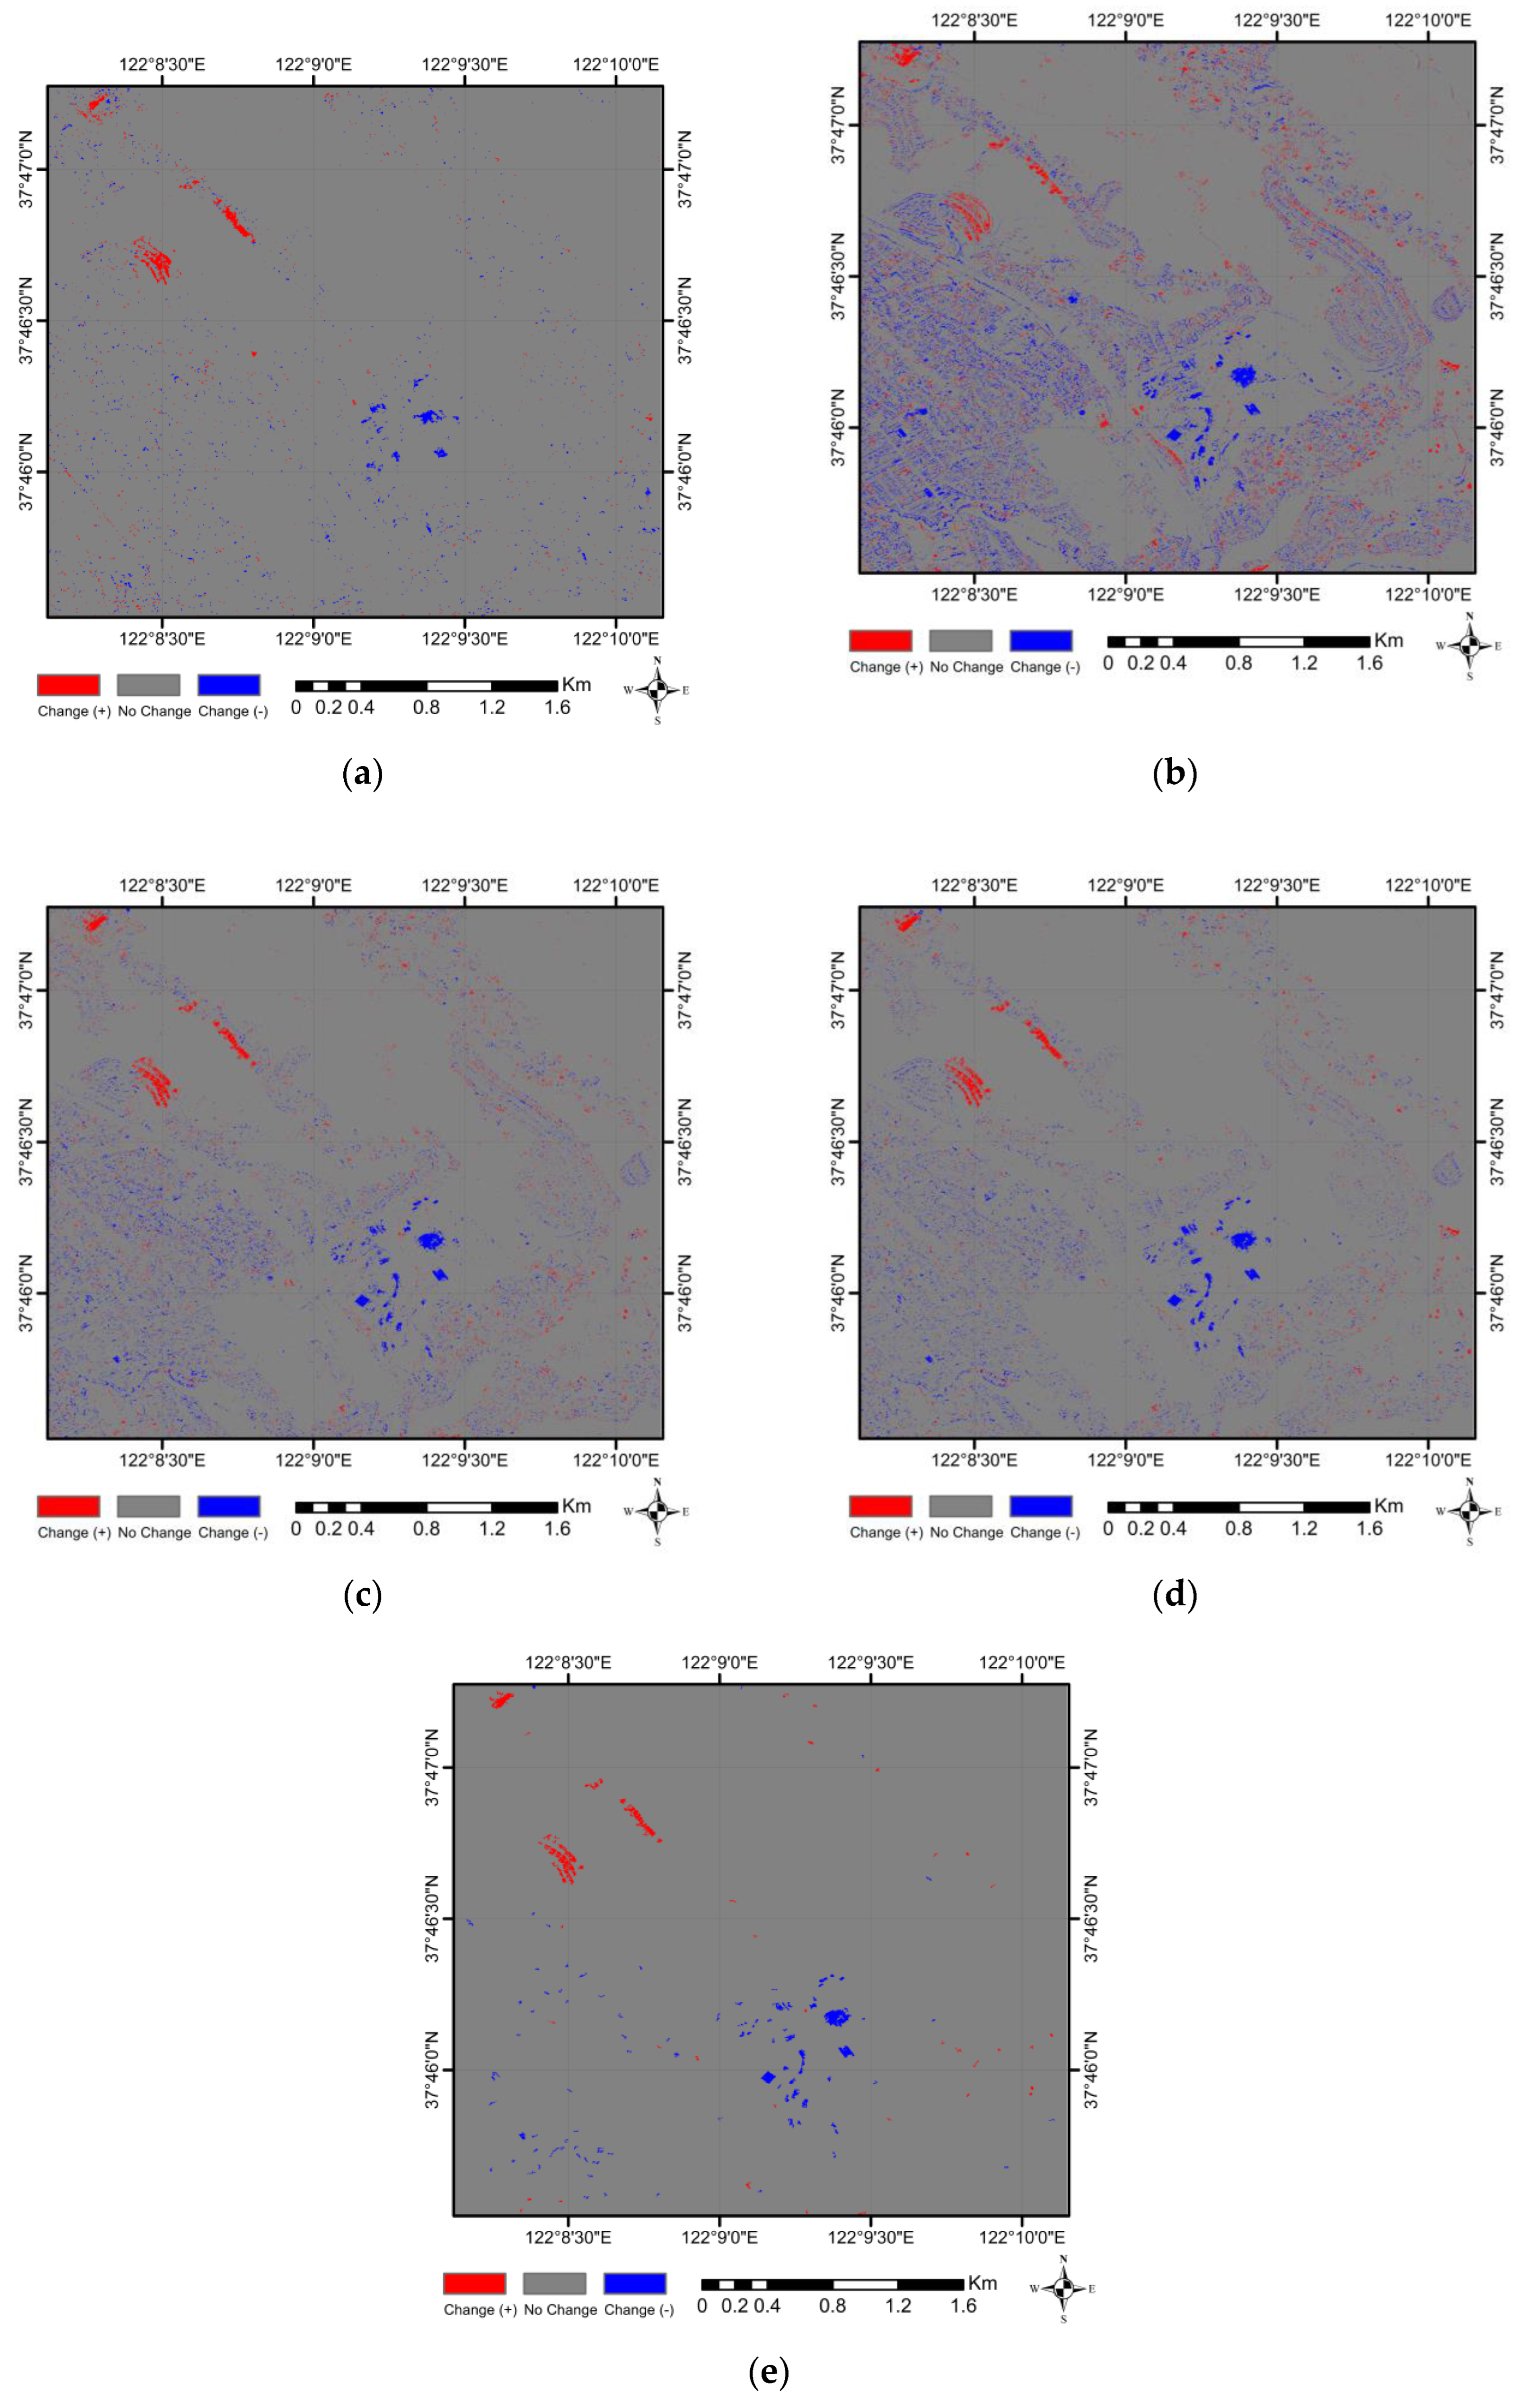
The final change maps derived from fusing different combinations of change maps are shown in Figure 2. As can be seen, since two change maps are derived from the post-classification method, salt and pepper noise is most observed in the change map obtained from the fusion of optical images. In the change maps resulting from the polarimetric images, one change map is derived from the post-classification method. In the improved change map, the level of noise significantly reduced.
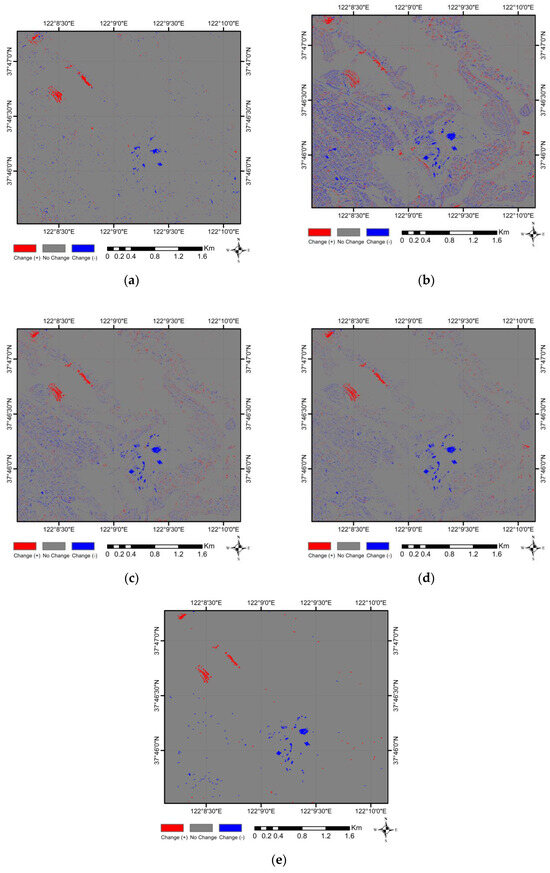
Figure 2.
Change maps: (a) Majority voting—PolSAR; (b) Majority voting—optic; (c) Majority voting—best; (d) Majority voting—all; (e) Majority voting—best improvement.
5. Conclusions
In this paper, the goal is to detect changes in the urban area and improve the results by fusion at the decision level using the majority voting method. The fusion of images with just one source and achievement of better results suggests that fusing different algorithms will cover defects and take advantage of the different methods. The results of fusing two types of optical and polarimetric data give better accuracy than the results of the fusion of only one optical or polarimetric data. The polarimetric images better revealed the changes caused by variations in geometric structure and physical properties of the features, and the optical images better revealed changes resulting from spectral variation. Therefore, by fusing optical and polarimetric data at the decision level, different changes can be identified.
By analyzing the accuracy of the classification methods, we find that the object-based method results are better than the pixel based method because of the high resolution of the optical images.
If change detection methods are independent of each other, the majority voting algorithm increases the accuracy of the change detection by increasing the number of methods and increasing the accuracy of the methods.
As a suggestion, the application of more than one fused image (optic–polarimetric) as well as the application of the fused time series of images will improve the level of monitoring of the land cover/use change.
Author Contributions
S.S. and H.A. and R.S. conceived and designed the experiments; S.S. performed the experiments; S.S. and R.S. analyzed the data; S.S. wrote the paper. All authors have read and agreed to the published version of the manuscript.
Conflicts of Interest
The founding sponsors had no role in the design of the study; in the collection, analyses, or interpretation of data; in the writing of the manuscript, and in the decision to publish the results.
Abbreviations
The following abbreviations are used in this manuscript:
| PolSAR | polarimetric synthetic aperture radar |
| OBSVM | object-based support vector machine |
| PBSVM | pixel-based support vector machine |
References
- Xiang, D. Urban Area Information Extraction from Polarimetric SAR Data. Ph.D. Thesis, Royal Institute of Technology, Stockholm, Sweden, 2016. [Google Scholar]
- Shahhosseini, R.; Homayouni, S.; Safari, A. Provide an Automatic Change Detection of Kernel-based in Urban Areas Using Landsat Layered satllite Images, Case Study: Karaj City. J. Olum Fonoon Surv. 2016, 5, 15–34. [Google Scholar]
- Garzelli, A. Wavelet-based fusion of optical and SAR image data over urban area. In Proceedings of the ISPRS Photogrammetric Computer Vision Symposium, Melbourne, Australia, 25 August–1 September 2012. [Google Scholar]
- Pirrone, D. A novel framework for change detection in bi-temporal polarimetric SAR images. Image Signal Process. Remote Sens. 2016, 10004. [Google Scholar] [CrossRef]
- Stefanski, J.; Kuemmerle, T.; Chaskovskyy, O.; Griffiths, P.; Havryluk, V.; Knorn, J.; Korol, N.; Sieber, A.; Waske, B. Mapping land management regimes in western Ukraine using optical and SAR data. Remote Sens. 2014, 6, 5279–5305. [Google Scholar] [CrossRef]
- Al-Sharif, A.A.; Pradhan, B.; Hadi, S.J.; Mola, N. Revisiting methods and potentials of sar change detection. In Proceedings of the World Congress on Engineering, London, UK, 3–5 July 2013. [Google Scholar]
- Li, H.-C.; Celik, T.; Longbotham, N.; Emery, W.J. Gabor Feature Based Unsupervised Change Detection of Multitemporal SAR Images Based on Two-Level Clustering. IEEE Geosci. Remote. Sens. Lett. 2015, 12, 2458–2462. [Google Scholar]
- Borghys, D.; Shimoni, M.; Perneel, C. Change detection in urban scenes by fusion of SAR and hyperspectral data. Remote Sens. 2007, 6749. [Google Scholar] [CrossRef]
- Dewan, A.M.; Yamaguchi, Y. Land use and land cover change in Greater Dhaka, Bangladesh: Using remote sensing to promote sustainable urbanization. Appl. Geogr. 2009, 29, 390–401. [Google Scholar] [CrossRef]
- Dekker, R.J. SAR change detection techniques and applications. In Proceedings of the 25th EARSeL Symposium on Global Developments in Environmental Earth Observation from Space, Porto, Portugal, 6–11 June 2005. [Google Scholar]
- Hu, H.; Ban, Y. Urban land-cover mapping and change detection with radarsat sar data using neural network and rule-based classifiers. In Proceedings of the XXI Congress of International Society for Photogrammetry and Remote Sensing (ISPRA), Beijing, China, 3–11 July 2008; pp. 1549–1553. [Google Scholar]
- Sanli, F.B.; Kurucu, Y.; Esetlili, M.T. Determining land use changes by radar-optic fused images and monitoring its environmental impacts in Edremit region of western Turkey. Environ. Monit. Assess. 2009, 151, 45–58. [Google Scholar] [CrossRef] [PubMed]
- Longbotham, N.; Pacifici, F.; Glenn, T.; Zare, A.; Christophe, E.; Volpi, M.; Tuia, D.; Michel, J.; Inglada, J.; Chanussot, J.; et al. Multi-Modal Change Detection, Application to the Detection of Flooded Areas: Outcome of the 2009–2010 Data Fusion Contest. IEEE J. Sel. Top. Appl. Earth Obs. Remote. Sens. 2012, 5, 331–342. [Google Scholar] [CrossRef]
- Mishra, B.; Susaki, J. Optical and SAR data integration for automatic change pattern detection. ISPRS Ann. Photogramm. Remote. Sens. Spat. Inf. Sci. 2014, II-7, 39–46. [Google Scholar] [CrossRef]
- Du, P.; Liu, S.; Xia, J.; Zhao, Y. Information fusion techniques for change detection from multi-temporal remote sensing images. Inf. Fusion 2013, 14, 19–27. [Google Scholar] [CrossRef]
- Hu, Q.; Wu, W.; Xia, T.; Yu, Q.; Yang, P.; Li, Z.; Song, Q. Exploring the use of Google Earth imagery and object-based methods in land use/cover mapping. Remote Sens. 2013, 5, 6026–6042. [Google Scholar] [CrossRef]
- Ji, C.; Liu, Q.; Sun, D.; Wang, S.; Lin, P.; Li, X. Monitoring urban expansion with remote sensing in China. Int. J. Remote Sens. 2001, 22, 1441–1455. [Google Scholar] [CrossRef]
- Taubenböck, H.; Wegmann, M.; Roth, A.; Mehl, H.M.; Dech, S. Analysis of urban sprawl at mega city Cairo, Egypt using multisensoral remote sensing data, landscape metrics and gradient analysis. In Proceedings of the International Symposium on Remote Sensing of Environment (ISRSE), Stresa, Italy, 4–8 May2009. [Google Scholar]
- Amarsaikhan, D.; Ganzorig, M.; Ache, P.; Blotevogel, H. The integrated use of optical and InSAR data for urban land-cover mapping. Int. J. Remote Sens. 2007, 28, 1161–1171. [Google Scholar] [CrossRef]
© 2019 by the authors. Licensee MDPI, Basel, Switzerland. This article is an open access article distributed under the terms and conditions of the Creative Commons Attribution (CC BY) license (https://creativecommons.org/licenses/by/4.0/).