Proceeding Paper

Evaluating Sentinel-2 Red-Edge Bands for Wetland Classification †

Earth and Space Sciences Institute, Eskisehir Technical University, 26555 Eskisehir, Turkey
*
Author to whom correspondence should be addressed.
Presented at the 3rd International Electronic Conference on Remote Sensing, 22 May–5 June 2018; Available Online: https://sciforum.net/conference/ecrs-3.
Presented at the 3rd International Electronic Conference on Remote Sensing, 22 May–5 June 2018
Proceedings 2019, 18(1), 12; https://doi.org/10.3390/ECRS-3-06184
Published: 9 August 2019
(This article belongs to the Proceedings of 3rd International Electronic Conference on Remote Sensing)

Abstract

:
Due to the high spatial heterogeneity and temporal variability, wetlands are one of the most difficult ecosystems to observe using remote sensing data. With the additional Sentinel-2 vegetation red-edge bands, an improvement of the vegetated classes classification is expected. In order to investigate the influence of the Sentinel-2 red-edge bands, in this paper we evaluate two classification scenarios over wetland classes. The first scenario excludes the red-edge bands, while in the second scenario all red-edge bands are included in the classification dataset where two different wetland classes—intensive vegetated wetland classes such as swamps and partially decayed vegetated wetland areas such as bogs—are classified using a support vector machine (SVM) learning classifier. The classes are defined using high-resolution images from an Unmanned Aerial Vehicle (UAV) obtained on the same date with the passing of the Sentinel-2 satellite over the study area. As expected, the results show a significant improvement of the intensive vegetated wetlands, with more than 30% in both user and producer accuracy, while no significant changes are noted in the partially decayed vegetated wetlands. For future studies, we recommend evaluating the influence of the Sentinel radar data over wetland areas.

1. Introduction

Wetlands are one of the most significant ecosystems on Earth, as they provide a number of ecological services and a number of valuable functions [1]. Several studies [2,3] have reported the loss of this valuable ecosystems worldwide. Threats to wetlands occur due to natural processes including climate change and invasive species, as well as human activities including agricultural development, deforestation, industrial activities, dams, etc. [4]. Over the years, several reviews regarding the satellite remote sensing of wetlands have been conducted. State-of-the-art research includes object-based image analyses (OBIA) for wetland classification using the newest remote sensing sensors and techniques [5].
With the launch of the Sentinel Satellites as a part of the Copernicus Programme by the European Space Agency (ESA), a new era in the satellite imagery began. With a similar local pass time, Sentinel-2 images continue the legacies of Satellite Pour l’Observation de la Terre (SPOT) and Landsat, allowing researchers to combine Sentinel data with historical images. Even before their launch, researchers started to investigate their capabilities. For example, Delegido el at. [6] conducted an early evaluation of the Sentinel-2 red-edge bands for green leaf area and chlorophyll content estimation, and found that the inclusion of these bands is highly important. Abdikan et al. [7] used multi-temporal Sentinel-1 data for the crop growth of maize in Konya, Turkey, and achieved accuracy results higher than 80%. Ustunler et al. [8] used Sentinel-1 images for land use/land cover classification over Istanbul, Turkey, and investigated three different classification algorithms as well as the effects of additional band combinations. Their findings showed that highest classification accuracy was achieved with the original Sentinel-1 bands using the support vector machine (SVM) algorithm.
Due to the high spatial heterogeneity and temporal variability, wetlands are one of the most difficult ecosystems to observe using remote sensing data. The biggest challenge in wetland mapping is separating the wetland class from upland classes such as forest and agricultural areas [9]. With the additional Sentinel-2 vegetation red-edge bands, an improvement of the vegetated classes classification is expected. In order to investigate the influence of the Sentinel-2 red-edge bands, in this paper we evaluate two classification scenarios over wetland classes in the Central Anatolian Region in Turkey. In the first scenario the red-edge bands are excluded from the dataset, while in the second scenario all red-edge bands are included in the classification dataset where two different wetland classes—intensive vegetated wetland classes such as swamps and partially decayed vegetated wetland areas such as bogs—are classified using a support vector machine learning classifier.

2. Data and Methodology
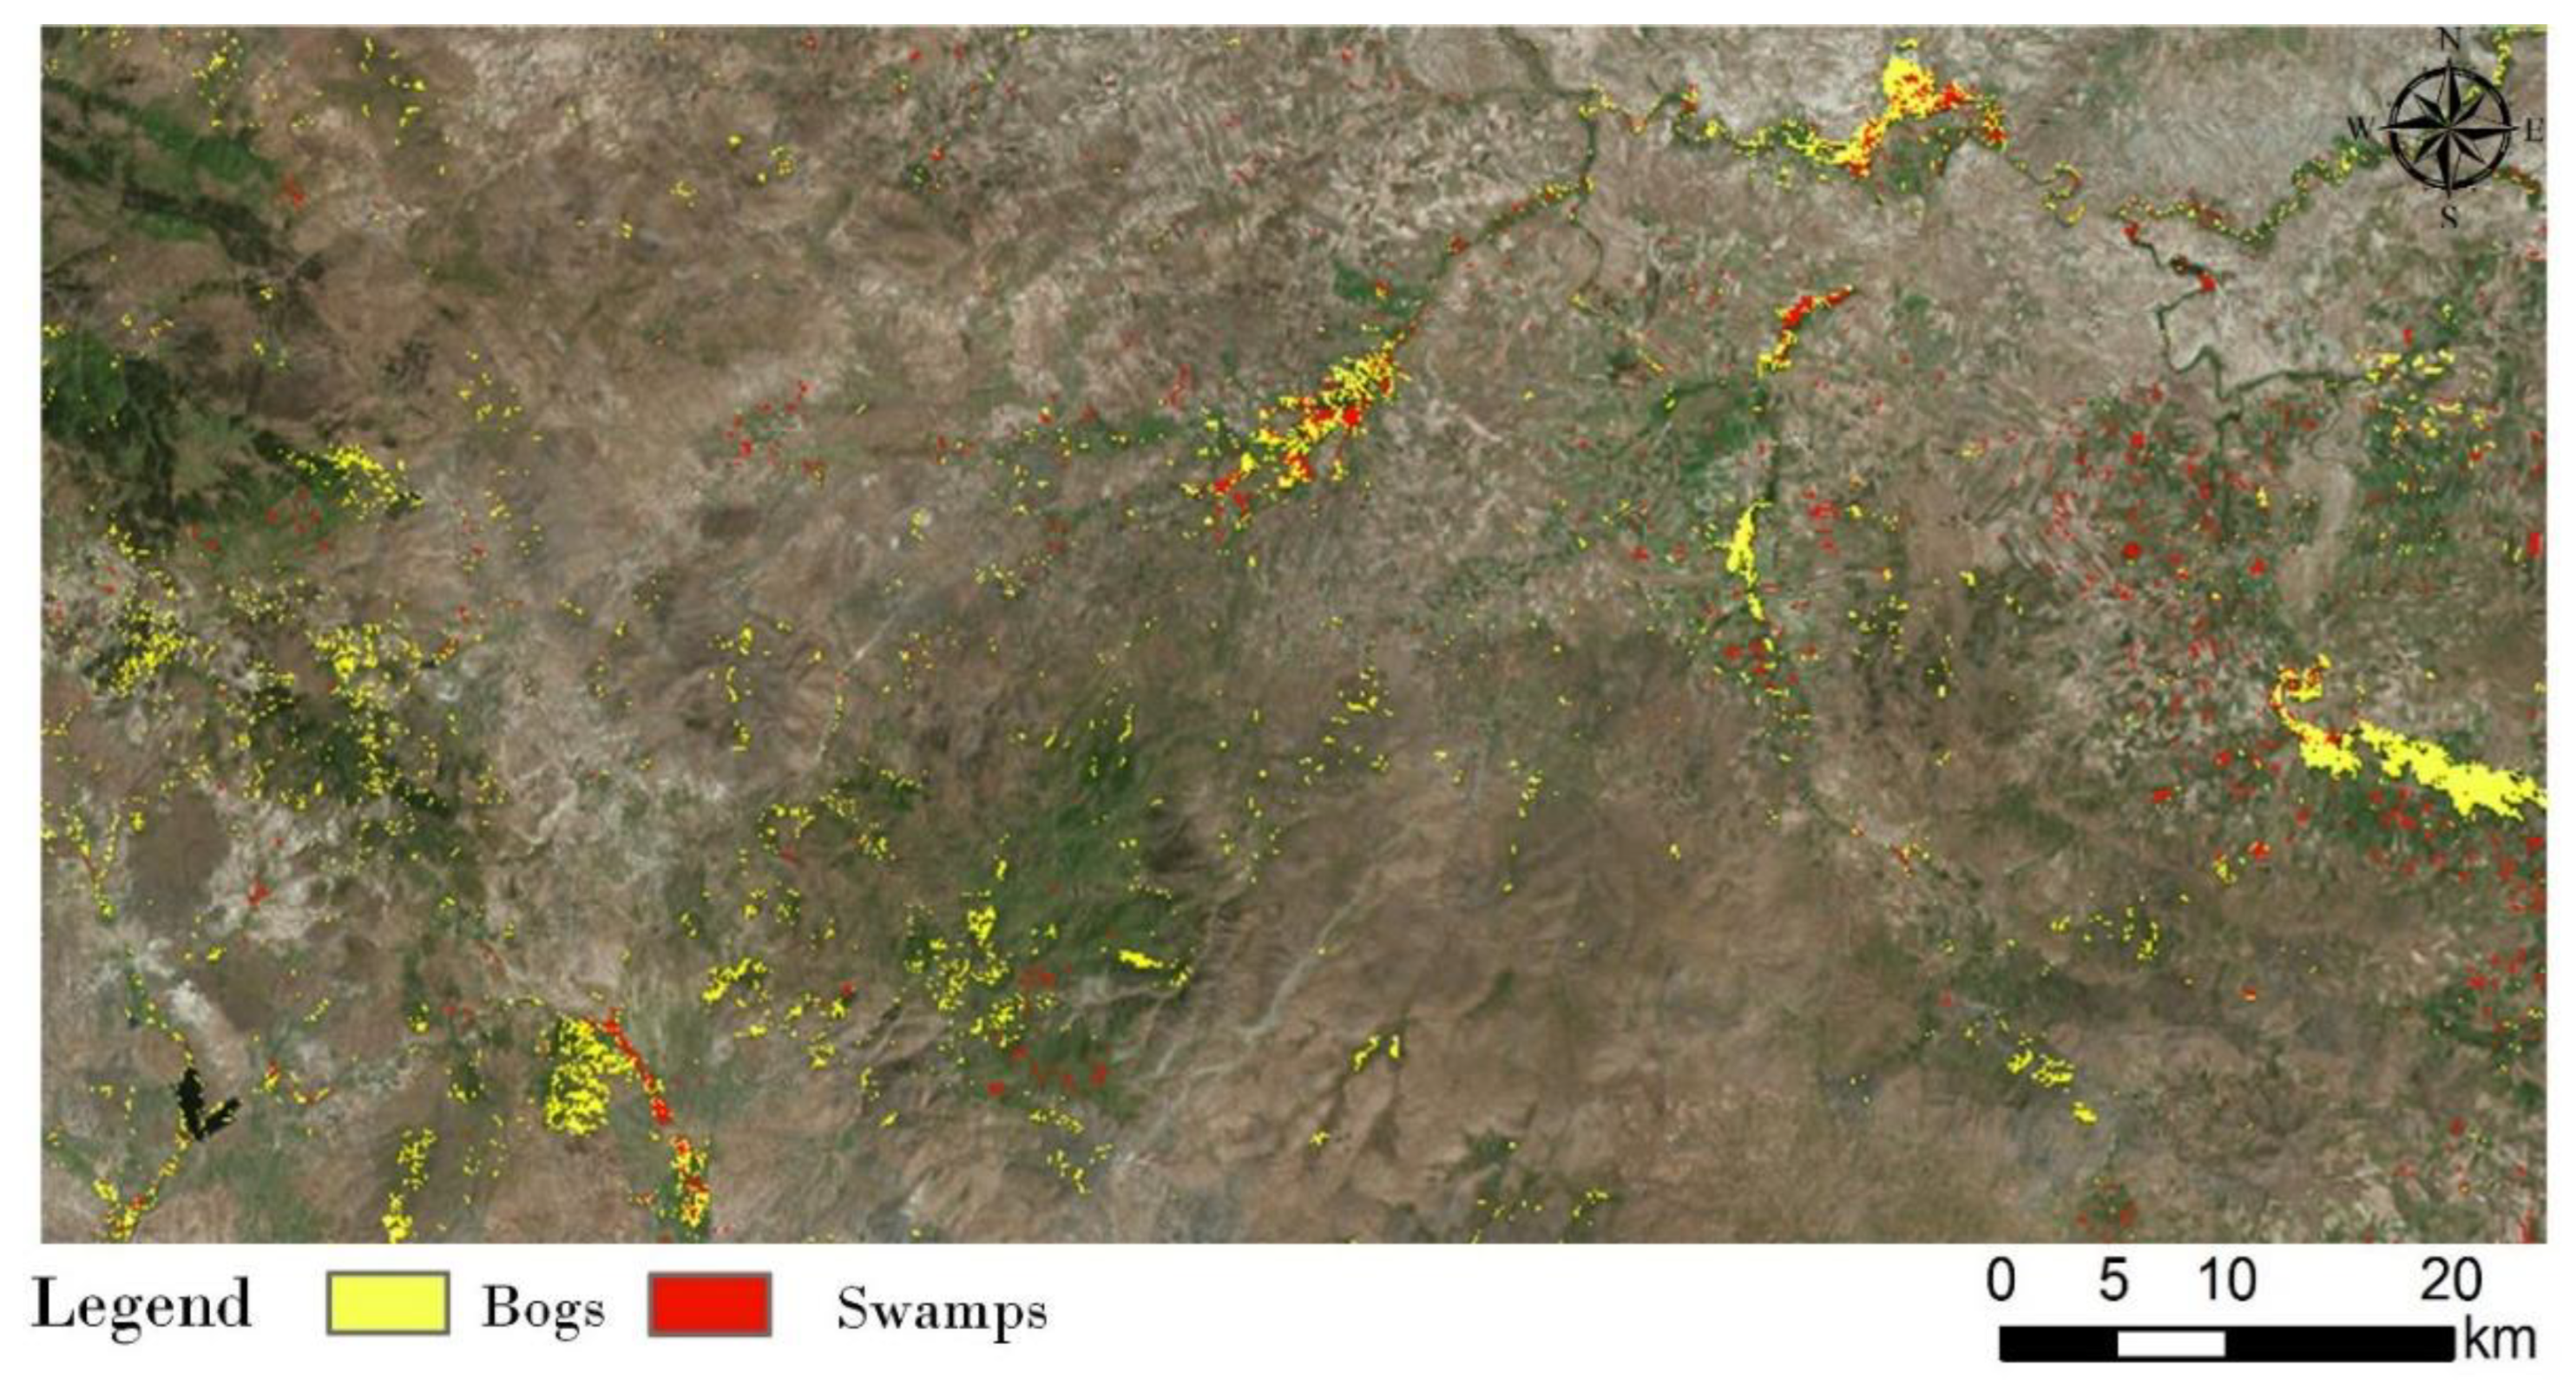
Sentinel-2 is a fine spatial resolution satellite imaging mission containing two satellites, Sentinel-2A, launched on 23 June 2015, and Sentinel-2B launched on 7 March 2017, as a part of the European Copernicus program [10]. The Sentinel-2 Multispectral Instrument (MSI) is considered to be the follow-up mission to the SPOT and Landsat instruments, intended to provide a continuity of remote sensing products [10]. Sentinel-2 offers satellite images with a resolution from 10 to 60 m [11], or 13 spectral bands in the visible, near-infrared, and shortwave infrared wavelengths, with four bands at 10 m, six bands at 20 m, and three bands at 60 m spatial resolution. In comparison with the latest Landsat OLI/TIRS, Sentinel-2 has a better spatial resolution and better spectral resolution in the near-infrared region, with three additional vegetation red-edge bands with 20 m spatial resolution. However, it does not offer thermal or panchromatic data. The Sentinel-2 MSI sensor, as compared to existing satellite sensors, requires adjustment to allow the extension of the actual time series [12].
Several studies have elaborated on the Sentinel-2 pan-sharpening topic, in which researchers have attempted to produce the missing panchromatic band with a different combination of the existing 10 m spatial resolution bands [13,14,15]. In this study, a pan-sharpening of the 20 m vegetation red-edge bands was made, as suggested as in [15].
The study area has a plain appearance with respect to the shape of the Earth. Most part of the region is flat with an elevation of 1000 m, while the ridges of the Sakarya and Kizilirmak valleys represent the lowest flats with elevations of around 700 m above sealevel The central Anatolian part of Turkey has a continental climate with very high temperatures during summer days and cool nights, in addition to cold and hard winters. Central Anatolia is generally a region with low rainfall. The annual rainfall varies between 300 and 500 mm. When it comes to the distribution of precipitation according to the seasons, the summer season is generally dry, autumn is rainy, while in spring and winter there are heavy rains. In this paper we used one Sentinel-2 satellite image obtained over the study area on 10 August 2017, when field measurements were conducted. Two wetland classes were defined using high-resolution data collected on the same date [16] (Figure 1)—swamps and bogs. The Central Anatolian Region of Turkey is rich in small wetland areas, which is the reason why this area was selected as the study area in this paper. The significance of the small wetland areas can be deduced from the overall number of bird species in Turkey, which is more than 500. Two hundred and fifty-six of them can be found in Balikdami [17], located in the Central Anatolian Region, accounting for more than half of all birds species identified in the whole of Turkey.
After pre-processing the Sentinel-1 image, the datasets used in the analyses were constructed. Thus, in order to determine the influence of the red-edge bands, the vegetation red-edge bands were not included in the first dataset, while all Sentinel-2 bands were included in the second dataset. Afterwards, in order to proceed with OBIA, multi-resolution segmentation was performed for both of the datasets. Sample collection was collected for the two wetland classes, intensive vegetated wetland (swamps) and partially decayed vegetated wetland (bogs). As several researchers have presented more successful results using support vector machine (SVM) for land cover classification, in this paper we use an SVM classifier intergraded using eCognition software. For accuracy assessment, we use 1200 random points and determined the user and producer accuracy of the two wetland classes. In the next step, in order to evaluate the influence of the Sentinel-2 vegetation red-edge bands, we compared the results of the two datasets. A detailed flowchart of the methodology used in this paper is presented in Figure 2.

3. Results

The results of the classifications of the first dataset are presented in Figure 3. The visual comparison of the results indicates a low accuracy in classifying swamp areas in the first dataset, while the second class, bog, was found to be accurately classified. However, their readability was significantly low. The producer and user accuracies of the swamp class were approximately the same, about 50%. In general, the swamp class was confused with agricultural and forest areas.
In the results from the second dataset, the producer and user accuracies of the swamp class were significantly higher than the results from the previous dataset, with approximately 73% user and 80% producer accuracy. Similar to the first dataset, the producer accuracy of the bog class was higher at approximately 96%, while the user accuracy was significantly lower at approximately 66%. This means that the bog class was accurately classified, but the reliability of the bog class was still quite lower.

4. Discussion

The results presented in this paper are significant for wetland classification, especially for dense vegetated wetlands such as swamps. Although the red-edge bands did not affect the bog classification, their influence on swamp classification was very significant. The producer accuracy of the second dataset in the swamp class was 30% higher, and the user accuracy was about 27% higher than that in the first dataset. The red-edge bands helped in separating the marsh from the green dense agricultural areas. Other studies [6,18,19] have also confirmed the significance of red-edge sensors in different land covers and in wetland areas. The findings in [19] indicate that the influence of the red-edge bands is about 20%, while the addition of the radar bands did not contribute to wetland classification. However, the authors only investigated one wetland class, swamps. For the utility of the radar bands in the classification of partially decayed vegetated wetland areas such as bogs, further investigations are needed.

5. Conclusions

In this study, we investigated the influence of Sentinel-2 red-edge data on vegetation over two types of wetlands. The influence of the red-edge bands over the swamp class showed an improvement in the results of more than 27%. The complex structure of wetlands requires their classification in more than one class. While both bogs and swamps are considered wetland areas, they have very different characteristics and different datasets should be used for their accurate mapping. Radar data have stronger backscatter signals from wetter surfaces as compared to drier surfaces. Thus, according to the results presented in this study, the data obtained from Sentinel-2 are more suitable for swamp classification, while bogs should be observed through the combined use of optical and radar satellite images.
For future studies, we recommend the investigation of the influence of different data for different wetland classes, as well as the consideration of multi-temporal data as an addition to the presented datasets in this study.

Author Contributions

The authors contributed equally to this paper.

Acknowledgments

This study was supported by Eskisehir Technical University Scientific Research Projects Commission under grant No. 1705F121.

Conflicts of Interest

The authors declare no conflict of interest.

Abbreviations

The following abbreviations are used in this manuscript:
SVMsupport vector machine
UAVunmanned aerial vehicle
OBIAobject-based image analyses
ESAEuropean Space Agency
SPOTSatellite Pour l'Observation de la Terre

References

  1. Sghair, A.; Goma, F. Remote sensing and GIS for wetland vegetation study. Diss. University of Glasgow. 2013. [Google Scholar]
  2. Ji, W. Wetland and Water Resource Modeling and Assessment: A Watershed Perspective; CRC Press: Boca Raton, FL, USA, 2007. [Google Scholar]
  3. Russi, D.; ten Brink, P.; Farmer, A.; Badura, T.; Coates, D.; Förster, J.; Kumar, R.; Davidson, N. The Economics of Ecosystems and Biodiversity for Water and Wetlands; IEEP: London and Brussels, 2013; p. 78. [Google Scholar]
  4. Mitsch, W.J.; Hernandez, M.E. Landscape and climate change threats to wetlands of North and Central America. Aquat. Sci. 2013, 75, 133–149. [Google Scholar] [CrossRef]
  5. Dronova, I. Object-Based Image Analysis in Wetland Research: A Review. Remote Sens. 2015, 7, 6380–6413. [Google Scholar] [CrossRef]
  6. Delegido, J.; Verrelst, J.; Alonso, L.; Moreno, J. Evaluation of Sentinel-2 Red-Edge Bands for Empirical Estimation of Green LAI and Chlorophyll Content. Sensors 2011, 11, 7063–7081. [Google Scholar] [CrossRef]
  7. Abdikan, S.; Sekertekin, A.; Ustunern, M.; Sanli, F.B.; Nasirzadehdizaji, R. Backscatter analysis using multi-temporal sentinel-1 sar data for crop growth of maize in konya basin, Turkey. ISPRS Int. Arch. Photogramm. Remote Sens. Spat. Inf. Sci. 2018, 9–13. [Google Scholar] [CrossRef]
  8. Üstüner, M.; Şanlı, F.B.; Bilgin, G.; Abdikan, S. Land use and cover classification of Sentinel-IA SAR imagery: A case study of Istanbul. In Proceedings of the 2017 25th Signal Processing and Communications Applications Conference (SIU), Antalya, Turkey, 15–18 May 2017; pp. 1–4. [Google Scholar]
  9. Civco, D.; Hurd, J.; Prisloe, S.; Gilmore, M. Characterization of coastal wetland systems using multiple remote sensing data types and analytical techniques. In Proceedings of the 2006 IEEE International Symposium on Geoscience and Remote Sensing, Denver, CO, USA, 31 July–4 August 2006; pp. 3442–3446. [Google Scholar]
  10. Malenovský, Z.; Rott, H.; Cihlar, J.; Schaepman, M.E.; García-Santos, G.; Fernandes, R.; Berger, M. Sentinels for science: Potential of Sentinel-1, -2, and -3 missions for scientific observations of ocean, cryosphere, and land. Remote Sens. Environ. 2012, 120, 91–101. [Google Scholar] [CrossRef]
  11. Drusch, M.; Del Bello, U.; Carlier, S.; Colin, O.; Fernandez, V.; Gascón, F.; Hoersch, B.; Isola, C.; Laberinti, P.; Martimort, P.; et al. Sentinel-2: ESA’s Optical High-Resolution Mission for GMES Operational Services. Remote Sens. Environ. 2012, 120, 25–36. [Google Scholar] [CrossRef]
  12. D’Odorico, P.; Damm, A.; Gonsamo, A.; Schaepman, M.E. Experimental Evaluation of Sentinel-2 Spectral Response Functions for NDVI Time-Series Continuity. IEEE Trans. Geosci. Remote Sens. 2013, 51, 1336–1348. [Google Scholar] [CrossRef]
  13. Selva, M.; Aiazzi, B.; Butera, F.; Chiarantini, L.; Baronti, S. Hyper-Sharpening: A First Approach on SIM-GA Data. IEEE J. Sel. Top. Appl. Earth Obs. Remote Sens. 2015, 8, 3008–3024. [Google Scholar] [CrossRef]
  14. Gašparović, M. and Jogun, T. The effect of fusing Sentinel-2 bands on land-cover classification. Int. J. Remote Sens. 2018, 39, 822–841. [Google Scholar] [CrossRef]
  15. Kaplan, G. Sentinel-2 Pan Sharpening—Comparative Analysis. Proceedings 2018, 2, 345. [Google Scholar]
  16. Kaplan, G.; Avdan, U. Monthly Analysis of Wetlands Dynamics Using Remote Sensing Data. ISPRS Int. J. Geo-Inf. 2018, 7, 411. [Google Scholar] [CrossRef]
  17. Özelmas, Ü.; Karakaya, M. The ornithofauna of Eskişehir/Türkiye. Biol. Divers. Conserv. 2008, 4, 19–28. [Google Scholar]
  18. Schuster, C.; Forster, M.; Kleinschmit, B. Testing the red edge channel for improving land-use classifications based on high-resolution multi-spectral satellite data. Int. J. Remote Sens. 2012, 33, 5583–5599. [Google Scholar] [CrossRef]
  19. Chatziantoniou, A.; Petropoulos, G.P.; Psomiadis, E. Co-Orbital Sentinel 1 and 2 for LULC Mapping with Emphasis on Wetlands in a Mediterranean Setting Based on Machine Learning. Remote. Sens. 2017, 9, 1259. [Google Scholar] [CrossRef]
Figure 1. General view of the study area.
Proceedings 18 00012 g001
Figure 2. Methodology used in this study.
Proceedings 18 00012 g002
Figure 3. Results of Dataset 1.
Proceedings 18 00012 g003

