1. Introduction
According to the Australian Government Bureau of Meteorology (BOM), heavy rainfall affected Queensland (Australia) from 26 January 2019 until 9 February 2019 [
1]. Several localities received more than four times their February average rainfall [
1]. The massive amount of rainfall led to moderate to major flooding.
This study aims to evaluate NASA GPM (Global Precipitation Measurement) IMERG (Integrated Multi-satellite Retrievals for GPM) V05B early run half-hourly data [
2] in the detection of the extreme rainfall that led to this massive flood event by comparing the weekly accumulated rainfall with in situ rainfall measurements. Alerts provided by ITHACA Extreme Rainfall Detection System (ERDS) were analyzed in order to estimate the most affected areas. ERDS outputs were also validated using an automatic flooded areas extraction performed both on Sentinel-3 and on MODIS (Moderate-resolution Imaging Spectroradiometer) optical images acquired after the end of the rainy period.
Obtained results highlighted that both IMERG data and ERDS outputs proved to be a reliable source of information for the evaluation of areas affected by heavy rainfall.
2. Experiments
2.1. ITHACA Extreme Rainfall Detection System
The Extreme Rainfall Detection System is a service for the monitoring and forecasting of exceptional rainfall events [
3]. This system provides both information on the rainfall amount and heavy rainfall alerts for different aggregation intervals (12, 24, 48, 72 and 96 h) using NASA GPM IMERG early run half-hourly data as near real-time source of rainfall measurements. Outputs are provided with a 0.1° spatial resolution in the latitude range between 60° N and 60° S.
The extreme rainfall detection is based on the concept of activation threshold: an event is identified when the rainfall exceeds a given threshold value. An “event-identification threshold” (EIT) represents the amount of rainfall needed to trigger a flood event induced by extreme rainfall [
3]. Specifically, an alert is provided if the accumulated rainfall exceeds the EIT. The proper EIT values were assessed in Mazzoglio et al. [
3] for every previously mentioned aggregation interval. The proposed threshold methodology is based on threshold values equal to a percentage (
) of the mean annual precipitation.
where
A lower bound was also applied in order to avoid very low thresholds in localities characterized by low mean annual precipitation (
Table 1). Conversely, an upper bound was applied to avoid unrealistically high threshold values in localities characterized by high mean annual precipitation.
2.2. Analysis of Rainfall Measurements and Alerts Datasets
In this study, NASA GPM IMERG V05B early run half-hourly data were analyzed in the following three different time periods:
from 18 January 2019 23:00 UTC to 25 January 2019 22:59 UTC;
from 25 January 2019 23:00 UTC to 1 February 2019 22:59 UTC;
from 1 February 2019 23:00 UTC to 8 February 2019 22:59 UTC.
Specifically, a comparison with daily rainfall measurements [
5] contained in the Bureau of Meteorology climate database, the Australian Data Archive for Meteorology (ADAM), was performed. The weekly difference between these two gridded products was evaluated in order to detect local underestimations/overestimations.
Also, the spatial and temporal distribution of the alerts provided by ERDS were analyzed in the same three time periods in order to evaluate the most affected areas.
2.3. Automatic Flooded Areas Extraction
Freely accessible satellite images were analyzed in order to evaluate the presence and the temporal evolution of the flooded areas. Sentinel-1 and Sentinel-2 images, despite their good spatial resolution, were discarded due to the long revisit time. Sentinel-1 and Sentinel-2 satellites, in fact, were able to cover only a small portion of Queensland in the useful time window. Sentinel-3 is instead characterized by a revisit time of less than two days, allowing frequent updates to be obtained. MODIS is designed with a daily revisit time.
An automatic flooded areas extraction was performed both on Sentinel-3 and on MODIS images acquired on 10, 13, 15 and 21 February. Images acquired before 10 February could not be used due to the high cloud coverage. Satellite images were downloaded using Sentinel-hub EO-Browser [
6].
This water extraction was performed by taking advantage of the peculiarity of the Normalized Difference Water Index (NDWI) in the identification of water features. This index makes use of near-infrared radiation and visible green light to enhance the presence of such features while eliminating the presence of soil and terrestrial vegetation features [
7].
where
NDWI was generated from Sentinel-3 using B06 (λ center equal to 560 nm, 300 m spatial resolution) as the green band and B19 (λ center equal to 900 nm, 300 m spatial resolution) as the NIR band [
8], while for MODIS it was used B04 (545–565 nm, 500 m spatial resolution) as the green band and B05 (1230–1250 nm, 500 m spatial resolution) as the NIR band [
9].
Pixels characterized by an NDWI value equal to or greater than 0.1 were classified as water. Pixels characterized by an NDWI value lower than 0.1 were classified as no-water.
This approach, unfortunately, suffers from drawbacks induced by false alarms in cloudy zones. A manual refinement of the water mask by means of visual interpretation proved to be necessary in order to remove false alarms induced by the presence of clouds in some portion of the images.
3. Results
Figure 1 compares the accumulated rainfall for three different time periods evaluated both from in situ and from GPM IMERG products. The first row shows the results obtained using daily rainfall measurements contained in the Bureau of Meteorology climate database, while the second row was obtained using NASA GPM IMERG early run half-hourly data. The third row shows the difference between these two products.
Both in situ and satellite data confirmed that the maximum accumulated rainfall was recorded in the second week (the maximum value was equal to 1064 mm according to BOM and 773 mm according to GPM IMERG data).
During the second week, a modest overestimation in the weekly accumulated rainfall obtained using IMERG data emerged in the southern part of Queensland (red zones reported in the third row of
Figure 1). This apparent overestimation that emerged from the comparison with in situ data could be partly induced by the absence of measurements in the daily in situ rainfall totals. While the original analysis showed zero accumulated rainfall in some parts of that area, the recalibrated dataset was characterized by the absence of data.
During the third week, instead, a considerable underestimation was recorded in the central part of Queensland (blue zones reported in the third row of
Figure 1). Also, the location of the maximum accumulated rainfall was subject to a modest spatial shift.
The maximum positive weekly difference was recorded during the third week (741 mm) near Townsville (one of the most affected cities). The maximum negative weekly difference was instead recorded during the second week (−599 mm) near Normanton.
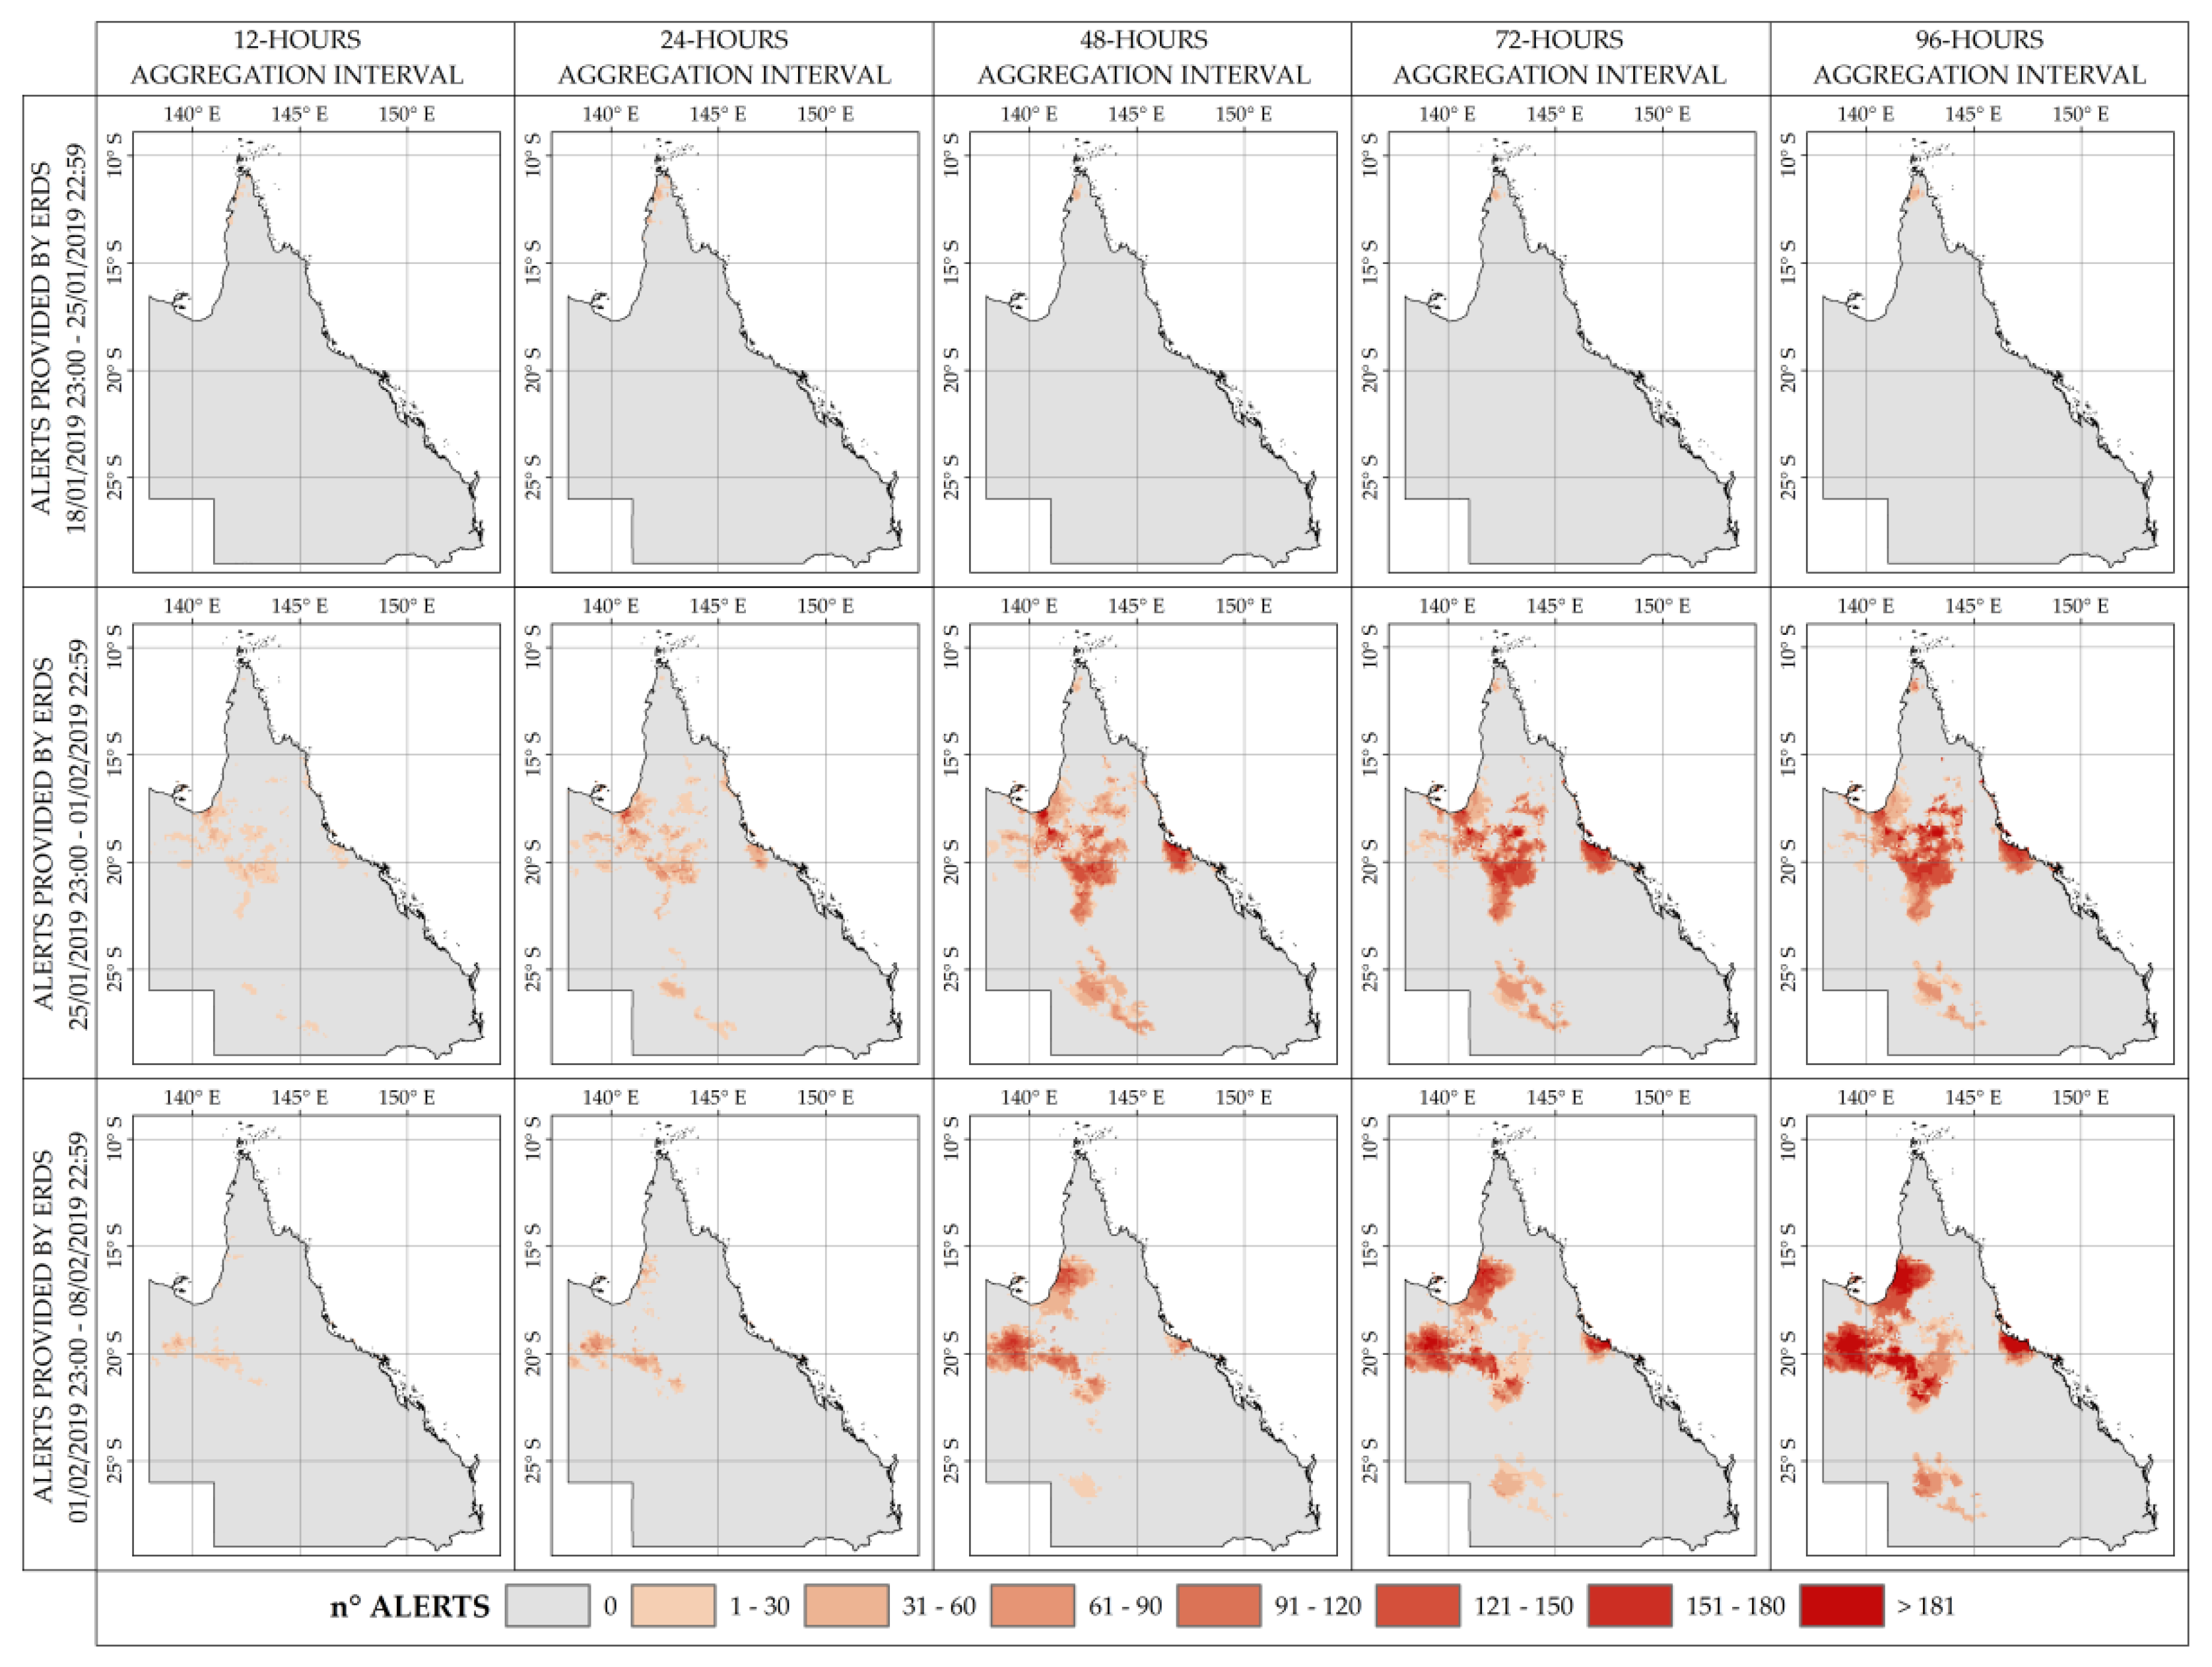
Figure 2 provides an overview of the areas affected by heavy rainfall (according to ERDS near real-time alerts) in the three previously mentioned weeks. In the first week, alerts were provided only in the northern areas of Queensland. During the second and third weeks, alerts were also issued in the central part of Queensland.
For a proper understanding of the results, it is important to highlight that ERDS analyzes 48 half-hourly rainfall measurements every day. In other words, every week ERDS could provide a maximum of 336 half-hourly alerts.
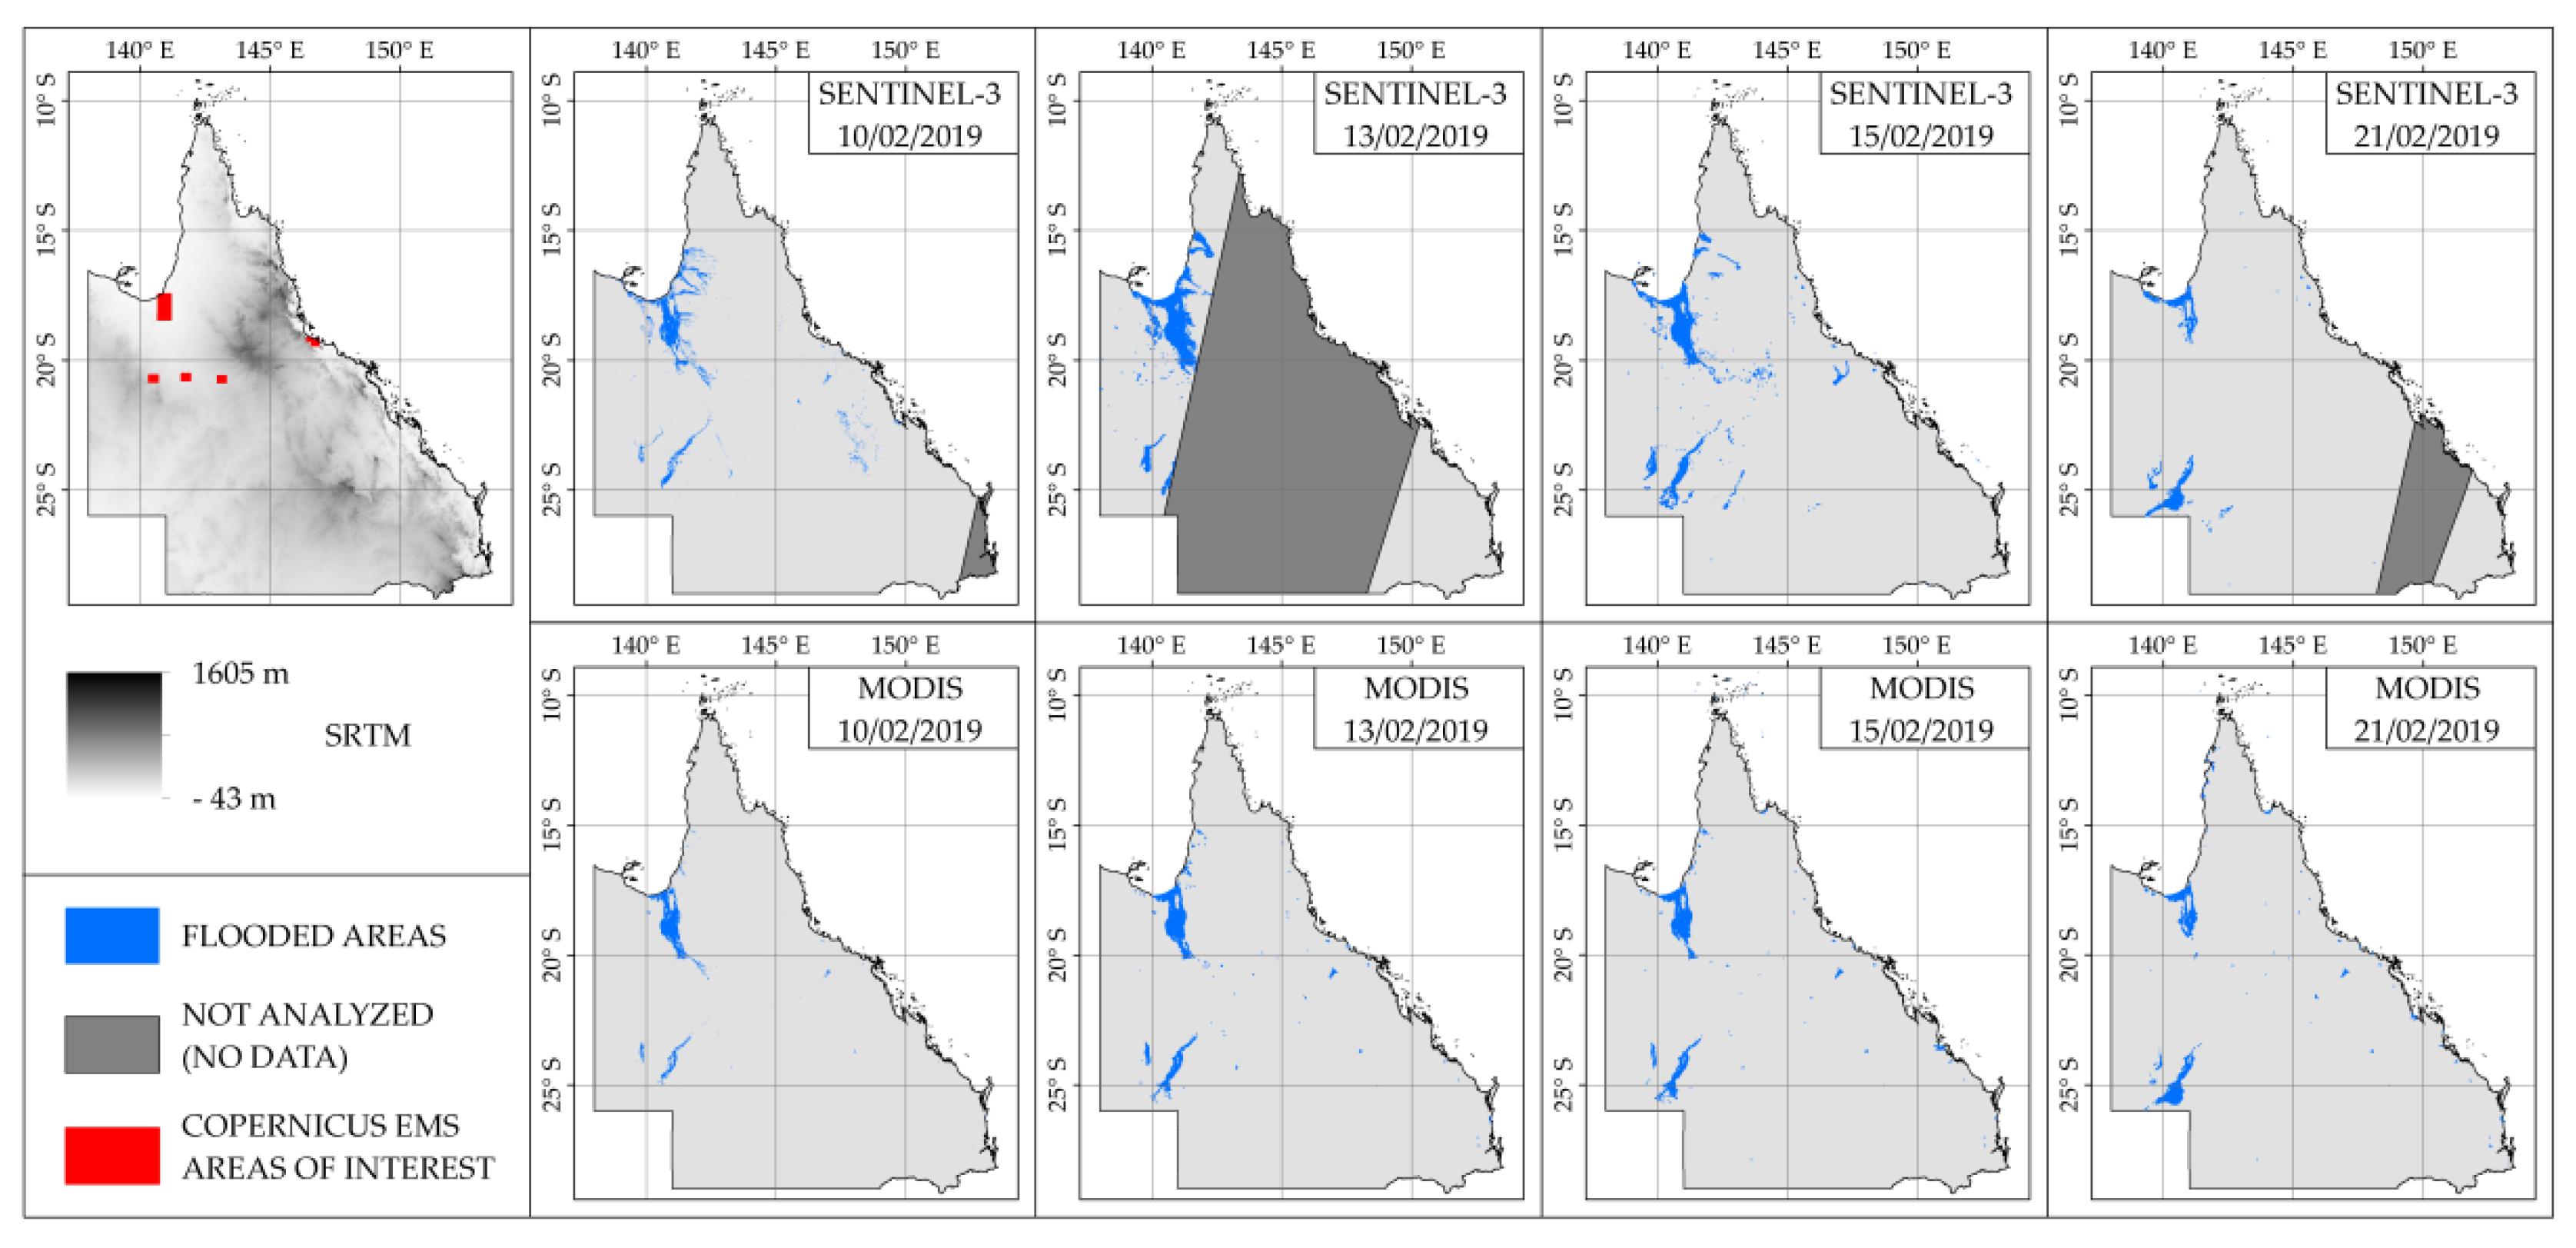
Figure 3 shows the automatic flooded areas extraction performed both on Sentinel-3 and on MODIS images. This water extraction also includes the reference water (a clip was performed only over the sea). Red features represent the areas of interest analyzed by Copernicus Emergency Management Service [
10]. A modest underestimation was visible in the flooded areas extracted using MODIS images.
4. Discussion
GPM IMERG early run half-hourly data proved to be a good source of information for rainfall monitoring at the regional scale. Due to the coarse spatial resolution (0.1°), local scale validation is recommended.
The obtained results indicate that ERDS was able to detect the most affected areas. The discrepancies between flooded areas and ERDS alert locations were mainly induced by the characteristics of the early warning system. The system successfully provides alerts about heavy rainfall. No analysis regarding the areas that will be affected by flood events is performed. Further studies could be conducted to implement information about the morphology of the territory with the aim of providing information about where the flood events will occur in the future.
5. Conclusions
The evidence presented in this study suggest that both GPM IMERG early run data and ERDS outputs are reliable sources of near real-time rainfall information for the monitoring of heavy rainfall events. These findings have important applications for countries were an appropriate network of measurement instruments is still missing.
However, a number of significant limitations must be highlighted. Modest underestimations/overestimations were reported in different localities, especially when a high rainfall rate was measured. Local-scale validation is recommended due to the native spatial resolution.
Author Contributions
Formal analysis, P.M. and C.S.; Methodology, P.M., F.L. and C.S; Software, P.M. and C.S.; Writing—original draft, P.M.; Writing—review and editing, P.M., F.L., C.S., P.B.
Acknowledgments
We express our gratitude to Simone Balbo and Paolo Pasquali, who helped us in the development of the web app.
Conflicts of Interest
The authors declare no conflict of interest.
References
- Special Climate Statement 69—An Extended Period of Heavy Rainfall and Flooding in Tropical Queensland; Bureau of Meteorology: Melbourne, Australia, 2019.
- Huffman, G.J. GPM IMERG Early Precipitation L3 Half Hourly 0.1 Degree x 0.1 Degree V05; Goddard Earth Sciences Data and Information Services Center (GES DISC): Greenbelt, MD, USA, 2015. [Google Scholar]
- Mazzoglio, P.; Laio, F.; Balbo, S.; Boccardo, P.; Disabato, F. Improving an Extreme Rainfall Detection System with GPM IMERG data. Remote Sens. 2019, 11, 677. [Google Scholar] [CrossRef]
- Schneider, U.; Becker, A.; Finger, P.; Meyer-Christoffer, A.; Rudolf, B.; Ziese, M. GPCC Monitoring Product: Near Real-Time Monthly Land-Surface Precipitation from Rain-Gauges based on SYNOP and CLIMAT Data; Global Precipitation Climatology Centre: Offenbach, Germany, 2011. [Google Scholar] [CrossRef]
- Daily Rainfall Totals for Australia. Available online: http://www.bom.gov.au/jsp/awap/rain/index.jsp (accessed on 17 February 2019).
- Sentinel-Hub EO-Browser. Available online: https://apps.sentinel-hub.com/eo-browser/ (accessed on 9 April 2019).
- McFeeters, S.K. The use of the Normalized Difference Water Index (NDWI) in the delineation of open water features. Int. J. Remote Sens. 1996, 17, 1425–1432. [Google Scholar] [CrossRef]
- User Guides Sentinel-3 OLCI—Radiometric Resolution—21 Bands in VIS/SWIR. Available online: https://sentinel.esa.int/web/sentinel/user-guides/sentinel-3-olci/resolutions/radiometric (accessed on 9 April 2019).
- MODIS Specifications. Available online: https://modis.gsfc.nasa.gov/about/specifications.php (accessed on 9 April 2019).
- Copernicus Emergency Management Service (© 2019 European Union), EMSR342. Available online: https://emergency.copernicus.eu/mapping/list-of-components/EMSR342 (accessed on 9 April 2019).
© 2019 by the authors. Licensee MDPI, Basel, Switzerland. This article is an open access article distributed under the terms and conditions of the Creative Commons Attribution (CC BY) license (https://creativecommons.org/licenses/by/4.0/).


