Proceeding Paper

Distributed Strain Measurement Using Power-Based Brillouin Sensor with Three Folded Dynamic Range †

Institute of Innovative Research, Tokyo Institute of Technology, 4259, Nagatsuta-cho, Midori-ku, Yokohama 226-8503, Japan
*
Author to whom correspondence should be addressed.
Presented at the 7th International Symposium on Sensor Science, Napoli, Italy, 9–11 May 2019.
Proceedings 2019, 15(1), 26; https://doi.org/10.3390/proceedings2019015026
Published: 15 July 2019
(This article belongs to the Proceedings of 7th International Symposium on Sensor Science)

Abstract

:
We clarify that, unlike time-domain techniques, slope-assisted Brillouin optical correlation-domain reflectometry has a trade-off relation between the strain dynamic range and the spatial resolution. This trade-off is shown to be caused by its unique bell-shaped noise floor, which is inherently unavoidable in correlation-domain systems. Subsequently, we experimentally show that, at the cost of lowered spatial resolution, the strain dynamic range can be 3 times wider than the previously reported value.

1. Introduction

Slope-assisted (SA-) Brillouin optical correlation-domain reflectometry (BOCDR) is a recently developed structural health-monitoring system, which can measure strain, temperature distributions along the sensing fiber [1]. Unlike standard BOCDR system [2], SA-BOCDR can obtain measurement results in real time since it uses a spectral power change at a certain frequency in the Brillouin gain spectrum (BGS) instead of acquiring the whole BGS to derive the Brillouin frequency shift (BFS).
Since the first proposal of SA-BOCDR [1], not only its fundamental operation, but also some unique features, including beyond-nominal-resolution effect [3] and measurement sensitivity dependencies on experimental conditions [4], have been well investigated to improve its performance. But in the previous reports, the dynamic range were restricted to the linear range of the BGS (detailed definition is given in [1]). However, it is well known that the linear range of the BGS is relatively narrow (~70 MHz) and corresponds to the strain of ~0.15% (~64 K for temperature change) [1]. Considering practical applications, it is required to extend the dynamic range of SA-BOCDR.
In this work, first, as a simplest method to solve this problem, we use the nonlinear range of the BGS and perform distributed measurements with large strains. However, it turns out to be that employing the nonlinear spectral range is ineffective in widening the maximal detectable strain of the system due to the bell-shaped background noise [5,6] in the BGS. Thus, as a new method for enhancing the strain dynamic range, we show that this background noise can be utilized for strain sensing by deteriorating the spatial resolution of the system. Then, we prove that there is a trade-off relation between the strain dynamic range and spatial resolution in SA-BOCDR and successfully achieve a strain dynamic range of >0.6% at the cost of three times lowered spatial resolution, which is three times wider than the previous record.

2. Experiments

The experimental of SA-BOCDR is shown in Figure 1, which is basically the same as that of the previously reported [1]. As a light source, we used a 1550 nm distributed feedback laser. The resolution bandwidth and the video bandwidth of the electrical spectrum analyzer were set to be 10 MHz and 10 kHz, respectively. The repetition rate was set to 100 Hz, and averaging was performed 512 times on an oscilloscope to improve the signal-to-noise ratio. To begin with, as a fiber under test (FUT), we used a 7.5-m-long silica single-mode fiber with a BFS of 10.86 GHz at room temperature (23 °C). The modulation frequency fm and amplitude ∆f were set to 9.80–9.97 MHz and 0.27 GHz, respectively, corresponding to the measurement range dm of ~10.3 m and the theoretical spatial resolution R of ~0.37 m according to Equations (15) and (16) in [7]. Note that fm were maintained at 9.89 MHz when we performed single-point measurements to obtain the Brillouin signal only from the correlation peak (located ~4.0 m away from the end of the second-port pigtail of an optical circulator).
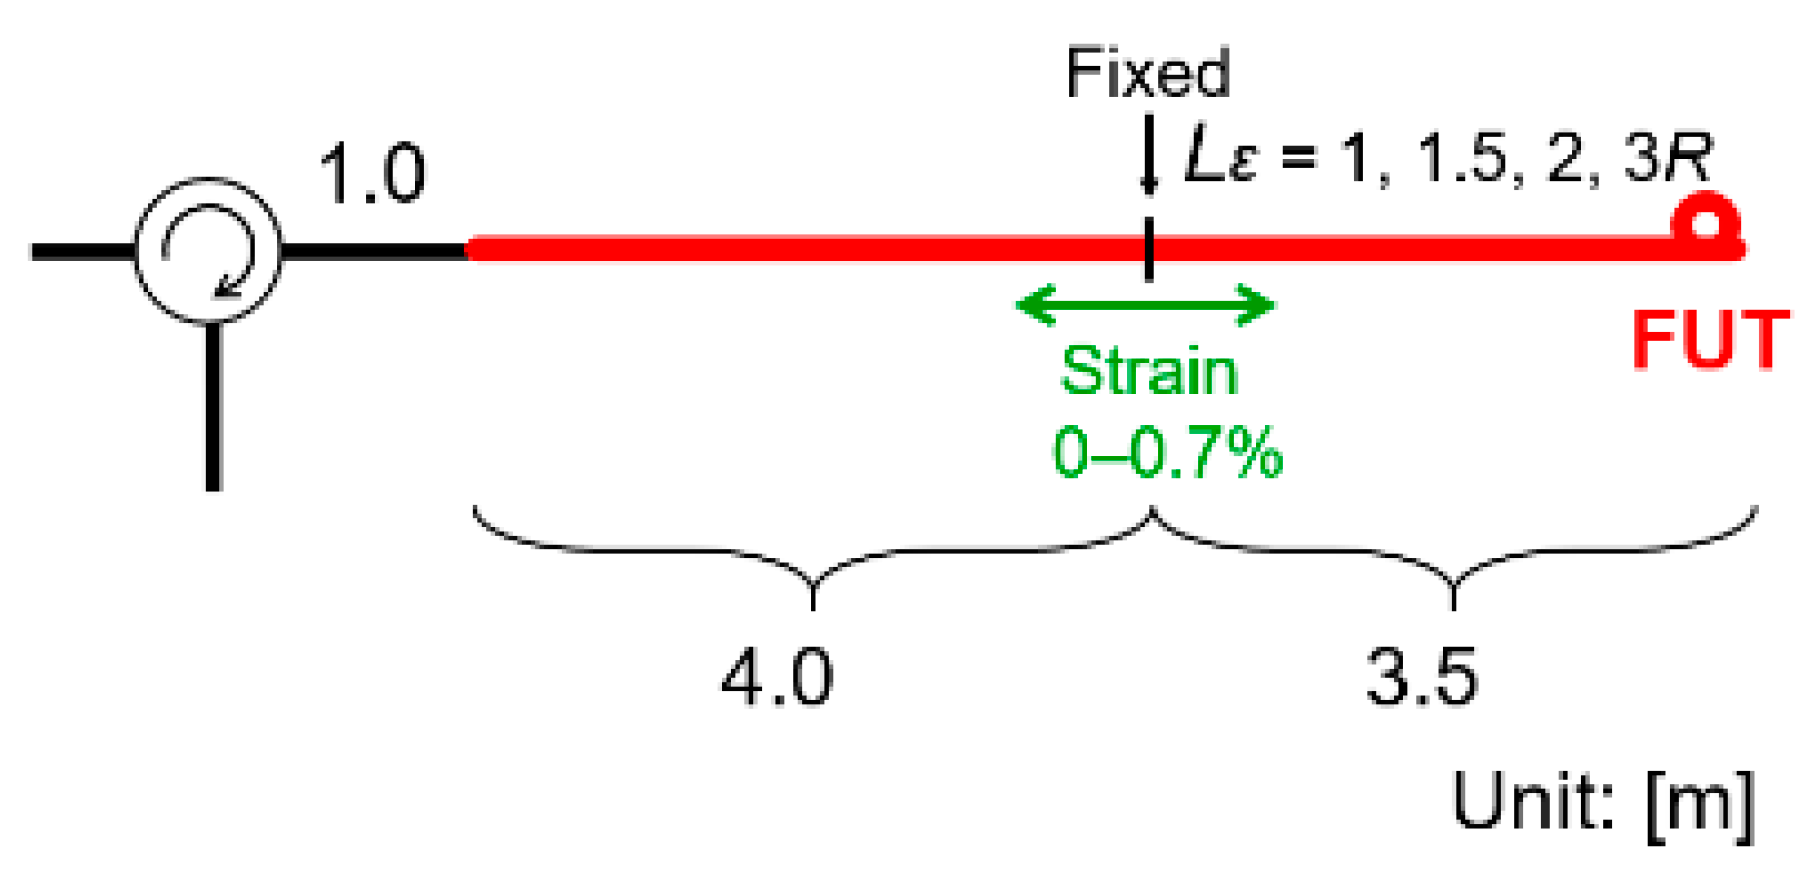
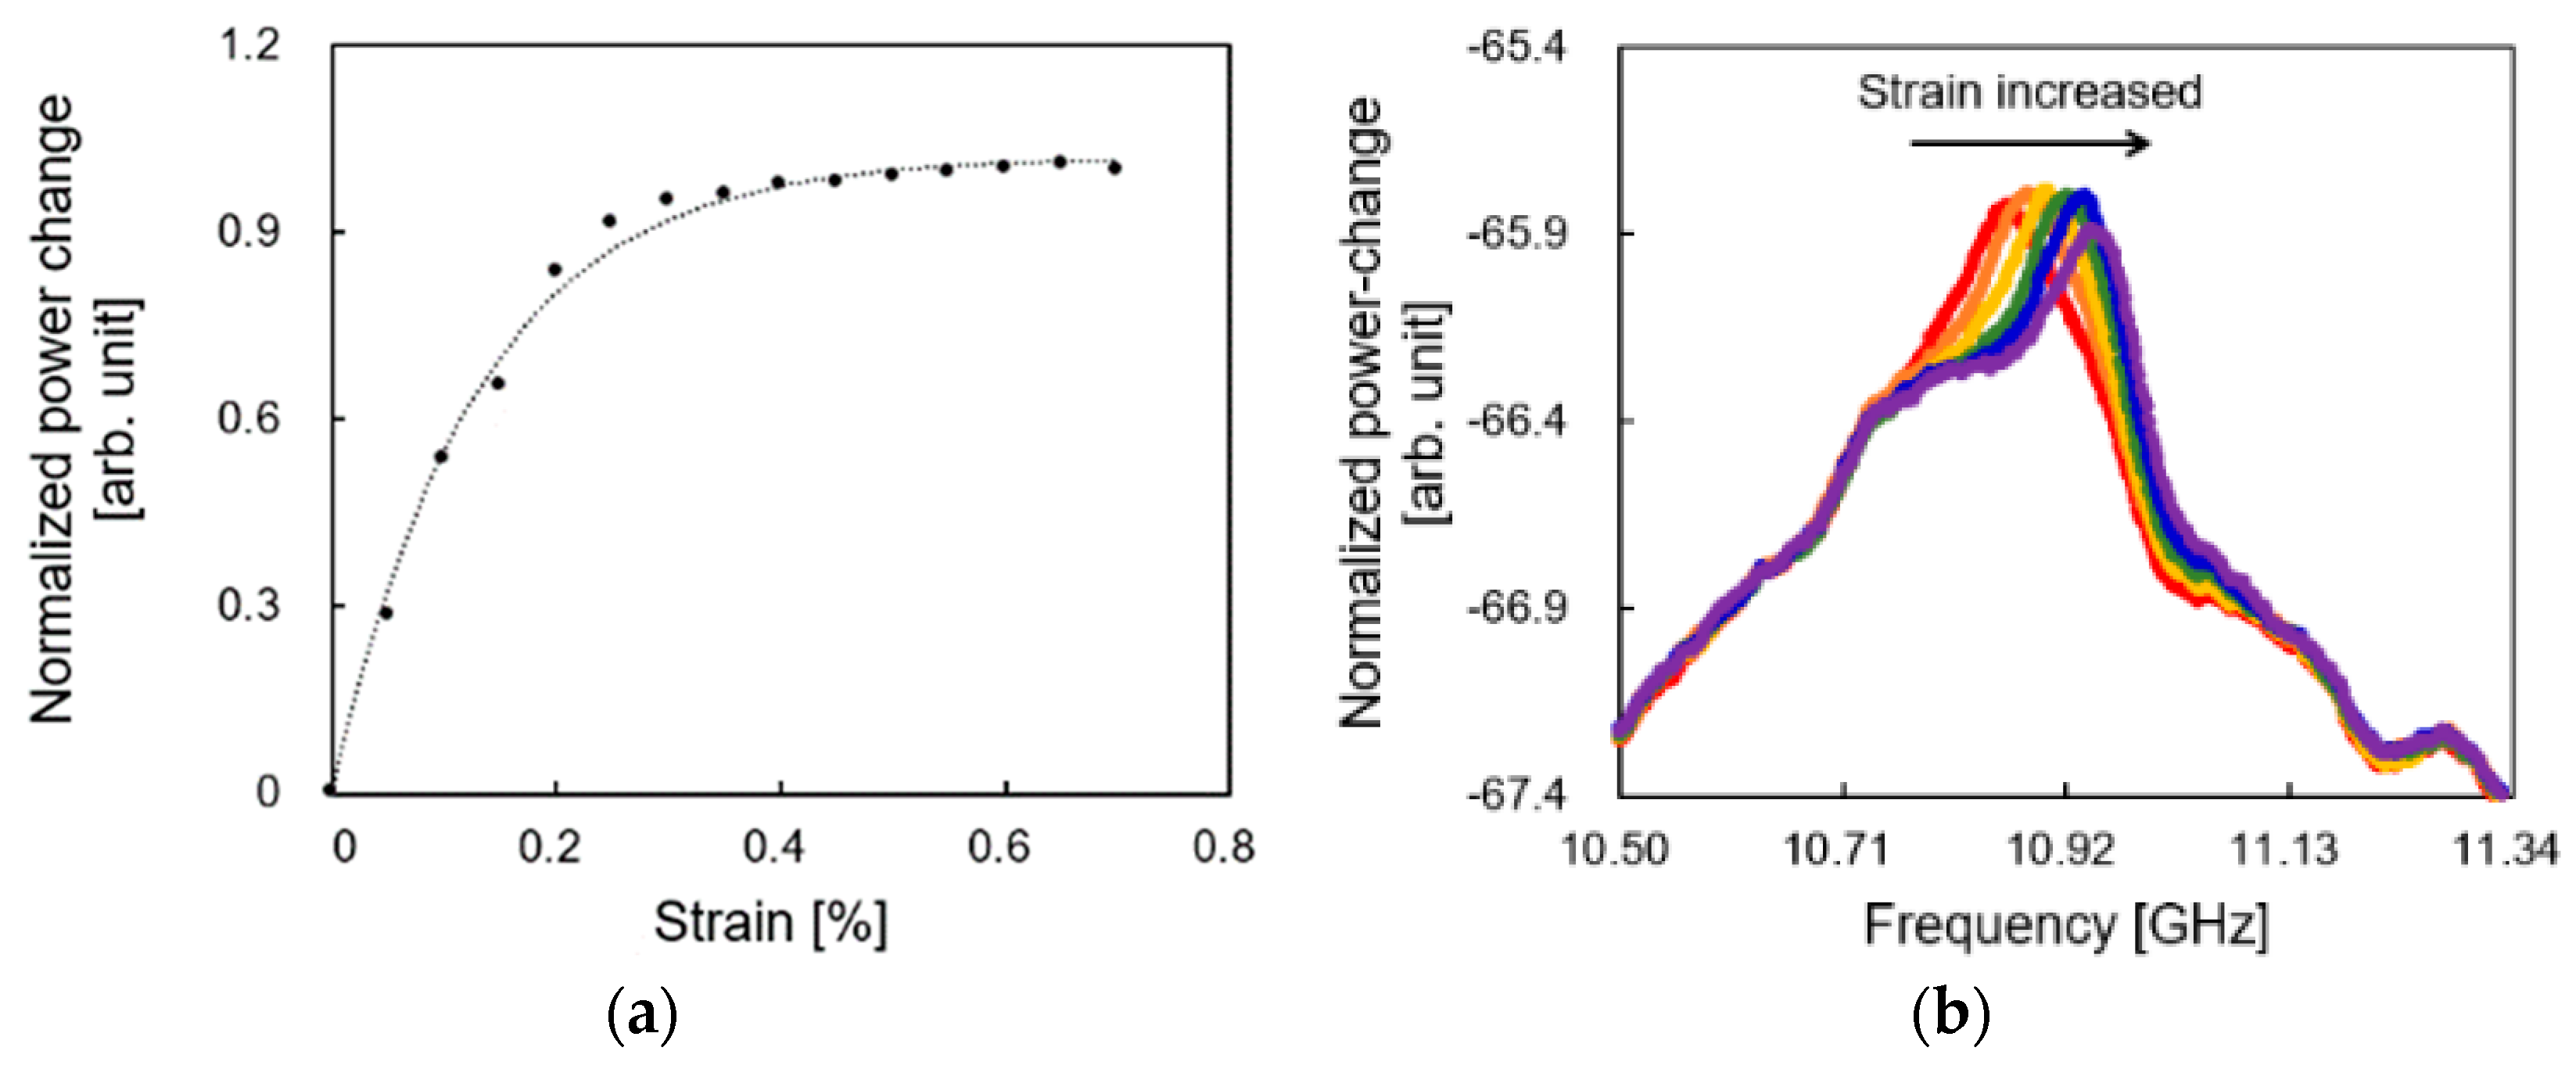
First, using the FUT shown in Figure 2, we performed distributed strain measurements while applying strains of 0–0.7% to a ~0.37-m-long section (same as the nominal spatial resolution R) and obtained the spectral power changes at each strain. Note that only strains of ~0.15% (~1/5 of 0.7%) have been measured so far using SA-BOCDR. Figure 3a shows the normalized power change dependence on applied strain. The spectral power change was almost linear on strain in the range of 0–0.15%, which well agrees with previous reports. However, for strains of >0.2%, the power change became saturated and kept almost constant. Thus, the strain dynamic range was not drastically enhanced (only up to ~0.25%), which indicates that we cannot directly employ the nonlinear region of the BGS.
To clarify the origin of this limitation, we acquired the BGS at each strain as shown in Figure 3b. With increasing strain, the spectral power at 10.85 GHz decreased when the applied strain was smaller than 0.25%. However, as we confirmed in Figure 3a, for strains of >0.25%, the spectral power was almost constant owing to the bell-shaped background noise [5,6], which intrinsically restrict the strain dynamic range of the system.
Previous researches on BOCDA [5,6] have reported that this background noise is caused by the accumulation of distorted BGSs at “non-correlation” sections along the FUT and inherently unavoidable in correlation-domain systems [2,8]. However, in general, the closer the non-correlation sections are to the correlation peak, the greater their contribution to the noise floor becomes. Therefore, we thought of an idea that, if we accept deteriorated spatial resolution, the large amount of the background noise could be shifted in accordance with applied strain, which eventually enables widening the strain dynamic range of the system.
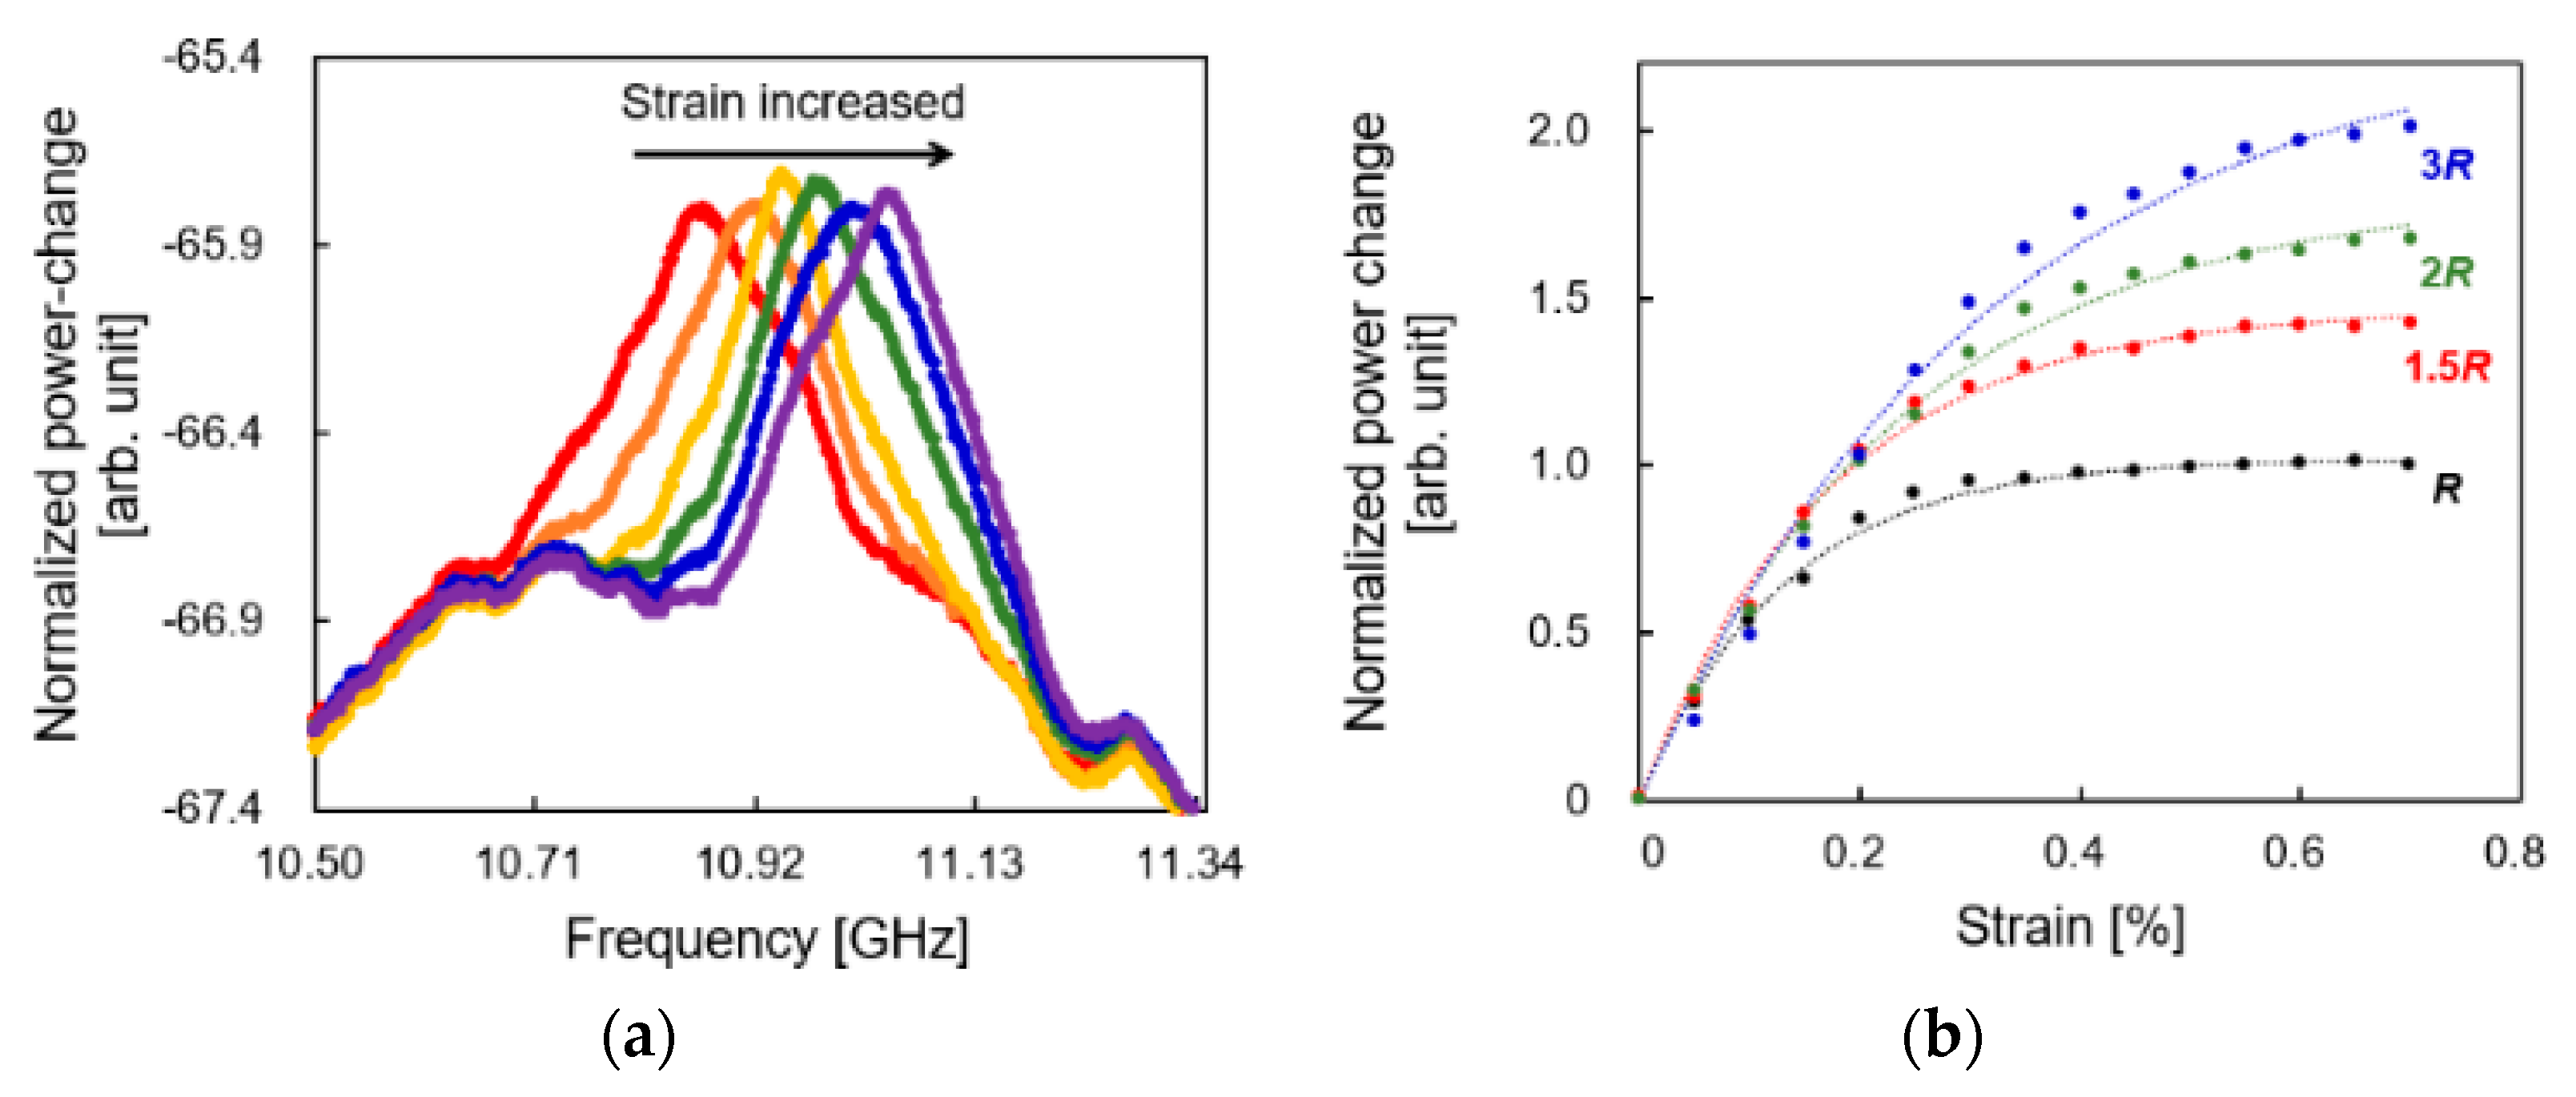
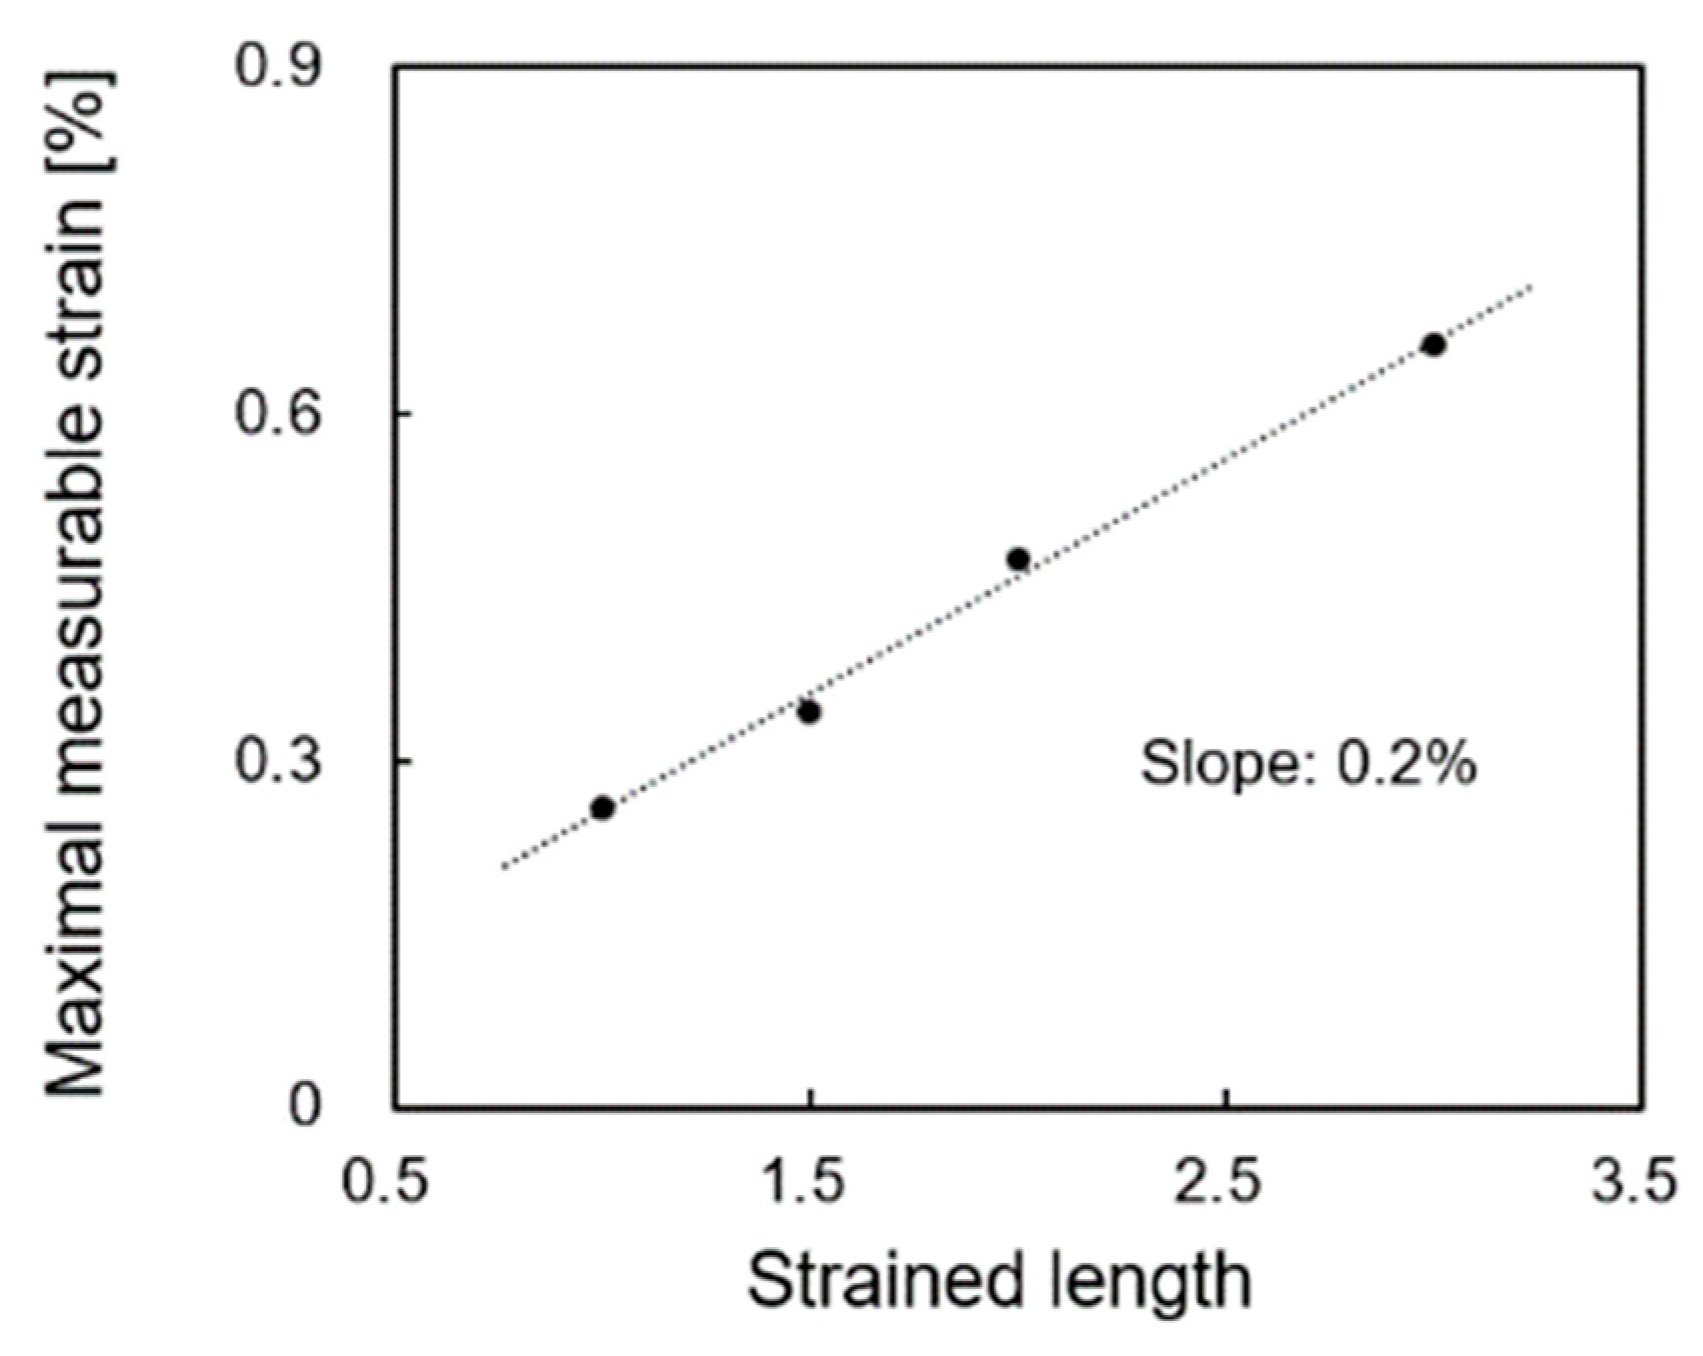
To confirm this trade-off relation between the strain dynamic range and spatial resolution, we performed similar experiments while elongating the length of the strain Lε (which can be regarded as redefined spatial resolution) from R to 3R. Figure 4a shows the BGSs measured when the strains of 0–0.5% were applied to the 3R-long section in the FUT. Unlike in the case of Lε = R (Figure 3b), the spectral power at 10.85 GHz decreased even when the applied strain was larger than 0.25%. Figure 4b shows the normalized power change dependence on strain. The power change increased with increasing strain regardless of Lε, and the saturation value of the power change also increased with increasing Lε. This indicates that part of the noise floor shifted in accordance with applied strain. Then, in Figure 5, we plotted the strain at saturation (which can be regarded as maximal measurable strain; defined as the strain at which the power change reached approximately 86.5% of its saturation value) as a function of Lε. In this range, as Lε increased, strain dynamic range increased almost linearly with a coefficient of 0.2%, and we experimentally proved that three folded strain dynamic range can be achieved with three times lowered spatial resolution.

3. Conclusions

We experimentally clarified that there is a trade-off relation between the strain dynamic range and spatial resolution in SA-BOCDR because of the bell-shaped noise floor in BGS peculiar to the correlation-domain techniques. Then, by intentionally lowering the spatial resolution of the system, we successfully achieved strain dynamic range that is three times wider than the previously reported record. Thus, we believe that this work will be of great use in practical applications in SA-BOCDR-based structural health monitoring with wide strain dynamic range in the future.

Funding

This work was partially supported by JSPS KAKENHI Grant Numbers 17H04930 and 17J07226, and by a research grant from the Fujikura Foundation.

Conflicts of Interest

The authors declare no conflict of interest.

References

  1. Lee, H.; Hayashi, N.; Mizuno, Y.; Nakamura, K. Slope-assisted Brillouin optical correlation-domain reflectometry: proof of concept. IEEE Photon. J. 2016, 8, 6802807. [Google Scholar] [CrossRef]
  2. Mizuno, Y.; Zou, W.; He, Z.; Hotate, K. Proposal of Brillouin optical correlation-domain reflectometry (BOCDR). Opt. Express 2008, 16, 12148–12153. [Google Scholar] [CrossRef] [PubMed]
  3. Lee, H.; Hayashi, N.; Mizuno, Y.; Nakamura, K. Operation of slope-assisted Brillouin optical correlation-domain reflectometry: comparison of system output with actual frequency shift distribution. Opt. Express 2016, 24, 29190–29197. [Google Scholar] [CrossRef]
  4. Lee, H.; Mizuno, Y.; Nakamura, K. Measurement sensitivity dependencies on incident power and spatial resolution in slope-assisted Brillouin optical correlation-domain reflectometry. Sens. Actuator A: Phys. 2017, 268, 68–71. [Google Scholar] [CrossRef]
  5. Song, K.Y.; He, Z.; Hotate, K. Optimization of Brillouin optical correlation domain analysis system based on intensity modulation scheme. Opt. Express 2006, 14, 4256–4263. [Google Scholar] [CrossRef] [PubMed]
  6. Song, K.Y.; He, Z.; Hotate, K. Effects of intensity modulation of light source on Brillouin optical correlation domain analysis. J. Lightw. Technol. 2007, 25, 1238–1246. [Google Scholar] [CrossRef]
  7. Mizuno, Y.; Zou, W.; He, Z.; Hotate, K. Operation of Brillouin optical correlation-domain reflectometry: theoretical analysis and experimental validation. J. Lightw. Technol. 2010, 28, 3300–3306. [Google Scholar] [CrossRef]
  8. Hotate, K.; Hasegawa, T. Measurement of Brillouin gain spectrum distribution along an optical fiber using a correlation-based technique—proposal, experiment and simulation—. IEICE Trans. Electron. 2000, E83-C, 405–412. [Google Scholar]
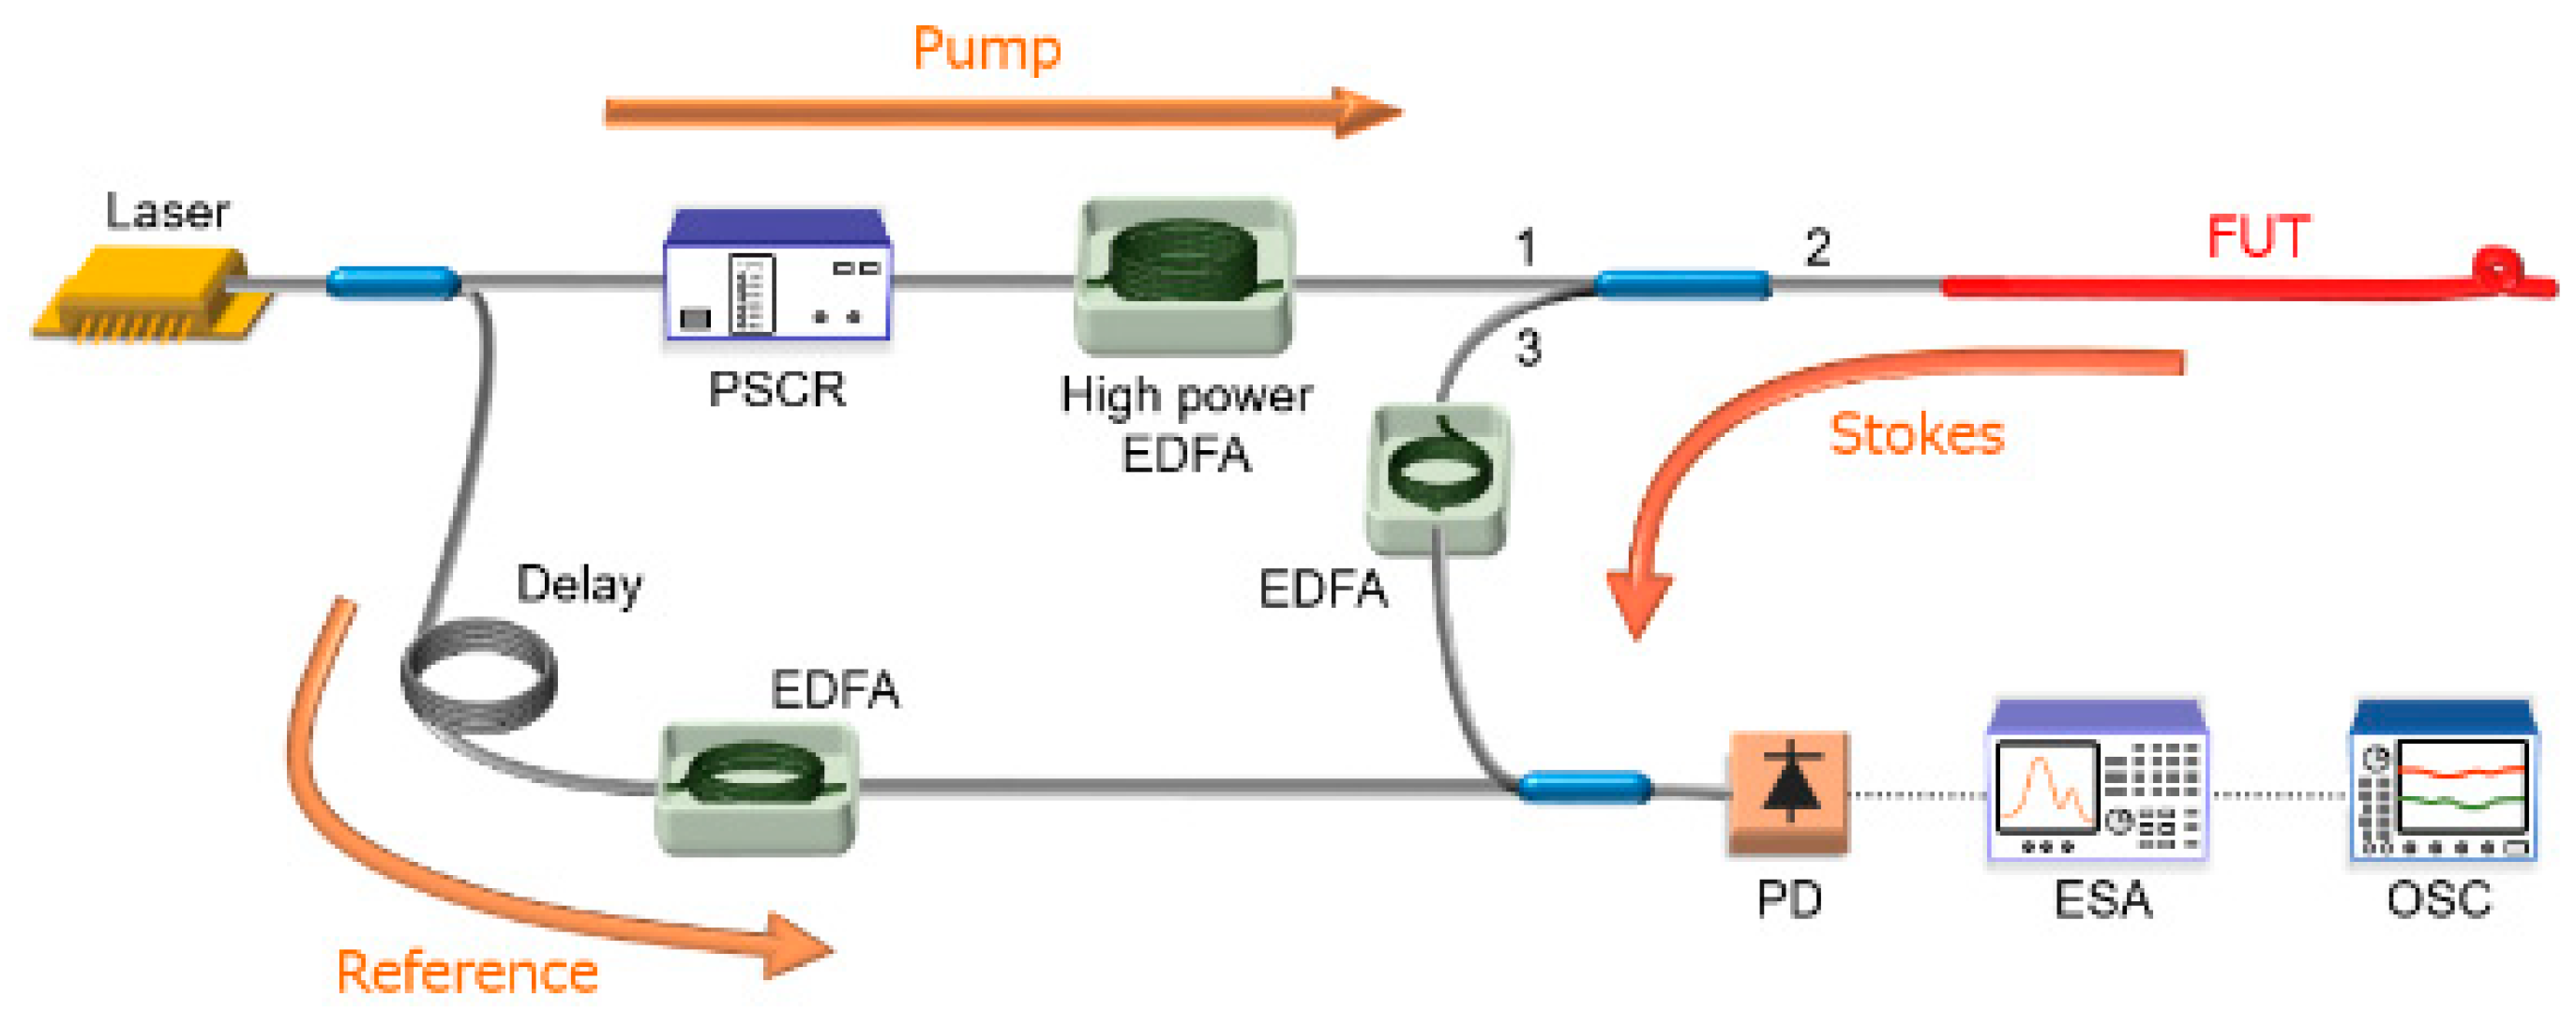
Figure 1. Experimental setup of SA-BOCDR. EDFA, erbium-doped fiber amplifier; ESA, electrical spectrum analyser; FUT, fiber under test; OSC, oscilloscope; PD, photo diode; PSCR, polarization scrambler.
Proceedings 15 00026 g001
Figure 2. Structure of fiber under test (FUT).
Proceedings 15 00026 g002
Figure 3. (a) Normalized power change plotted as a function of applied strain. The dotted curve is an exponential fit. (b) BGSs measured at strains of 0–0.25% (step: 0.05%) when the strained length Lε was the same as the nominal spatial resolution R.
Proceedings 15 00026 g003
Figure 4. (a) BGSs measured at strains of 0–0.5% (step: 0.1%) when the strained length Lε was 3R. (b) Normalized power changes plotted as functions of applied strain when the strained lengths Lε were R, 1.5R, 2R, and 3R. The dotted curves are exponential fits.
Proceedings 15 00026 g004
Figure 5. Maximal measurable strain plotted as a function of strained length Lε. The dotted line is a linear fit.
Proceedings 15 00026 g005
Publisher’s Note: MDPI stays neutral with regard to jurisdictional claims in published maps and institutional affiliations.