Abstract
Mechanical stresses of materials are generally coupled with temperature variations and then, monitoring such variations can help gaining information about the material behavior under the applied loads. This can be accomplished with an infrared imaging device, which can be advantageously exploited to sense the thermal radiation associated with mechanical stresses and to obtain a legible explicative temperature map. In the present paper, glass/epoxy is used as material case study to show that thermal signatures visualized during the load application can be decoded into knowledge, which can contribute to the material characterization. In particular, glass/epoxy specimens are subjected to three types of tests: cantilever beam alternate bending, quasi-static bending and low velocity impact. Thermal images are acquired in time sequence during each test and after post-processed and analyzed. It is possible to get data about the damage initiation and its evolution under either quasi-static bending, or impact. In particular, a cute analysis of thermal images supplies information about damage types (matrix cracks, or fibers breakage) and extension of delamination, as well of the impact duration and the time to reach peak contact force. It is also possible to well depict the harmonic cantilever beam oscillations through the associated small temperature variations.
1. Introduction
Temperature represents a key parameter to be monitored in many engineering applications fields for safety/quality purposes. In fact, there is an operating working temperature range of any electric/electronic appliance and deviations from this range are symptoms of fault, or wrong operation. Temperature is also important for welding, tempering, polymerization, forming of composites, etc. In addition, a temperature variation is generally coupled with mechanical stresses of materials (thermo-elastic effect) [1]; therefore, the availability of a temperature map allows to get information about the material response to an applied load. This may be useful to classify polymeric and composite materials since a material, due to its atomic/molecular configuration may show positive (PTE), or negative (NTE) thermal expansion. Besides, the temperature distribution is also useful to get information about initiation and evolution of damage during the application of load (thermo-plastic effect) [2]. Of course, mapping of surface temperature over a sample while loaded can be mostly done with remote sensors; this opportunity is offered by infrared thermography (IRT) [2]. In the present paper, some results are reported which demonstrate the capability of IRT to visualize the surface temperature variations associated with thermo-elastic/plastic effects and to sense also the feeble thermal radiation emitted by a cantilever beam under cyclic bending.
2. Results
A glass fiber reinforced polymer (GFRP) including unidirectional E-glass fibers and low viscosity epoxy resin is herein considered [3]. More specifically, 8 epoxy impregnated E-glass plies are hand lay-up stacked at [0°2, 90°2]s to obtain an overall sample thickness of 2.9 mm; curing is performed under press at ambient temperature. The dimensions of samples are: 100 mm × 130 mm, or 30 mm × 130 mm, owing to the type of test: impact, or quasi-static and cyclic bending, respectively. Impact tests are carried out with a modified Charpy pendulum which is equipped with a special fixture to lodge specimens that allows for the contact with the hammer from one sample side and optical view (by the infrared camera) from the other one. Two infrared cameras are used, the SC6000 and the SC6800 (Flir systems) with images acquired at frame rate of 83 and 960 Hz respectively. Quasi-static bending tests are carried out with a standard three-point bending configuration set-up with the sample horizontally laid over two supports at a mutual distance of 50 mm and downwards loaded in the middle at a speed of 5 mm/min with a 5 mm radius loading nose. For these tests, the Flir T650sc infrared camera views the specimen at about 45° to include both its bottom flat surface and its thickness and acquires sequences of thermal images at 30 Hz. Cyclic bending is carried out with a prototype test setup; the cantilever beam specimen oscillates at frequency 2.0 Hz, with deflection ±7.5 mm forward and backward with respect to its rest position. Sequences of thermal images are acquired with the SC6000 infrared camera at 60 Hz. All the acquired sequences of thermal images are post-processed with the ResearchIR software supplied with the infrared cameras and routines specifically developed in the Matlab environment. Some results in terms of temperature difference (ΔT) with respect to the initial ambient temperature are reported in the following Figure 1, Figure 2 and Figure 3. Figure 1 shows ΔT-time plots extracted at several positions x along the beam of length L. Maximum temperature values, extracted from thermal images recorded during quasi-static bending, are compared with the force distribution in Figure 2. At last, some ΔT images taken at different time instants during impact at 11.7 J are shown in Figure 3.
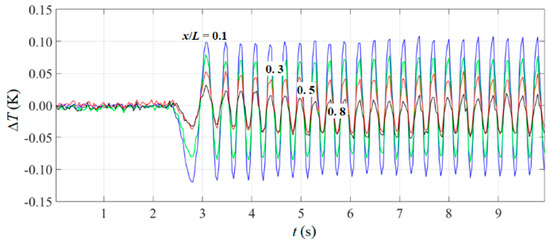
Figure 1.
ΔT-time evolution during cyclic bending.
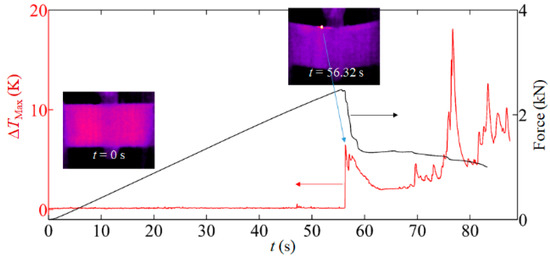
Figure 2.
ΔT and quasi-static force time evolution.
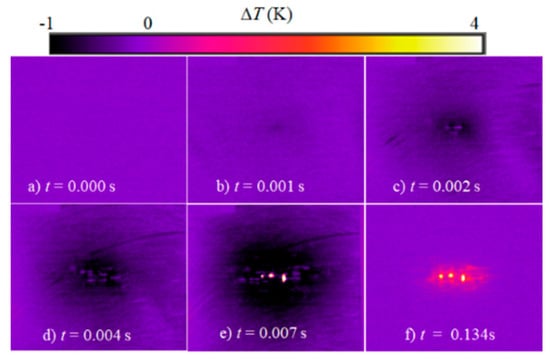
Figure 3.
Some ΔT images taken during impact at 11.7 J.
3. Conclusions
The thermal signatures developing under mechanical stresses can be exploited for a better understanding of the behavior of loaded composites materials. From cyclic bending tests infrared thermography is able to visualize the feeble temperature variations coupled with the harmonic sample oscillations. In particular, it is possible to notice (Figure 1) the reduction of the amplitude signal with increasing the distance (x) from the fixture in agreement with the bending moment diagram. From both quasi-static bending (Figure 2) and impact tests (Figure 3), owing to the appearance of hot spots and their successive growing up, it is possible to visualize initiation and propagation of damage. In fact, any form of damage, whether crack with subsequent spreading, or fiber breakage, is accompanied by heat release and temperature rise. With regard to impact tests, the initial negative ΔT values (dark zones) can also be exploited to get information about impact duration and the time to reach peak contact force.
References
- Biot, M.A. Thermoelasticity and irreversible thermodynamics, J. Appl. Phys. 1956, 27, 240–253. [Google Scholar] [CrossRef]
- Meola, C.; Boccardi, S.; Carlomagno, G.M. Infrared Thermography in The Evaluation of Aerospace Composite Materials; Woodhead Publishing Print Book, Elsevier: Sawston, UK, 2016. [Google Scholar]
- Meola, C.; Boccardi, S.; Carlomagno, G.M. Infrared thermography to inline monitoring of glass/epoxy under impact and quasi-static bending. Appl. Sci. 2018, 8, 301. [Google Scholar] [CrossRef]
© 2019 by the authors. Licensee MDPI, Basel, Switzerland. This article is an open access article distributed under the terms and conditions of the Creative Commons Attribution (CC BY) license (http://creativecommons.org/licenses/by/4.0/).