Proceeding Paper

Quark Number Susceptibilities and Equation of State in QCD at Finite μB †

Department of Theoretical Physics, Tata Institute of Fundamental Research, Homi Bhabha Road, Mumbai 400005, India
*
Author to whom correspondence should be addressed.
Presented at the 7th International Conference on New Frontiers in Physics (ICNFP 2018), Crete, Greece, 4–12 July 2018.
Proceedings 2019, 13(1), 5; https://doi.org/10.3390/proceedings2019013005
Published: 3 June 2019
(This article belongs to the Proceedings of The 7th International Conference on New Frontiers in Physics)

Abstract

:
One of the main goals of the cold baryonic matter (CBM) experiment at FAIR is to explore the phases of strongly interacting matter at finite temperature and baryon chemical potential μ B . The equation of state of quantum chromodynamics (QCD) at μ B > 0 is an essential input for the CBM experiment, as well as for the beam energy scan in the Relativistic Heavy Ion Collider(RHIC) experiment. Unfortunately, it is highly nontrivial to calculate the equation of state directly from QCD: numerical Monte Carlo studies on lattice are not useful at finite μ B . Using the method of Taylor expansion in chemical potential, we estimate the equation of state, namely the baryon number density and its contribution to the pressure, for two-flavor QCD at moderate μ B . We also study the quark number susceptibilities. We examine the technicalities associated with summing the Taylor series, and explore a Pade resummation. An examination of the Taylor series can be used to get an estimate of the location of the critical point in μ B , T plane.

1. Introduction

The phases of strongly interacting matter at different temperatures, T, and baryon chemical potential μ B are of intense theoretical and experimental interest at present. Many contributions emphasized how the understanding of the physics of compact stars depend on quantum chromodynamics (QCD) at finite μ B . In the experimental side, the beam energy scan (BES) runs in Relativistic Heavy Ion Collider (RHIC) experiment are trying to explore the phase diagram of QCD, and this is also the focus of the upcoming cold baryonic matter (CBM) experiment in the FAIR facility. Just as the equation of state of QCD at large T played a crucial role in the understanding of the ultrarelativistic heavy ion collisions in RHIC and LHC, the equation of state at μ B > 0 is important for the understanding of the BES and CBM experiment results. Unfortunately, it is highly nontrivial to reliably extract the equation of state for μ B > 0 . For nonzero T but μ B = 0 , numerical Monte Carlo simulations of lattice-discretized QCD allow one to calculate the equation of state nonperturbatively. But such techniques cannot be used directly at finite μ B .
One way to get nonperturbative information about QCD at moderate μ B is through a Taylor expansion in μ B [1,2]; e.g., the pressure,
P ( μ B , T ) = P ( 0 , T ) + n χ B n ( T ) μ B n n ! .
The coefficients χ B n , called nonlinear baryon number susceptibilities, can be calculated nonperturbatively on lattice. We will present calculations of χ B n and discuss their interpretation. Then we will use the series Equation (1) to calculate the equation of state at moderate values of μ B . An examination of the first few terms of the series indicate that the series expansion breaks down at some value of μ B . We will argue that this is due to the presence of a critical point in the phase diagram in μ B , T plane, and provide an estimate of its location.
One can, of course, introduce a chemical potential for each flavor of quark; e.g., for two flavors
P ( μ B , T ) P ( 0 , T ) = n u n d χ n u n d μ u n u n u ! μ d n d n d ! , χ n u n d = n u + n d P μ u n u μ d n d .
(For three flavors one will also have μ s ). The generalized quark number susceptibilities (QNS) can be easily connected to susceptibilities of conserved charges; e.g., μ u and μ d can be traded for the baryon number and isospin chemical potentials,
μ B = 3 2 ( μ u + μ d ) , μ I = μ u μ d .
The primary quantities we will calculate will be the QNS χ n u n d . We will use them to construct the χ B n using Equation (3), and then use Equation (2) to calculate thermodynamic quantities at finite μ B .
The baryon number susceptibilities have been used to get information about the freezeout curve. In Section 3.3 we critically examine some issues that arise in such a comparison.
In Section 2 we briefly mention some technical details of our calculation. Our main results will be presented in Section 3. A summmary of the results, and their discussion, will be presented in Section 4. This report is based on Ref. [3], where more details can be found.

2. Calculational Details

We present results for a study of QCD with two degenerate flavors of staggered quarks. We use lattices with lattice spacing a = 1 / 8 T , with quarks a little heavier than physical quarks (pion mass ∼ 230 MeV). We also compare our results with those from coarser lattices but similar fermion discretization [4]. Using the R algorithm [5] configurations were generated in the range 0.9 T c –2 T c . In this note T c is used to indicate the crossover temperature at μ B = 0, as determined by the peak of the susceptibility of the Polyakov loop. The temperature scale is set using the Wilson flow observable w 0 [6] and two-loop running of the coupling.
Since our quark flavors are degenerate, χ l m = χ m l . Calculation of the higher order susceptibilities involve traces of products of matrices [7]. The traces were calculated with gaussian random vectors. A careful study of stability of the traces was done. It was found that in the region around T c , the higher order susceptibilities stabilize only with a large number, ∼1000, of random vectors. We used 2000 vectors at these temperatures. At high temperatures results stabilize faster and 800 vectors were used. Our error estimates are based on a complete bootstrap analysis over the configurations and random vector sources.

3. Results

3.1. Quark Number Susceptibilities

The primary observables we measured were the generalized QNS. The baryon number susceptibilities can then be constructed from them. The QNS are interesting observables in their own right, as they reveal properties of the high temperature medium [8].
In Figure 1 we show some of the susceptibilities. In the left panel the diagonal susceptibilities χ n 0 T n 4 of order n = 2 , 4 , 6 are shown. The second order susceptibility χ 20 was the most interesting, and dominated the equation of state calculations at small μ B . It was small in the hadronic phase and rose rapidly after T c , behaving as an approximate order parameter. The approach to the Stefan–Boltzmann value was gradual. Note that this observable is known to have a strong lattice spacing dependence for the free theory; this can be traced to a particular operator which contributes only to this QNS [9]. It is therefore expected that at high temperatures, as one approaches the free theory, there will be considerable lattice spacing dependence for this observable. Taking the ratio of the lattice results with the corresponding lattice free theory results cancelled most of the cutoff effects, bringing the lattice results close to the perturbative results [10,11] by 2 T c [12]. On the other hand, in the region around T c , the results from a = 1 / 8 T and a = 1 / 6 T lattices agree quite well, indicating that cutoff effects were small in this regime [3]. The diagonal fourth order QNS χ 40 approached perturbative results already by 1.5 T c [12]. Close to T c it deviated from perturbation theory and showed a peak structure. The parameter χ 60 had a peak structure just below T c , and became negligible just above T c . These behaviors were consistent with trends seen in coarser lattices [13,14].
In the right panel of Figure 1 we show the results of the off-diagonal susceptibility χ u d . In the hadronic phase, this observable was expected to be negative, as the u quark will be most often found together with a d ¯ in π + . On the other hand, at high temperatures in the QGP phase, one would expect the u and d quark to be practically independent of each other, leading to χ u d 0 [15,16]. As the figure reveals, χ u d came very close to 0 by 1.1 T c . In this figure we also show the results on a coarser lattice [4]. The cutoff dependence was small; the N t = 8 results can therefore be expected to be close to the continuum results. This observable thus will severely constrain any model of quasibound structures in QGP at such temperatures.
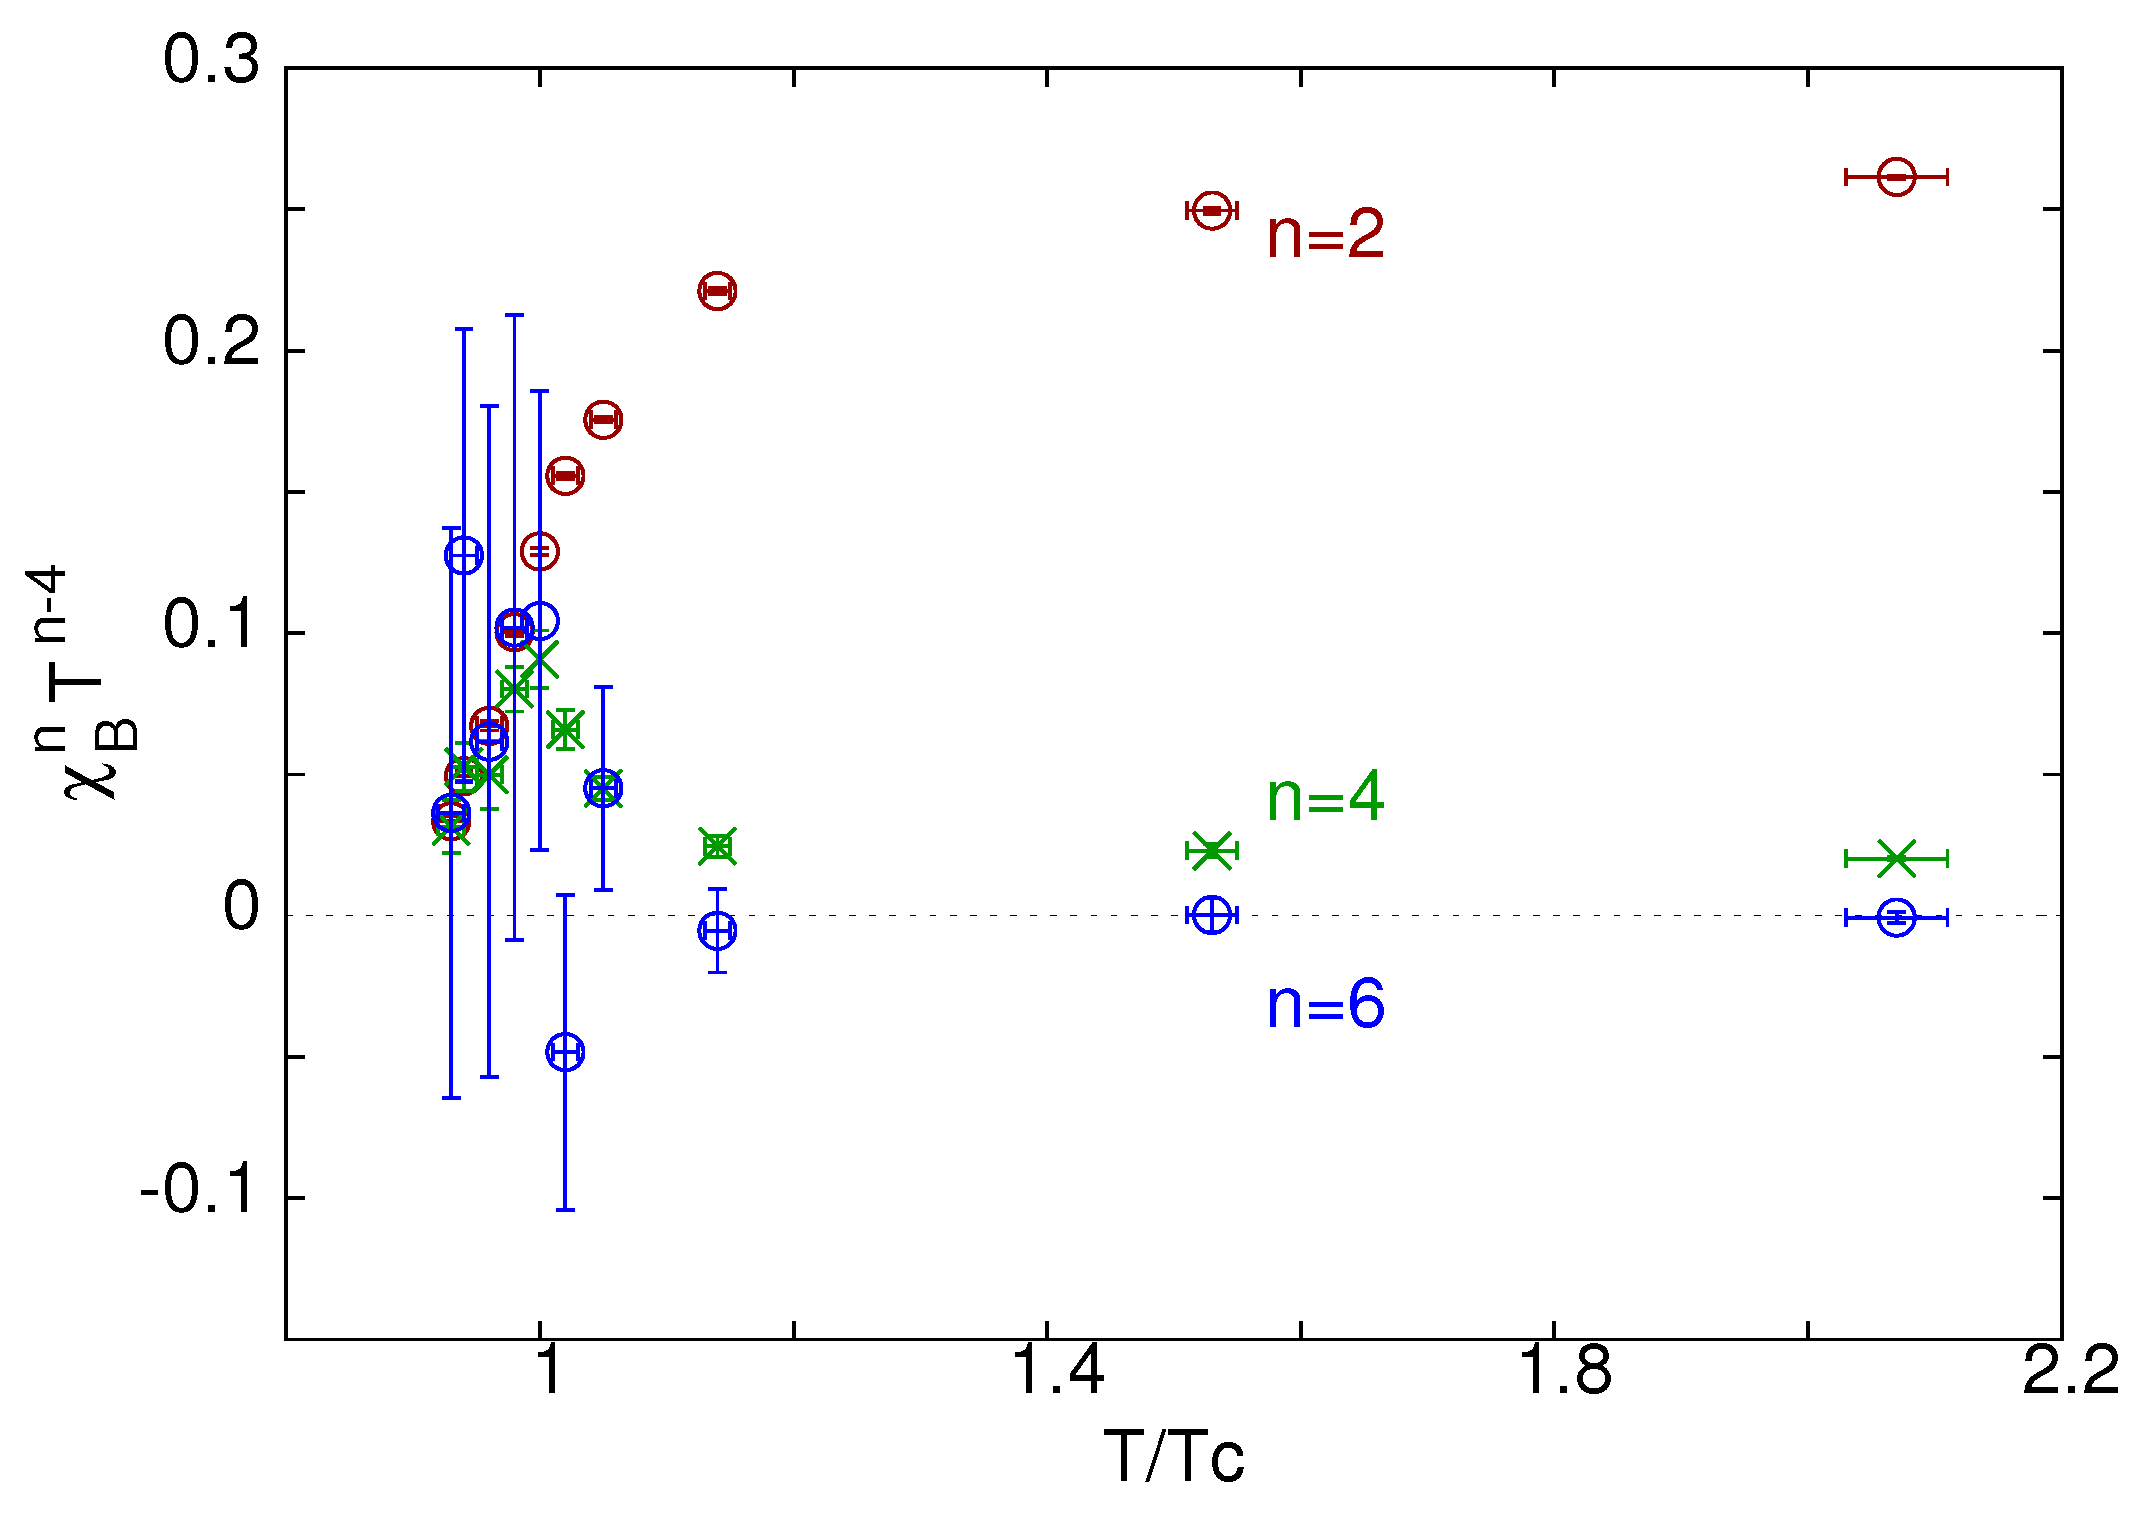
Using the QNS, we can construct the baryon number susceptibilities χ B n using Equation (3). The results of the first three BNS are shown in Figure 2. These are also the coefficients appearing in the series expansion in Equation (1). For analysis of physics at finite μ B , we convert Equation (1) into a series for χ B 2 ( μ B ) . This series has a pole at the critical point ( μ B E , T E ),
χ B 2 ( μ B , T E ) T E 2 | μ B 2 ( μ B E ) 2 | ψ + regularterms .
A Taylor series expansion of χ B 2 in μ B will therefore break down at μ B E . An examination of the coefficients of the series gave us an estimate of the critical point in QCD phase diagram, μ B E T E = 1.85 ± 0.04 , T E T C = 0.94 ± 0.01 . These estimates, on lattices with a = 1 / 8 T , agreed well with earlier estimates on coarser lattices with a = 1 / 6 T .
One cannot, of course, unequivocally predict a critical point from a finite series, less so a series with four noisy terms. The value above is our estimate of the location of the critical point, assuming the apparent finite radius of convergence is due to a critical region. Further confidence in this interpretation is gained from the fact that the series at T E has all coefficients positive, as is required for the singularity to be on the real axis, for all bootstrap samples. We also found that the estimate of radius of convergence from ratios of different terms agree with each other [3]. Of course, the error quoted above, which is the statistical error obtained from a complete bootstrap analysis, is dominated by the ratio of the two smallest coefficients, i.e., χ B 4 / χ B 2 . We note that a recent determination of this ratio with improved quarks [17] is consistent with our ratio at 2 σ level, though not at 1 σ level.
Recent lattice studies, based on imaginary chemical potential, have reported on the lack of evidence for a critical point at small μ B [18,19,20], while also commenting on the difficulty of putting a rigorous bound from these methods [20]. Note that the phase diagram in imaginary chemical potential is complicated; a more detailed investigation of the relation between computations in real and imaginary μ B will be very important.

3.2. Equation of State at Finite μ B

Using the baryon number susceptibilities, the equation of state can be obtained using Equation (1) and other series derived from it. Note, however, that the series will have very bad convergence properties as one approaches the critical region. On summing a finite (≤4) number of terms in the series, one may therefore get a completely wrong result.
One way to improve the convergence of the series and to increase the sensitivity to the critical point is to use Pade resummation. In particular, a Pade resummation of
m 1 = log χ B 2 / T 2 μ B / T ψ | μ B 2 ( μ B E ) 2 | + regular ,
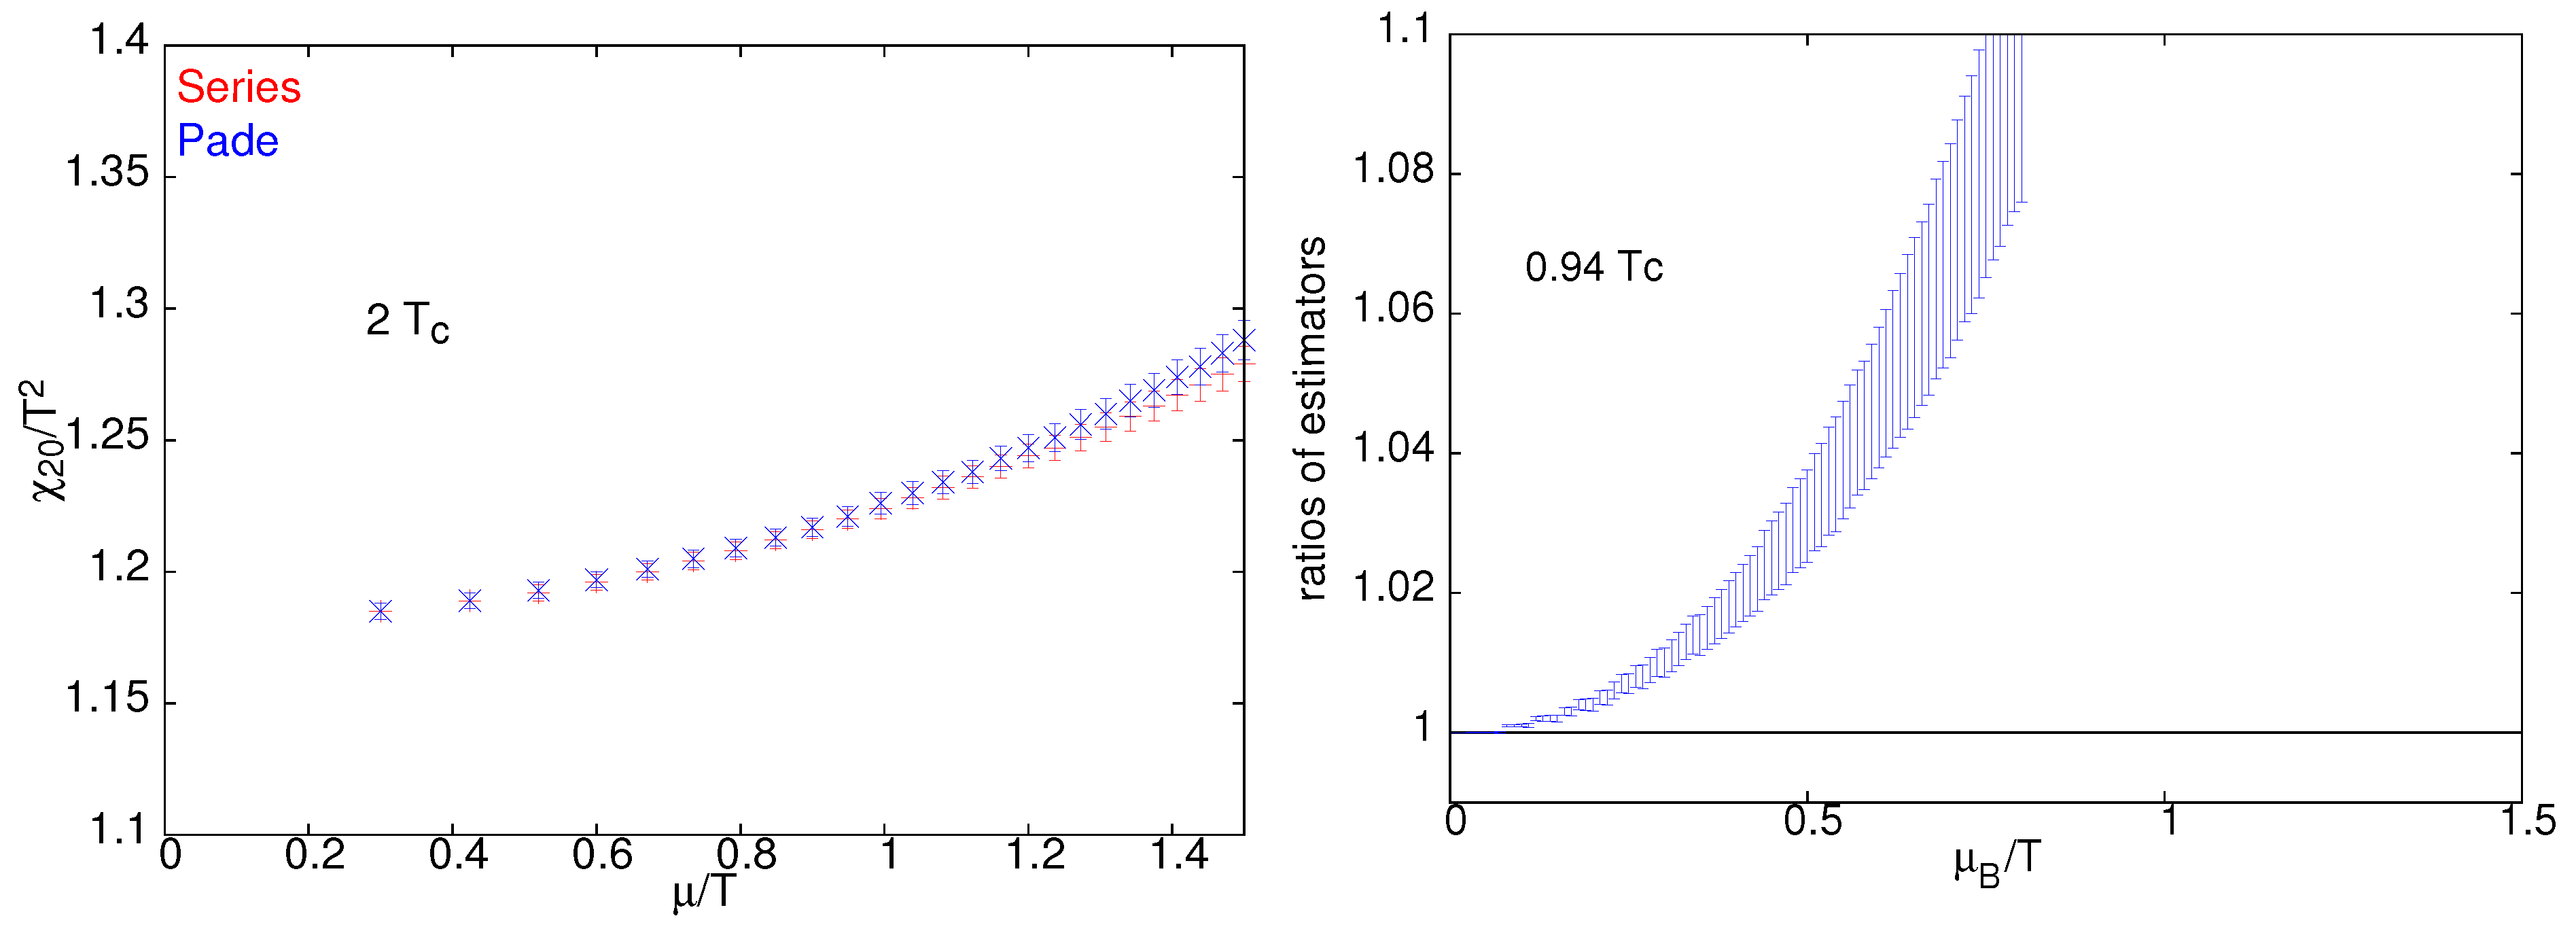
is expected to have much better convergence property in the critical region, where the singular term is dominant [9]. To get predictions at finite μ B , we therefore do a Pade resummation of the series for m 1 , and get other observables by integrating Equation (5). In order to study the convergence property of the resummation, we show in Figure 3a comparison between results of the second order susceptibility obtained by resummation and by a direct summation of the series. At temperatures far from T E , the two estimators are seen to agree. On the other hand, for the series at T = T E we see that the two differ considerably even at μ B μ B E . We expect the Pade resummed series to capture better the property of the series, and use it to extract observables at finite μ B . Reassuringly, the μ B E from the Pade analysis agrees with that obtained from the radius of convergence analysis. See [3] for further details of the Pade analysis.
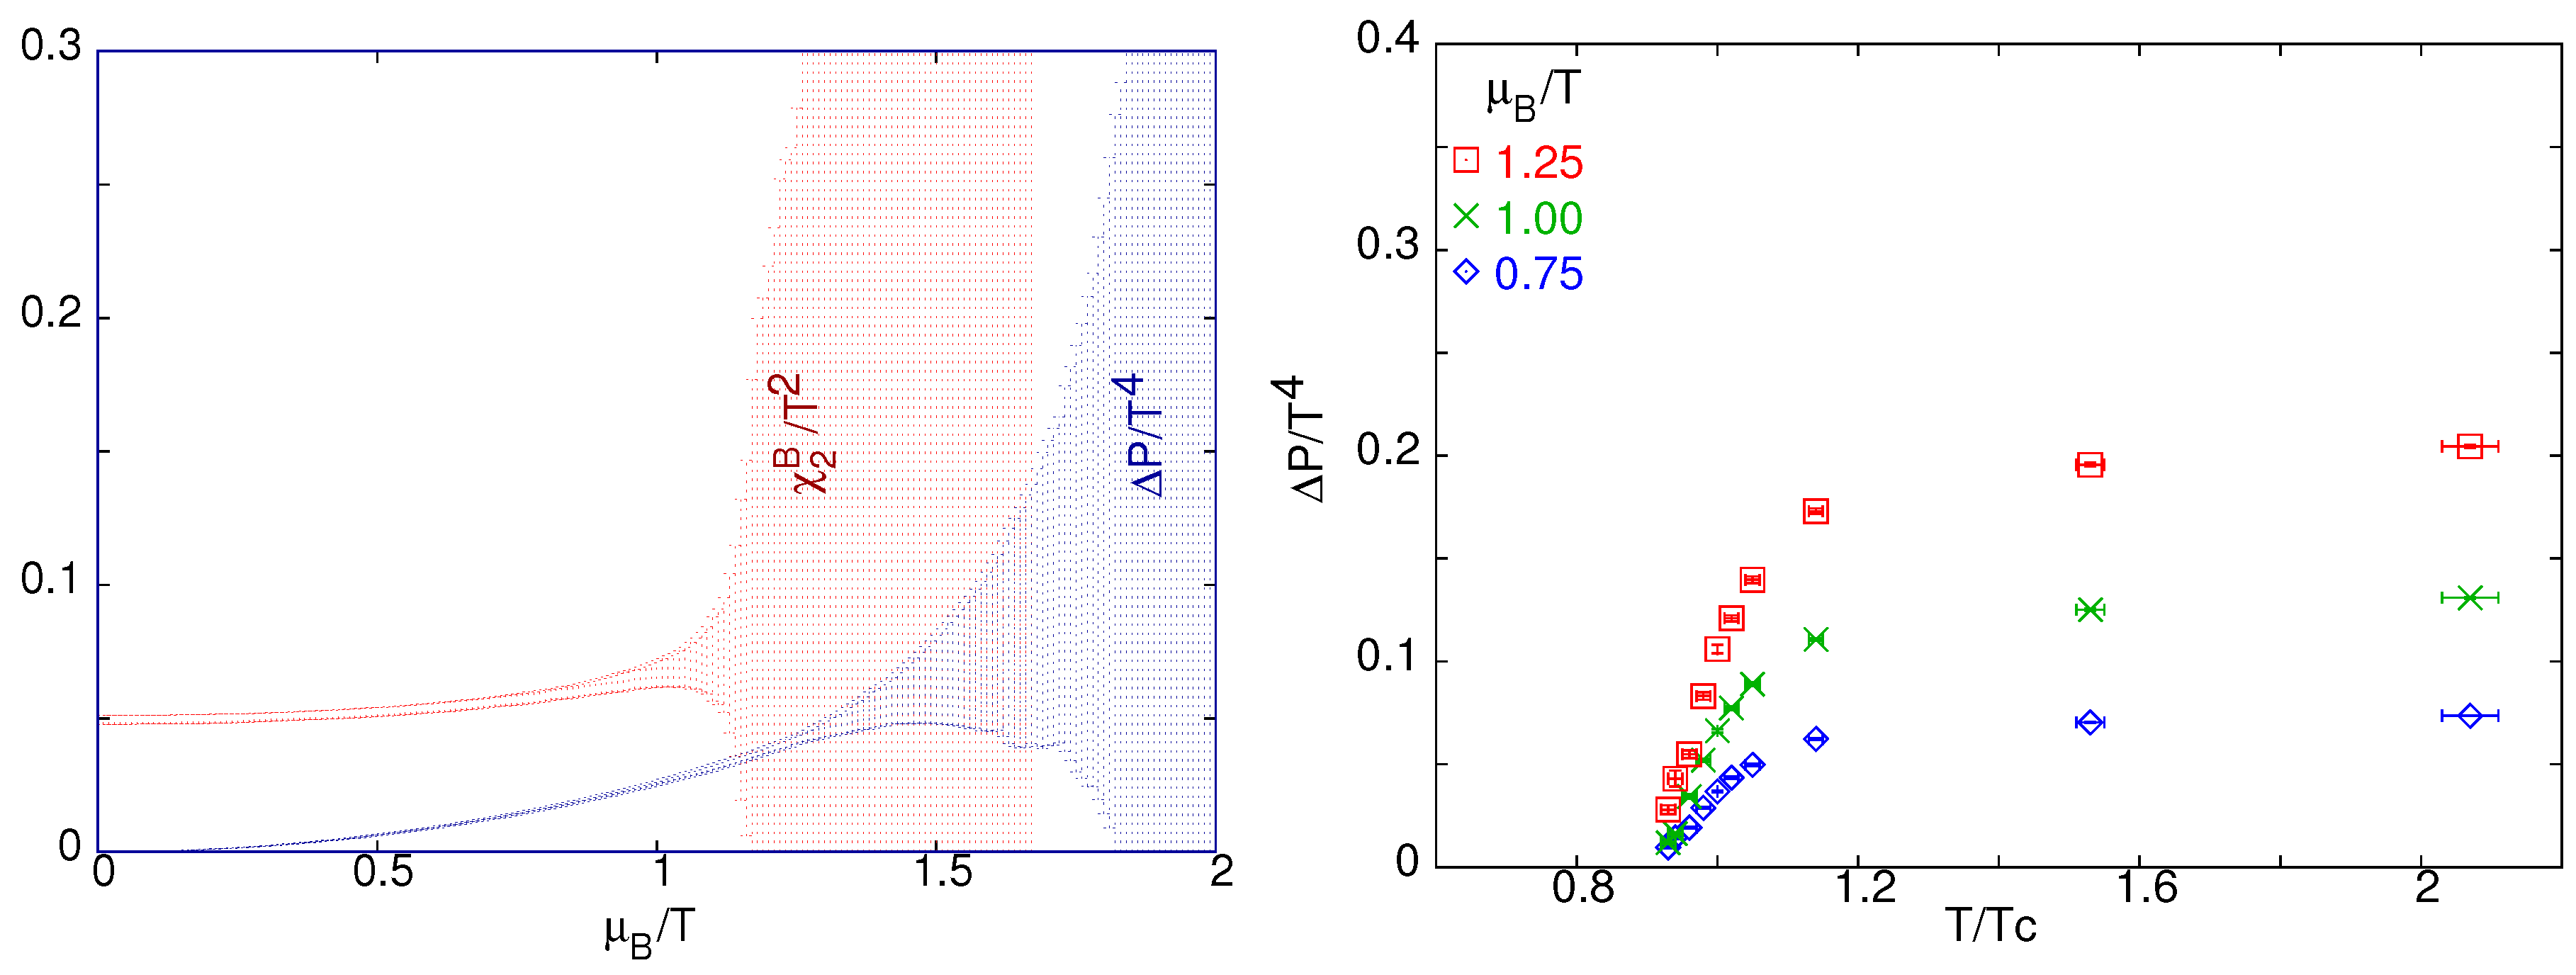
In the left panel of Figure 4 we show the results for χ B 2 and Δ P ( μ B , T ) = P ( μ B , T ) P ( 0 , T ) at the temperature T E = 0.94 T c , obtained from successive integrations of the Pade approximant for m 1 , Equation (5). The error bars are from a complete Bootstrap analysis for each observable. Note that the property of the impending breakdown of the series is captured in the Pade-resummed series by an explosion of the bootstrap error. This property has been noted before in Ref. [9], and is related to critical slowing down. This critical behavior gets successively milder as we do more integrations. In the figure we have shown the series for T = 0.94 T c , where the critical slowing down effect is strongest since it is our estimated temperature for critical endpoint. However, the effect of the critical point is seen also in other nearby temperatures.
The figure shows that χ B 2 is only mildly dependent on μ B for μ B < T . As a result, the number density n is approximately linear and Δ P is approximately quadratic in μ B . The right panel of Figure 4 shows our estimate of Δ P ( μ B , T ) at various values of μ B < 1.25T , i.e., away from the critical region. A more complete set of results, including those for the number density and the isotropic bulk compressibility, can be found in ref. [3]. As with χ 20 , we expect that the cutoff effect is strong at high temperatures, and small in the temperature regime T T c . This can indeed be verified by comparing with the two flavor results from coarse lattices in [9].

3.3. Fluctuations and Freezeout

It has been suggested to use lattice observables like m 1 to determine the freezeout surface [21,22]. The parameter m 1 , and other ratios of susceptibilities, are independent of the fireball volume. They can be connected to event-by-event fluctuations of net proton number if certain assumptions about the fireball are valid. The most important of these are: (a) the susceptibilities measured on the lattice are for the net baryon number. On the other hand, the fluctuations measured in the experiments are of the net proton number. For the comparison with the lattice susceptibilities to be meaningful, one needs to assume that the fluctuations of net baryon number are closely mimicked by those of the net proton number. (b) The fluctuation due to other, non-thermal sources need to be small compared to the thermal fluctuations. The underlying assumption that the system is always in thermal equilibrium up to T c is probably too optimistic, especially as one comes closer to the critical region. We do not have anything specific to add about this, however. In what follows, we will assume that susceptibility ratios like m 1 mirror the experimental net proton fluctuations, and comment on some other systematics.
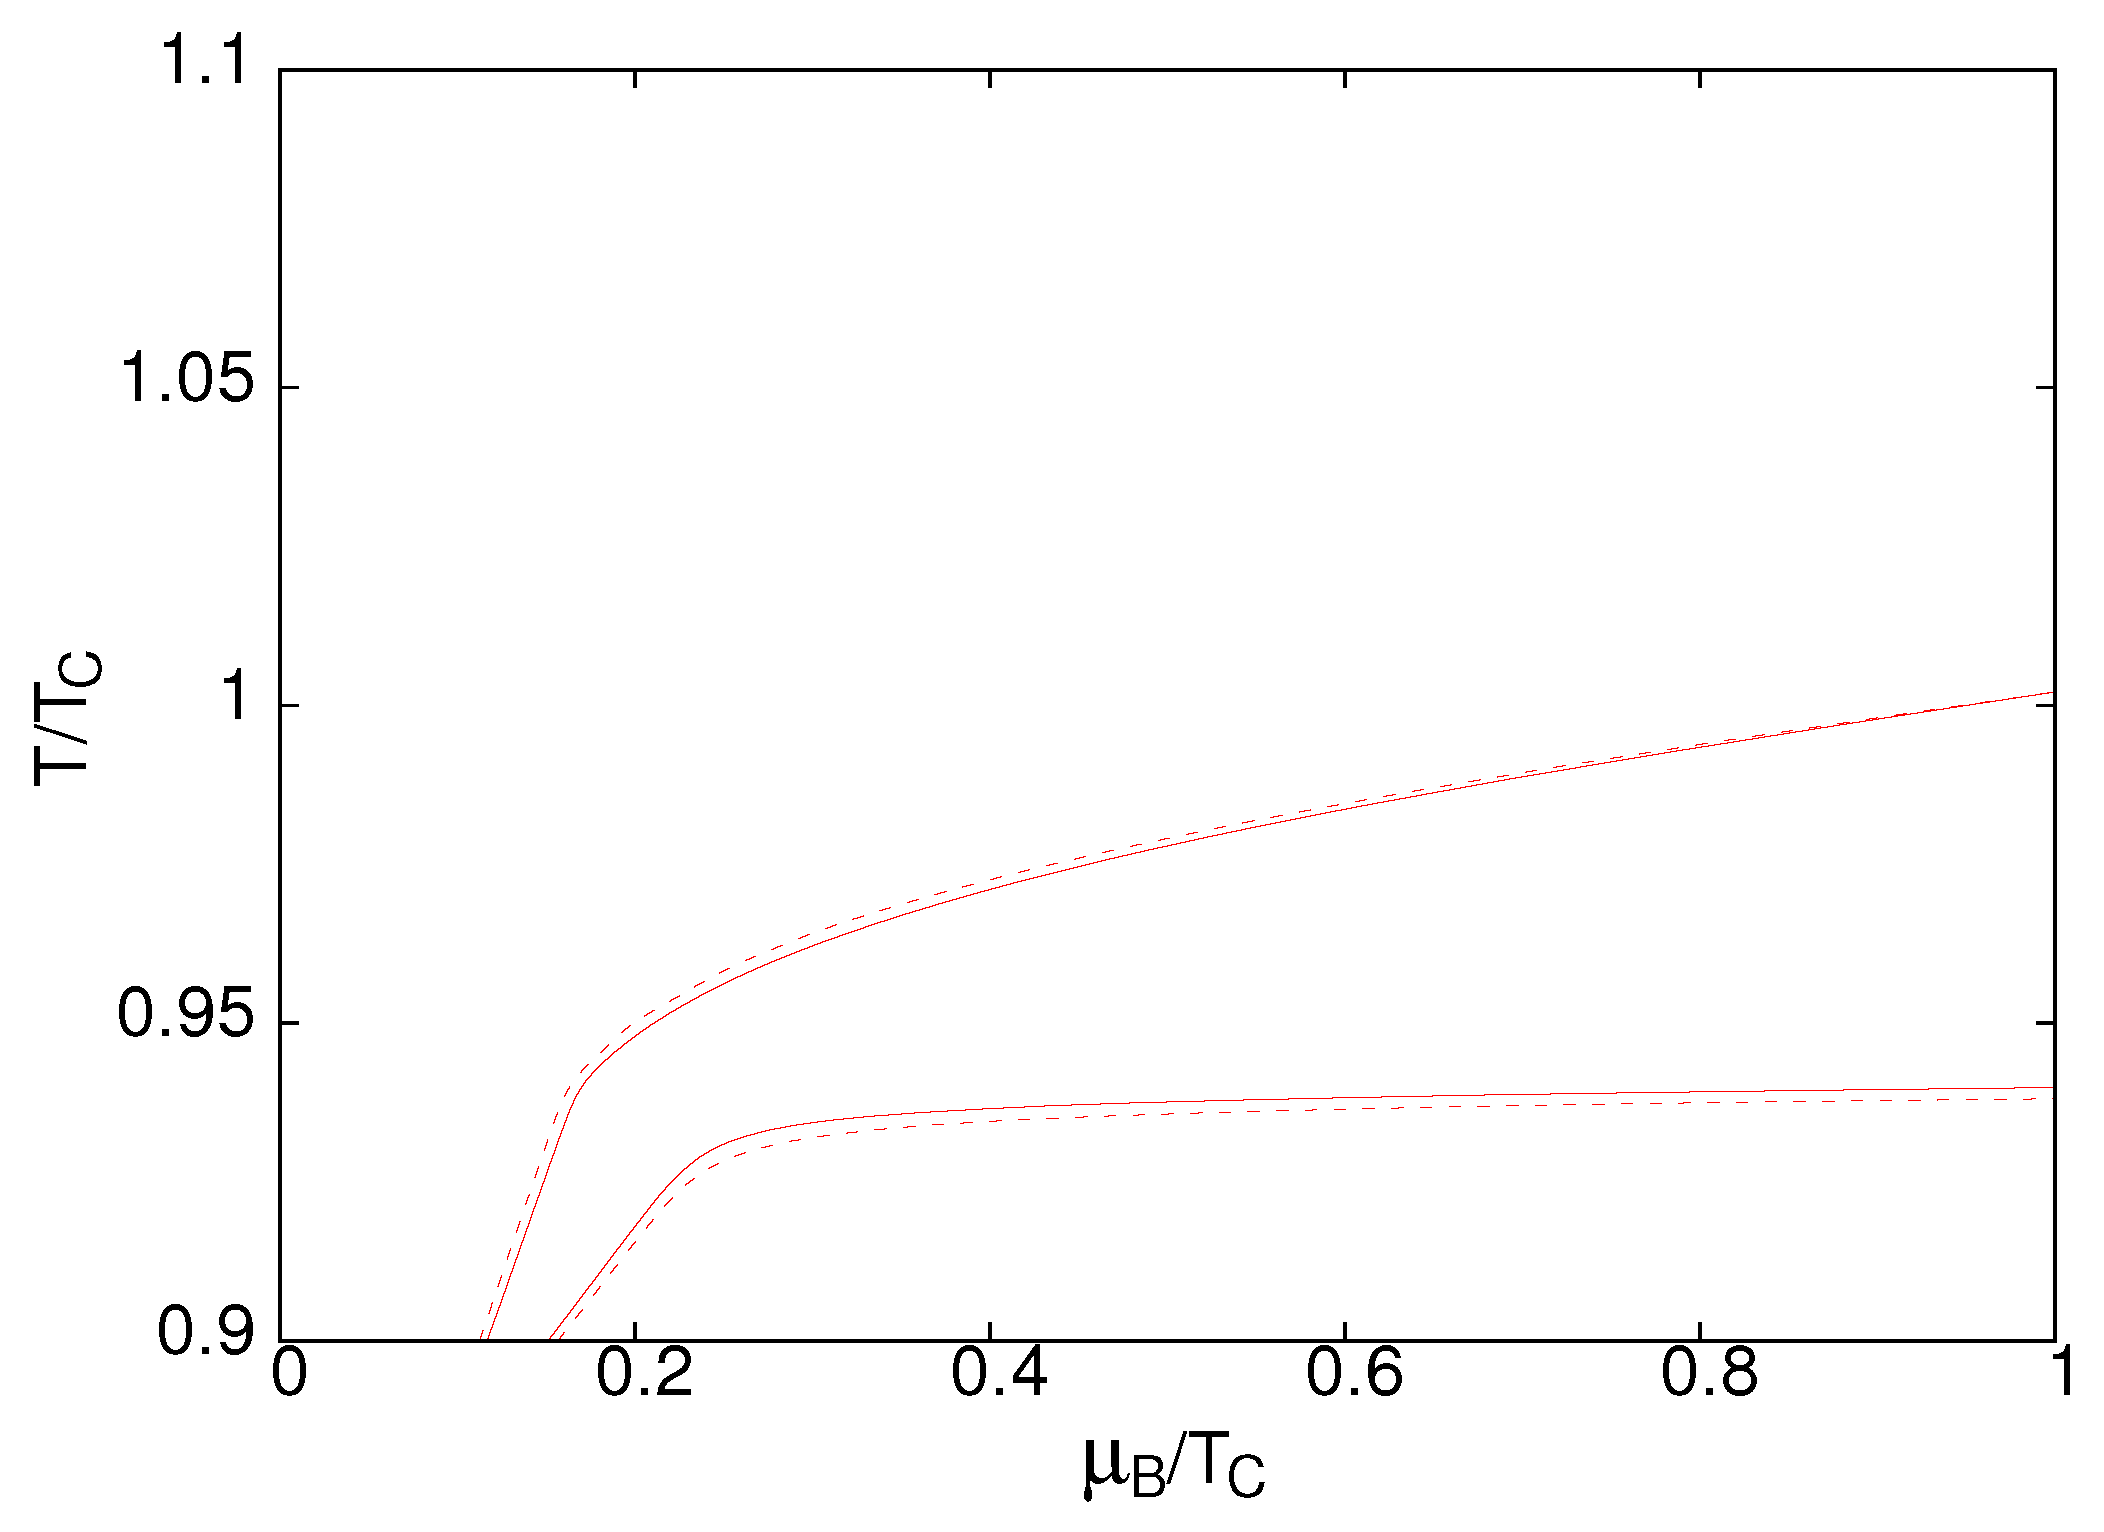
Quantities like m 1 are functions of μ B , T ; a comparison of such quantities with the corresponding experimental observables is expected to give us the parameters of the freezeout surface. While this idea has been used to map the freezeout surface from lattice [23,24], we would like to stress here the role of the critical region and associated breakdown of the series, Equation (1), in such an extraction. As we have discussed in the previous section, one needs to use a Pade resummation to get a reliable result and also to get an idea of the asociated uncertainty in the series sum. To illustrate this, we have compared our results for m 1 with the corresponding fluctuation observable in the 200 GeV Au–Au runs from the STAR experiment. Taking the net proton fluctuation ratio 0.150 ± 0.004 ± 0.06 [25] (the first error is statistical and the second, systematic), we have done a bootstrap analysis, taking the 68% confidence limit of the experimental observable and comparing with the lattice m 1 . A single observable, m 1 , cannot be used to specify both μ B and T for the freezeout surface. In the literature, the freezeout temperature has sometimes been taken to be the chiral transition temperature, to extract μ B . Instead of making such an assumption, we instead chart out a band in the μ B , T plane using m 1 . This is shown in Figure 5.
The first observation from Figure 5 is that after a small value of μ B , the temperature dependence of the allowed band is very mild. Figure 5 indicates that the freezeout temperature is likely to be below T c . The Pade-resummed series allows us to come to this conclusion based on m 1 alone. A finite series sum would, instead, have allowed temperatures above T c [3]. The second observation from Figure 5 is that m 1 is not a good observable to constrain μ B of the freezeout surface. In the literature, making the assumption that the freezeout temperature is the same as the chiral transition temperature, m 1 has been used to extract the freezeout μ B for the STAR 200 GeV run. Our results show that if one uses the Pade resummed series, m 1 does not constrain μ B very well in this temperature regime.
In the literature, the standard way to estimate the freezeout curve is by fitting the particle yields to a statistical hadronization model [26,27]. While such a fit has its own set of systematics, our discussion above suggests that the method based on lattice susceptibilities, while theoretically attractive, is at the moment not precise enough to replace it.

4. Summary and Discussion

In this report we presented results for quark number susceptibilities for two-flavor QCD on lattices with cutoff a = 1 / 8 T , in the temperature range 0.9–2 T c . Here T c is the crossover temperature at μ B = 0 as determined by the peak of the Polyakov loop susceptibility. The major part of the cutoff dependence of susceptibilities at high temperatures can be understood from the cutoff dependence of the free theory. Interestingly, a strong coupling calculation of χ 20 based on the gauge-gravity duality gives a result very different from QCD [28]. Close to T c the QNS show sharp temperature dependence, which are very different from the behavior expected from perturbation theory. The off-diagonal susceptibility χ 11 shows behavior consistent with weakly interacting quark-gluon plasma for T > 1.1 T c ; this observable can be used to put strict constraints on models of quasibound structures in the QGP. A more detailed discussion of these and higher order QNS can be found in [3].
The QNS can be used to construct the n-th order baryon number susceptibilities χ B n . An examination of the first four (n = 2, 4, 6, 8) BNS indicate a finite radius of convergence of the series expansion of χ B 2 ( μ B ) . To estimate the location of a possible critical point in the phase diagram, we require that the series coefficients are all positive. Based on a bootstrap analysis, our estimate of the location of the critical point is μ B E T E = 1.85± 0.04, T E T c = 0.94± 0.01 . The positivity of the series coefficients on all bootstrap samples give us confidence in our analysis. Note that the error is statistical and comes from an analysis of various ratios of χ B n , but it is dominated by the lowest ratio, i.e., χ B 4 / χ B 2 . The estimate of μ B E is consistent with the earlier estimate μ B E T E = 1.8± 0.1 from coarser lattice [4].
To get thermodynamic observables at finite μ B , we use the series in μ B . But since the series has finite radius of convergence, for μ B close to this value a simple summing of the series will give inaccurate results. Following [9] we do a Pade resummation of the series for m 1 (Section 3.2). We find that the Pole in the Pade approximant matches the radius of convergence extracted from the series of χ B 2 . Successive integration of the series for m 1 then gives us the thermodynamic observables. We present results for pressure and number density in Section 3.2. We note that the finite radius of convergence of the series manifests itself in an explosion of the errorbar beyond a μ B T . With more integrations, e.g., for pressure, the singularity becomes softer, resulting in the statistical error being in control to higher values of μ B .
We also discuss connecting the susceptibility ratios like m 1 to ratios of event-by-event fluctuation observables, and attempt to estimate the freezeout curve using the experimental results for the latter. The issues in connecting susceptibility ratios to fluctuation ratios have been discussed in the literature. We investigate here a different issue: using the Pade resummed m 1 rather than the series resummed one, we find that the constraint put by m 1 on the freezeout μ B is very weak. On the positive side, we find that the Pade resummed m 1 indicates by itself that the freezeout temperature is likely to be below T c . Note that while this result is physically completely plausible to the point of sounding trivial, it has not always come naturally in freezeout determinations from statistical hadronization.

Author Contributions

The idea of Taylor expansion in μ B is originally due to R.V.G. and S.G. All three authors have contributed in the work described here. This draft is the written version of S.D.’s talk in ICNFP 2018.

Funding

This research is a part of the ILGTI project funded by the Tata Institute of Fundamental Research (TIFR), Mumbai, an autonomous institution under Department of Atomic Energy, Govt. of India.

Acknowledgments

The computations described here were carried out using ILGTI, TIFR computing resources. We thank Ajay Salve and Kapil Ghadiali for technical support.

Conflicts of Interest

The authors declare no conflict of interest.

Abbreviations

The following abbreviations are used in this manuscript:
QCDquantum chromodynamics
QGPQuark-gluon plasma
BNSBaryon number susceptibilities
QNSQuark number susceptibilities
FAIRFacility for antiproton and Ion Research
RHICRelativistic Heavy Ion Collider
CBMCold Baryonic Matter
BESBeam energy scan
LHCLarge Hadron Collider

References

  1. Gavai, R.V.; Gupta, S.; Ray, R. Taylor expansions in chemical potential. Prog. Theor. Phys. Suppl. 2004, 153, 270. [Google Scholar] [CrossRef]
  2. Ejiri, S.; Allton, C.R.; Hands, S.J.; Kaczmarek, O.; Karsch, F.; Laermann, E.; Schmidt, C. Study of QCD thermodynamics at finite density by Taylor expansion. Prog. Theor. Phys. Suppl. 2004, 153, 118. [Google Scholar] [CrossRef]
  3. Datta, S.; Gavai, R.V.; Gupta, S. Quark number susceptibilities and equation of state at finite chemical potential in staggered QCD with Nt = 8. Phys. Rev. D 2017, 95, 054512. [Google Scholar]
  4. Gavai, R.V.; Gupta, S. QCD at finite chemical potential with six time slices. Phys. Rev. D 2008, 78, 114503. [Google Scholar]
  5. Gottlieb, S.A.; Liu, W.; Toussaint, D.; Renken, R.L.; Sugar, R.L. Hybrid Molecular Dynamics Algorithms for the Numerical Simulation of Quantum Chromodynamics. Phys. Rev. D 1987, 35, 2531. [Google Scholar]
  6. Borsányi, S.; Durr, S.; Fodor, Z.; Hoelbling, C.; Katz, S.D.; Krieg, S.; Kurth, T.; Lellouch, L.; Lippert, T.; Mcneile, C.; et al. High-precision scale setting in lattice QCD. JHEP 2012, 1209, 010. [Google Scholar]
  7. Gavai, R.V.; Gupta, S. The Critical end point of QCD. Phys. Rev. D 2005, 71, 114014. [Google Scholar]
  8. Gottlieb, S.A.; Liu, W.; Toussaint, D.; Renken, R.L.; Sugar, R.L. The Quark Number Susceptibility of High Temperature QCD. Phys. Rev. Lett. 1987, 59, 2247. [Google Scholar]
  9. Gupta, S.; Karthik, N.; Majumdar, P. On criticality and the equation of state of QCD at finite chemical potential. Phys. Rev. D 2014, 90, 034001. [Google Scholar]
  10. Andersen, J.O.; Mogliacci, S.; Su, N.; Vuorinen, A. Quark number susceptibilities from resummed perturbation theory. Phys. Rev. D 2013, 87, 074003. [Google Scholar]
  11. Haque, N.; Mustafa, M.G.; Strickland, M. Quark Number Susceptibilities from Two-Loop Hard Thermal Loop Perturbation Theory. JHEP 2013, 1307, 184. [Google Scholar]
  12. Datta, S.; Gavai, R.V.; Gupta, S. QCD at finite chemical potential with Nt = 8. PoS Lattice 2014, 2013, 202. [Google Scholar]
  13. Gavai, R.V.; Gupta, S. Simple patterns for non-linear susceptibilities near Tc. Phys. Rev. D 2005, 72, 054006. [Google Scholar]
  14. Ejiri, S.; Karsch, F.; Redlich, K. Hadronic fluctuations at the QCD phase transition. Phys. Lett. B 2006, 633, 275. [Google Scholar]
  15. Koch, V.; Majumdar, A.; Randrup, J. Baryon-strangeness correlations: A Diagnostic of strongly interacting matter. Phys. Rev. Lett. 2005, 95, 182301. [Google Scholar]
  16. Gavai, R.; Gupta, S. Fluctuations, strangeness and quasi-quarks in heavy-ion collisions from lattice QCD. Phys. Rev. D 2006, 73, 014004. [Google Scholar]
  17. Bazavov, A.; Ding, H.T.; Hegde, P.; Kaczmarek, O.; Karsch, F.; Laermann, E.; Maezawa, Y.; Mukherjee, S.; Ohno, H.; Petreczky, P.; et al. The QCD equation of state to 𝒪 ( μ B 6 ) from Lattice QCD. Phys. Rev. D 2017, 95, 054504. [Google Scholar]
  18. DÉlia, M.; Gagliardi, G.; Sanfilippo, F. Higher order quark number fluctuations via imaginary chemical potentials in Nf = 2 + 1 QCD. Phys. Rev. D 2017, 95, 094503. [Google Scholar]
  19. Vovchenko, V.; Steinheimer, J.; Philipsen, O.; Stoecker, H. Cluster Expansion Model for QCD Baryon Number Fluctuations: No Phase Transition at μB/T < π. Phys. Rev. D 2018, 97, 114030. [Google Scholar]
  20. Fodor, Z.; Giordano, M.; Guenther, J.N.; Kapas, K.; Katz, S.D.; Pasztor, A.; Portillo, I.; Ratti, C.; Sexty, D.; Szabo, K.K. Searching for a CEP signal with lattice QCD simulations. arXiv 2018, arXiv:1807.09862. [Google Scholar]
  21. Gavai, R.; Gupta, S. Lattice QCD predictions for shapes of event distributions along the freezeout curve in heavy-ion collisions. Phys. Lett. B 2011, 696, 459. [Google Scholar]
  22. Gupta, S. Finding the critical end point of QCD: Lattice and experiment. PoS CPOD 2009, 2009, 025. [Google Scholar]
  23. Bazavov, A.; Ding, H.T.; Hegde, P.; Kaczmarek, O.; Karsch, F.; Laermann, E.; Mukherjee, S.; Petreczky, P.; Schmidt, C.; Smith, D.; et al. Freeze-out Conditions in Heavy Ion Collisions from QCD Thermodynamics. Phys. Rev. Lett. 2012, 109, 192302. [Google Scholar]
  24. Borsányi, S.; Fodor, Z.; Katz, S.D.; Krieg, S.; Ratti, C.; Szabo, K.K. Freeze-out parameters: Lattice meets experiment. Phys. Rev. Lett. 2013, 111, 062005. [Google Scholar]
  25. Adamczyk, L.; Adkins, J.K.; Agakishiev, G.; Aggarwal, M.M.; Ahammed, Z.; Alekseev, I.; Alford, J.; Anson, C.D.; Aparin, A.; Arkhipkin, D.; et al. Energy Dependence of Moments of Net-proton Multiplicity Distributions at RHIC. Phys. Rev. Lett. 2014, 112, 032302. [Google Scholar]
  26. Petran, M.; Letessier, J.; Petráček, V.; Rafelski, J. Hadron production and quark-gluon plasma hadronization in Pb-Pb collisions at s NN = 2.76 TeV. Phys. Rev. C 2013, 88, 034907. [Google Scholar] [CrossRef]
  27. Becattini, F.; Steinheimer, J.; Stock, R.; Bleicher, M. Hadronization conditions in relativistic nuclear collisions and the QCD pseudo-critical line. Phys. Lett. B 2017, 764, 241. [Google Scholar]
  28. Petreczky, P. Lattice QCD at non-zero temperature. J. Phys. G 2012, 39, 093002. [Google Scholar] [CrossRef]
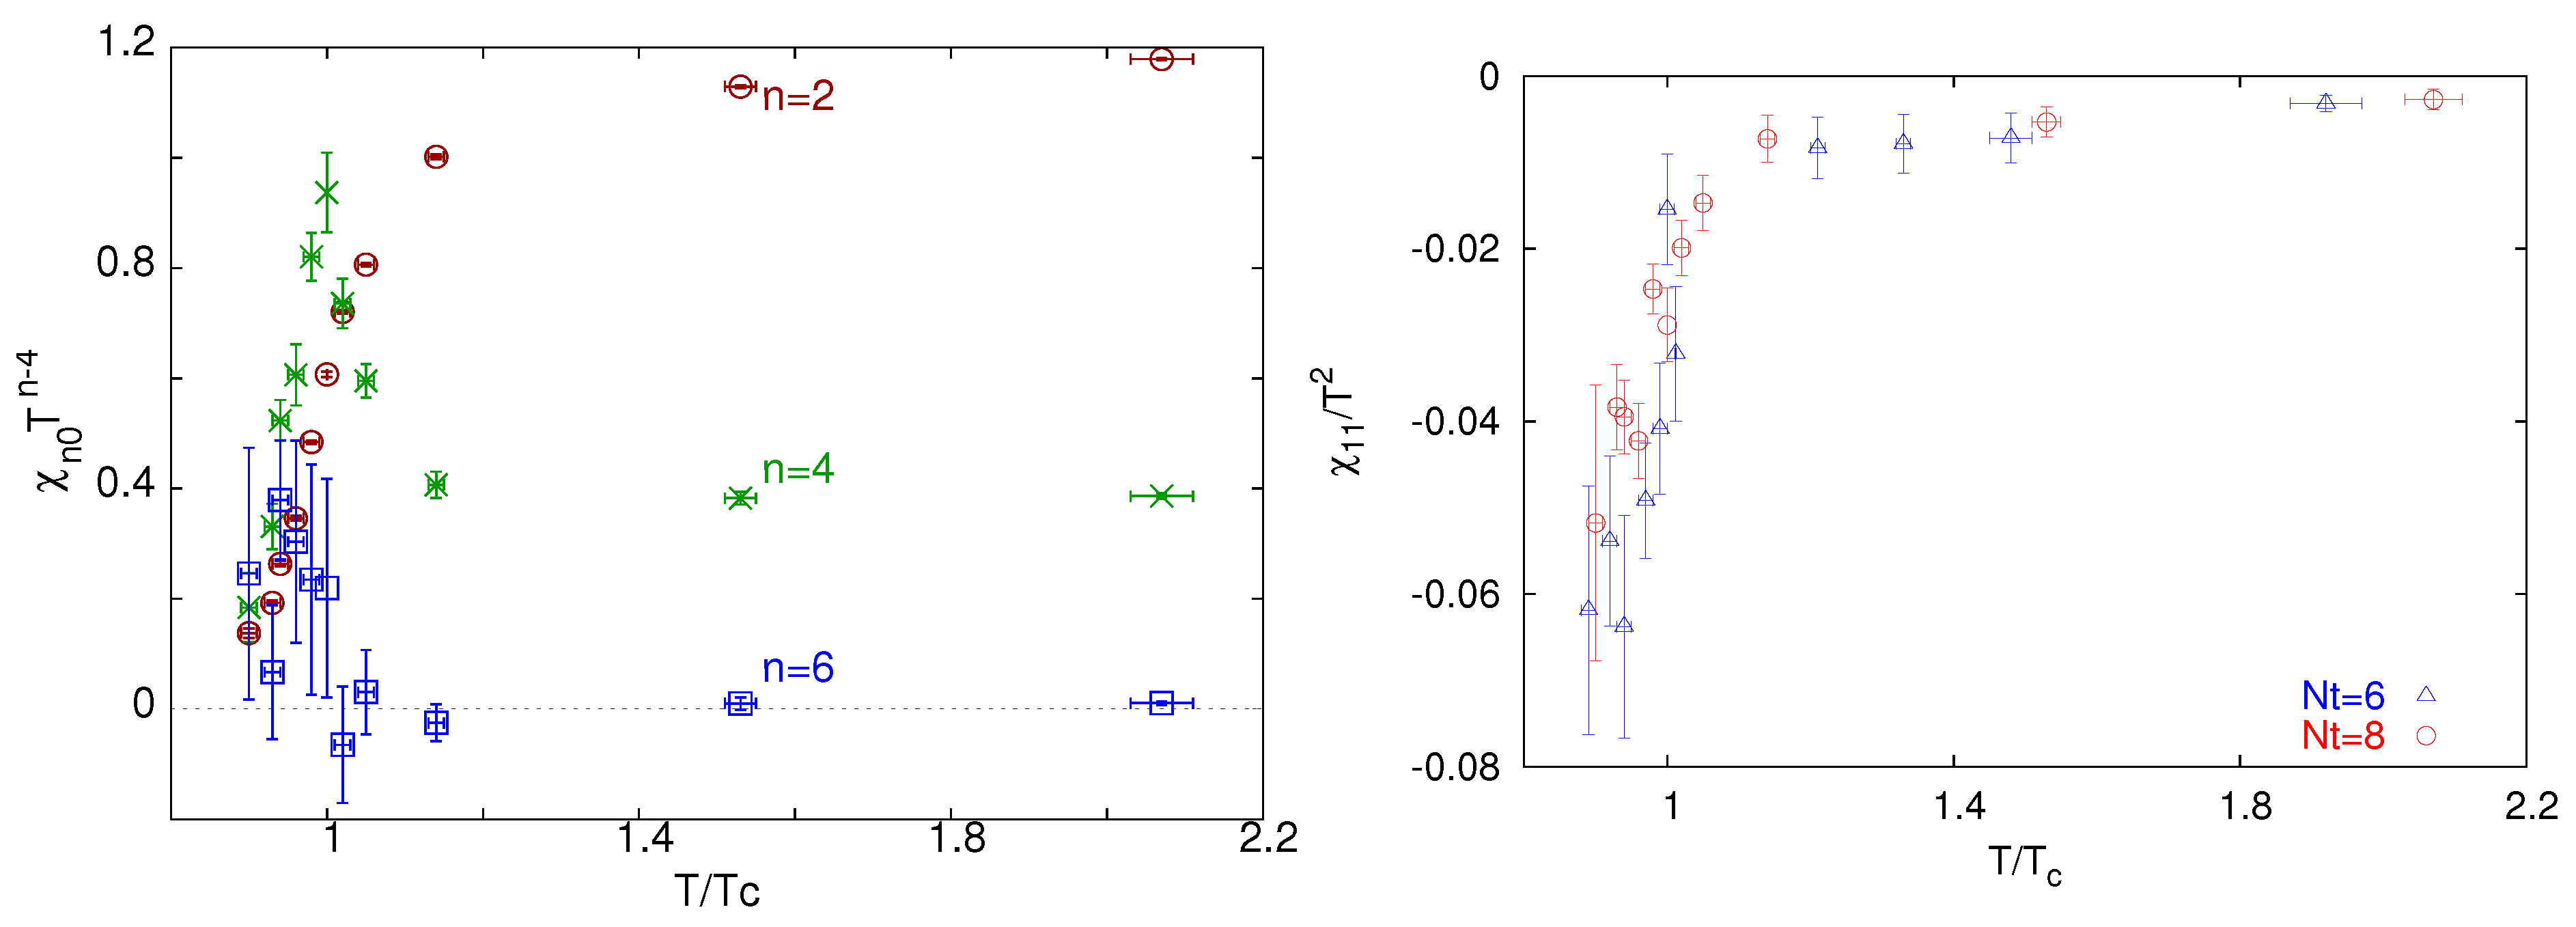
Figure 1. (left) The diagonal susceptibilities of order two, four and six, χ 20 / T 2 , χ 40 and T 2 χ 60 , in the temperature range 0.9–2 T c . (right) χ 11 in units of T 2 , on lattices with a = 1 / 8 T . Also shown for comparison are results for lattices with a = 1 / 6 T .
Proceedings 13 00005 g001
Figure 2. The baryon number susceptibilities of different order in the temperature range 0.9–2 T c .
Proceedings 13 00005 g002
Figure 3. (left) Comparison of the Pade estimator for χ 20 with the series-summed one at 2 T c . (right) Ratio of the Pade estimator of χ B 2 with the series summed one, at T E = 0.94 T c .
Proceedings 13 00005 g003
Figure 4. (left) The Pade-resummed results for pressure and χ B 2 as function of μ B , at T = T E . (right) Δ P ( μ B , T ) as function of temperature, at various μ B .
Proceedings 13 00005 g004
Figure 5. Estimation of the freezeout curve, from Pade estimation of m 1 .
Proceedings 13 00005 g005