1. Introduction
Ultrasound-excited thermography is a well-known nondestructive active thermography inspection technique that detects defects by measuring the frictional heat generated by ultrasonic vibrations within an object. Because of this defect detection principle, this technique is effective in detecting closed defects (cracks, weak bonds, etc.) [
1,
2,
3] that are difficult to detect with other nondestructive inspection techniques. However, a significant challenge with this method is the occurrence of heat patterns caused by standing waves within the inspected object. These heat patterns could hinder the detection of defects or be misinterpreted as defects. Therefore, developing a method to suppress unwanted heat patterns (standing-wave heat patterns) is crucial for improving the detection accuracy of ultrasound-excited thermography.
A previous study [
4] showed that, during ultrasound-excited thermography inspections of plate objects, the excited waves causing standing waves were dominated by the A
0 mode Lamb waves. In this study, the causative waves were reinvestigated using ultrasound at two different frequencies. Subsequently, based on the findings, a method to suppress standing waves was explored, including an attempt to cancel them out by superimposing two waves with opposite phases.
2. Investigation of Waves Causing Standing Waves
Waves causing standing waves during ultrasound-excited thermography were investigated via experiments on poly (methyl methacrylate) (PMMA) specimens. The specimens were strip-shaped, with a width of 10 mm and length of 150 mm. The thicknesses (t) of the specimens were 2, 3, 5, 10, and 15 mm. Ultrasound was applied using an ultrasonic horn positioned centrally along the length of the specimen, and surface temperatures during ultrasonic vibration were observed using an infrared camera (A315, FLIR Systems AB, Danderyd, Sweden). The experiments used two ultrasonic horns (HW-D250H-28 and HW-D250H-40, Nippon Avionics Co., Ltd., Tokyo, Japan) with excitation frequencies (f) of 28 and 40 kHz, respectively.
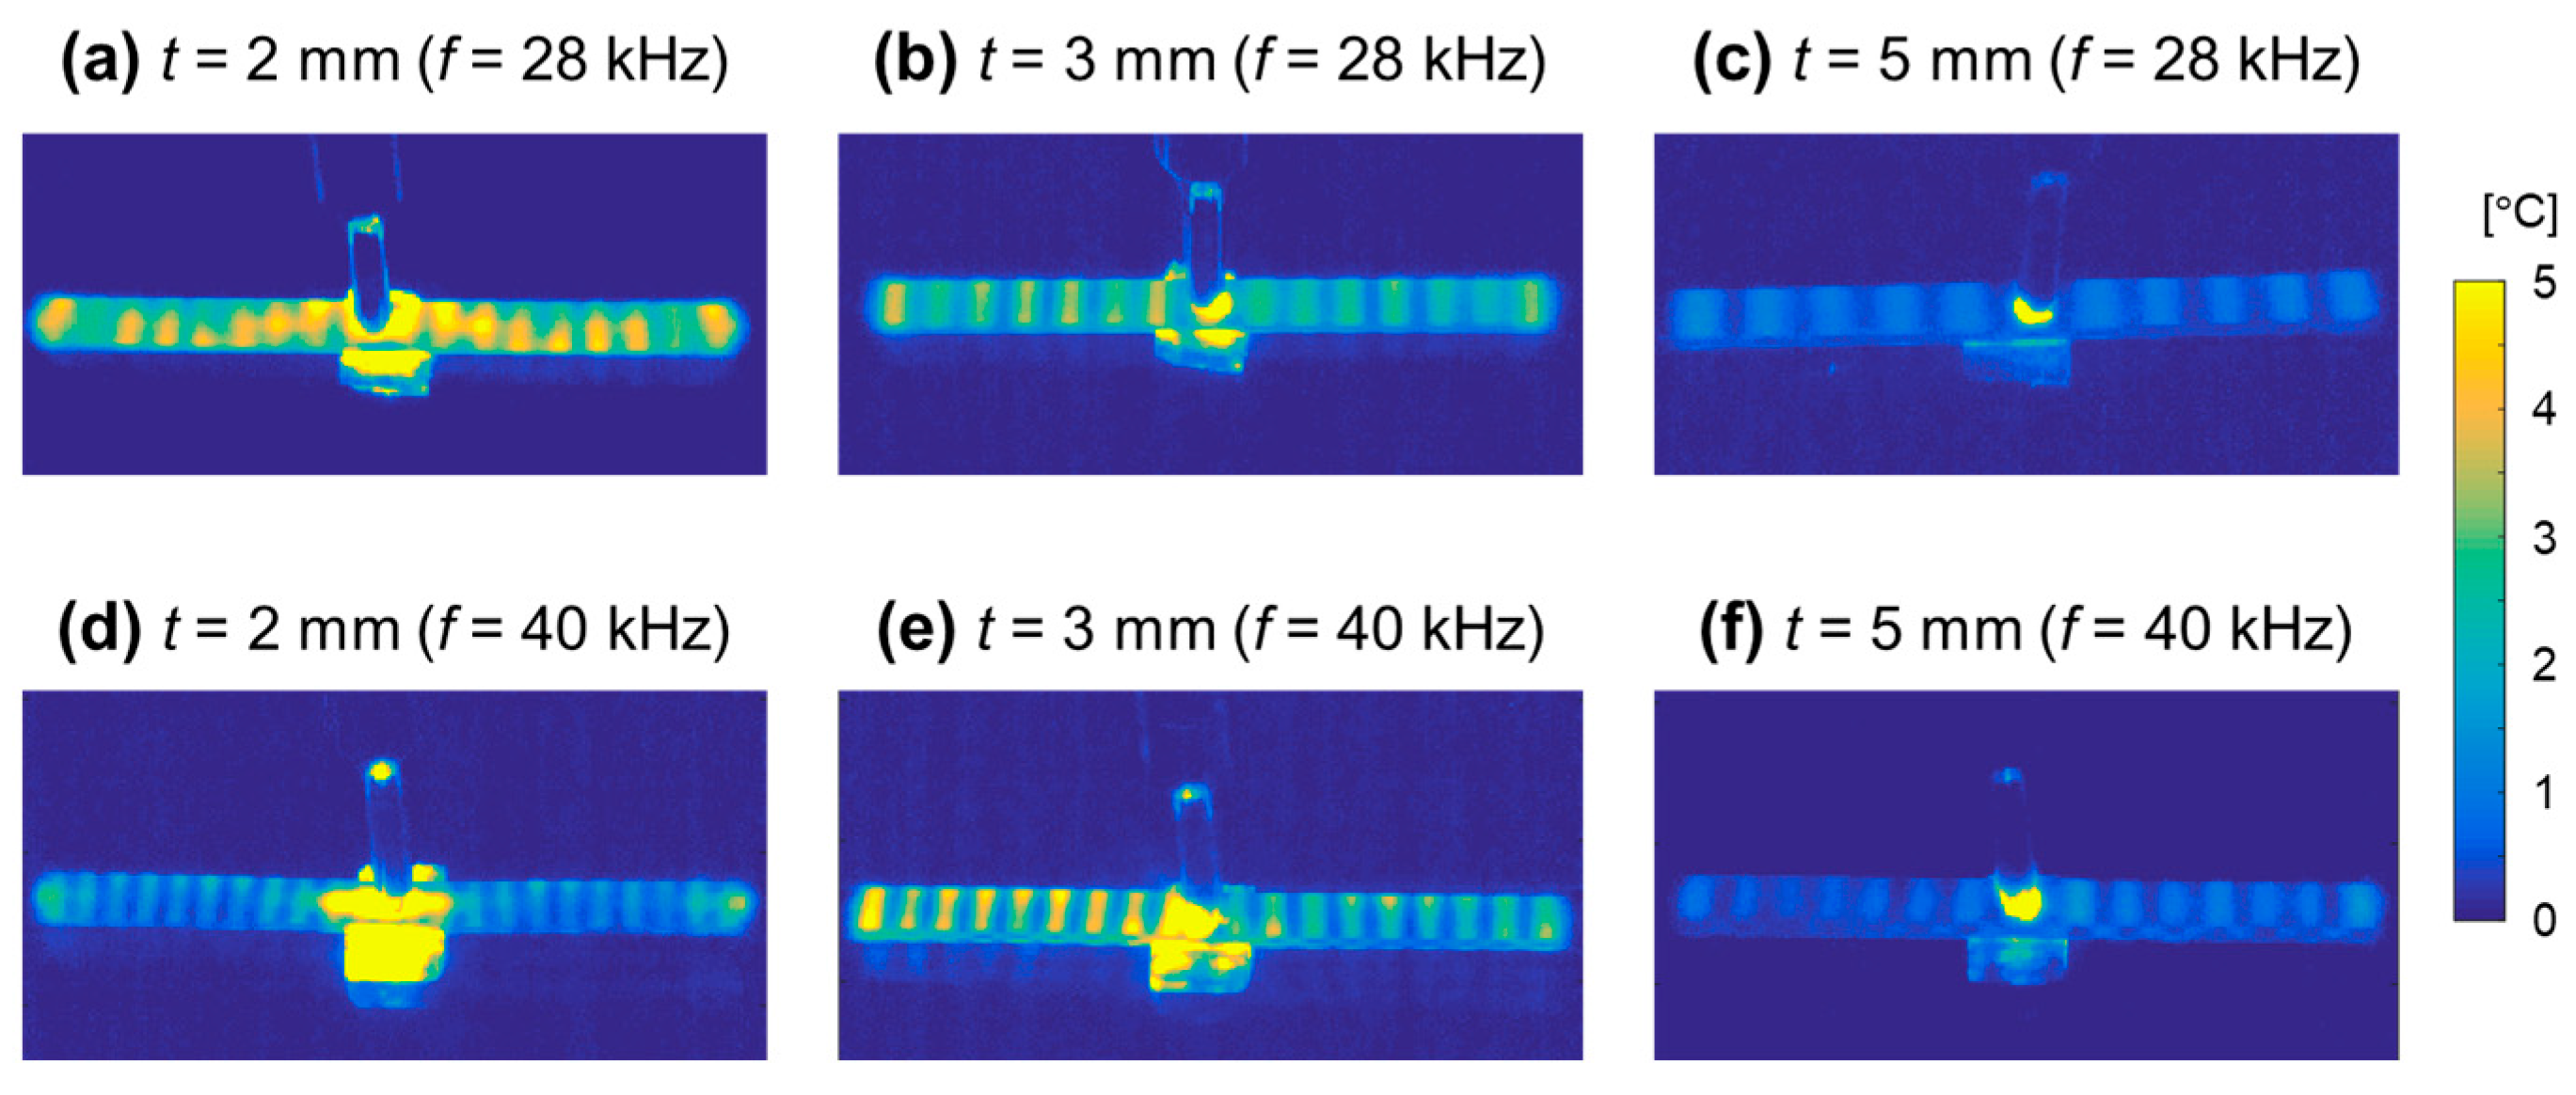
Figure 1 shows the thermal images observed experimentally for
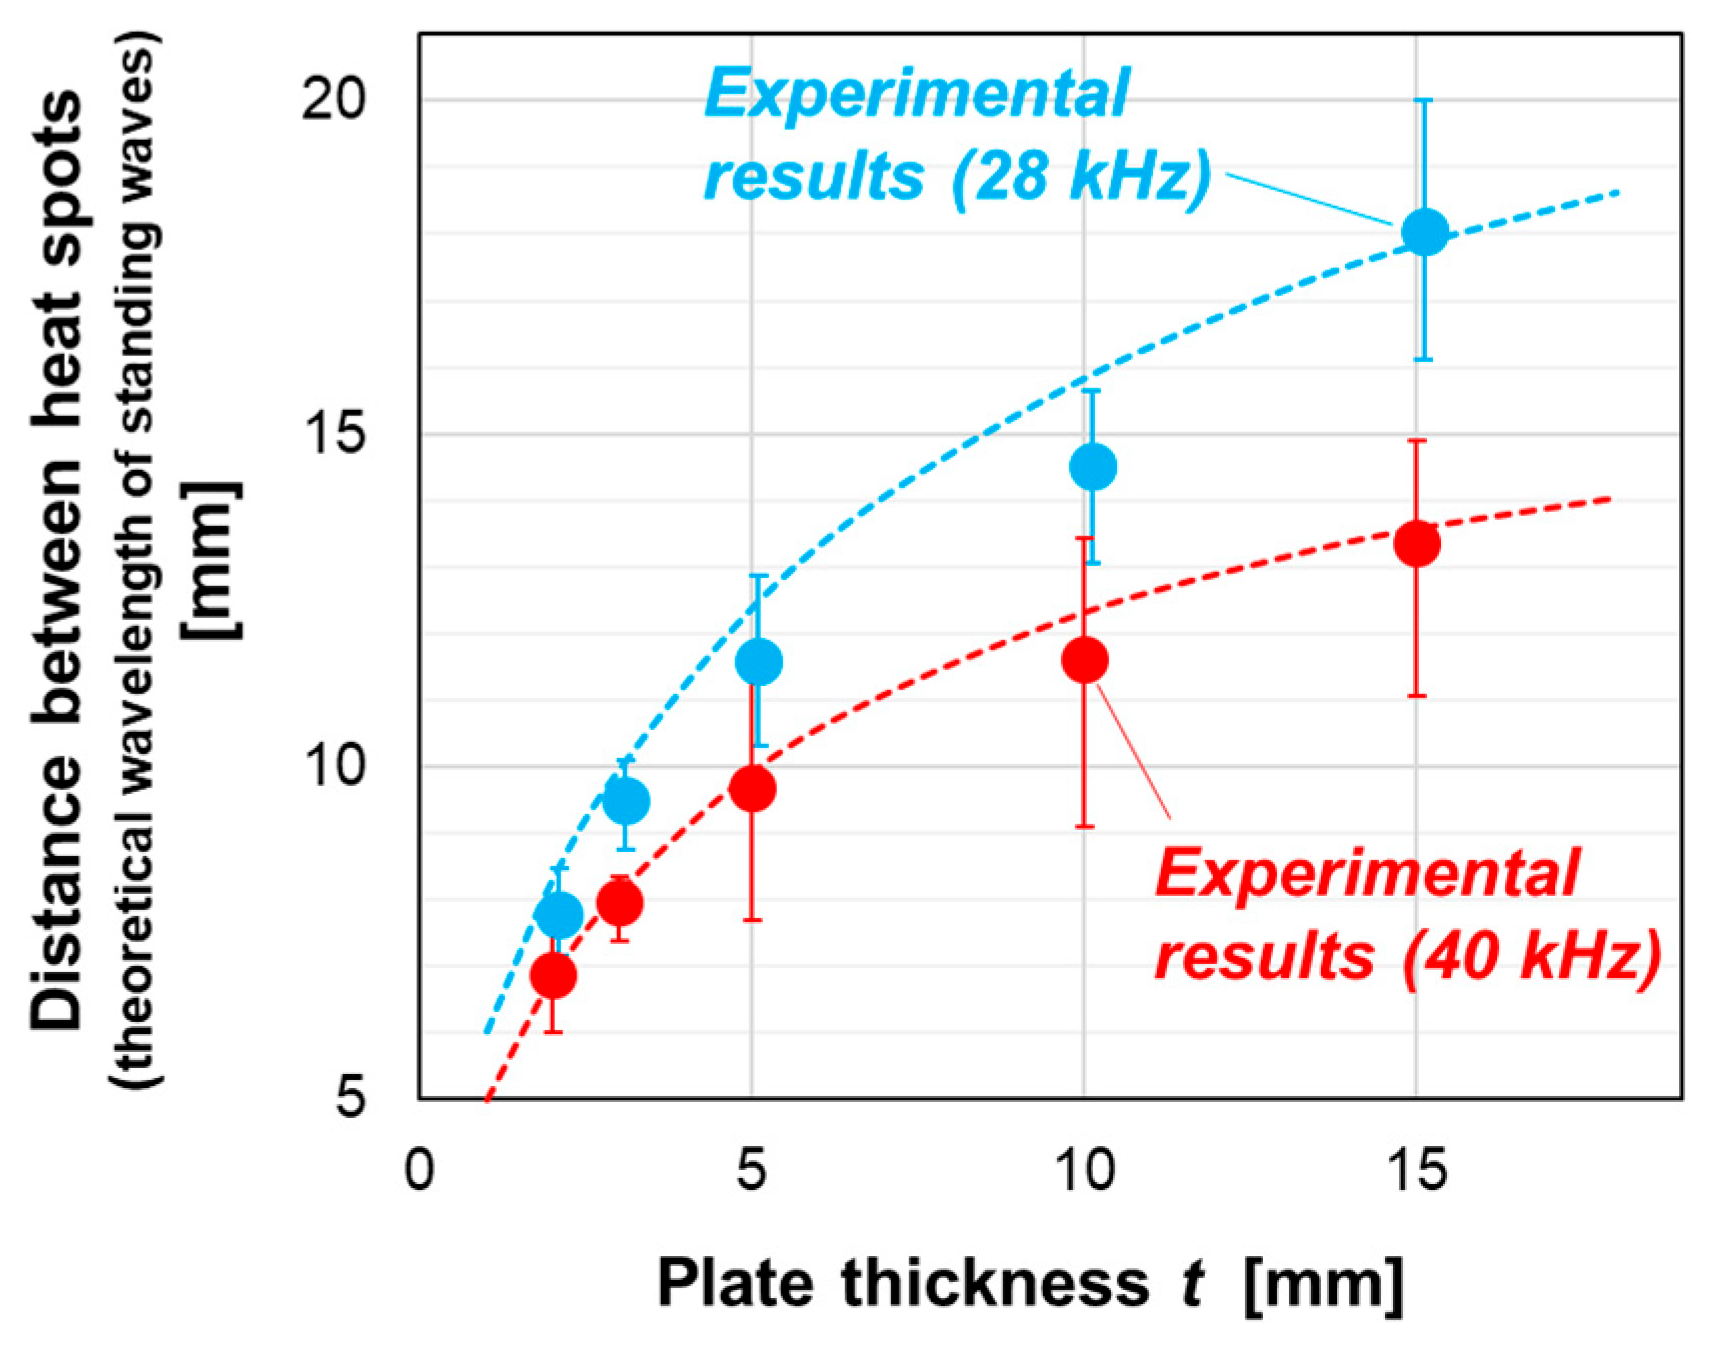
t = 2, 3, and 5 mm specimens (all images were taken after 2 s of ultrasonic vibration). The heat spots observed were standing-wave heat patterns. The relationship between the distance between the heat spots and
t is illustrated in
Figure 2. The results indicate that the distance between heat spots increases as
t increases and is smaller when
f is 40 kHz than when
f is 28 kHz. In
Figure 2, the theoretically estimated wavelengths of the standing waves, calculated as half the theoretical wavelengths of the A
0 mode Lamb waves, are represented by dashed lines. The theoretical values also increase with increasing
t, as the wavelength of the Lamb wave varies with the plate thickness. The experimentally obtained heat spot intervals closely match the theoretical values. The figure indicates that the standing-wave heat patterns result from the standing waves generated through the propagation of the A
0 mode Lamb waves.
3. Standing Wave Suppression by Superposition of Two Waves
Based on the findings in the previous section, an attempt was made to suppress standing-wave heat patterns by superimposing two Lamb waves.
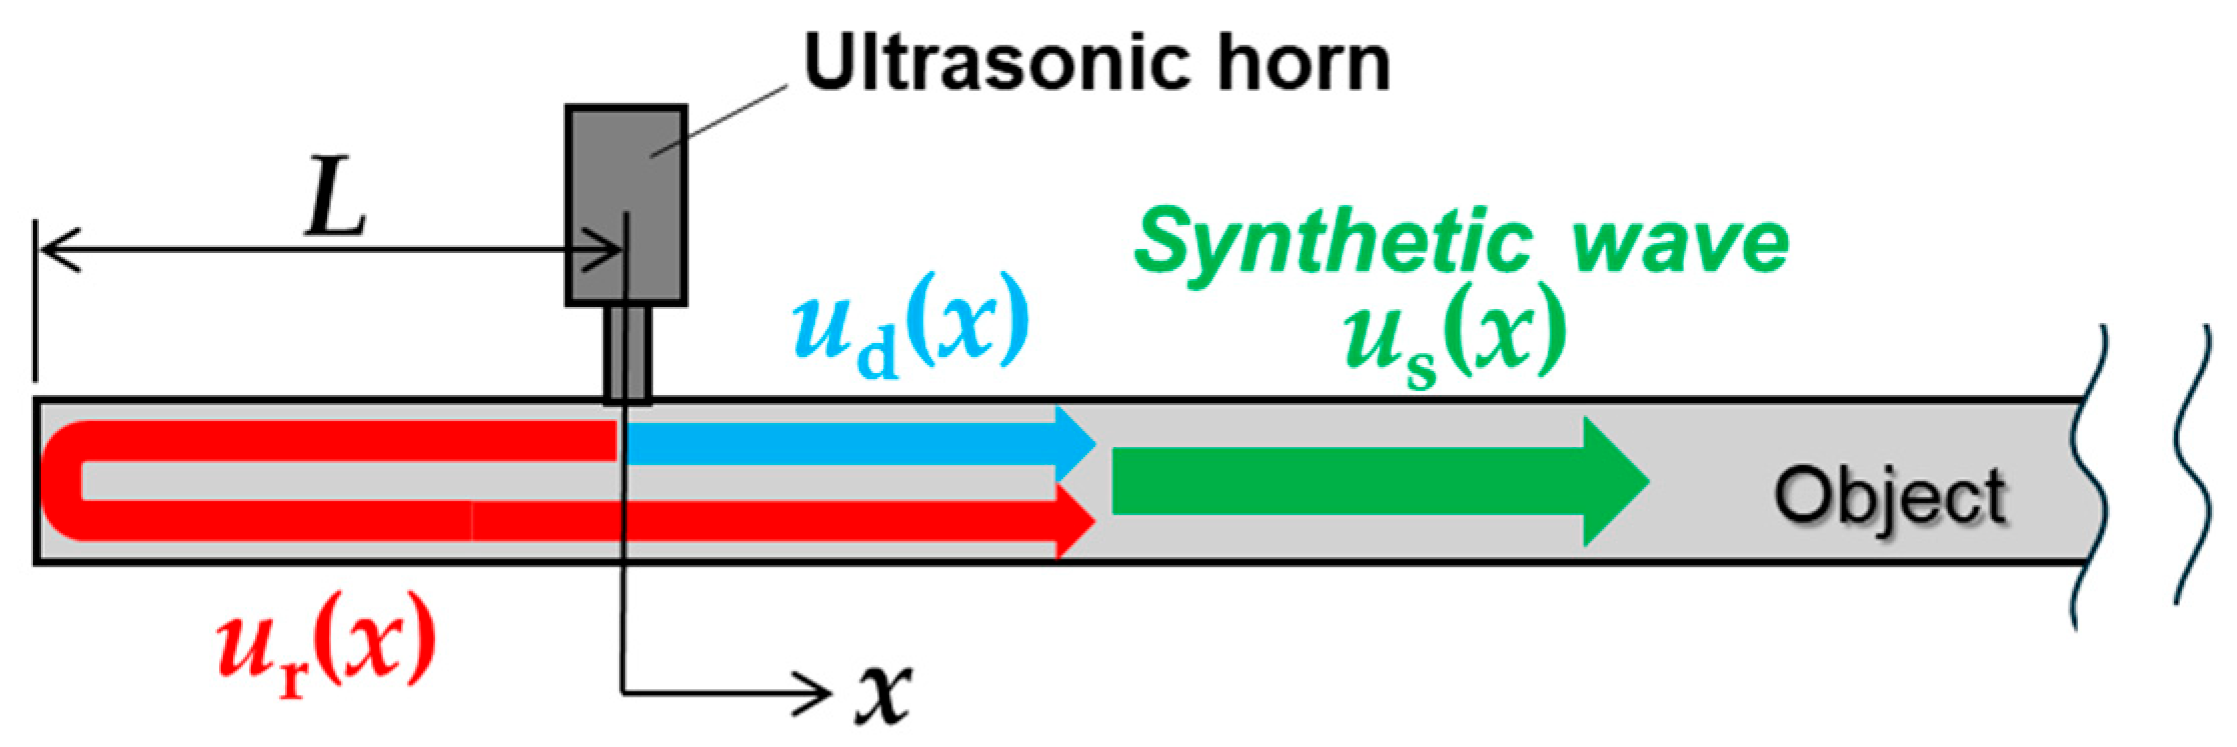
Figure 3 shows a two-dimensional schematic of the ultrasound-excited thermography inspection of a plate object. When ultrasounds are excited in the objects, waves propagate in both directions along the plate. Upon reaching the plate boundary (left edge in
Figure 3), one wave is reflected in the opposite direction and overlaps with the other wave, generating a synthetic wave within the object. To suppress the standing-wave heat patterns, the amplitude of the synthetic waves must be 0. Defining the wave propagating to the right direction in
Figure 3 as
ud(
x) =
Aeik(x+vt), and the wave reflected from the left edge of the object as
ur(
x) =
eiπAeik[(x+2L)+vt], where
A,
k,
v, and
t are amplitude, wave number, wave velocity, and time, respectively, the synthetic wave
us(
x) is expressed as
Because Aeik(x+vt) ≠ 0, (1 − eik2L) must be 0 for us(x) = 0. This condition is satisfied when the distance between the excitation point and the left edge of the object L = π/k, 2π/k, 3π/k, … Thus, us(x) becomes 0 when L = nλ/2 (where n and λ are natural number and wavelength, respectively).
This was experimentally verified using the same PMMA specimen (
t = 3 mm) described in the previous section. The theoretical wavelength of the A
0 mode Lamb wave in
t = 3 mm PMMA plate is 19.8 mm; thus, synthetic waves should be eliminated when
L = 9.9
n mm.
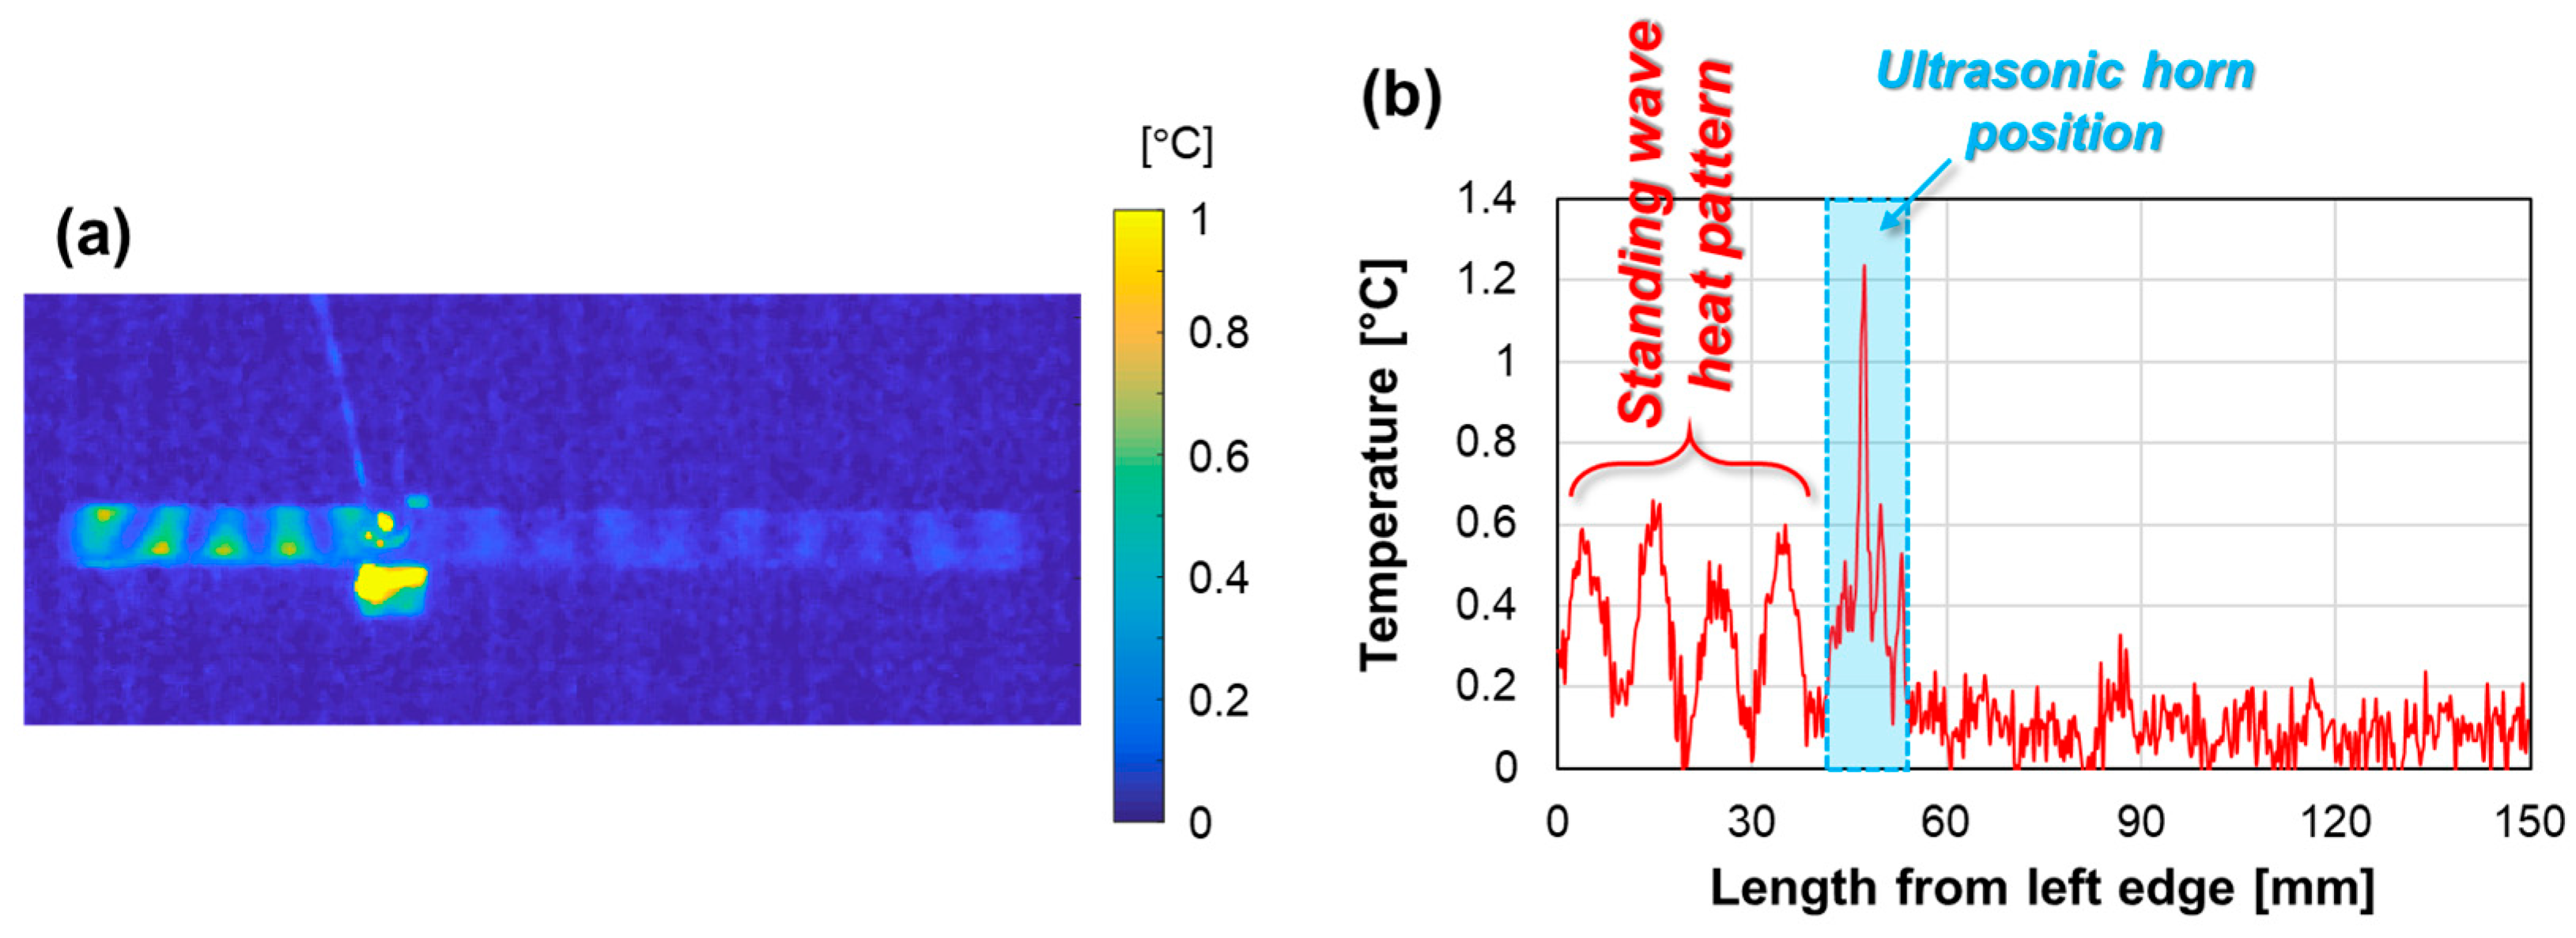
Figure 4 shows the experimental results obtained when the ultrasound excitation point was set to
L = 49.5 mm (
n = 5). The thermal image (
Figure 4a) and temperature profile of the specimen (
Figure 4b) indicate that although a standing-wave heat pattern is clearly observed on the left side of the excitation point, it is suppressed on the right side. This is because the two Lamb waves were superimposed on the right side, causing their amplitudes to cancel out. Therefore, these results demonstrate that standing-wave heat patterns can be suppressed by superimposing two waves with a phase difference of a natural number multiplied by half the wavelength.
4. Conclusions
Waves that cause standing-wave heat patterns—interfering with defect detection in ultrasonic excitation thermography—were investigated at two different ultrasound frequencies, and a method to suppress these heat patterns was investigated. The results showed that the heat patterns in plate objects were caused by the propagation of the A0 mode Lamb waves. Based on their wavelength, it was found that superimposing two Lamb waves with a phase difference equal to a natural number multiple of half the wavelength effectively suppressed the heat patterns. In this study, the waves reflected from the specimen edges were used as the superimposed waves. However, exciting ultrasound at two different positions is a practical and promising alternative. These findings suggest that the issue of standing-wave heat patterns can be mitigated by carefully arranging the ultrasound excitation positions based on the knowledge of the propagating wave behavior in the material.
Author Contributions
Conceptualization, M.I.; methodology, M.I.; software, R.F.; validation, M.I. and M.K.; formal analysis, H.N.; investigation, M.I.; resources, M.K.; writing—original draft preparation, M.I.; visualization, M.I.; supervision, H.N. All authors have read and agreed to the published version of the manuscript.
Funding
This work was supported by JSPS KAKENHI Grant Numbers JP21K04550 and JP24K07930.
Institutional Review Board Statement
Not applicable.
Informed Consent Statement
Not applicable.
Data Availability Statement
The data presented in this study are available on request from the corresponding author (M.I.).
Conflicts of Interest
The authors declare no conflicts of interest. KJTD Co., Ltd. has no commercial conflict of interest.
References
- Morbidini, M.; Cawley, P. The detectability of cracks using sonic IR. J. Appl. Phys. 2009, 105, 093530. [Google Scholar] [CrossRef]
- Favro, L.D.; Thomas, R.L.; Han, X.; Ouyang, Z.; Newaz, G.; Gentile, D. Sonic infrared imaging of fatigue cracks. Int. J. Fatigue 2001, 23, 471–476. [Google Scholar] [CrossRef]
- Guo, X.; Vavilov, V. Crack detection in aluminum parts by using ultrasound-excited infrared thermography. Infrared Phys. Technol. 2013, 61, 149–156. [Google Scholar] [CrossRef]
- Ishikawa, M.; Maeda, R.; Nishino, H.; Koyama, M.; Fukui, R. Waves causing undesired heat pattern detected via ultrasound-excited active thermography. Infrared Phys. Technol. 2025, 145, 105652. [Google Scholar] [CrossRef]
| Disclaimer/Publisher’s Note: The statements, opinions and data contained in all publications are solely those of the individual author(s) and contributor(s) and not of MDPI and/or the editor(s). MDPI and/or the editor(s) disclaim responsibility for any injury to people or property resulting from any ideas, methods, instructions or products referred to in the content. |
© 2025 by the authors. Licensee MDPI, Basel, Switzerland. This article is an open access article distributed under the terms and conditions of the Creative Commons Attribution (CC BY) license (https://creativecommons.org/licenses/by/4.0/).


