Abstract

Defect Size Estimation of Building’s Exterior Wall Using Thermal Decay Gradient Approach †

by
Lydia Sin-Yau Chiu
and
Wallace Wai-Lok Lai
*
Department of Land Surveying and Geo-Informatics, The Hong Kong Polytechnic University, Hung Hom, Kowloon, Hong Kong
*
Author to whom correspondence should be addressed.
Presented at the 18th International Workshop on Advanced Infrared Technology and Applications (AITA 2025), Kobe, Japan, 15–19 September 2025.
Proceedings 2025, 129(1), 3; https://doi.org/10.3390/proceedings2025129003
Published: 12 September 2025

1. Introduction

Typical building inspection using Passive Infrared Thermography involves defect analysis, in which defects appear as abnormal temperature distributions in thermal images (thermograms) due to contrasts in the thermal conductive and emissive properties of air (defect) and intact areas (finishes). With different image processing techniques, it is possible to perform defect detection [1,2] and size estimation [3,4]. However, the current approach only relies on a single thermal image to estimate the defect size, and the time when the thermal image was captured highly affects the performance. Since defects on the building’s exterior wall are in an ambient environment, the ideal scenario is to collect thermal images of the target over time, which captures the whole heat absorption and dissipation period for better defect analysis. The research conducted by [5] utilized the difference of the thermal decay gradients in different materials to perform feature classification in an outdoor environment. It is possible to adopt a similar approach in building defect inspection since the thermal contrast between the defects and the intact area is much more significant than that on a natural terrain presented in [5]. However, it is unfeasible to collect continuous time-lapse thermal data in urban areas due to site constraints. Therefore, this study proposes the adoption of the Thermal Decay Gradient Approach, which was first presented in [5], in building defect analysis, in which only two thermal images (captured in the heat absorption period and the heat dissipation period, respectively) were used in the defect analysis.

2. Materials and Methods

2.1. Experimental Setup

A west-facing sample wall with ground truths was constructed at the rooftop of the Industrial Centre on PolyU’s campus. Ten low-density polystyrene foam plates with an area of 400 cm2 were embedded in the sample wall. Six of them were covered with reddish-brown wall tiles and rendering, while four of them were covered with rendering only (Figure 1). The thickness of the foam plates used in each debond ranged from 3 mm to 12 mm, and their corresponding cover depths ranged from 15 mm to 32 mm. To capture thermal images of the sample wall, a long-wave thermal camera (model: FLIR T650sc, 640 × 480 pixels, 30 Hz) was used. The distances between the thermal camera and the target surface were 2.8625 m, with a spatial resolution (IFOV) of 0.123 cm2, at Position A, and 3.406 m, with a spatial resolution (IFOV) of 0.174 cm2, at Position B. The experiments were conducted in a 24 h cycle, in which thermal images of the sample wall were taken once every 5 min, to evaluate the difference in temperature through a time-lapse analysis. Data was collected on two different sunny days with similar weather conditions.

2.2. Methodology

The general workflow for the Thermal Decay Mapping method consists of two main components, including the Thermal Decay Mapping part and the Defect Size Estimation part.
In the Thermal Decay Mapping part, the proposed workflow in this study modifies the point-based feature analysis in [5]. To generate a Thermal Decay Map, two images were selected from the time-lapse thermal data collected at both positions. In order to investigate the optimal time for capturing these two images, the images captured within the selected period were used, which starts from the beginning of the heat absorption period and ends at midnight. Thermal Decay Maps for every combination of any two images in the selected period were produced. The temperature values in each pixel of the selected thermal images and the corresponding time were normalized on a natural logarithmic scale. Then, the thermal decay gradient in each pixel was retrieved by applying linear regression and was visualized in a Thermal Decay Map, in which the value in each pixel represents the change in temperature over a period.
For the Defect Size Estimation part, the Thermal Decay Map was used, and regions of interest (ROI) were selected according to each embedded debond. Then, Otsu’s thresholding was applied, and a binary image highlighting the defects was produced. After applying the thresholding, the resulting binary images were then analyzed by calculating the confusion matrix with the ground truth, and the accuracies of the proposed Thermal Decay Mapping approach were evaluated. Size estimation of the detected defects/features was performed by counting the number of pixels in white in the binary image, and scaling the pixel resolution to actual size through IFOV calculation or scaling the pixel to a known size in any IR images.

3. Results and Discussion

3.1. Resulting Thermal Decay Map

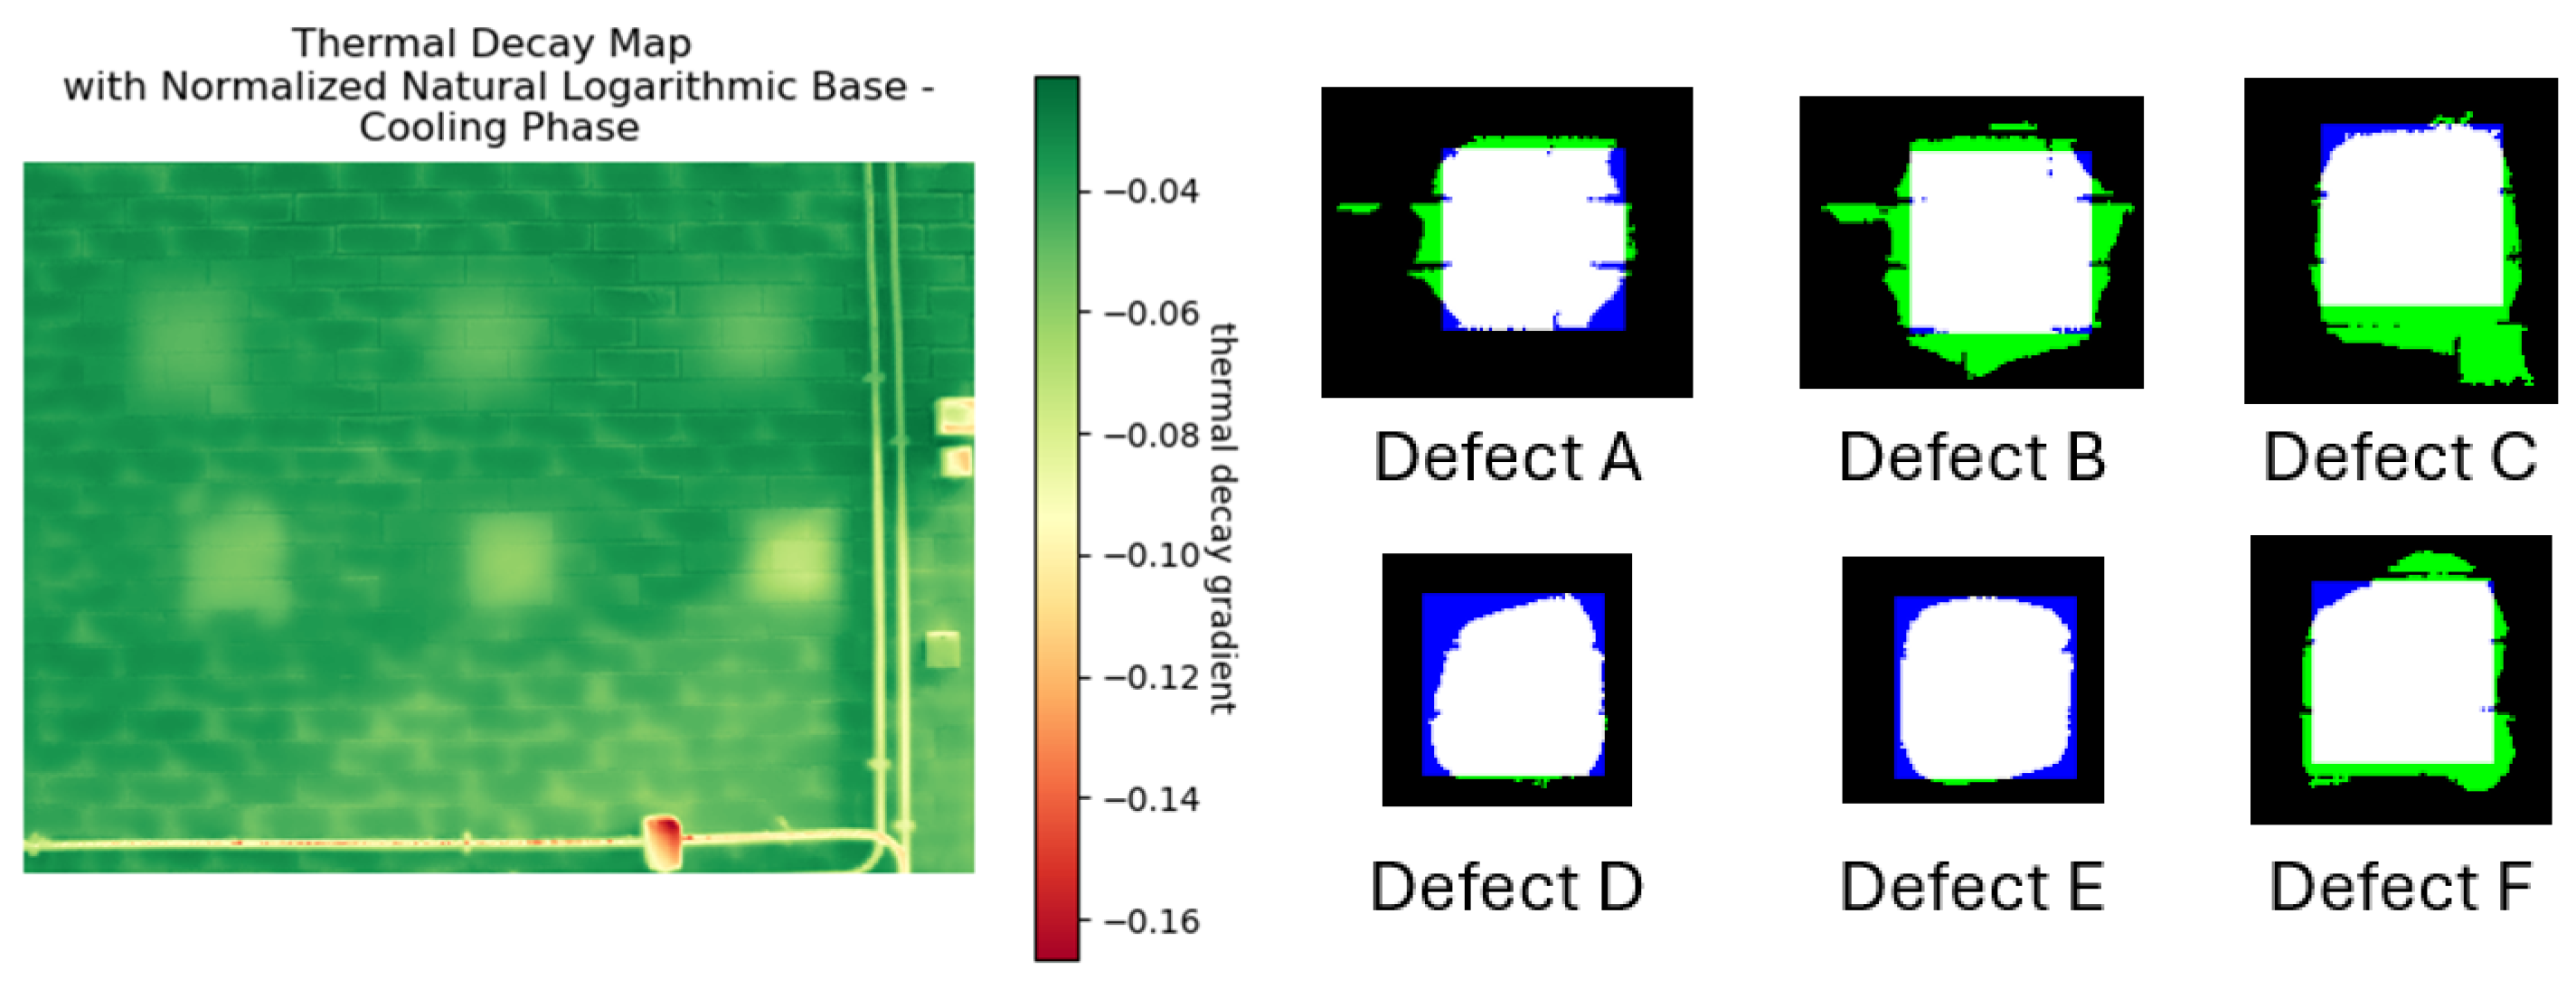
The left part of Figure 2 shows one of the resulting Thermal Decay Maps generated from the time-lapse thermal data taken at Position A. Two images were selected for generating the Thermal Decay Map: the first one was Frame 56, which was captured during the heat absorption period; the second one was Frame 174, which was captured during the heat dissipation period. From the resulting Thermal Decay Map, all six embedded defects can be distinguished. The right part of Figure 2 shows the comparison image between the binary image with the defects and the ground truth, in which white represents the correct prediction of defective area, black represents the correct prediction of intact area, and green and blue represent overestimation and underestimation of the suspected defect, respectively.

3.2. Selection of Thermal Images for Creating a Thermal Decay Map

In the proposed method in this study, two images were used to produce a Thermal Decay Map for defect analysis and size estimation, which eliminates the problem of capturing a thermal image at the wrong time when there is insufficient thermal contrast between the defect and the intact area for defect classification in snapshot IRT. From the results, two factors affect the accuracy of defect classification and size estimation, which are the first images to be selected for creating the Thermal Decay Maps, and the required time elapsed between the two images.
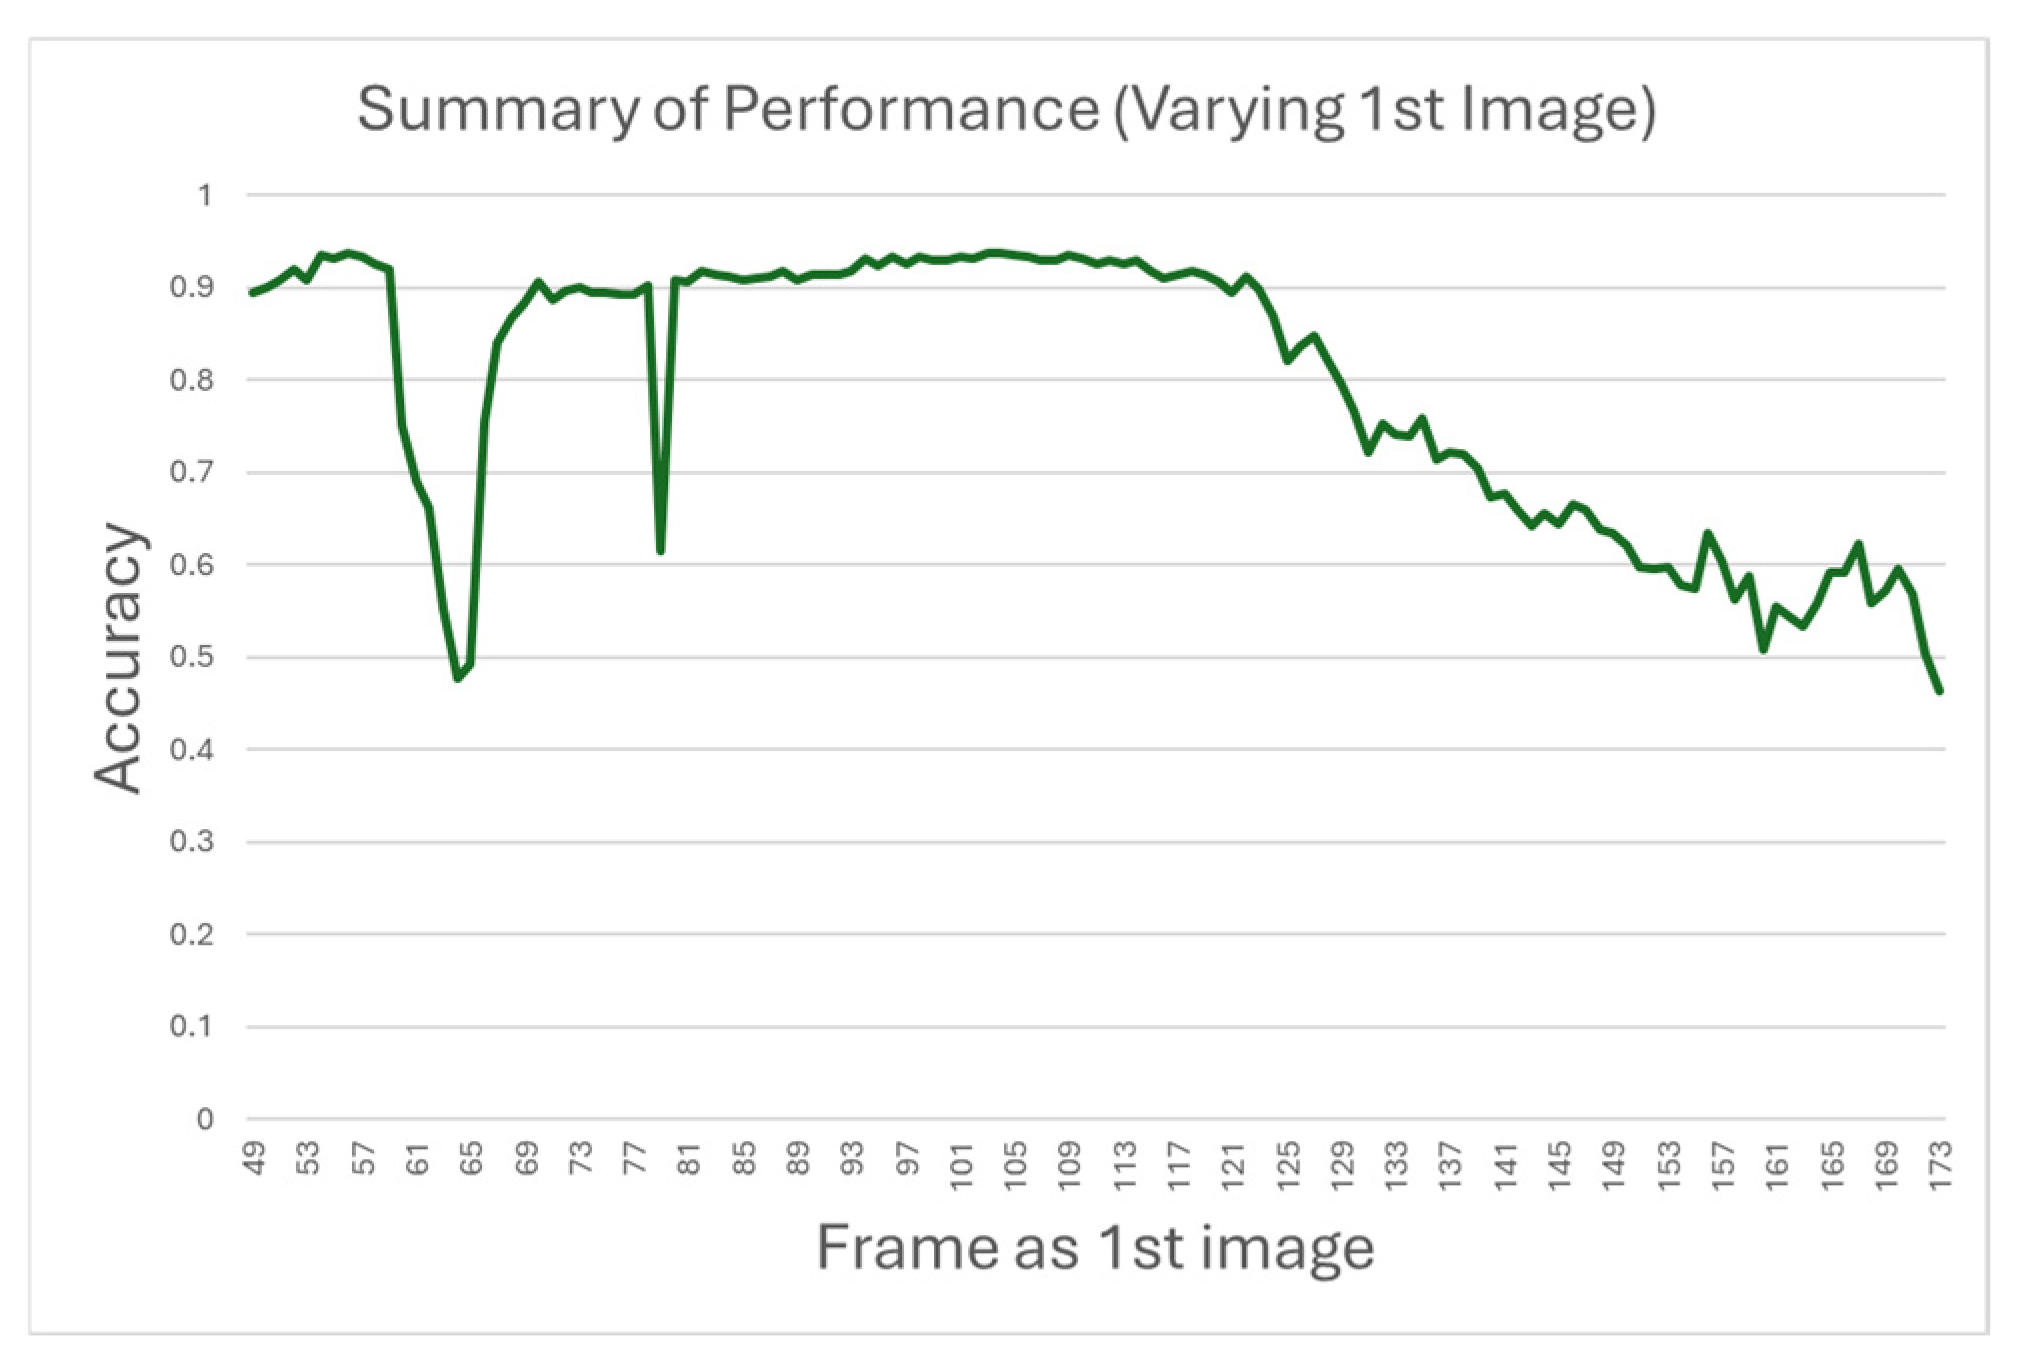
For the selection of the first image to be used for creating the Thermal Decay Maps, Figure 3 shows a summary of the performance of the defect detection and size estimation when thermal images taken at different times were used as the first image, and the thermal image captured at midnight (Frame 174, i.e., during the heat dissipation period) was used as the second image for generating the Thermal Decay Map. It showed that using the images taken during the heat absorption period as the first images results in higher accuracy, which could be above 0.9. The accuracy decreased if the images taken during the heat dissipation period were used as the first images.
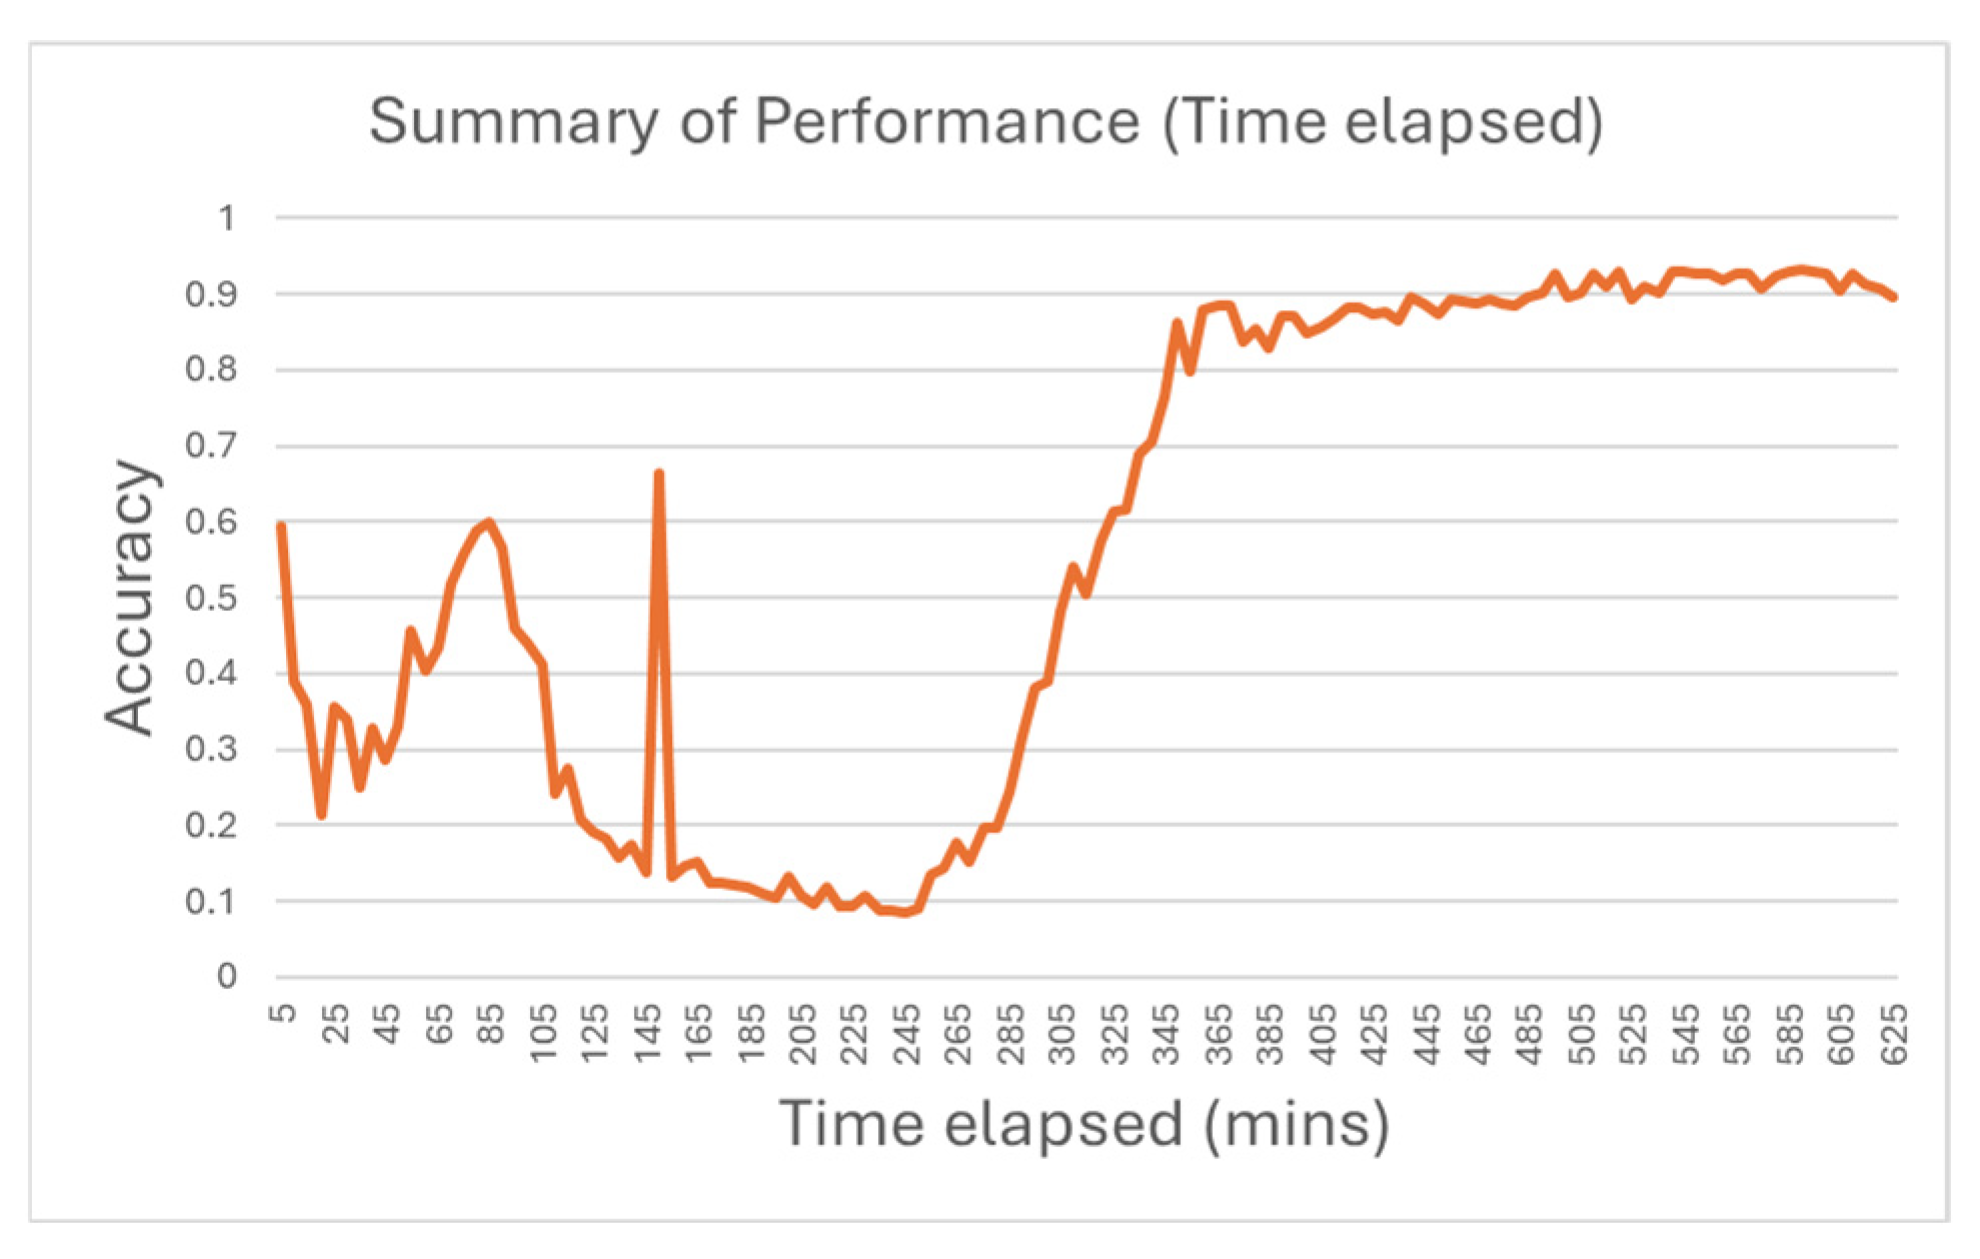
For the required time elapsed between the two images, Figure 4 shows a summary of performance, which indicates that the required time elapsed should be more than 345 min to achieve an accuracy above 0.8.

4. Conclusions

This study validated the possibility of adopting the Thermal Decay Mapping method in building inspection when only two thermal images were used to generate a Thermal Decay Map. Based on the results presented in this study, the accuracy of defect detection by adopting the proposed method can be affected by two main factors, which are the selection of the first images to be used to create the Thermal Decay Map and the time elapsed between the two images used. With the optimal parameters, it could provide defect classification and size estimation results with an accuracy of up to 0.9, which is a significant improvement in building external wall diagnosis.

Author Contributions

Conceptualization, W.W.-L.L.; methodology, L.S.-Y.C. and W.W.-L.L.; software, L.S.-Y.C.; validation, L.S.-Y.C. and W.W.-L.L.; formal analysis, L.S.-Y.C.; investigation, L.S.-Y.C.; resources, W.W.-L.L.; data curation, L.S.-Y.C.; writing—original draft preparation, L.S.-Y.C.; writing—review and editing, L.S.-Y.C. and W.W.-L.L.; visualization, L.S.-Y.C.; supervision, W.W.-L.L.; project administration, W.W.-L.L.; funding acquisition, W.W.-L.L. All authors have read and agreed to the published version of the manuscript.

Funding

This research received no external funding.

Institutional Review Board Statement

Not applicable.

Informed Consent Statement

Not applicable.

Data Availability Statement

The data and images of this article will be made available by the authors on request.

Conflicts of Interest

The authors declare no conflicts of interest.

References

  1. Al Gharawi, M.; Adu-Gyamfi, Y.; Washer, G. A framework for automated time-lapse thermography data processing. Constr. Build. Mater. 2019, 227, 116507. [Google Scholar] [CrossRef]
  2. Meola, C.; Di Maio, R.; Roberti, N.; Carlomgano, G.M. Application of infrared thermography and geophysical methods for defect detection in architectural structures. Eng. Fail. Anal. 2005, 12, 875–892. [Google Scholar] [CrossRef]
  3. Lai, W.L.; Lee, K.K.; Kou, S.C.; Poon, C.S.; Tsang, W.F. A study of full-field debond behaviour and durability of CFRP-concrete composite beams by pulsed infrared thermography (IRT). NDT E Int. 2012, 52, 112–121. [Google Scholar] [CrossRef]
  4. Lai, W.L.; Lee, K.K.; Poon, C.S. Validation of size estimation of debonds in external wall’s composite finishes via passive infrared thermography and a gradient algorithm. Constr. Build. Mater. 2015, 87, 113–124. [Google Scholar] [CrossRef]
  5. Chiu, L.S.Y.; Lai, W.W.L.; Santos-Assunção, S.; Sandhu, S.S.; Sham, J.F.C.; Chan, N.F.S.; Wong, J.C.F.; Leung, W.K. A Feasibility Study of Thermal Infrared Imaging for Monitoring Natural Terrain—A Case Study in Hong Kong. Remote Sens. 2023, 15, 5787. [Google Scholar] [CrossRef]
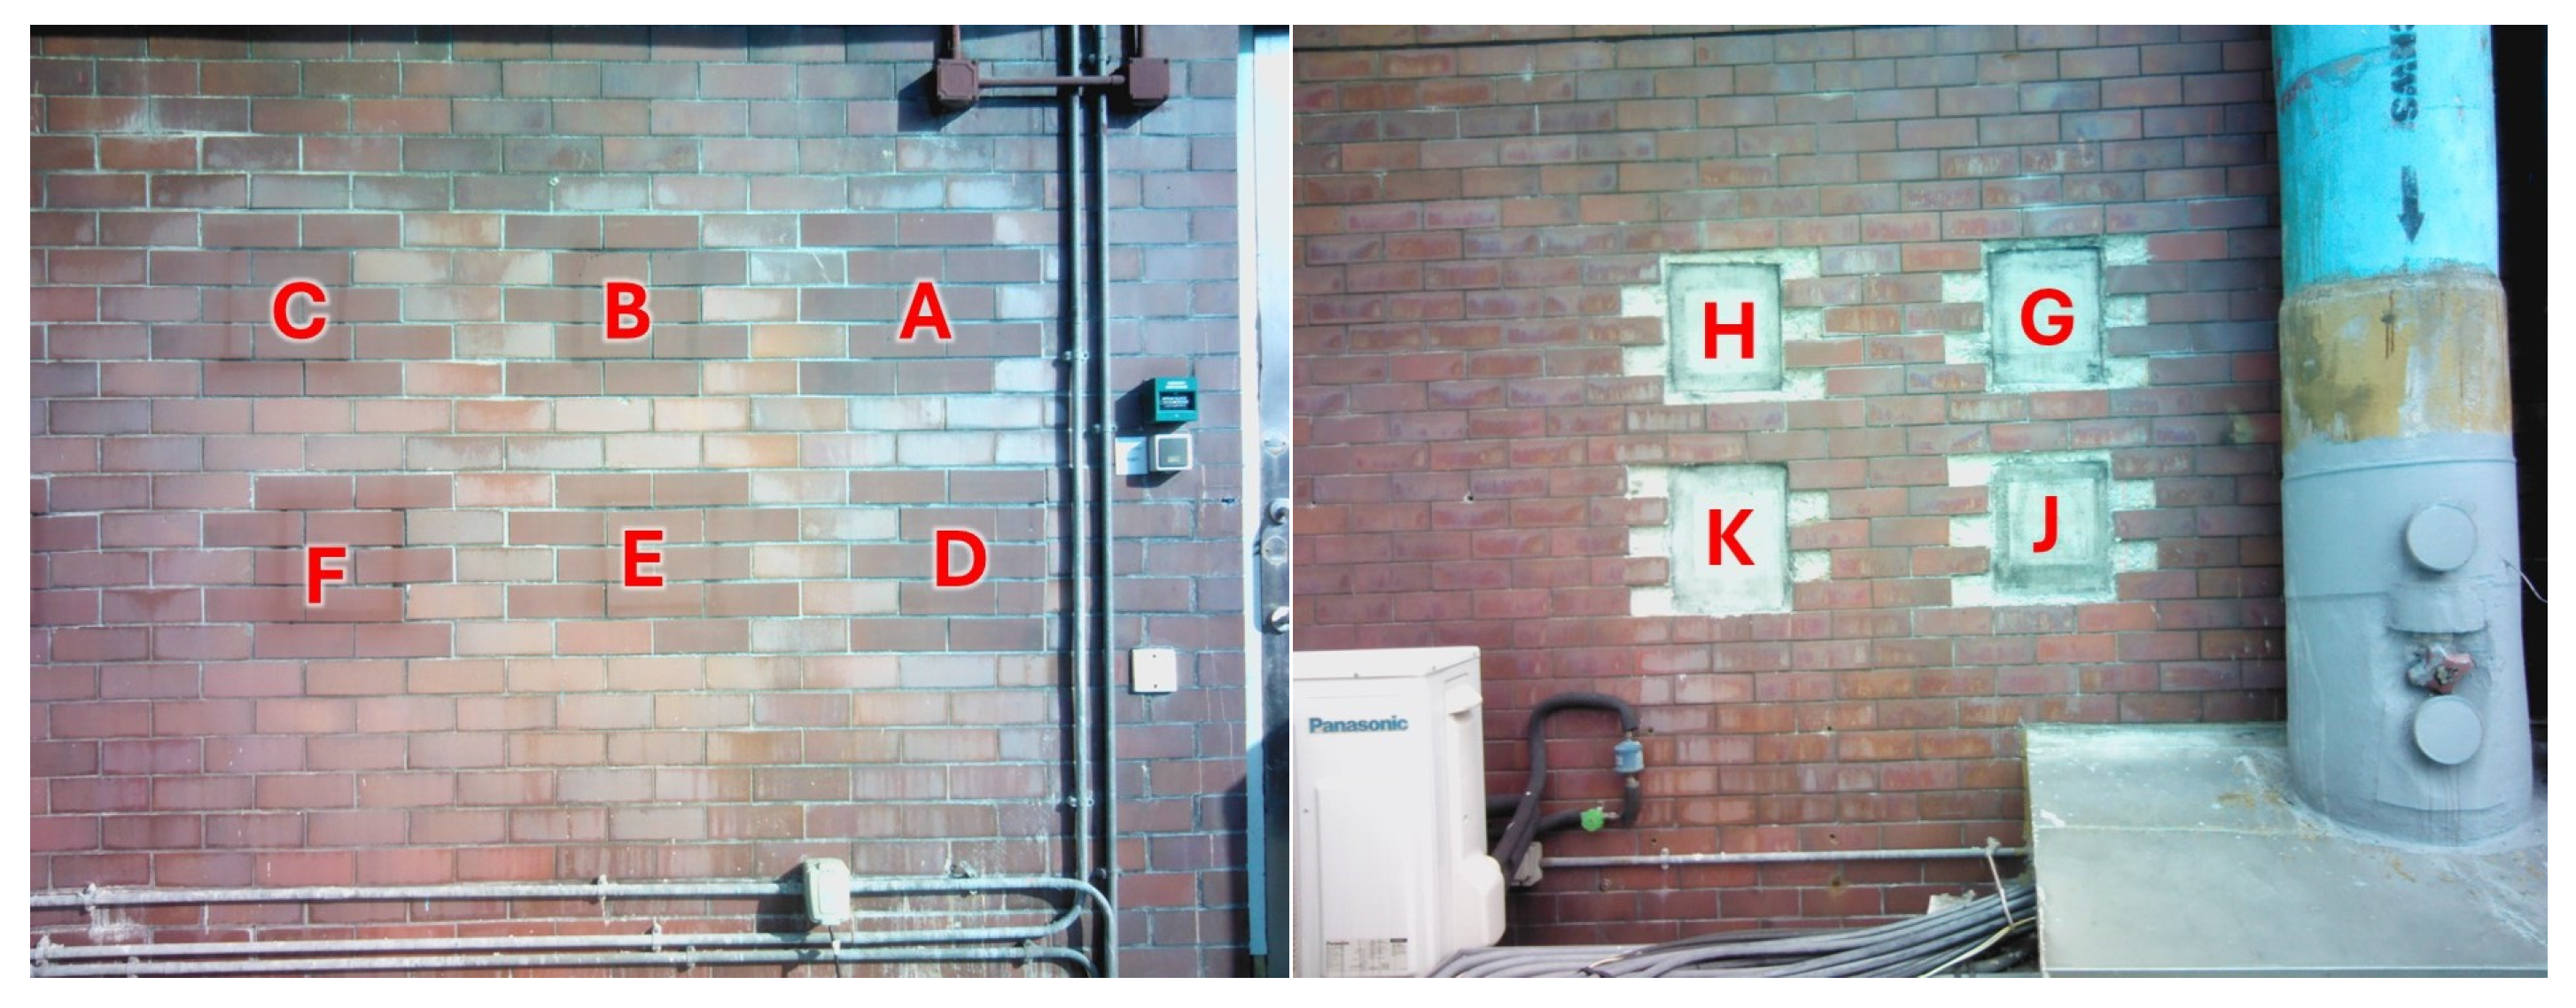
Figure 1. Embedded debonds on PolyU’s sample wall: Position A (left) and Position B (right): Defects A to C with decreasing foam thicknesses under same cover depth, Defects D to F with decreasing foam thicknesses and increasing cover depths, and Defects G to K with different foam thickness and cover depths.
Proceedings 129 00003 g001
Figure 2. Thermal Decay Map produced using Frame 56 (during heat absorption period) and Frame 174 (during heat dissipation period) (left) and the comparison image of each embedded debond (right).
Proceedings 129 00003 g002
Figure 3. Summary of performance according to the selection of the 1st image.
Proceedings 129 00003 g003
Figure 4. Summary of performance according to the time elapsed between the two images.
Proceedings 129 00003 g004
Disclaimer/Publisher’s Note: The statements, opinions and data contained in all publications are solely those of the individual author(s) and contributor(s) and not of MDPI and/or the editor(s). MDPI and/or the editor(s) disclaim responsibility for any injury to people or property resulting from any ideas, methods, instructions or products referred to in the content.