1. Research Objective
Any negligence during the placement process for a concrete structure, especially when new concrete is poured onto an already hardened layer, can lead to the formation of cold joints. These discontinuities at the interface result in increased porosity and permeability, allowing harmful ions to penetrate more easily, which, in turn, significantly compromises strength and durability of the structural.
To address this issue, the present study aims to evaluate the severity of cold joints using the propagation characteristics of Rayleigh waves. This research investigates the effects of varying porosity on waveform and wave velocity. The ultimate goal is to establish a reliable and effective non-destructive testing (NDT) method for rapidly assessing the impact of cold joints on concrete structures.
2. Materials and Experimental Methods
In this study, self-compacting concrete (SCC) was used, with a design compressive strength of 280 kg/cm
2, a water-to-binder ratio of 0.39, and a slump flow controlled at 65 ± 5 cm. As shown in
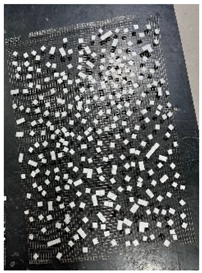
Table 1, the cold joint interface was simulated using randomly distributed polystyrene (EPS) sheets measuring 1 × 1 cm
2 in area and 1.2 mm in thickness. The designed porosity levels included 20%, 40%, 60%, and 80%.
As shown in
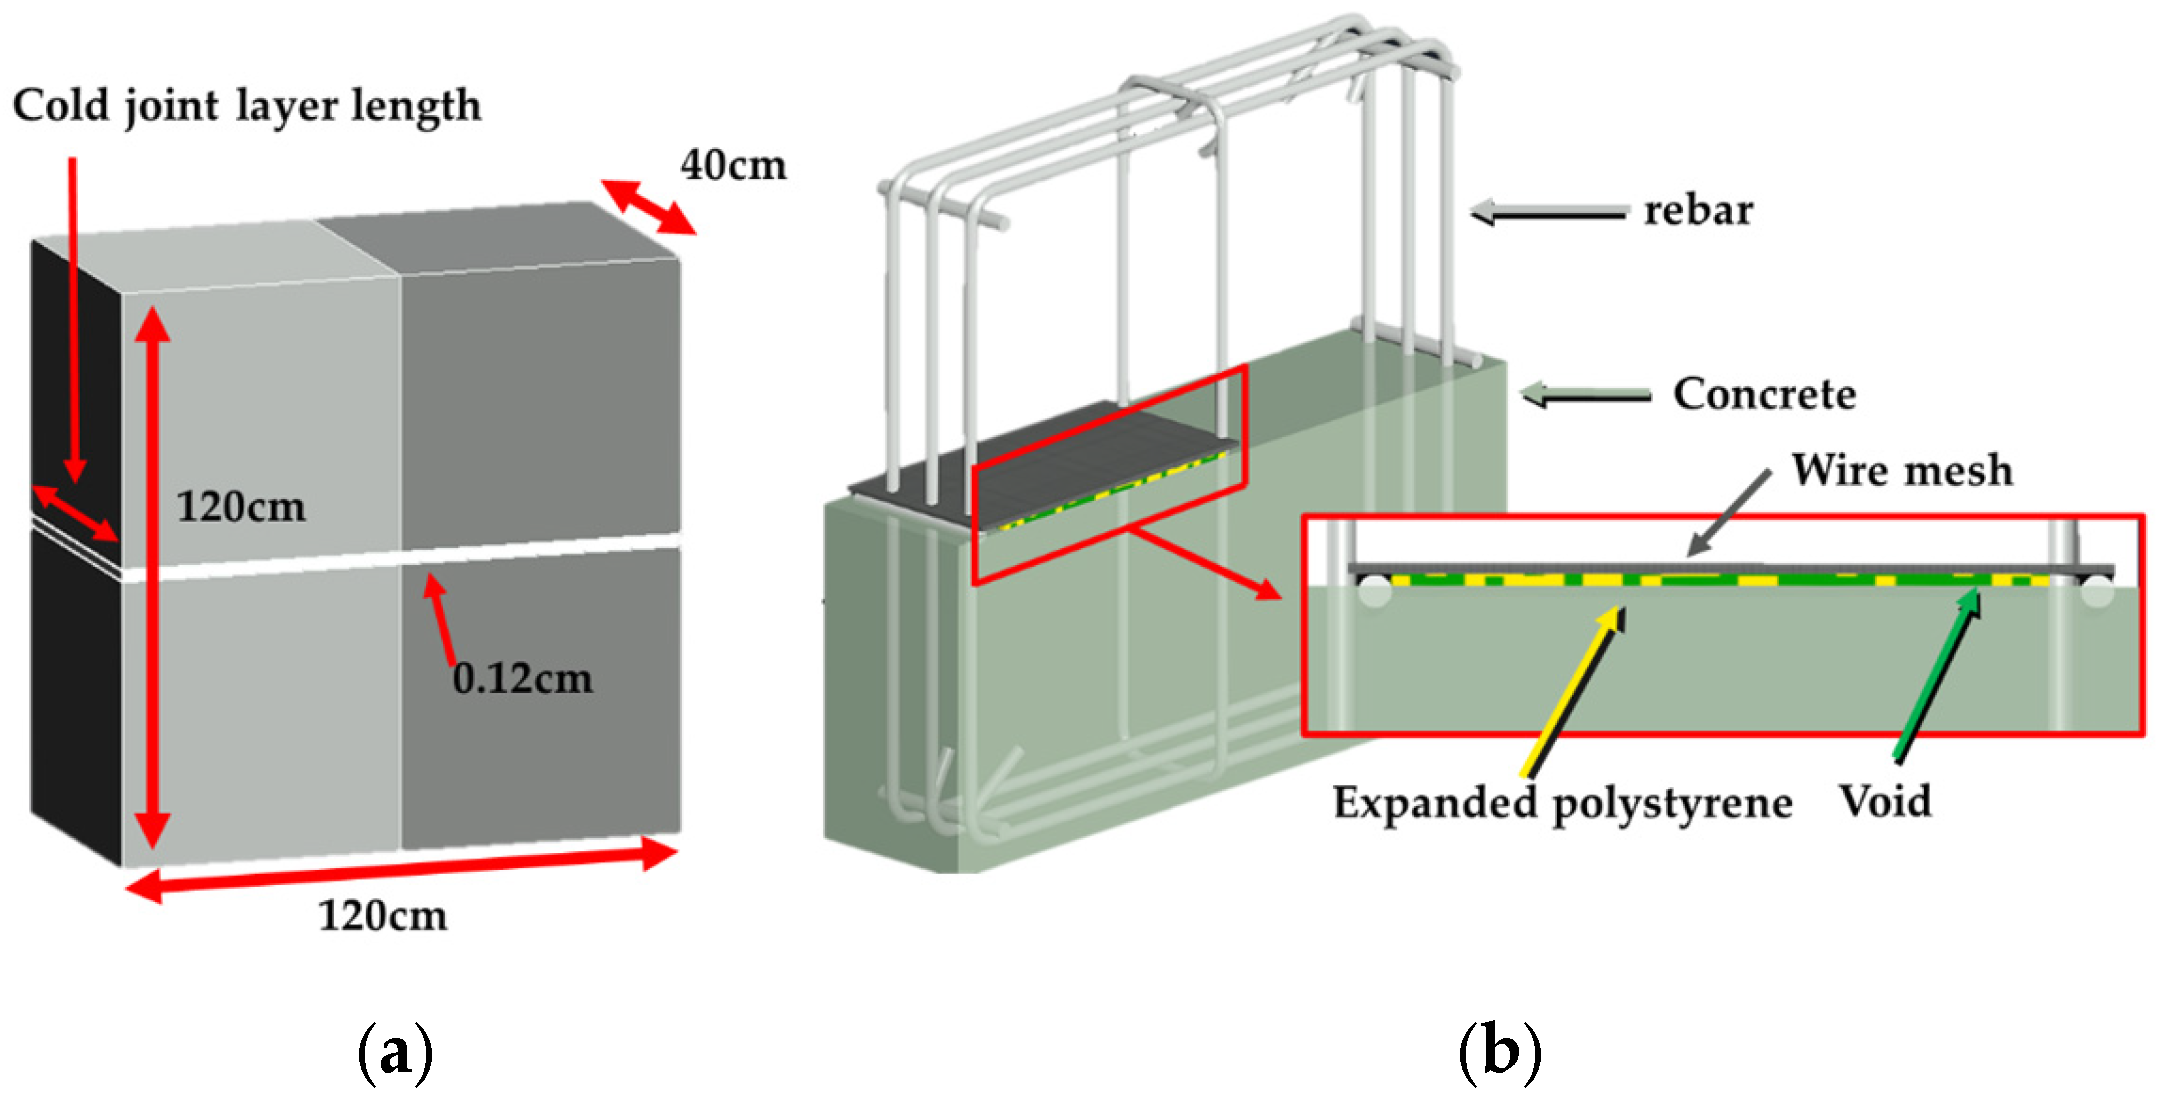
Figure 1a, the test specimens were 120 × 120 × 40 cm blocks, each with two distinct porosity regions.
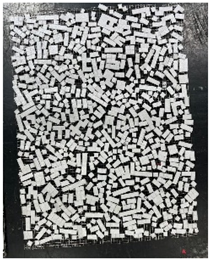
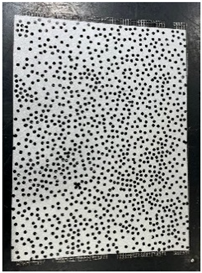
Figure 1b illustrates the porosity distribution and realistic simulation of cold joints. For the 60% porosity group, we manufactured the interface by randomly distributing clusters of EPS patches (1 to 5 cm in side length) instead of individual 1 cm square patches to ensure uniform sheet distribution. In the 80% porosity group, voids were simulated by cutting through-holes in the interface.
Testing Method
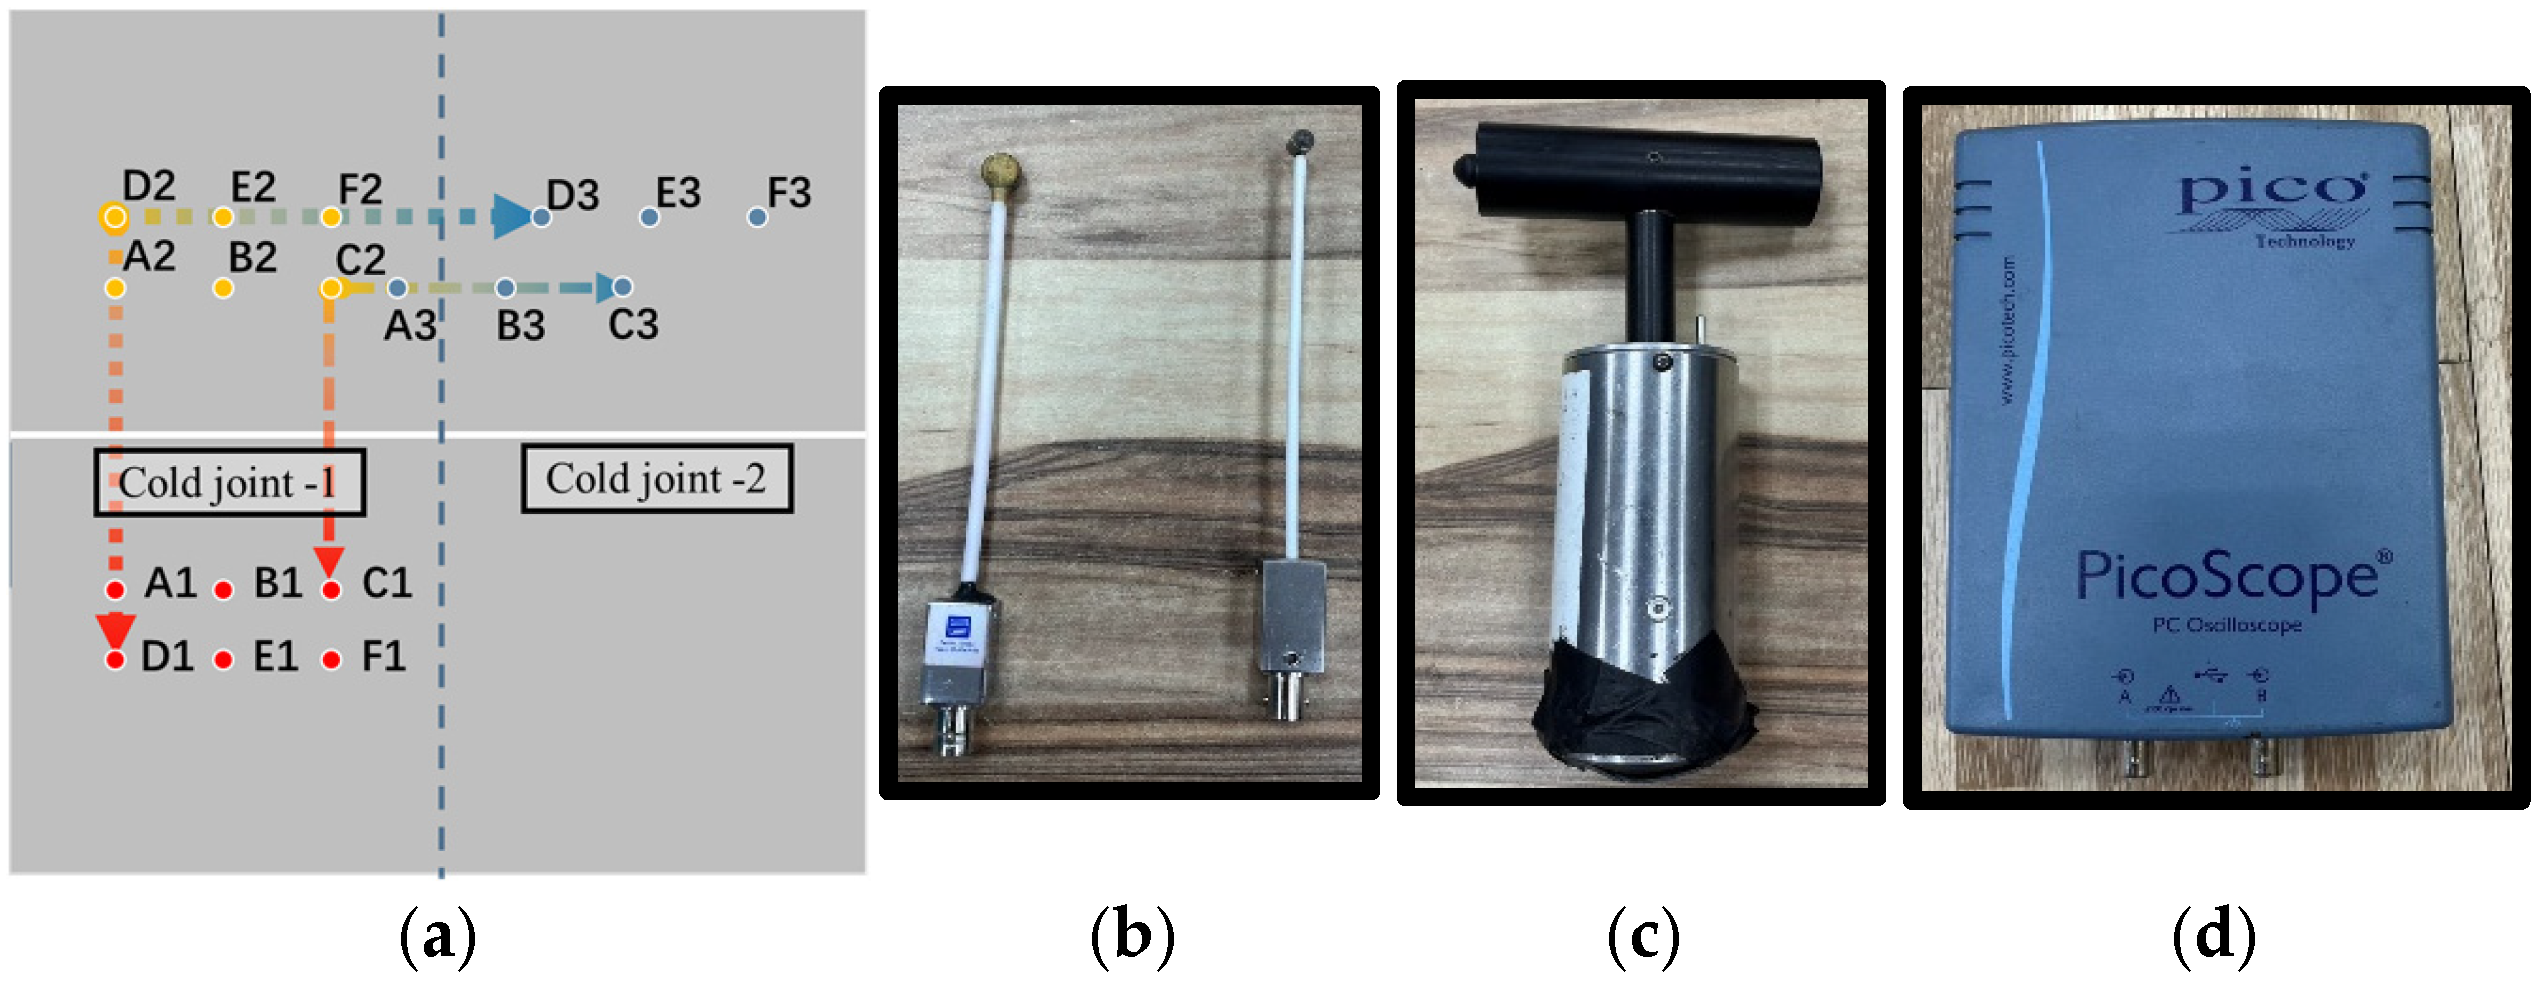
In the experiment, piezoelectric impact hammers (5 mm and 10 mm diameters) acted as excitation sources to determine the initial impact time (
Figure 2). Two displacement receivers and a digital data acquisition card then captured the surface wave responses. For each hammer impact, we took two simultaneous measurements: one intersecting the cold joint (joint-pass test) and the other avoiding it (joint-avoid test). The data acquisition system recorded 25,000 data points per measurement at a 20 MHz sampling frequency—a 20 ms recording duration in total. The impact and receiver positions are labeled in
Table 2. Distances of 0.4 m were designated A, B, and C, and 0.6 m distances were designated D, E, and F.
3. Experimental Results
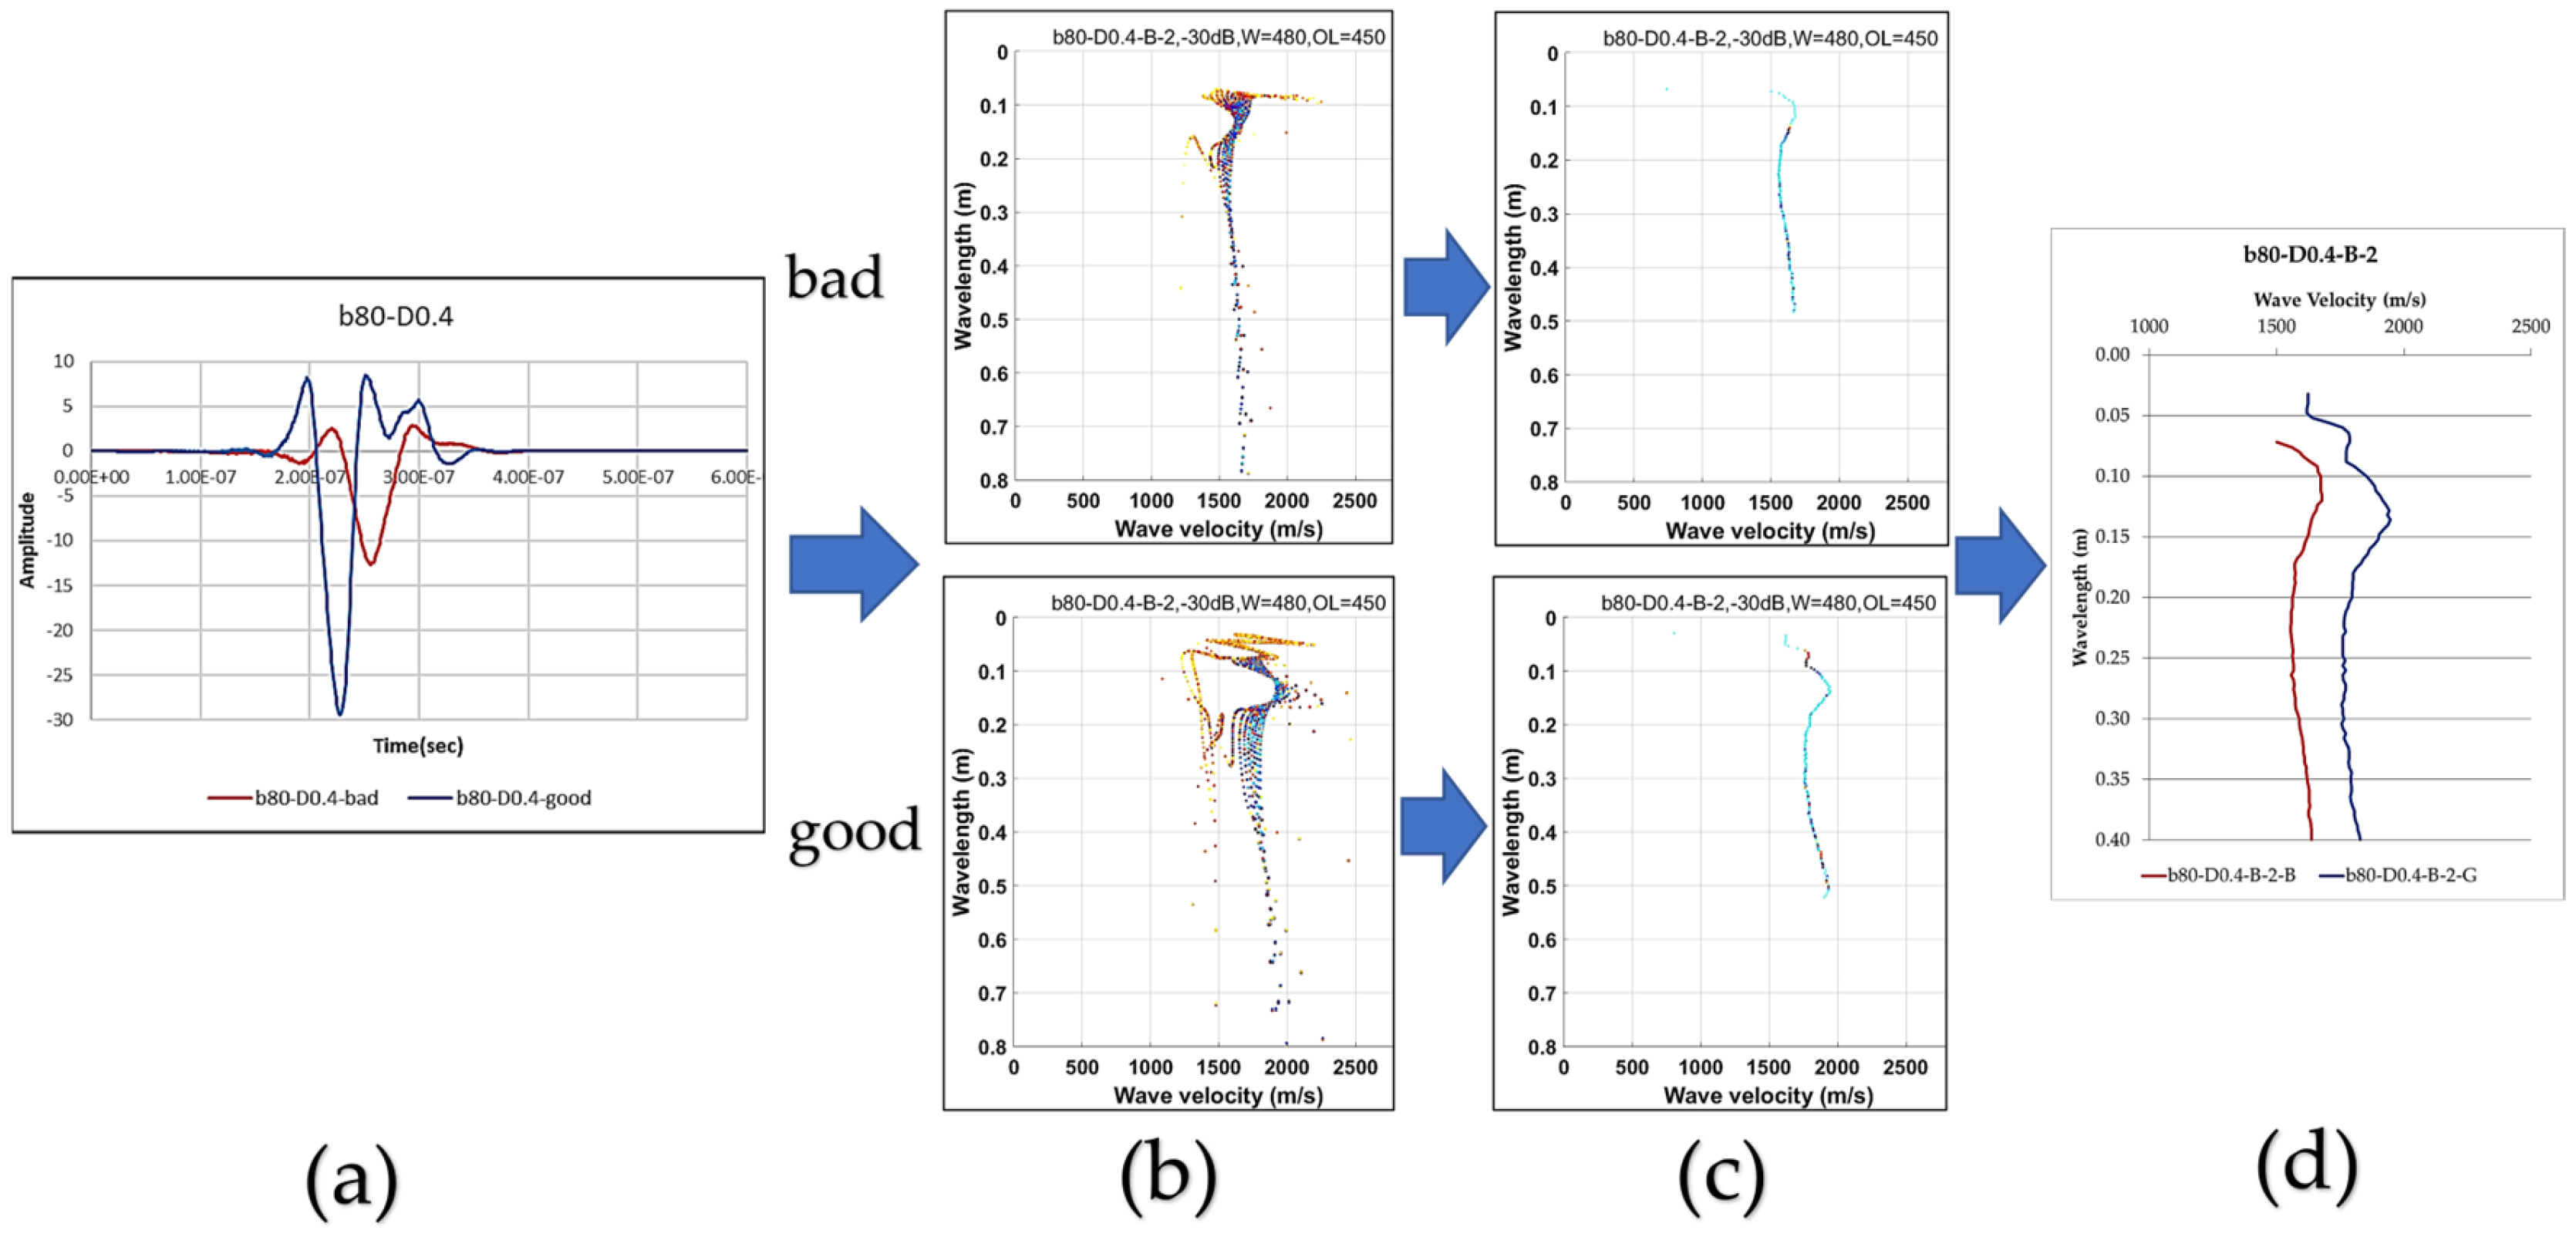
The time-domain signal obtained from the experiment, as shown in
Figure 3a, was first transformed into the time–frequency domain using the short-time Fourier transform (STFT). Subsequently, a reassigned spectrogram [
1] was employed to enhance the resolution of the time–frequency representation, thereby providing a clearer illustration of the surface wave group velocity dispersion characteristics (
Figure 3b). The maximum value at each wavelength interval of 0.4 mm were picked to obtain a clear dispersion curve, which further elucidated the wave propagation characteristics within the material
Figure 3c.
Figure 3d compares the dispersion curves from joint-pass and joint-avoid tests.
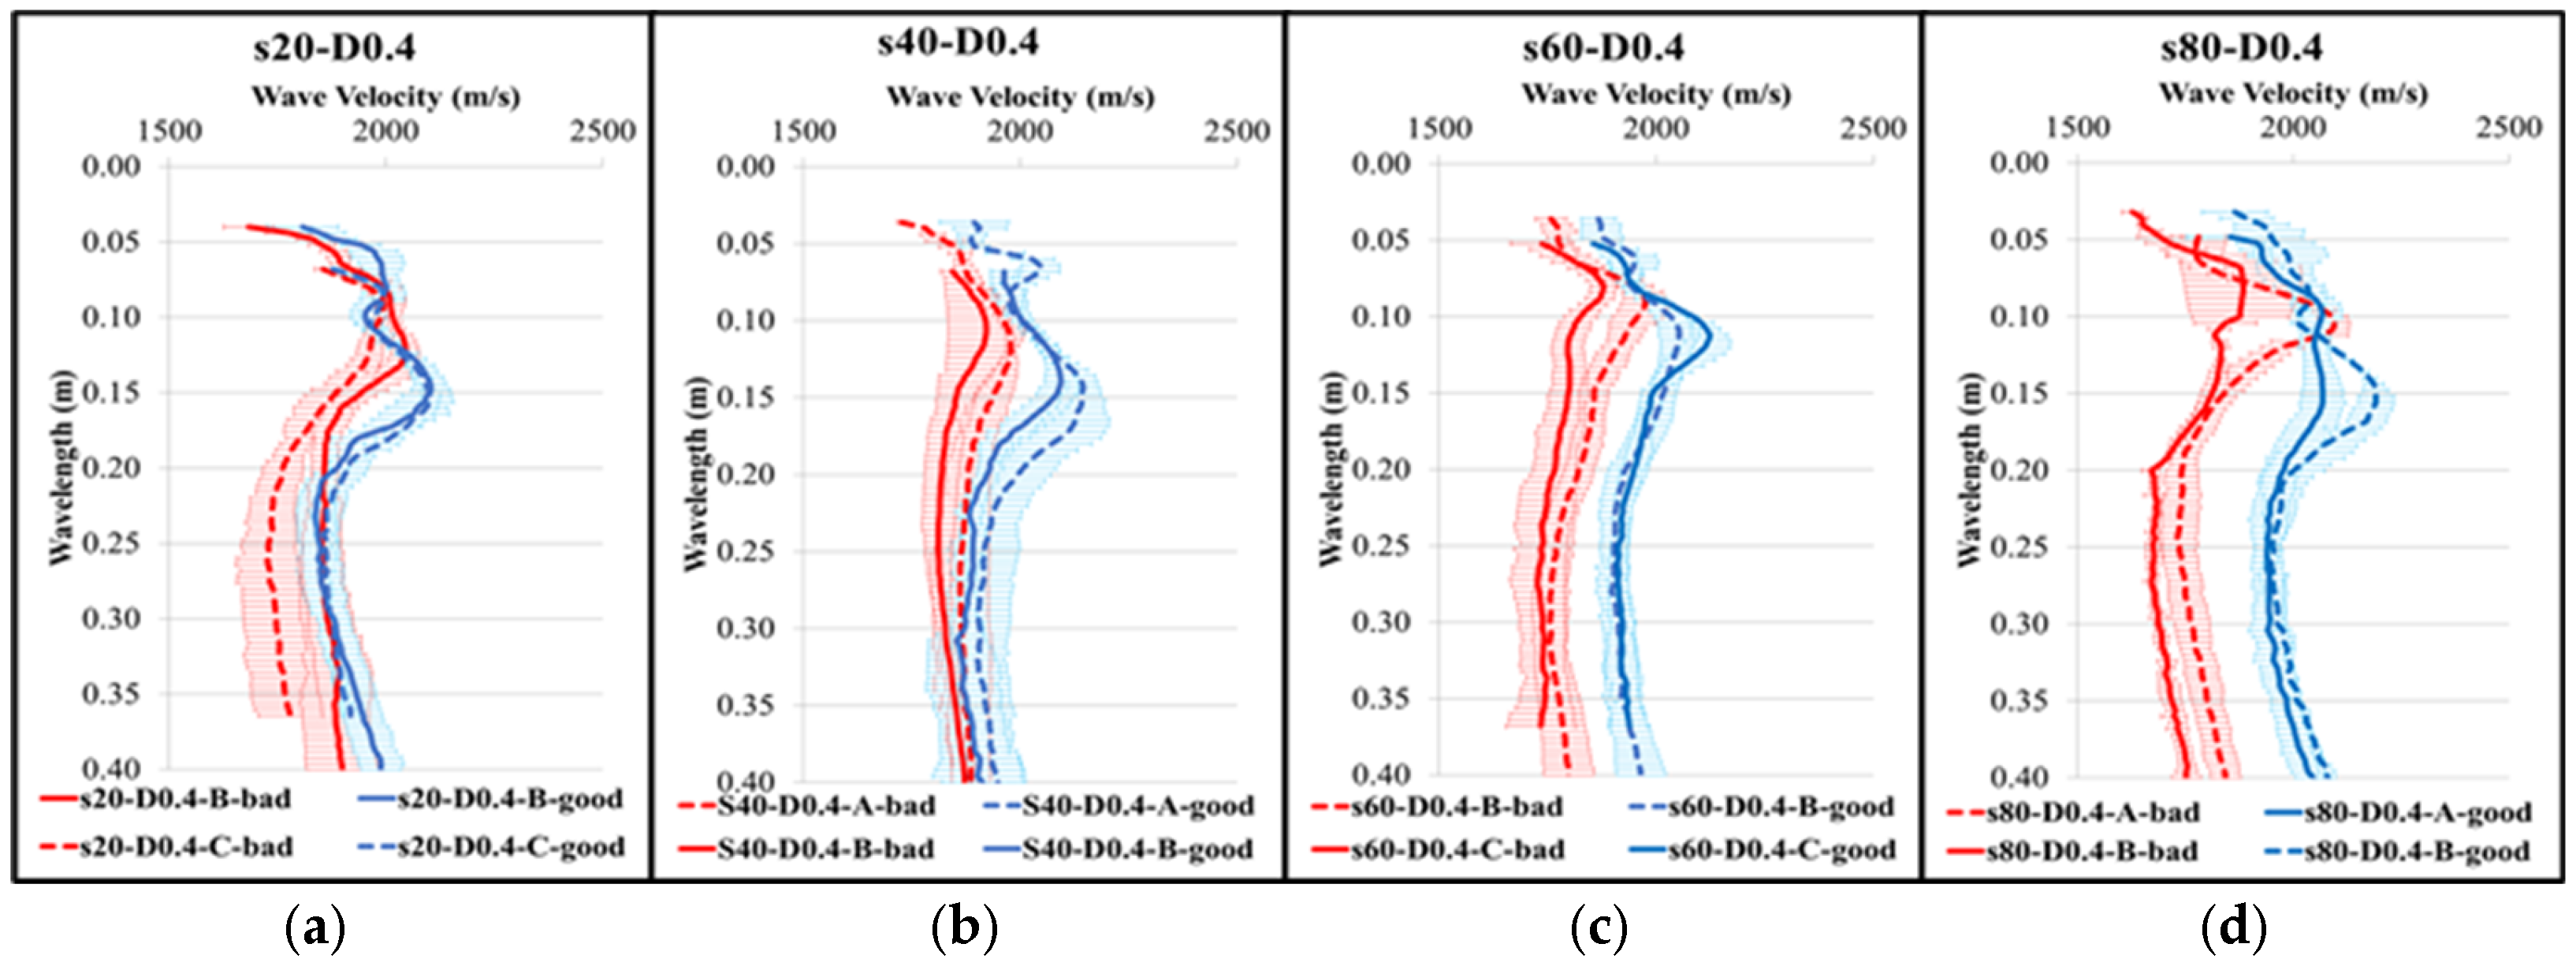
Figure 4 and
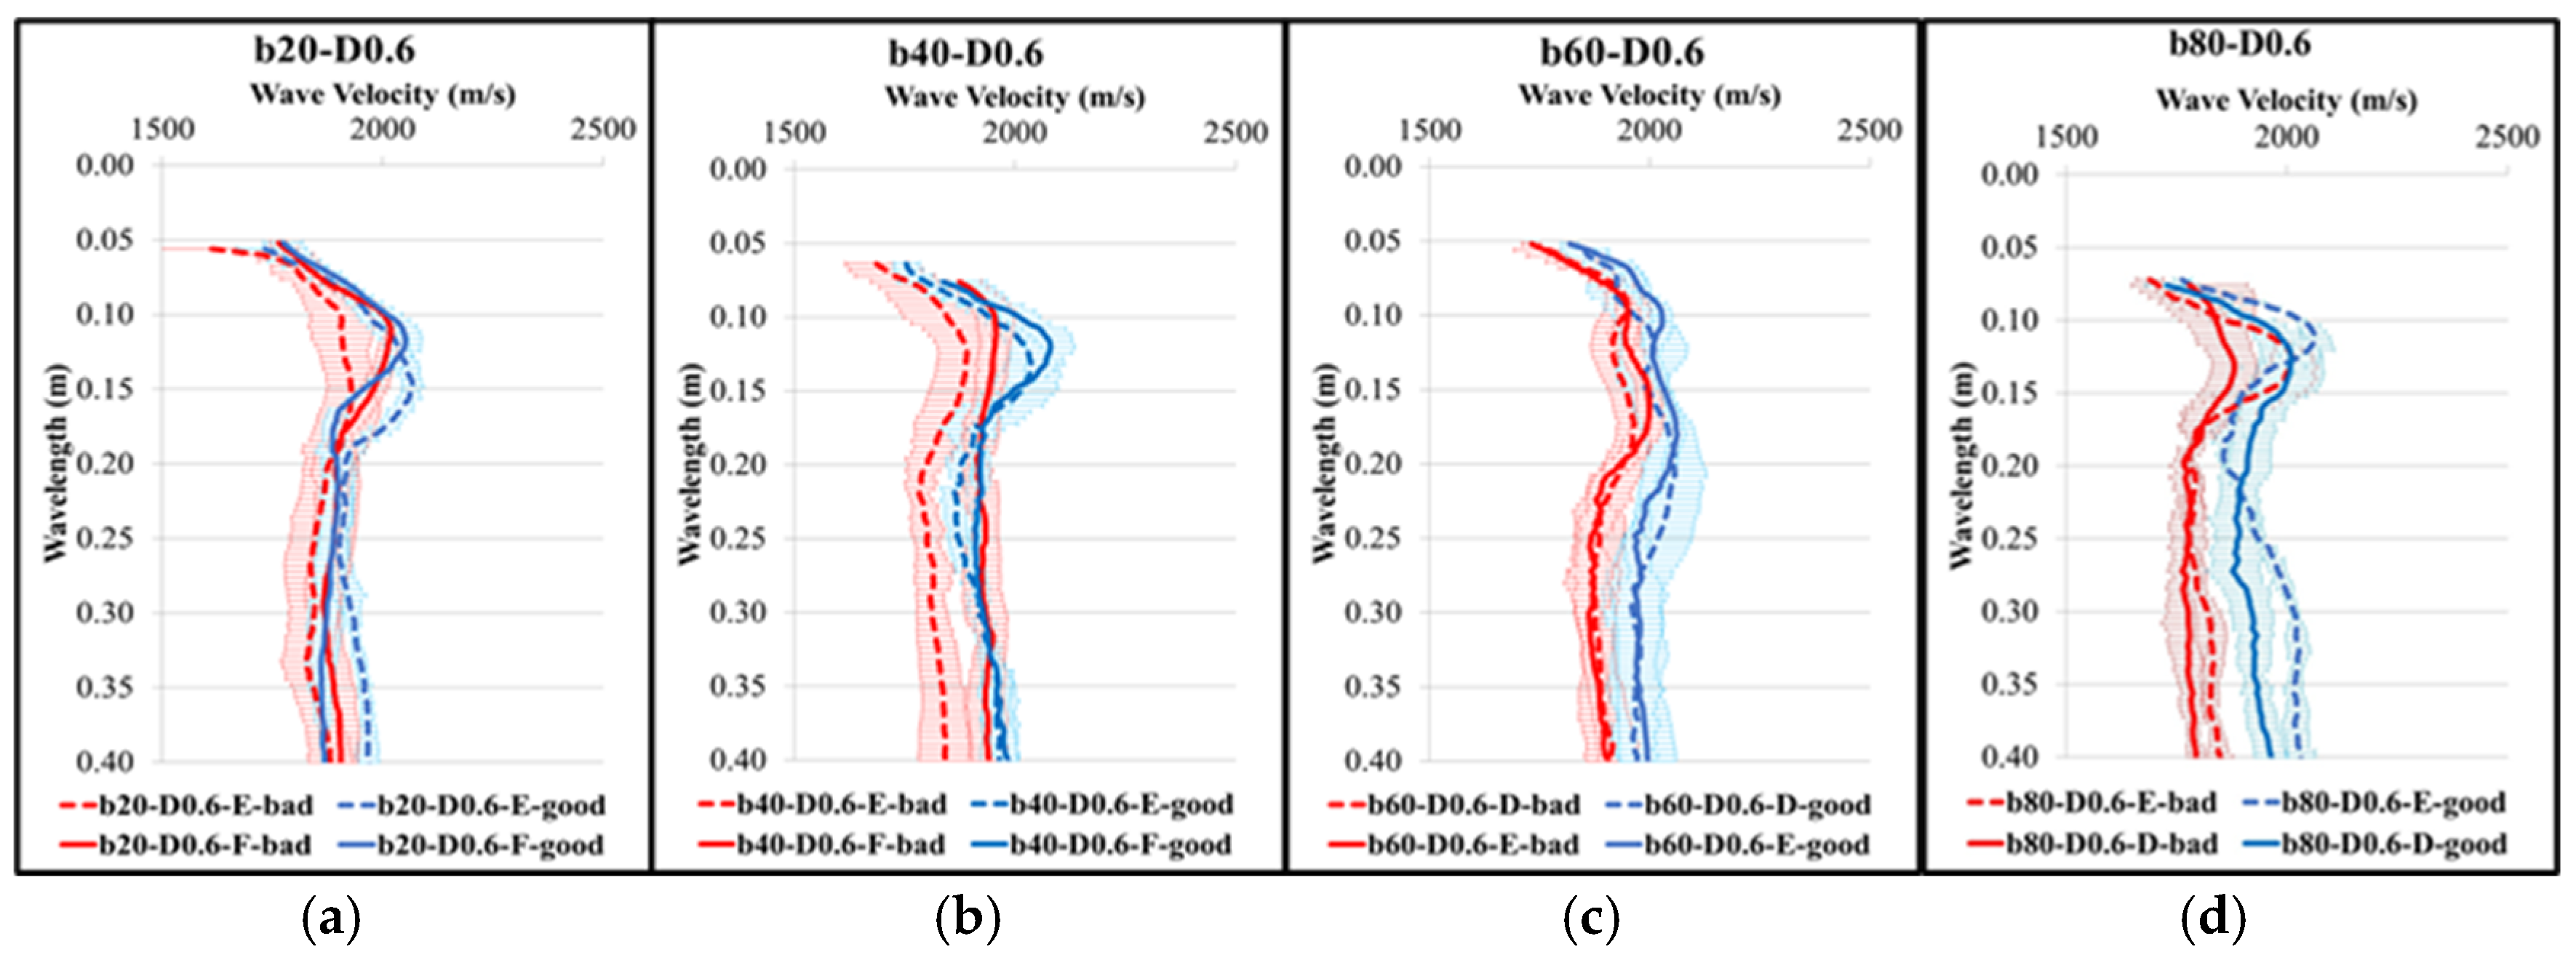
Figure 5 compare the means and one standard deviation of the dispersion curves from cold joint “pass” and “avoid” tests for each void scenario. Specifically,
Figure 4 presents data for a 0.4 m impactor–receiver distance with a 5 mm impactor, while
Figure 5 shows curves for a 10 mm impactor. Under the experimental conditions shown in the figure, the obtained data exhibited lower variability and enabled clearer differentiation among porosity levels, as summarized below:
20% porosity: Wave velocity differences were more pronounced within the 0.1–0.2 m wavelength range, allowing distinction from higher porosity groups in this interval.
40% porosity: Significant velocity differences also appeared in the 0.1–0.2 m wavelength range, with larger differences than those at 20% porosity, further enabling differentiation from higher porosity groups.
60% porosity: Beyond 0.15 m and 0.2 m wavelengths, the velocity differences tended to stabilize, and the values were clearly greater than those at lower porosity levels. At
80% porosity: Beyond 0.15 m and 0.2 m wavelengths, the velocity differences also stabilized, with values markedly larger than those at all other porosity levels.
4. Conclusions
This study evaluated the bonding condition of concrete slabs with 20% to 80% porosity at cold joint interfaces using surface wave dispersion velocity profiles. We employed a dual-receiver setup, comparing waveform and dispersion characteristics along test lines that both crossed and avoided cold joints. The experiments utilized 5 mm and 10 mm diameter impactors and 0.4 m and 0.6 m impactor–receiver distances.
The experimental results show that for porosity levels of 20% and 40%, wave velocity decreased within the short-wavelength range, whereas for porosity levels of 60% and 80%, more significant and stable velocity reductions were observed across the entire wavelength range. These findings indicate that higher porosity at the cold joint interface leads to greater reductions in wave velocity. Future research will focus on naturally formed cold joints and will seek to correlate those results with the present study to estimate the corresponding void ratios of naturally formed cold joints.
Author Contributions
Conceptualization, C.-C.C.; methodology, C.-C.C. and Y.-C.L.; software, C.-C.C. and Y.-C.L.; validation, H.-Y.C.; formal analysis, H.-Y.C.; investigation, C.-C.C. and H.-Y.C.; data curation, H.-Y.C.; writing—original draft preparation, H.-Y.C.; writing—review and editing, C.-C.C. and Y.-C.L. All authors have read and agreed to the published version of the manuscript.
Funding
The research was funded by the National Science and Technology Council, Republic of China (Taiwan), under Contract No. 111-2221-E-324-007-MY3.
Institutional Review Board Statement
Not applicable.
Informed Consent Statement
Not applicable.
Data Availability Statement
The data that support the findings of this study are available from the corresponding author upon reasonable request.
Conflicts of Interest
The authors declare no conflicts of interest.
Reference
- Cheng, C.-C.; Lin, Y.-C.; Ke, Y.-T.; Ke, F.-J. Using 3-D velocity contour plots to detect voids in grouted tendon ducts in post-tensioned concrete construction. Constr. Build. Mater. 2022, 331, 127277. [Google Scholar]
| Disclaimer/Publisher’s Note: The statements, opinions and data contained in all publications are solely those of the individual author(s) and contributor(s) and not of MDPI and/or the editor(s). MDPI and/or the editor(s) disclaim responsibility for any injury to people or property resulting from any ideas, methods, instructions or products referred to in the content. |
© 2025 by the authors. Licensee MDPI, Basel, Switzerland. This article is an open access article distributed under the terms and conditions of the Creative Commons Attribution (CC BY) license (https://creativecommons.org/licenses/by/4.0/).
