Abstract

Surface Soil Moisture Evaluated from Satellite Multispectral Optical Data Through Visible and Shortwave Drought Index and Its Comparison with Microwave-Based Soil Moisture Products †

“Nello Carrara” Applied Physics Institute, National Research Council of Italy (CNR-IFAC), 50019 Sesto Fiorentino, Italy
*
Author to whom correspondence should be addressed.
Presented at the 18th International Workshop on Advanced Infrared Technology and Applications (AITA 2025), Kobe, Japan, 15–19 September 2025.
Proceedings 2025, 129(1), 29; https://doi.org/10.3390/proceedings2025129029
Published: 12 September 2025

Abstract

Soil moisture is a key parameter in several applications, from land management to emergency response. Microwave-based soil moisture products are already provided daily, yet at 1 km resolution. Optical remote sensing could be a complementary source of information at higher spatial resolution (10–100 m), but most studies have been limited to highly homogeneous scenarios. In this paper, the potential of optical images to assess soil moisture in a highly fragmented scenario is investigated. Landsat-8 optical data were processed to retrieve the Visible and Shortwave Drought Index (VSDI) over an area with heterogeneous land cover. Results were compared with the Copernicus Soil Water Index (SWI) product, showing a moderate correlation (Pearson coefficient equal to 0.402) that however increased to 0.668 if only bare soil pixels were selected.

1. Introduction

Soil moisture is a key parameter in several application fields, from water supply management to agriculture, and from the prevention and mitigation of extreme events like floods, fires, and droughts to climatological and hydrological studies [1].
Remote sensing techniques offer considerable advantages for providing useful information to assess soil moisture content and for monitoring its distribution and temporal evolution from a regional to a global scale. Microwave (MW) remote sensing techniques and methods can be regarded as an already well-established tool to assess soil moisture content, although in some cases the results can be affected by vegetation cover and soil roughness [2]. While methods based on microwave remote sensing from satellites have already achieved a high degree of maturity, providing daily soil moisture products at 1 km spatial resolution, optical remote sensing has been proposed as a complementary source of information at higher spatial resolution (10–100 m) in several studies. The latter, however, has mainly been conducted in controlled conditions or very specific scenarios [3]. Thus, the actual capability of optical remote sensing in a complex, highly fragmented real case scenario is still an open issue.
In this paper, we analyze a multitemporal sequence of Landsat-8 images to compare the performances of the Visible and Shortwave Infrared Drought Index (VSDI) that in a previous study [4] was demonstrated to be the most promising among other indexes for soil moisture evaluation in an agricultural area with heterogeneous land cover. In particular, here we compare the performance of VSDI with the Soil Water Index (SWI) Copernicus product [5], which has a higher spatial resolution (1 km) with respect to the Global Land Data Assimilation System (GLDAS) 2.1 used in [4].

2. Materials and Methods

2.1. Study Area

The study area (Figure 1a) is an agricultural area, featuring cultivated fields and forested patches, and it is located in south-western Tuscany, near Grosseto, Italy (Long. 11.2515–11.519 E, Lat. 42.525–42.688 N). It corresponds to an area of about 20 km × 20 km.

2.2. Data

The dataset is a multi-temporal sequence of 31 images acquired over the study area in the summer season (June to September) from 2017 to 2020 by the Operative Land Imager (OLI) sensor. The latter operates on board the Landsat-8 and has a spatial resolution of 30 m with 9 spectral channels in the visible, near-infrared and the Short Wavelength Infrared (SWIR). The images have already been preprocessed at L2 level by NASA (Washington, D.C., USA). All the images have a cloud coverage lower than 10%.
The validation dataset consists of the surface moisture information provided daily by the Copernicus SWI-002 (Soil Water Index at surface level) product, based on the MW images acquired by the ASCAT and SAR sensors operating on the METOP operated by the European Organisation for the Exploitation of Meteorological Satellites (EUMETSAT), Darmstadt, Germany and Sentinel-1 platforms managed by the European Space Agency (ESA), Paris, France, respectively, as described in [5]. Figure 1b shows the average value of surface soil moisture evaluated in the study area by the SWI-002 index in correspondence with the Landsat acquisition days during the summer season of 2017–2020.

2.3. Methodology

The images were co-registered with SWI-002 moisture maps and segmented into four classes (bare soil, vegetation, clouds, cirrus, cloud shadow areas). The images were processed with a low-pass filter with an adequate transfer function to simulate an acquisition with a spatial resolution of 1 km, consistent with SWI-002 Copernicus images. The images were then masked in order to retain only bare soil and vegetated areas.

3. Results

The whole dataset, constituting 31 images, was used to generate surface moisture maps by applying the VSDI algorithm [6]. The whole set of VSDI values was compared to the corresponding whole set of SWI values (pixel by pixel, for each map) and the correlation of the whole VSDI dataset was evaluated against the whole SWI dataset by means of the Pearson coefficient. The same procedure was also applied to the three data subsets: (1) only vegetated pixels, (2) bare soil and poorly vegetated pixels, and (3) only bare soil pixels. These subsets were selected by means of suitable Normalized Difference Vegetation Index (NDVI) threshold values applied to the dataset [7,8,9].
Table 1 reports the Pearson correlation coefficients obtained for the whole dataset and for the three additional sub-sets containing different proportions of vegetated and of bare soil pixels. It is apparent that the correlation between the (optical-based) VSDI data and the (MW-based) SWI data increases considerably when applied to bare soil areas: the Pearson correlation coefficient increases up to 0.668 for the bare soil pixels subset.
The normalized VSDI values and the SWI values, ranging from 0 to 1 and from 0 to 100, respectively, were divided into 20 classes. Figure 2 shows three-dimensional SWI-VSDI scatterplots that report the number of pixels (z-axis) of the whole dataset belonging to each SWI-VSDI class pair. These scatterplots highlight lower correlation for the whole dataset (Figure 2a) compared to the subset with bare soil pixels (Figure 2b), which has a lower data dispersion. Vegetation effects were further investigated and accounted for by assimilating vegetation-related parameters, leading to preliminary results with an improvement of the Pearson correlation coefficient of up to 0.80.

4. Conclusions

VSDI values calculated on a multitemporal sequence of Landsat images, acquired in an agricultural area with heterogeneous land cover, showed a moderate correlation (Pearson coefficient equal to 0.402) with Copernicus-provided SWI data at a spatial resolution of 1 km. The correlation, however, increased considerably if only bare soil pixels were selected, reaching a value of 0.668. This demonstrated a considerable effect of vegetated areas on the results. In the next steps, the assimilation of vegetation-related parameters will be considered to mitigate this effect and improve the correlation between optical-based and MW-based soil moisture data.

Author Contributions

Conceptualization, R.C., S.B. and V.R.; methodology, R.C., S.B. and V.R.; software, R.C.; validation, R.C., S.B. and V.R.; formal analysis, R.C., S.B. and V.R.; investigation, R.C., S.B. and V.R.; resources, V.R.; data curation, R.C.; writing—original draft preparation, R.C. and V.R.; writing—review and editing, R.C., S.B. and V.R.; visualization, R.C. and V.R.; supervision, V.R.; project management, V.R.; funding acquisition, V.R. All authors have read and agreed to the published version of the manuscript.

Funding

This study was carried out within the Space It Up project funded by the Italian Space Agency, ASI, and the Ministry of University and Research, MUR, under contract n. 2024-5-E.0-CUP n. I53D24000060005.

Institutional Review Board Statement

Not applicable.

Informed Consent Statement

Not applicable.

Data Availability Statement

The original data presented in the study are openly available at https://earthexplorer.usgs.gov (accessed on 10 September 2024) and https://land.copernicus.eu/en/products/soil-moisture?tab=soil_water_index (accessed on 13 January 2025).

Conflicts of Interest

The authors declare no conflicts of interest.

References

  1. Bolten, J.D.; Crow, W.T.; Zhan, X.; Jackson, T.J.; Reynolds, C.A. Evaluating the Utility of Remotely Sensed Soil Moisture Retrievals for Operational Agricultural Drought Monitoring. IEEE J. Sel. Top. Appl. Earth Obs. Remote Sens. 2010, 3, 57–66. [Google Scholar] [CrossRef]
  2. Xing, M.; Chen, L.; Wang, J.; Shang, J.; Huang, X. Soil Moisture Retrieval Using SAR Backscattering Ratio Method during the Crop Growing Season. Remote Sens. 2022, 14, 3210. [Google Scholar] [CrossRef]
  3. Jackson, T. Vegetation Water Content Mapping Using Landsat Data Derived Normalized Difference Water Index for Corn and Soybeans. Remote Sens. Environ. 2004, 92, 475–482. [Google Scholar] [CrossRef]
  4. Gonnelli, A.; Carlà, R.; Baronti, S.; Raimondi, V. Near-Infrared and Short-Wavelength Infrared-Based Indices to Monitor Soil Moisture from a Satellite: A Comparative Analysis. Eng. Proc. 2023, 51, 29. [Google Scholar] [CrossRef]
  5. Marschallinger, B.B.; Paulik, C.; Jacobs, T. Soil Water Index Product User Manual-Copernicus Global Land Operations. Available online: https://land.copernicus.eu/en/technical-library/product-user-manual-soil-water-index (accessed on 13 January 2025).
  6. Zhang, N.; Hong, Y.; Qin, Q.; Liu, L. VSDI: A Visible and Shortwave Infrared Drought Index for Monitoring Soil and Vegetation Moisture Based on Optical Remote Sensing. Int. J. Rem. Sens. 2013, 34, 4585–4609. [Google Scholar] [CrossRef]
  7. Tucker, C.J. Red and photographic infrared linear combinations for monitoring vegetation. Rem. Sens. Environ. 1979, 8, 127–150. [Google Scholar] [CrossRef]
  8. Richardson, A.J.; Wiegand, C.L. Distinguishing vegetation from soil background information. Photogram. Eng. Rem. Sens. 1977, 43, 1541–1552. [Google Scholar]
  9. Huete, A.R.; Jackson, R.D.; Post, D.F. Spectral response of a plant canopy with different soft backgrounds. Rem. Sens. Environ. 1985, 17, 37–53. [Google Scholar]
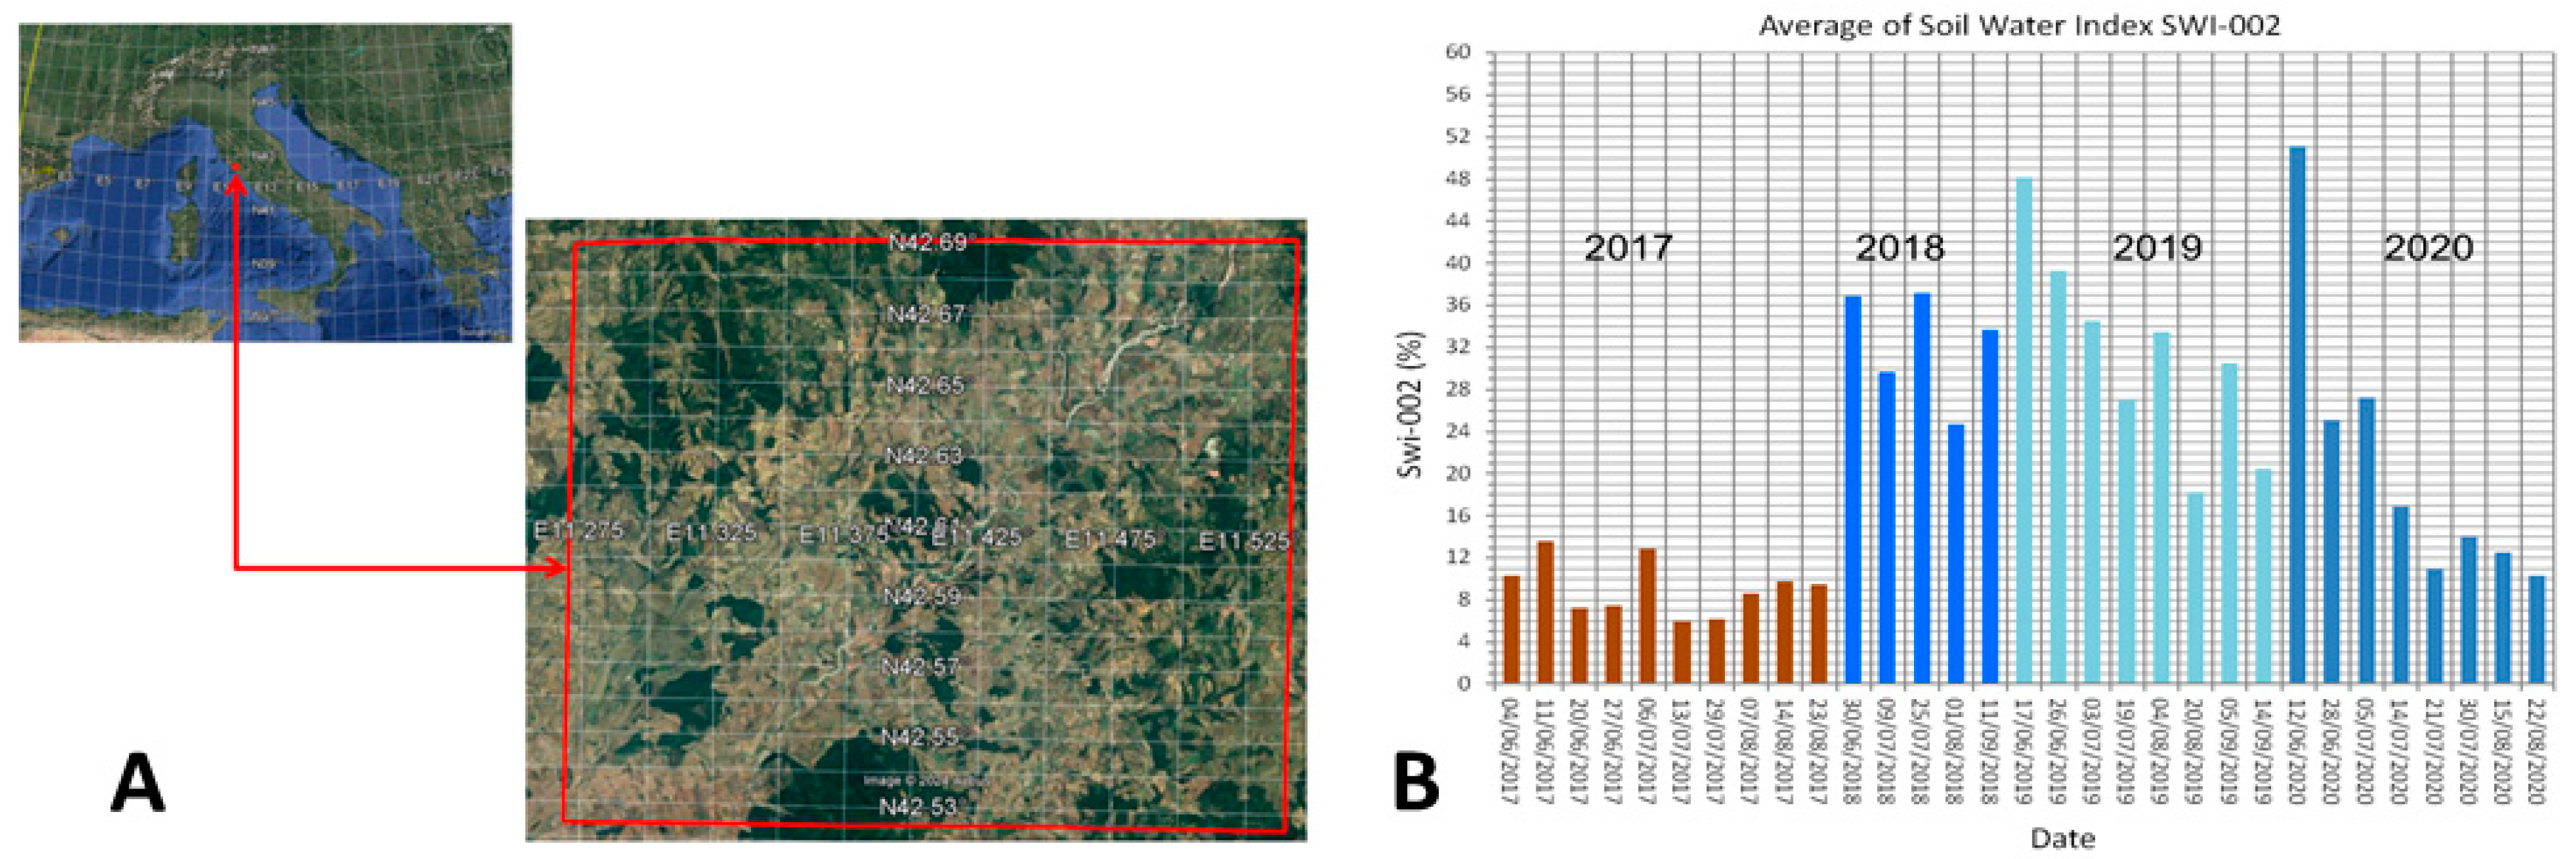
Figure 1. (a) Study area located in south-western Tuscany, near the town of Grosseto, Italy. (b) Average SWI-002 surface moisture product in the study area from 2017 to 2020 (summer season).
Proceedings 129 00029 g001
Figure 2. Three-dimensional scatterplots of SWI-VSDI classes for (a) whole dataset and (b) only bare soil pixels.
Proceedings 129 00029 g002
Table 1. Pearson correlation coefficient between SWI and VSDI for the whole dataset and different data subsets with different numbers of pixels corresponding to bare soil areas.
VSDIVSDI
NDVI > 0.4
VSDI
NDVI ≤ 0.4
VSDI
NDVI ≤ 0.35
Datasetwhole datasetonly vegetated areasbare soil and poorly vegetated areasbare soil
Pearson coefficient0.4020.4190.6300.668
Number of pixels17,30510,37968663250
Disclaimer/Publisher’s Note: The statements, opinions and data contained in all publications are solely those of the individual author(s) and contributor(s) and not of MDPI and/or the editor(s). MDPI and/or the editor(s) disclaim responsibility for any injury to people or property resulting from any ideas, methods, instructions or products referred to in the content.