1. Introduction
The public sector of the future will be structured by “smart” governments, creating public value with a steady flow. The design of public sector reform depends on the ability of a government to anticipate the needs of citizens. Currently, most public administration reforms do not arise from an early understanding of new needs, but rather in response to the crises that occasionally emerge when those new needs are not met.
The challenge for governments is to shift their action from opportunistic to more strategic reforms, i.e., to develop a clear vision, create coherent links with civil servants, establish tactics to achieve results, and communicate this vision and the expected benefits to the public sector and, thus, to citizens. They should also motivate civil servants to have a more proactive and less executive role and, in this way, contribute to the business innovation of the public sector, which will be consolidated through the channels of institutional communication.
2. Purpose and Objectives
In recent decades, the concept of innovation has exploded to the forefront of the public sector [
1,
2]. Governments, faced with pressures from economic constraints, seek to find solutions to problems that appear complex. According to Lewis et al. [
3], these governments are resorting to innovation, as a means to address the complexity of these challenges. Although innovation may be seen as problematic in government contexts, given that it has strong normative positive implications on the one hand, and presents significant challenges to traditional bureaucratic processes on the other, it is a concept that has become prevalent around the world.
This article aims to become a filter to highlight the foci where innovation is born, as well as possible pathways for its consolidation. It aims to suggest a “human-centered” approach to its successful consolidation and to demonstrate that it is the result of a complex creative achievement.
Furthermore, this article will attempt to clarify the limits of the discretion of the civil servant in the workplace, of his individual creativity, as well as of any innovation that he is currently called upon to apply, when it is available and, as he perceives it. This article also aims to act as a filter to promote communication channels of innovation in the public sector, in order to demonstrate the need to invest in training, in institutionalizing and integrating creative practices, in promoting intersectoral knowledge exchange, and in adopting the principle of open communication [
4].
Another objective of this paper is to highlight the need to adopt the principles of transformational leadership for open innovation, in order for the public sector to manage innovation in a more effective and proactive way in the governance of the digital age [
5].
The effectiveness of public sector organizations continues to be a major challenge for governments around the world. Leaders with a vision of creating agile and efficient public governance mechanisms are embracing public sector entrepreneurship (Hayter et al., 2018) and aiming to establish mission-oriented innovation policy [
6,
7].
The consolidation of innovation will appear to depend on the credibility of the transmitter, in this case, the public administration. Thus, political and administrative leadership will be persuaded to invest in communication channels for innovation, both internally and externally, in order to enhance its organizational flexibility.
3. Materials and Methods
In particular, this survey aimed to highlight the respondents’ knowledge about the existence of a strategy in their organization, the protocols and partnerships that the public sector should develop, as well as the problems faced in relation to the adoption and implementation of an innovation strategy, the respondents’ attitude towards the adoption of individual innovation behaviors, the extent to which individual creativity is demonstrated on a daily work basis, and the employees’ attitude towards the organizational climate in their working environment. Additionally, the influence of demographic characteristics on the survey variables is being examined.
In detail, this study involves primary quantitative research, which was conducted using a structured questionnaire of 30 closed-ended questions, all of which were optional.
Questions
The scales used were the ordinal scales, because they allow for the subsequent statistical processing and analysis of the results. In particular, the following scales were used:
- -
Simple choice scales, to select one answer from a range of suggested answers (“Yes”, “No”, “I am not sure”) and the possibility of an open response in case of agreement.
- -
Likert scales, where the respondent was asked to indicate their degree of agreement with a formulated affirmative statement, on a scale of five values from “strongly disagree” to “strongly agree”, in order to ascertain his/her attitude towards the public administration and the degree of satisfaction with his/her job performance.
- -
Matching questions, where the respondent was asked to choose from a series of formulated affirmative sentences, giving him a free choice of the number of answers or the alternative “other”.
- -
Open-ended questions, such as “What objectives do you think an innovation strategy in the public sector should pursue?” in order to capture participants’ beliefs, desires and expectations for the implementation of an innovation strategy in the public sector. The open-ended questions allow participants to express their opinions, ideas and experiences in a way that is not constrained by predefined options. This can lead to rich and varied information.
5. Analysis of Results—Findings
5.1. Analysis of Sample Demographics
The first section of the questionnaire includes questions related to the demographic characteristics of the sample of the population under study, in this case civil servants. The purpose of this section is to clarify the main characteristics of the sample individuals and thereby create a comprehensive picture of them. All the frequency estimates of this part of the questionnaire are presented below.
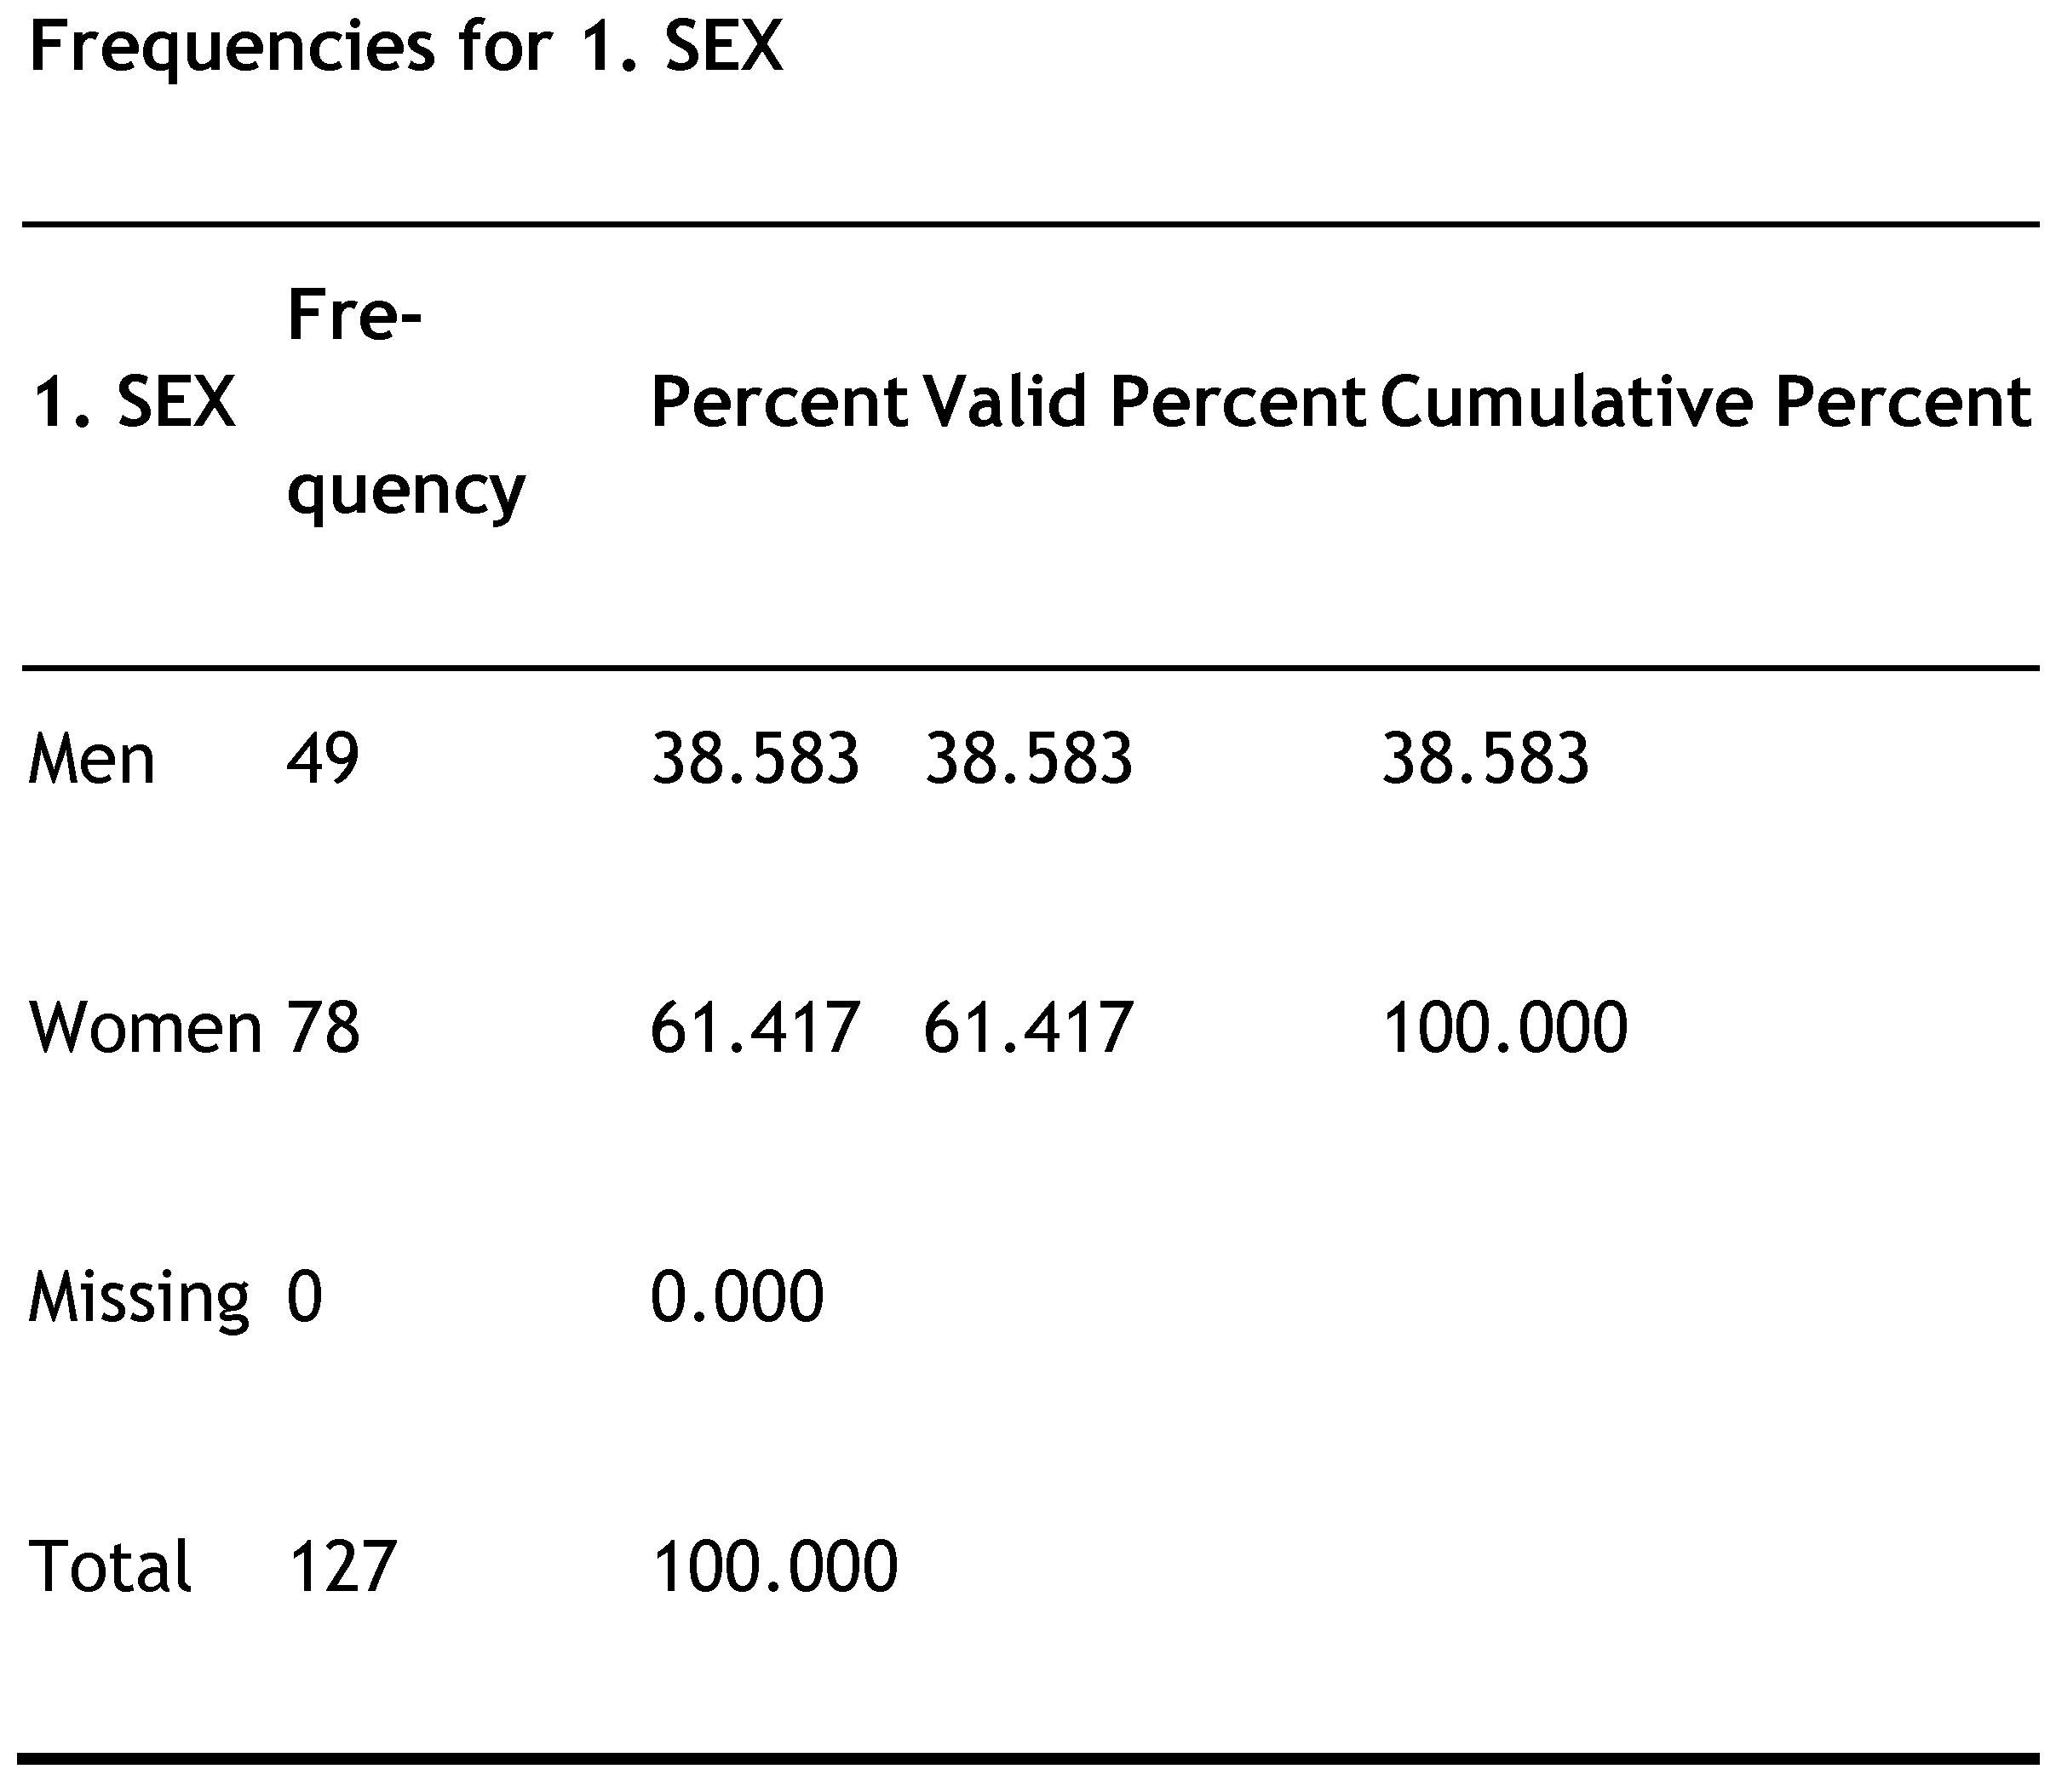
Gender: As can be seen from the tables below, the largest proportion of people who took part in the survey were of the female gender. Specifically, 127 civil servants participated in the survey, of which 78 were female, representing 61.4% of the total respondents. The corresponding figure for men was 38.5% (49 men) (
Figure 1).
Age: People of all ages participated in the survey, the majority of whom (44.09%) belonged to the age group of 46–55 years, but it is noteworthy that the age group from 36 to 45 years made up 43.3% of the participants. This was followed by the 26–35 group with 5.5%, the 56–65 group with 4.7%, and the 18–25 group with 2.3%.
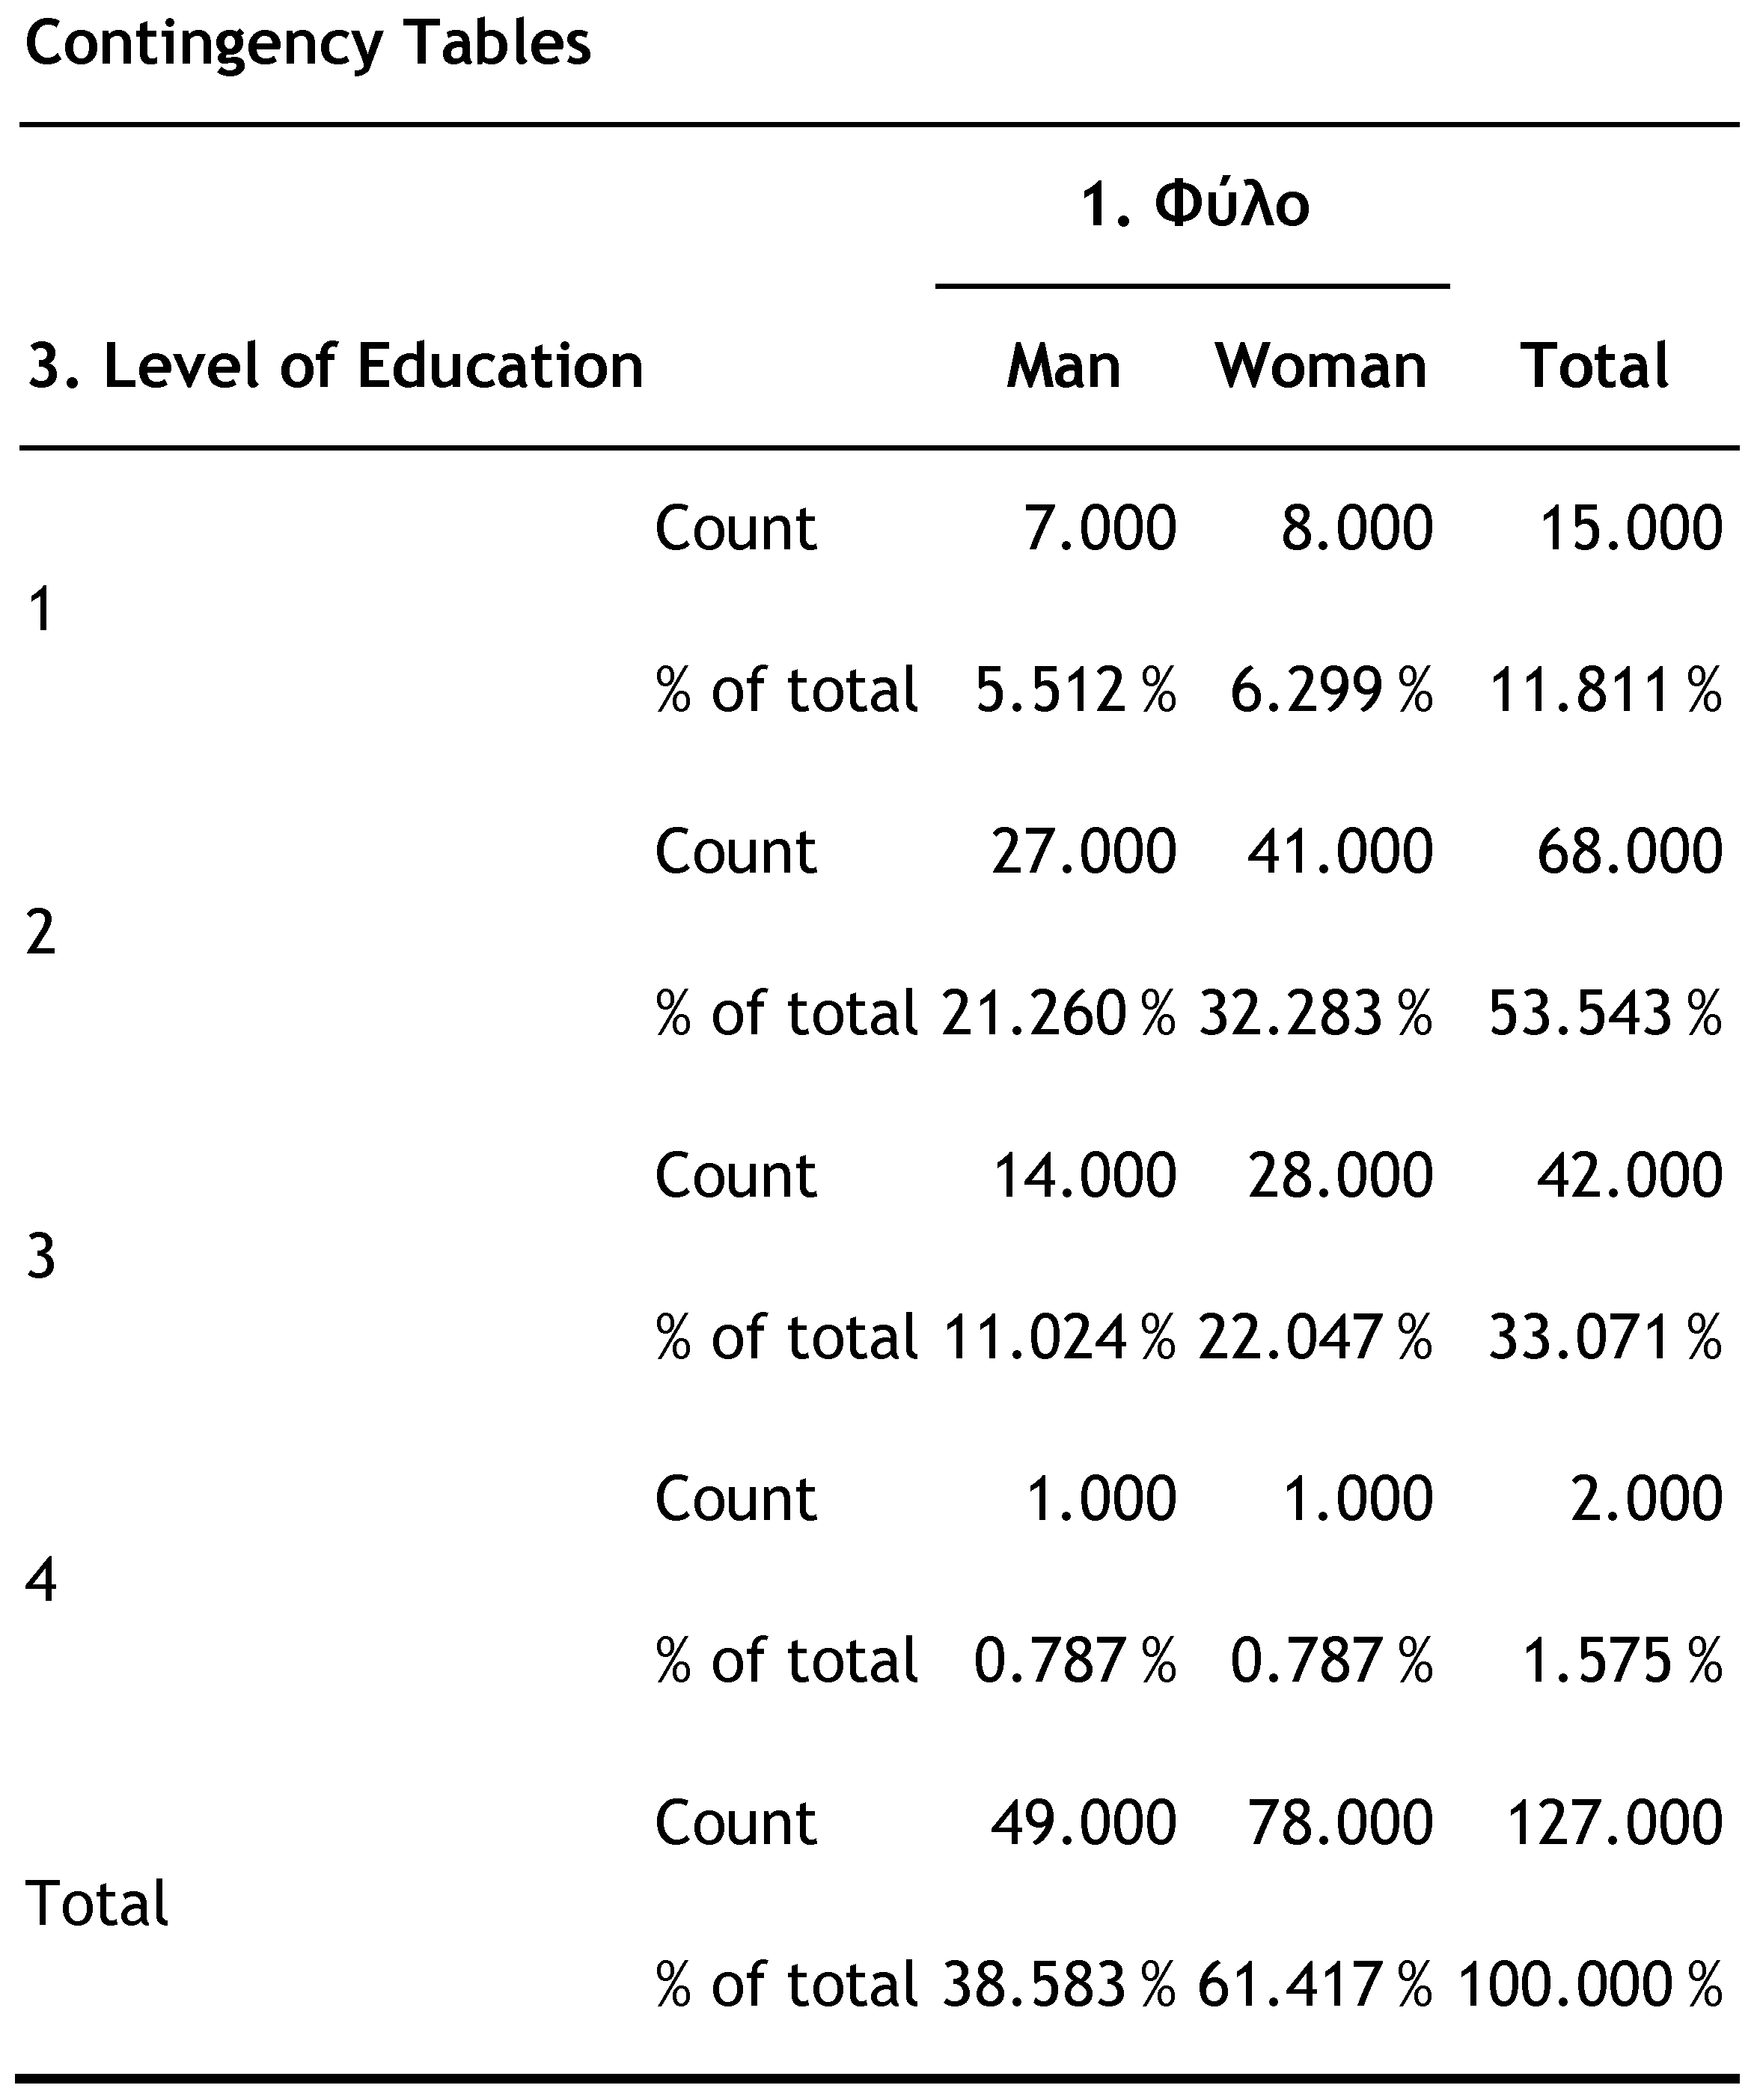
Educational level: The largest percentage of respondents (53.5%) hold a higher education degree, while it is worth mentioning that 33.07% hold a master’s degree and that two respondents (1.5%) hold a PhD. Finally, 15 respondents (11.8%) are high school graduates (
Figure 2).
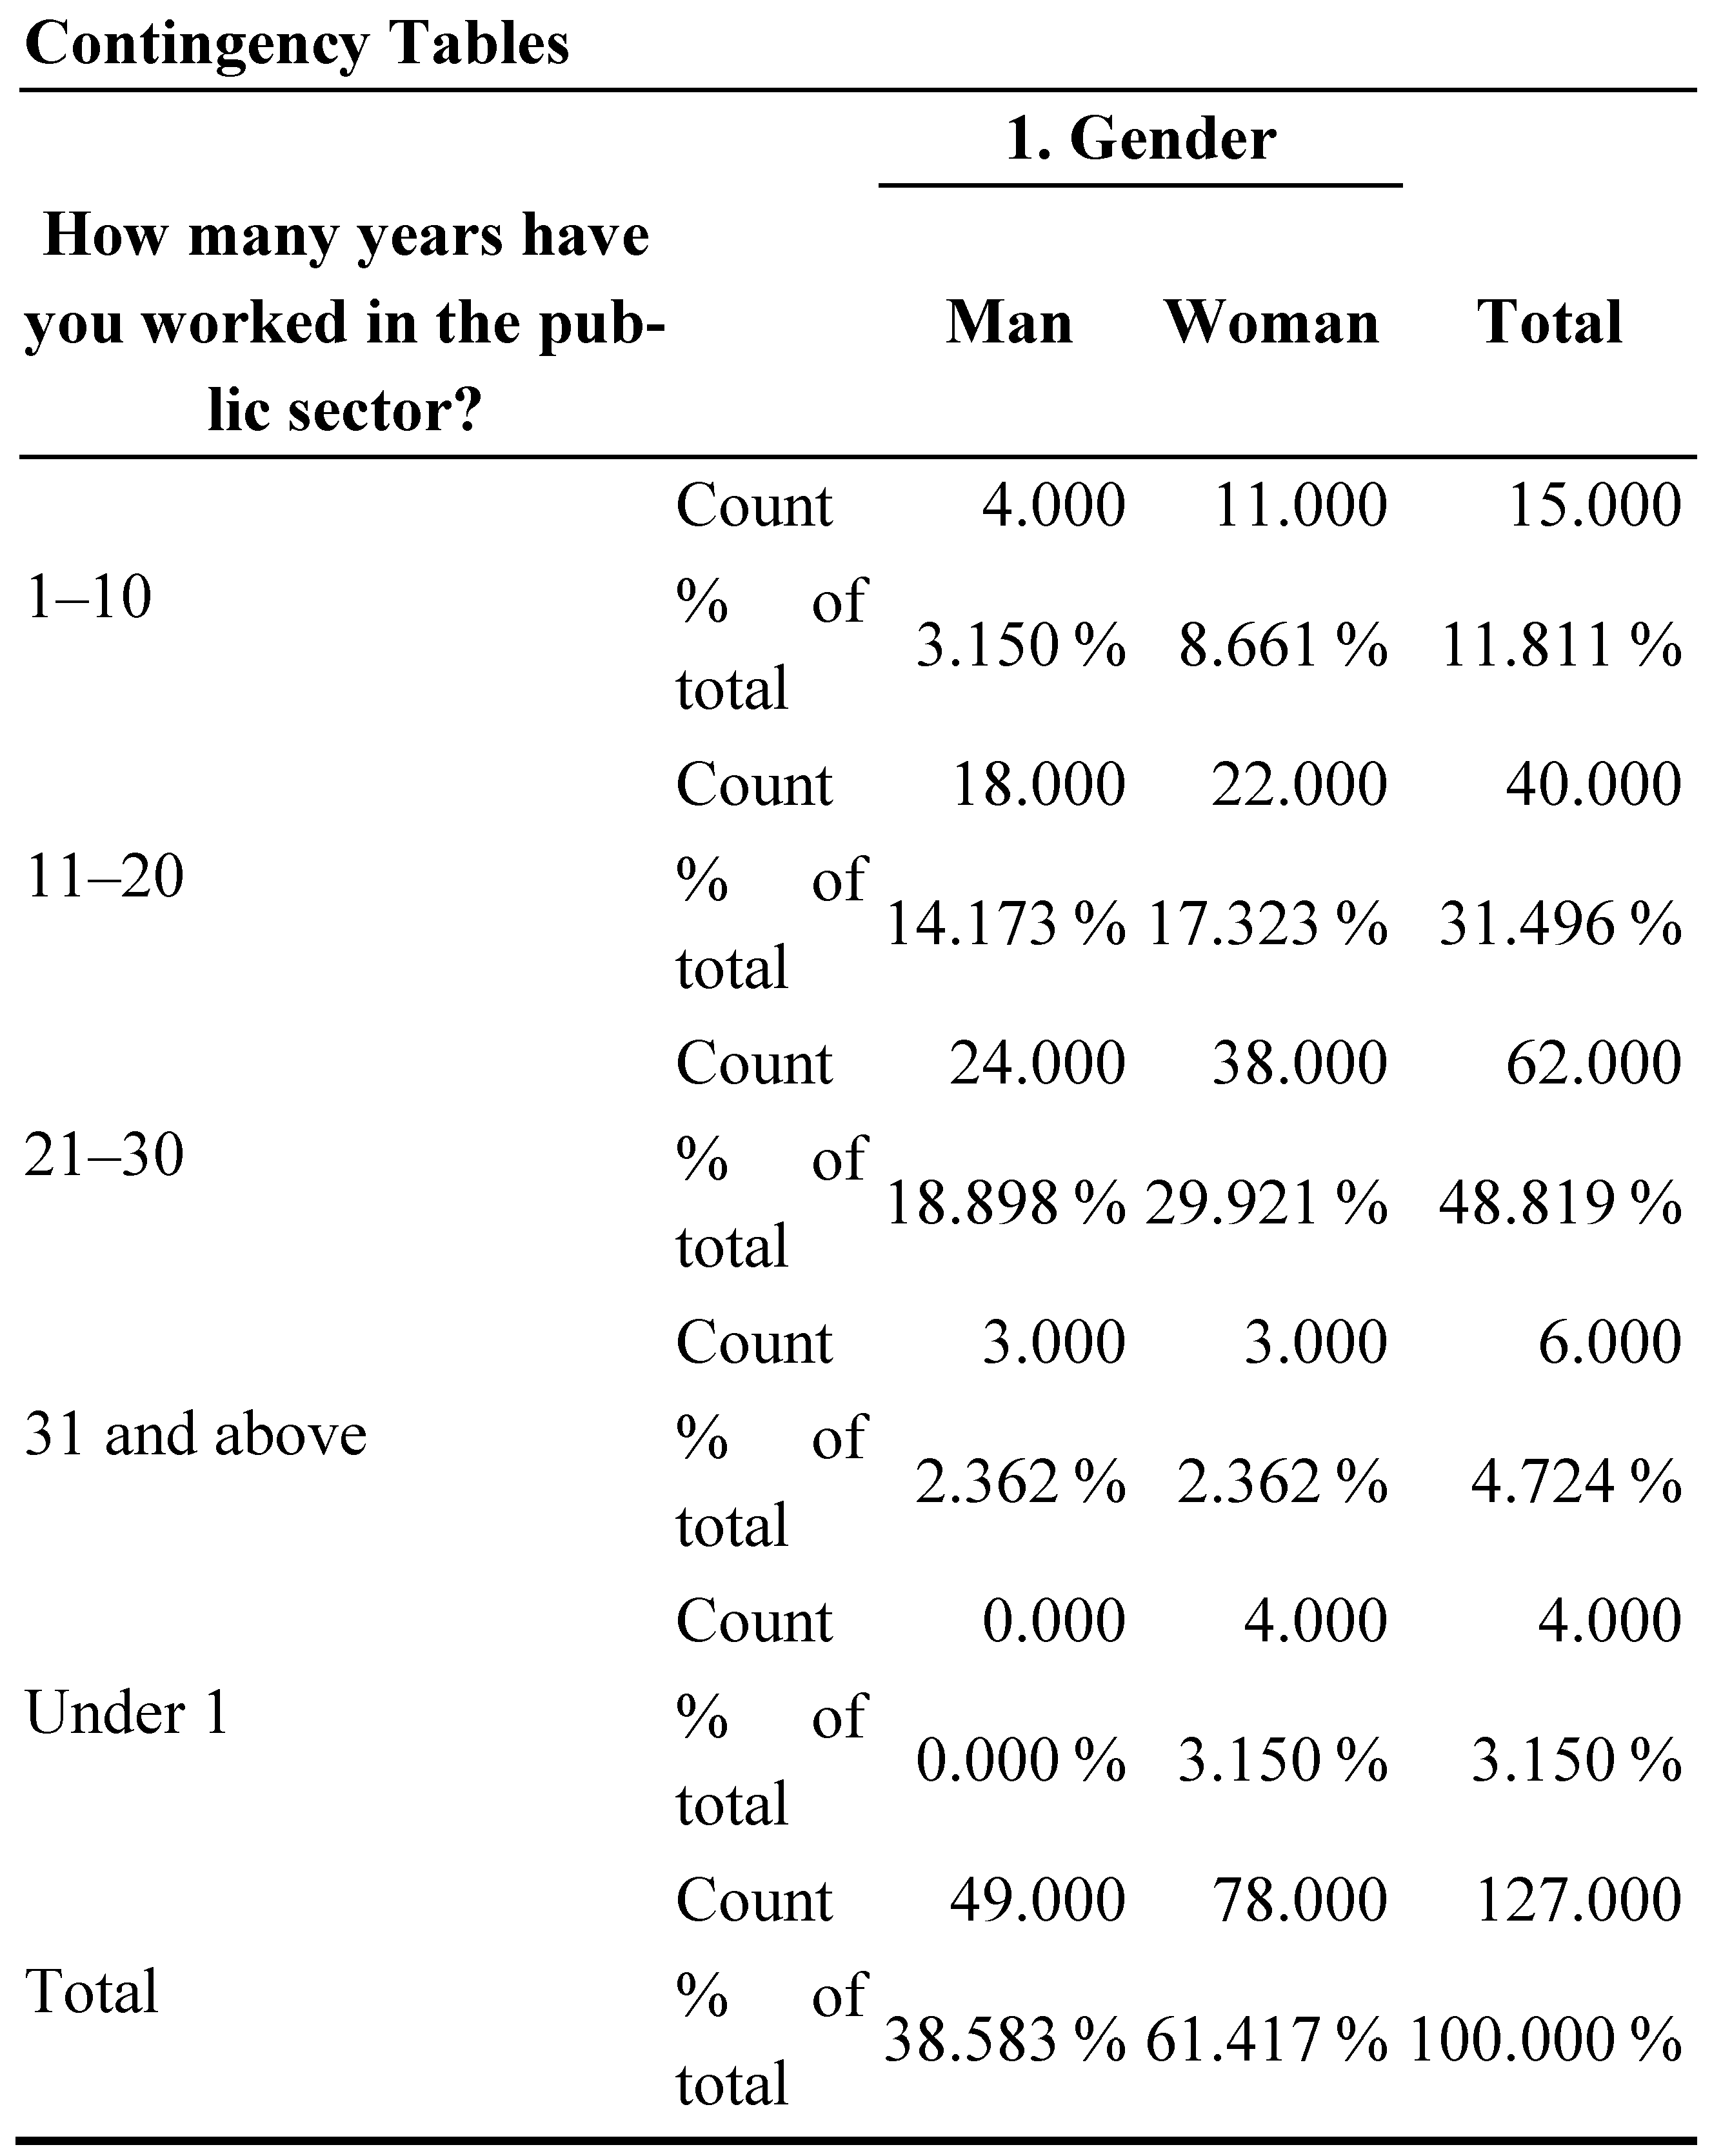
Employment: The vast majority of the participants (85.7%) are employed in the public sector with a permanent contract, 10.3% are employed under a private contract of indefinite duration, and 3.9% are employed under a private contract of fixed duration. It is worth noting that 48.8% of the respondents have worked in the public sector for 21–30 years, 31.49% have worked in the public sector for 11–20 years, 11.8% belong to the category of those employed in the public sector for 1–10 years, 4.7% belong to the category of civil servants with a tenure of 31 years or more, while 3.15% of the respondents have less than 1 year of experience in the public sector (
Figure 3).
5.2. Testing Research Hypotheses
The testing of research hypotheses will be performed through the correlation of the individual variables. Correlation expresses how strong the relationship between two variables is. If the two variables are moving in the same direction, the correlation is positive. If they move in opposite directions, the correlation is characterized as negative. If the result equals zero, then there is no relationship between them. The correlation index is the statistical criterion we use to determine whether there is an interdependence (correlation) between two variables. The information we obtain from the correlation index is (1) whether there is an interdependence (correlation), (2) the type of correlation, and (3) the degree of correlation. The correlation between two variables can be attributed in two ways, as (a) a numerical value and (b) a graphical representation.
Analysis of frequency of use and satisfaction indicators
Reliability check by means of Cronbach’s alpha internal consistency index
The reliability analysis of the questionnaire was performed to ensure the consistency of the questionnaire and, thus, the reliability of the research. It was preceded by a statistical analysis of the participants’ responses, in order to measure and analyze the reliability of the data.
The reliability of the internal consistency in both a subscale and a whole scale is assessed by Cronbach’s alpha coefficient, which indicates the homogeneity of a scale. To be considered acceptable, the Cronbach’s alpha value must be >0.7. The higher the value of the Cronbach’s alpha coefficient, the more reliable the internal consistency [
11].
The results
of the reliability test of
Section 3 for the variables of the questionnaire related to individual innovation behavior, as shown below, show consistency, as the Cronbach’s alpha is 0.885 (
Figure 4). The results of the reliability test for the relevance of the questions in
Section 4 concerning individual creativity show consistency as well, as the Cronbach’s alpha is 0.830, which is also higher than 0.70 (
Figure 5).
The results of the reliability test for the relevance of the questions in
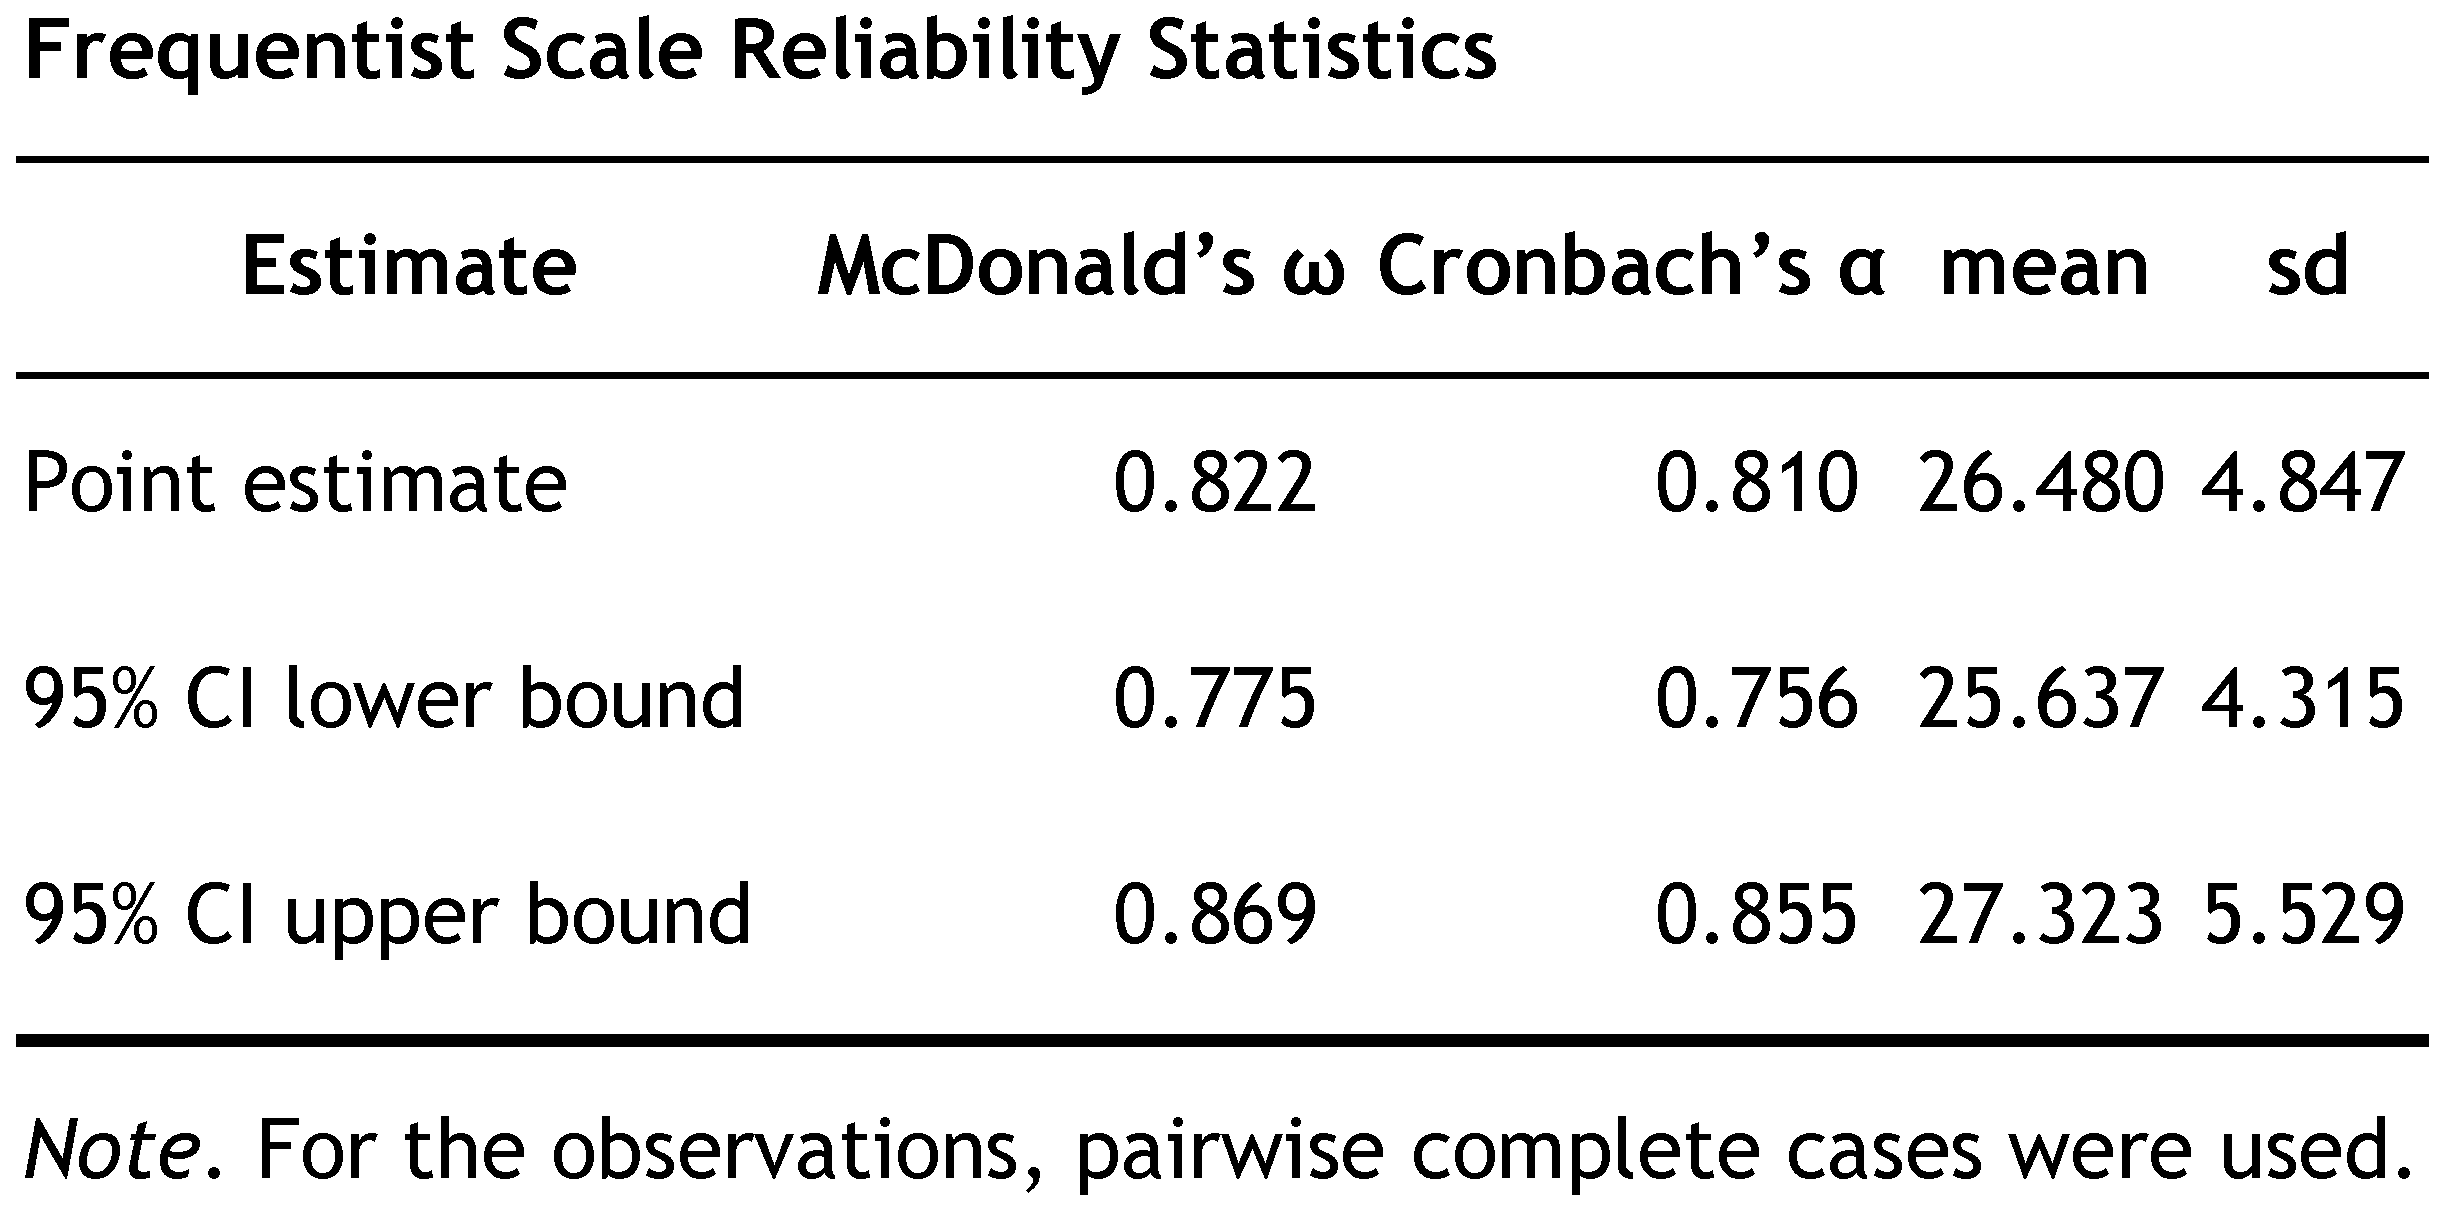
Section 5 concerning the organizational climate of the public institution where the respondents are employed also show an
increased Cronbach’s alpha, as it reaches 0.810 (
Figure 6). From the values of the alpha index, it can be seen that the general index exceeds the value of 0.7, which advocates the use of the survey data for safe inference, since the data were collected with a questionnaire, which the analysis proved to be reliable.
Testing Research Hypotheses
The research aims to highlight the knowledge and views of the respondents regarding the innovation strategy in the public sector, individual behavior and creativity, as well as the organizational work climate.
Figure 4.
Individual innovation behavior—reliability index.
Figure 4.
Individual innovation behavior—reliability index.
Figure 5.
Individual creativity—credibility check.
Figure 5.
Individual creativity—credibility check.
Figure 6.
Organizational climate—reliability control.
Figure 6.
Organizational climate—reliability control.
5.3. Statistical Analysis—Innovation in the Public Sector
The first group of questions in this part of the questionnaire concerned innovation in the public sector. Participants were initially asked to indicate their knowledge regarding whether the organization they serve has a formal innovation strategy. The question belonged to the simple choice scale, and participants selected one answer from a range of suggested answers (“Yes”, “No”, “I am not sure”), with the possibility of an open response in case of agreement. A total of 57.1% of respondents answered negatively, while 28.5% indicated a lack of certainty. Finally, 14.2% responded positively. It is noteworthy that the 48.4% of respondents with 21–30 years of public service who answered the question were distributed as follows: 35 respondents (27.7%) answered negatively, 17 respondents (13.49%) indicated uncertainty, while only 9 civil servants (7.1%) had a positive response.
The 14.2% of respondents who had a positive response to the aforementioned question and went on to complete the open response if they agreed to briefly describe their organization’s current innovation strategy responded as follows: innovation strategy to develop the defense capabilities of the armed forces, teleworking since 2014, electronic systems without face-to-face public service since 2017, staff training at the European level, remote citizen service, development, digitalization of all functions of the organization, use of broadband, interconnectivity, etc., use of social media for communication between colleagues, a focus on organizational innovation and process innovation, innovative training courses, the introduction of digital innovations in both communication and daily transactions with customers, and the appliance of an AVL (automatic vehicle locator).
Of the respondents who stated that they were certain that their institution does not have a formal innovation strategy, when asked if they considered it necessary to have one, 64.86% answered positively. Additionally, regarding the aforementioned question, 19.8% out of the 29.7% of the sample who answered “I am not sure” said that they consider the existence of an innovation strategy necessary.
Respondents were then asked to indicate their level of agreement with a formulated question, on a scale of five values from “strongly disagree” to “strongly agree”, in order to ascertain their attitude towards a potential citizen–stakeholder partnership. Based on the responses, there was no particular divergence. More specifically, with a predominant value (Mode) of 4, in essence, both men and women stated that they want the cooperation of citizens and stakeholders in the process of innovation in the public sector. Regarding the standard deviation, we see that it does not exceed 0.881, which suggests that there are no outliers in our responses compared to the mean.
Regarding question B4 on the objectives that respondents believe that an innovation strategy in the public sector should pursue, the results can be summarized as follows: citizen orientation; flexibility and faster processes; citizen satisfaction research; utilization of human resources and competent staff; training, specialization, and the improvement of the working environment; providing incentives and strengthening the brand name both internally and externally; establishing a legislative framework to support change and update legislation; digitalization and a reduction in bureaucracy; saving resources and protecting the environment; coordinated cooperation with interested citizens and individuals; faster procedures; increased citizen confidence; the development of flexible and user-friendly software; and capacity building in new technologies to increase the efficiency and effectiveness of public administration.
In questions B4 and B5, respondents were asked to answer matching questions and in particular to choose from a series of formulated affirmative sentences giving them a free choice of the number of answers or the alternative “other”. Question B4 explores the initiatives already being taken by their institution in terms of adopting innovative practices. A total of 58.26% of the respondents indicated that their work agency focuses on process improvement, 57.48% on technology adoption, 47.24% on staff training and development, 44.88% on interoperability with various departments, and 27.5% on agency partnerships with private institutions.
Question B4 explores the main problems faced by the respondents’ work organization in implementing an innovation strategy. A total of 49.6% of the respondents stated that their organization faces a lack of funding, 39.37% identified resistance to change, 67.71% of the respondents stated that their organization faces the problem of bureaucratic barriers, 48.03% identified a lack of expertise, and 5.5% selected the alternative “other”.
5.4. Individual Creativity—Differences Between Men and Women
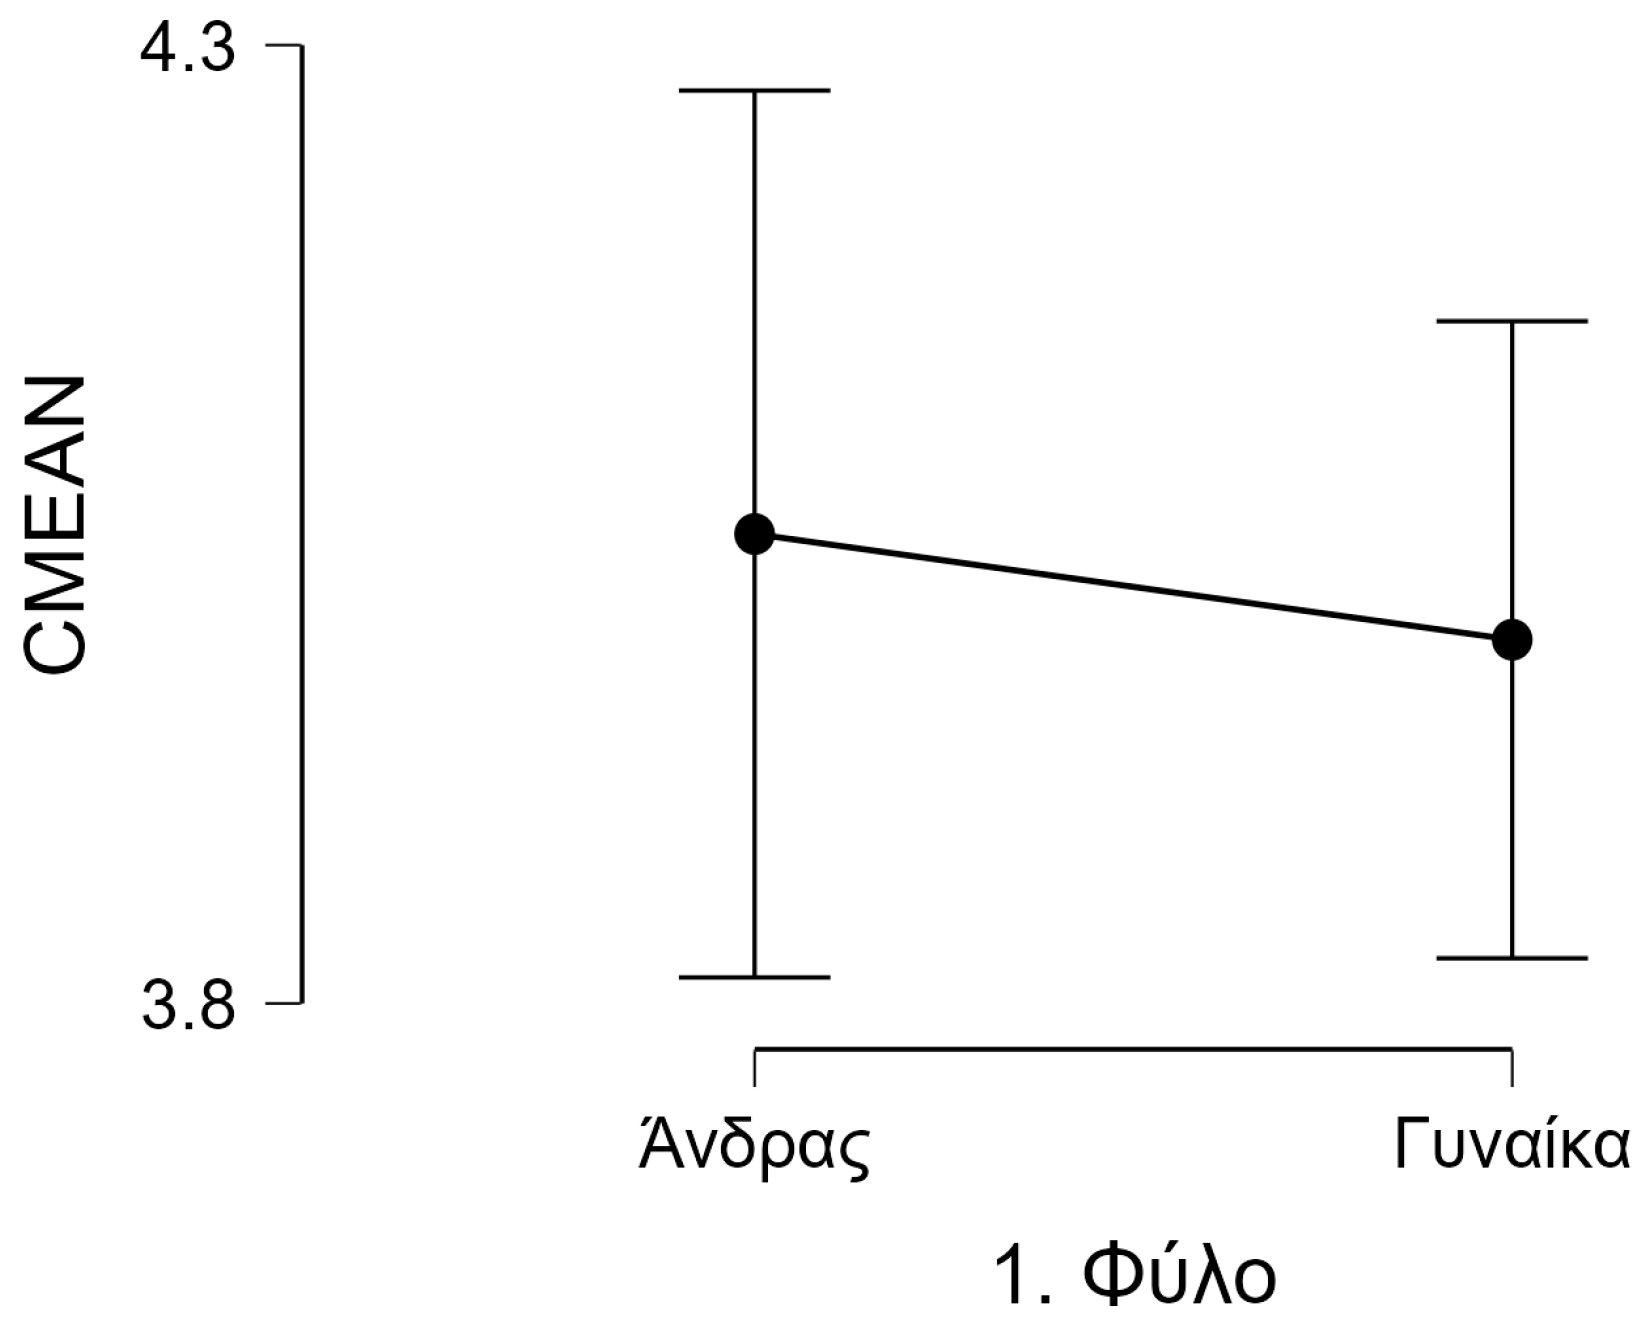
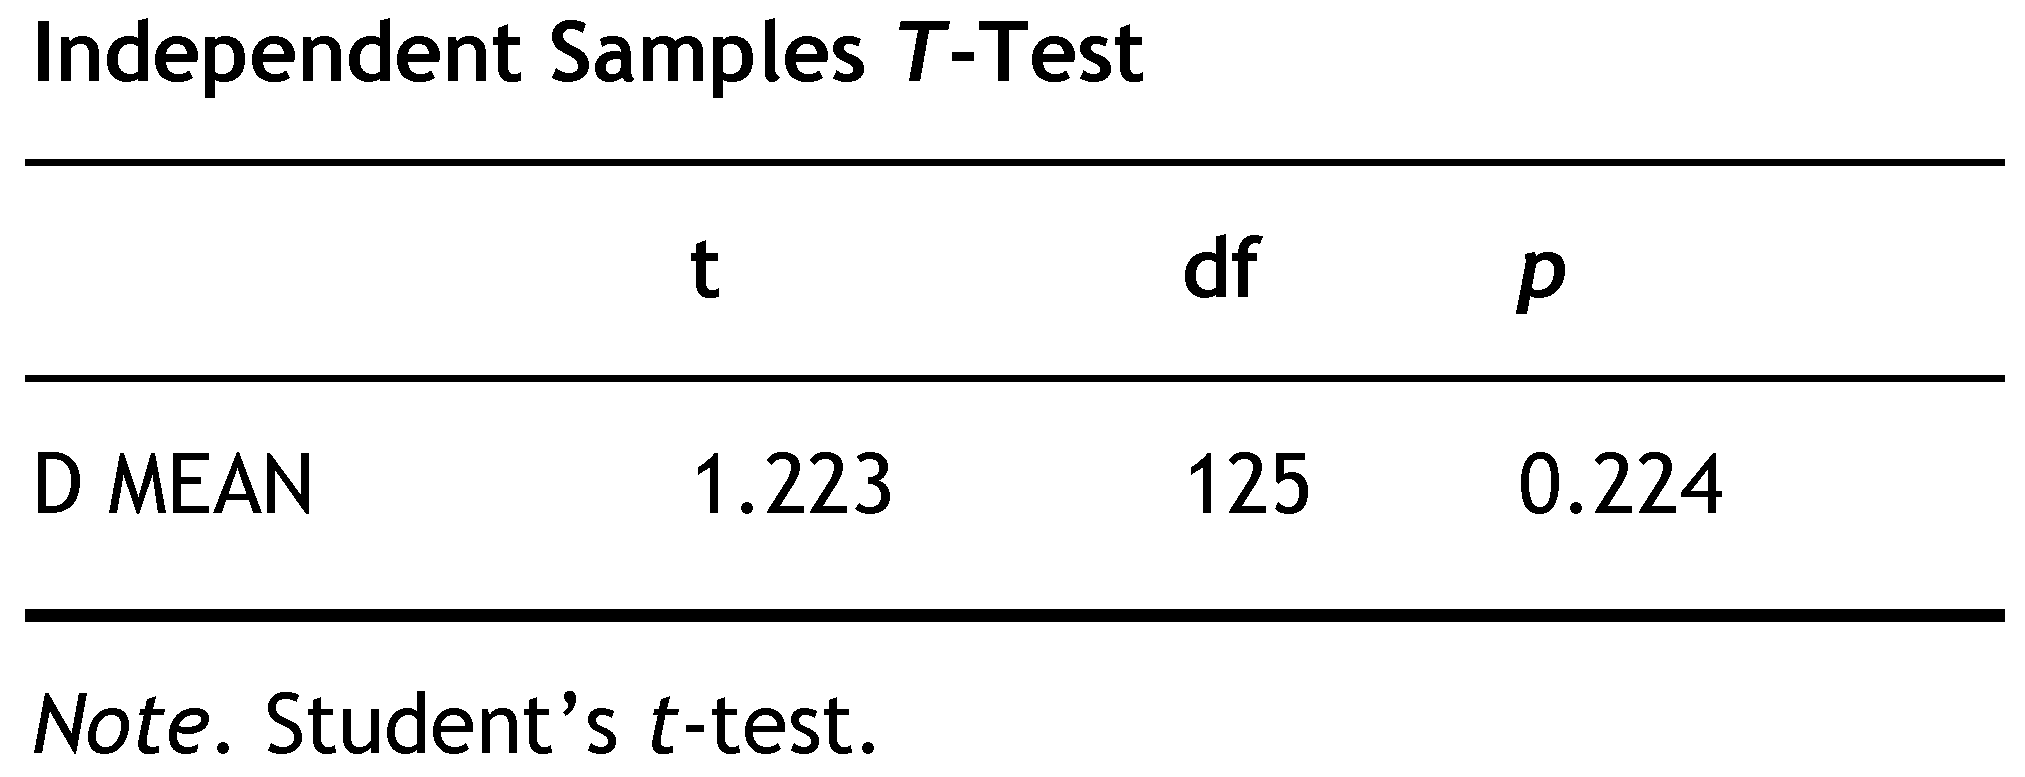
The fourth group of questions in this part of the questionnaire concerned individual creativity. Participants were asked to indicate their level of agreement on a scale from 1 to 5 (where 1—Strongly Disagree, 2—Disagree, 3—Undecided, 4—Agree, and 5—Strongly Agree). Based on the responses, there is not much variation in the responses of the female and male respondents, in terms of their belief in demonstrating individual creativity in their workplace. More specifically, when asked about whether they demonstrate creativity in their workplace, both groups with a predominant value (mode) of 4 stated, in essence, that they agree; however, it should be noted that a value 2 was an option for 1.2% of women and a value 3 was chosen by 15.38%. It has to be noted that a value of 3 was an option for 8.16% of male respondents. In addition, they were asked whether they often come up with new ideas in order to successfully complete their work, and whether they often come up with creative solutions to the problems that arise. As can be observed from the statistics listed below, with the predominant mode value of 4, both men and women indicated their agreement. It is worth noting that 43.75% of men chose the value of 5 in question D3, while 26.92% women chose the same value in the same question, which shows a slight increase in the perception of the male gender in relation to its position in the performance of creative solutions. Regarding the standard deviation, we see that it does not exceed 0.891 in any question, with a lower value of 0.636, which suggests that there are no outliers in our answers compared to the average.
5.5. Organizational Climate—Differences Between Men and Women
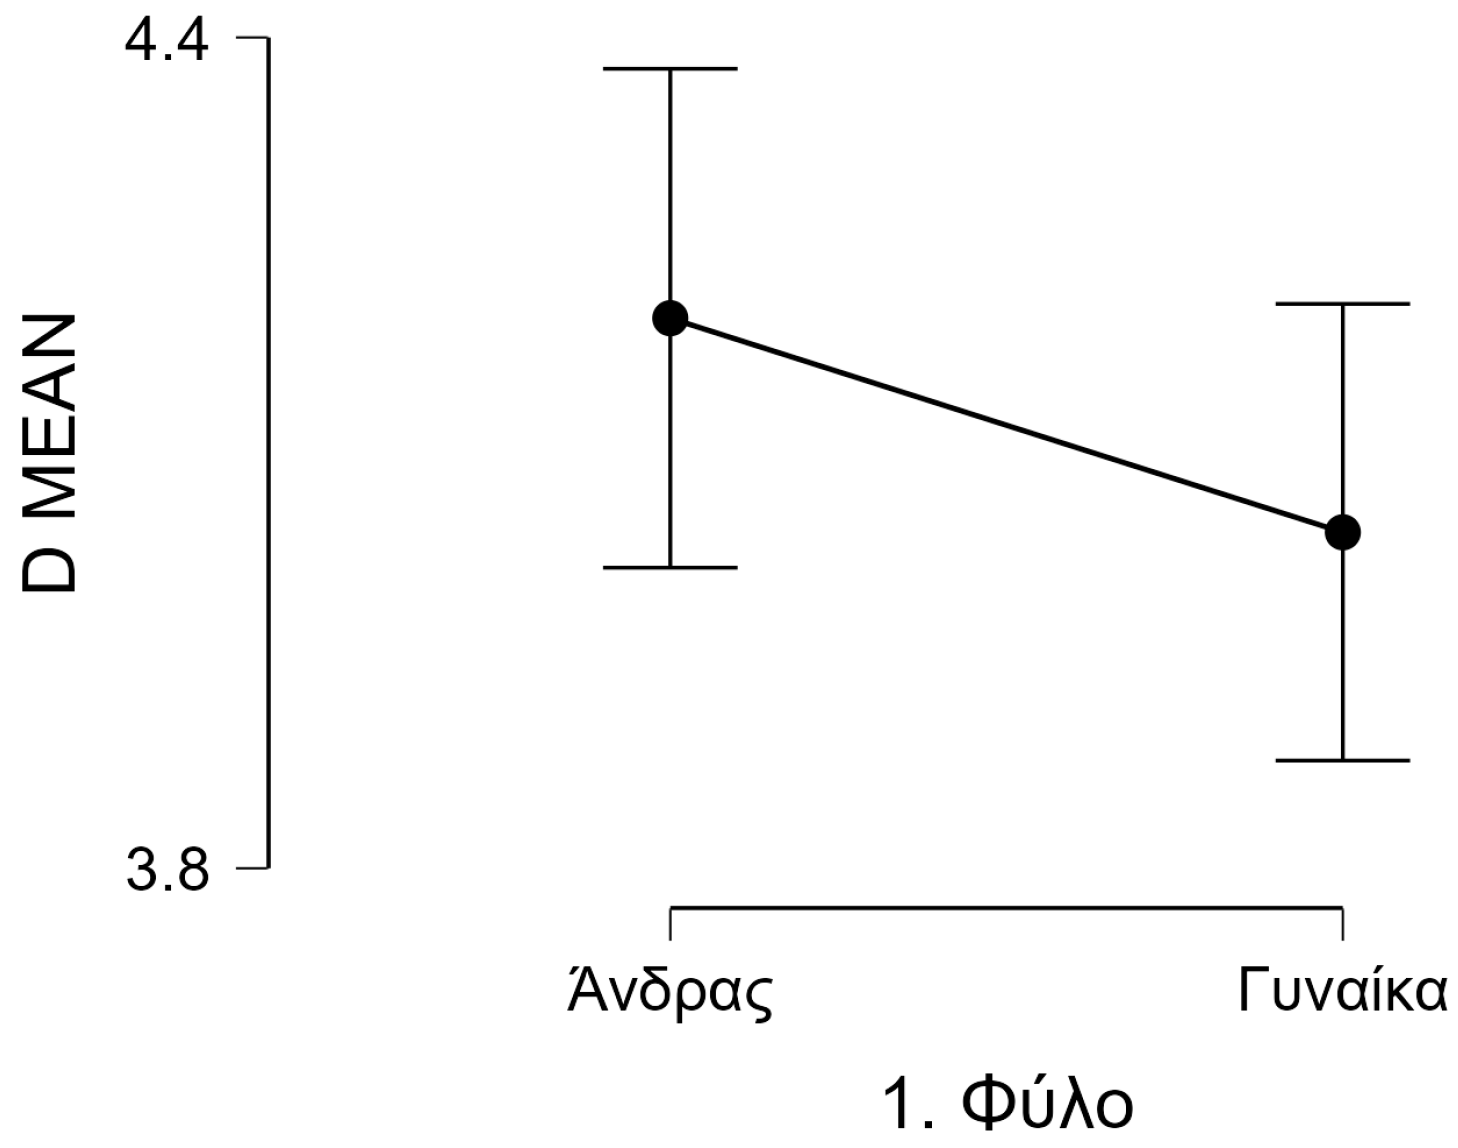
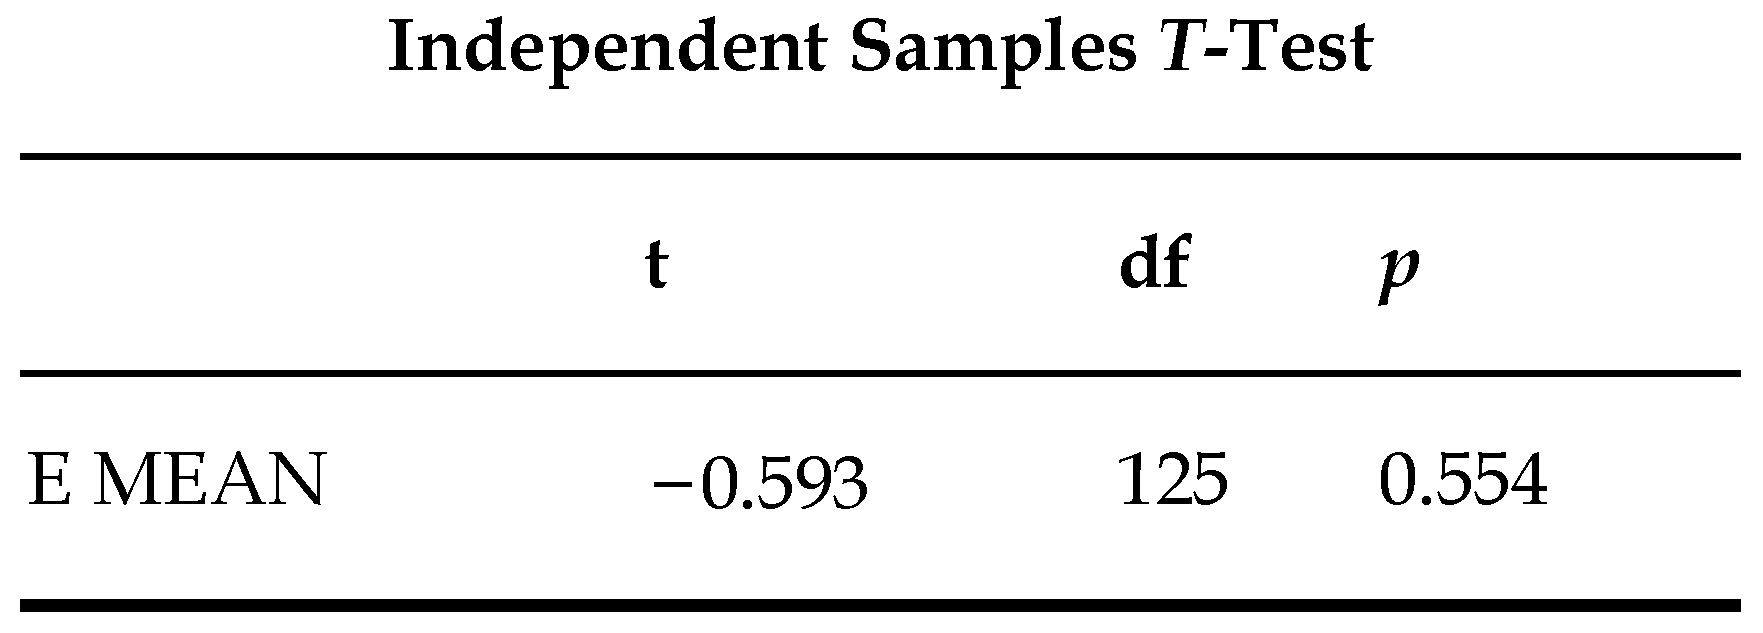
The fifth group of questions in the questionnaire concerned the organizational climate. Participants were asked to indicate their level of agreement on a scale from 1 to 5 (where 1—Strongly Disagree, 2—Disagree, 3—Undecided, 4—Agree, and 5—Strongly Agree). Based on the responses, there is not much variation between female and male respondents regarding their perception of the organizational climate in their workplace. More specifically, they were initially asked whether their leader assigns them sufficient responsibility. The men, who had a predominant value (mode) of 5, in essence stated that they strongly agreed with the affirmative statement quoted above, while the women, who had a slight lower predominant value (mode) of 4, also expressed their agreement.
In the affirmative statement that the respondents’ leader encourages them to take initiative, the men in the sample expressed their neutral attitude with the predominant value (mode) being 3, while the women, respectively, chose 4 as the predominant value (mode). It is worth noting that both men and women have responses that were entered with the lower extreme value.
Third, when asked about their leader’s active listening skills, both men and women showed a predominant value (mode) of 4, indicating their satisfaction. It is worth noting that in the male sample there were responses with the lower extreme value.
For the affirmative statement that employees are allowed to solve the same problem in different ways, women, with a predominant value (mode) of 3, partially agreed (and some responses were observed in the extreme values), while the men of the sample, who had a predominant value (mode) of 4, stated that they agreed. The reverse was observed for the fifth question, where the issue of learning new things at work was addressed. The male respondents in the sample had a predominant value (mode) of 3 and stated that they were undecided, while, on the contrary, the female respondents, with a predominant value mode) of 4, expressed their agreement. In essence, the men of the sample on average expressed reservations about both encouraging initiative in their workplace and training in new work areas.
To the affirmative statement that it is worthwhile for respondents to take time to learn new ways of doing their work, male respondents had a predominant value (mode) of 5, showing that they strongly agreed. Correspondingly the female respondents had a predominant value (mode) of 4, meaning that they answered positively. Finally, regarding the statement as to whether respondents acquire new knowledge when necessary, female respondents had a predominant value (mode) of 5 (they strongly agreed), while male respondents had a predominant value (mode) of 4 (they responded positively).
Regarding the standard deviation, we see that it does not exceed 1.192 in any question, with a lower value of 0.787, which suggests that there are no outliers in our responses compared to the mean.
7. Conclusions
First, creativity and innovation in the public sector are two distinct concepts [
14]. The fact that there is a lack in knowledge of the creation of the first concept is a gap in the knowledge concerning precursors to innovation in the public sector [
15].
Discretion, as a practice of public sector creativity, refers to the improvisational, reactive, and situation-specific decisions that public employees make in their daily activities. It is widely exercised by civil servants, as reflected in the results of statistical analysis, and is considered essential in the public sector.
Public officials test options, test implementation, carry out pilot interventions, and create prototype tools [
4]. Individual creativity also has a positive effect on individual innovative behavior [
8].
Houtgraaf et al. provided recommendations for both researchers and professionals to promote innovation in the public sector, which included investing in training programs for civil servants, integrating creative practices into performance assessment, promoting cross-sectoral knowledge exchange, and institutionalizing creativity practices in public administration [
4].
A public service organization is embedded in an ecosystem. For this reason, it must co-evolve with other organizations to achieve its goals. The core of the proper functioning of an ecosystem is the adoption of the principle of open communication. Co-creation is at the core of open innovation. However, digital transformation requires more than the simple application of modern technologies. It requires the creation of a digital strategy and the alignment of the business strategy with the digital strategy, as well as the development of the skills and expertise needed to apply the technology for the benefit of the company—in this case the public body—and its stakeholders [
16].
Mu, R. & Wang, H. focused on identifying and exploring the barriers and governance strategies of open innovation and how to change them in the context of digital transformation. Their literature review identified several barriers to open innovation in the public sector, which were divided into two categories: digital and non-digital barriers. Briefly, digital barriers—involving issues related to big data, digital skills, and knowledge—and non-digital barriers—including factors, such as bureaucracy, lack of incentives and rewards, organizational culture, and limited resources—impede public organizations from effectively embracing open innovation. In practice, the review on changing governance barriers and strategies during digital transformation is a timely reminder for politicians, public managers and government administrators to adopt the principles of transformational leadership for open innovation, in order to manage innovation in a more effective and proactive way in digital-age governance [
5].
Do civil servants know that the reform has been successful? The message of reform must be honest, pointing out the potential problems and sacrifices that will be required and not promising more than can be achieved.
Innovations emerge not only as a response to threats, but also as a lever for engaging interactive audiences, which in combination with social media play a key role in helping to reduce uncertainty and promote early adoption [
17,
18].
An important aspect of dissemination is, therefore, to ensure that there is enough evidence of the quality of the innovation before a major dissemination effort is initiated. This means that the leadership of the targeted unit—perhaps innovation labs—must engage in research and innovation to allow the seeds of improved practice to flourish [
19].
In the context of intensifying global problems and new grand challenges to be addressed, government agencies are devoting significant efforts to leadership capacity building, as the public sector increasingly needs strong leaders with vision to respond to grand challenges, embrace public sector entrepreneurship [
20], and keep innovation policy mission-oriented [
7].
Digital transformation leaders should communicate the mission, vision and values they believe in through a universal language, inspiring people towards the tool of storytelling using metaphors, stories, and rhetoric. In Aristotle’s rhetorical treatise, the ethos of inspiring trust and establishing credibility is influenced by the moral credibility and history of the communicator, in this case the civil service [
21].
The present study has shown that the targeted sample of civil servants feel that they make a satisfactory effort to demonstrate both individual creativity and innovation in their workplace, while they express skepticism towards the organizational climate of their institution.
For these reasons, a digitally transformative leader acts as a communicator who creates a leader–follower relationship through a strong personal bond [
21]. Concepts, such as co-creation, co-implementation, and co-evaluation, are an essential step towards achieving the mission. The channels for communicating innovation in the public sector must become systemic, in order to provide the opportunity for innovation to flow and flourish and become a steppingstone for the creation of an institutional memory.
In short, communication and dissemination activities oriented externally to citizens and internally to civil servants should be ensured throughout the mission life cycle, so that recipients understand the value of research and innovation activities and their tangible impact on their lives. This will convince political and administrative leadership to invest in innovative communication channels both internally and externally.


