Abstract

Theoretical Investigation of the Impact of Impurities in Recycled Silicon Used for the Production of Ferrosilicon †

by
Pradeep Padhamnath
*,
Piotr Migas
* and
Mirosław Karbowniczek
*
Faculty of Metals Engineering and Industrial Computer Science, AGH University of Krakow, 30-059 Krakow, Poland
*
Authors to whom correspondence should be addressed.
Presented at the 31st International Conference on Modern Metallurgy Iron and Steelmaking 2024, Chorzów, Poland, 25–27 September 2024.
Proceedings 2024, 108(1), 18; https://doi.org/10.3390/proceedings2024108018
Published: 10 September 2024

1. Introduction

Ferrosilicon (FeSi) is produced using a carbothermal process, usually in closed submerged electric arc furnaces. Quartzites are used as the silicon source in the production of FeSi, while coke (coal or wood chips) is the primary source of carbon reductant [1,2]. Steel scrap is the primary source of iron (called iron chips) [3]. The iron lowers the partial pressure of silica (SiO2) required for reduction and forms FeSi solutions that reduce the activity of Si. Hence, the process could be carried out at lower temperatures than those employed for the production of silicon. This also results in higher Si yield (less of SiO2) and lower energy consumption per ton of metal [4]. Approximate charge composition, energy demand and silicon yield for ferrosilicon smelting in a closed furnace for each ton of FeSi produced is shown in Table 1 [4].
The carbothermic reduction of the silicon process releases huge amounts of greenhouse gases, which also leads to energy loss. To combat climate change, it is imperative to limit the amount of greenhouse gasses emitted during the production process. This could be performed by using recycled silicon recovered from different electronic waste sources. Recycling the metal-contaminated silicon, destined for landfills, in manufacturing FeS using only electricity as the source of energy, could potentially lead to reduced carbon footprint. There are several uses of FeSi in the metallurgy industry. It is used as a deoxidizer, as a carrier of silicon to produce alloys such as silicon steel, and as a carrier for other alloying agents. Therefore, the composition of the FeSi is crucial for the quality of the final product [4]. In recent years, there has been growing interest in the use of recycled material for the production of ferrosilicon [5,6,7,8,9,10]. Recently, the use of silicon from electronic waste (e-waste) was suggested as a silicon source for the production of FeSi [10]. The recycled silicon recovered from e-waste can have several other metal impurities in small quantities, such as silver, copper, aluminum, tin, and lead [11]. It would be helpful to understand the role of the impurities in the FeSi manufacturing process and the impact on the final availability of the Si for the desired process.

2. Aim and Approach

In this work, we investigate the impact of the major impurities found in recycled silicon on the production of FeSi. The formation of FeSi under equilibrium conditions is investigated with the help of FACTSAGE 8.3 software, while varying the impurities present in the recycled Si. The approximate composition of different metals (in percent) mixed with the Si recovered from electronic waste is shown in Table 2. Here, two assumptions are considered: (a) the plastic and other non-metallic components were removed by simple physical processes [11,12], and (b) scrap steel with extremely low carbon content (<0.2%) was treated as a solvent. Therefore, carbon was not included as a component in the analysis. The percentages of metal mixed with silicon in e-waste were used as the basis for the design of hypothetical systems. The Si/Fe ratio in each alloy system and the total weight of the alloy system is kept constant while the percentages of impurities in Table 2 was used to calculate the amount of individual impurities.
The composition of different systems studied in this work are presented in Table 3. A system containing only Fe and Si is taken as the reference system (S-0). The differences with respect to the different phases formed, crystallization temperature, and phase transition temperature are evaluated. The systems are simulated from a temperature of 1500 °C to 100 °C. Phase diagrams for some interesting transformations are also presented. The impact of the phases on the usability and availability of silicon is discussed. This work shows what impurities are critical and should be removed before using recycled silicon for the production of FeSi.

3. Preliminary Results and Discussion

The different alloy systems exhibit different behaviors in terms of number and amount of phases present throughout the cooling process. For example, in system S-1, where Ag is the only metal impurity, no further phase transformation occurs below 800 °C, when the entire system solidifies. In this system, the Ag does not form any alloys with either Fe or Si, and solidifies as a pure phase. The final phases present in such a system would be Ag and a mixture of FeSi and FeSi2. Hence, in such a system, it is expected that Ag crystals would be found distributed throughout the microstructure comprising FeSi and FeSi2. However, when the system contains Al along with Ag, a silver rich alloy with Al, Fe, and Si is formed. In this case, the entire system solidifies at 666 °C and no new phases emerge upon further cooling. At 100 °C, the system comprises three distinct mixtures. A Fe rich phase comprising FeSi2 and FeAl2 is obtained in the maximum quantity. Another solid phase consisting of a mixture of FeSi and FeSiAl2 is also found to be present in smaller quantities. The third mixture comprises a Ag rich alloy consisting mostly of Al and an almost negligible quantity of Fe and Si. Hence, it can be hypothesized that the presence of Ag alone would not cause any difference to the availability of Si in the finally obtained FeSi; however, any additional impurity such as Al, Sn, Cu, or Pb may form alloys with Fe and Si and affect the quantity and the quality of the Si available in the final FeSi obtained. Figure 1 shows the phase diagram of the S-2 system computed with the help of FactSage 8.3 with composition as mentioned in Table 3. Further results will be shown in the conference.

Author Contributions

Conceptualization, P.P., P.M. and M.K.; methodology, P.P. and P.M.; software, P.P. and P.M.; validation, P.P., P.M. and M.K.; formal analysis, P.P. and P.M.; investigation, P.P.; resources, P.P. and M.K.; data curation, P.P.; writing—original draft preparation, P.P.; writing—review and editing, P.M. and M.K.; visualization, P.P. and P.M.; supervision, M.K.; project administration, P.P.; funding acquisition, P.P. and M.K. All authors have read and agreed to the published version of the manuscript.

Funding

This research is part of the project No. 2022/45/P/ST5/02712, co-funded by the National Science Centre and the European Union Framework Programme for Research and Innovation Horizon 2020 under the Marie Skłodowska-Curie grant agreement No. 945339. For the purpose of Open Access, the author has applied a CC-BY public copyright license to any Author Accepted Manuscript (AAM) version arising from this submission.

Institutional Review Board Statement

Not applicable.

Informed Consent Statement

Not applicable.

Data Availability Statement

The data presented in this study are available upon request from the corresponding author.

Acknowledgments

The authors would like to acknowledge the support of their colleagues at the faculty of WIMiIP at AGH University of Krakow in the procurement of the software.

Conflicts of Interest

The authors declare no conflicts of interest.

References

  1. Riva, L.; Surup, G.R.; Buø, T.V.; Nielsen, H.K. A study of densified biochar as carbon source in the silicon and ferrosilicon production. Energy 2019, 181, 985–996. [Google Scholar] [CrossRef]
  2. Tangstad, M.; Beukes, J.P.; Steenkamp, J.; Ringdalen, E. Coal-based reducing agents in ferroalloys and silicon production. In New Trends in Coal Conversion; Elsevier: Amsterdam, The Netherlands, 2019; pp. 405–438. [Google Scholar]
  3. Ismail, A.N.; Ibrahim, M.H.; Said, R.M.; Somidin, F.; Ismail, S.A. Ismail, Influence of recycled wastes on ferrosilicon production in steel making applications: A short review. J. Phys. Conf. Ser. 2022, 2169, 012028. [Google Scholar] [CrossRef]
  4. Tangstad, M. Ferrosilicon and silicon technology. In Handbook of Ferroalloys; Elsevier: Amsterdam, The Netherlands, 2013; pp. 179–220. [Google Scholar]
  5. Farzana, R.; Sahajwalla, V. Novel recycling to transform automotive waste glass and plastics into SiC-bearing resource by silica reduction. J. Sustain. Metall. 2015, 1, 65–74. [Google Scholar] [CrossRef]
  6. Farzana, R.; Rajarao, R.; Sahajwalla, V. Transforming waste plastic into reductants for synthesis of ferrosilicon alloy. Ind. Eng. Chem. Res. 2014, 53, 19870–19877. [Google Scholar] [CrossRef]
  7. Farzana, R.; Rajarao, R.; Sahajwalla, V. Synthesis of ferrosilicon alloy using waste glass and plastic. Mater. Lett. 2014, 116, 101–103. [Google Scholar] [CrossRef]
  8. Farzana, R.; Rajarao, R.; Sahajwalla, V. Characteristics of waste automotive glasses as silica resource in ferrosilicon synthesis. Waste Manag. Res. 2016, 34, 113–121. [Google Scholar] [CrossRef] [PubMed]
  9. Farzana, R.; Rajarao, R.; Sahajwalla, V. Reaction mechanism of ferrosilicon synthesis using waste plastic as a reductant. ISIJ Int. 2017, 57, 1780–1787. [Google Scholar] [CrossRef]
  10. Rajarao, R.; Farzana, R.; Sahajwalla, V. Transforming waste printed circuit boards and compact discs for the synthesis of valuable ferrosilicon alloy. J. Sustain. Metall. 2018, 4, 461–469. [Google Scholar] [CrossRef]
  11. Padhamnath, P.; Ślęzak, M.; Karbowniczek, M. Disposing End of Life PV Modules—Reusing, Recycling and Upcycling. In EU PVSEC 2023; EUPVSEC: Lisbon, Portugal, 2023; pp. 1–8. [Google Scholar]
  12. Pahari, A.K.; Dubey, B.K. Waste from electrical and electronics equipment. In Plastics to Energy; Elsevier: Amsterdam, The Netherlands, 2019; pp. 443–468. [Google Scholar]
  13. Ari, V. A review of technology of metal recovery from electronic waste. In E-Waste in Transit-from pollution to resource, 1st ed.; Mihai, F.C., Ed.; IntechOpen: Rijeka, Croatia, 2016; pp. 122–158. [Google Scholar]
  14. Chatterjee, S. Sustainable electronic waste management and recycling process. Am. J. Env. Eng. 2012, 2, 23–33. [Google Scholar] [CrossRef]
  15. Latunussa, C.; Mancini, L.; Blengini, G.; Ardente, F.; Pennington, D. Analysis of Material Recovery from Silicon Photovoltaic Panels; JRC Technical Reports- JRC100783; Publications Office of the European Union: Brussels, Belgium, 2016. [Google Scholar]
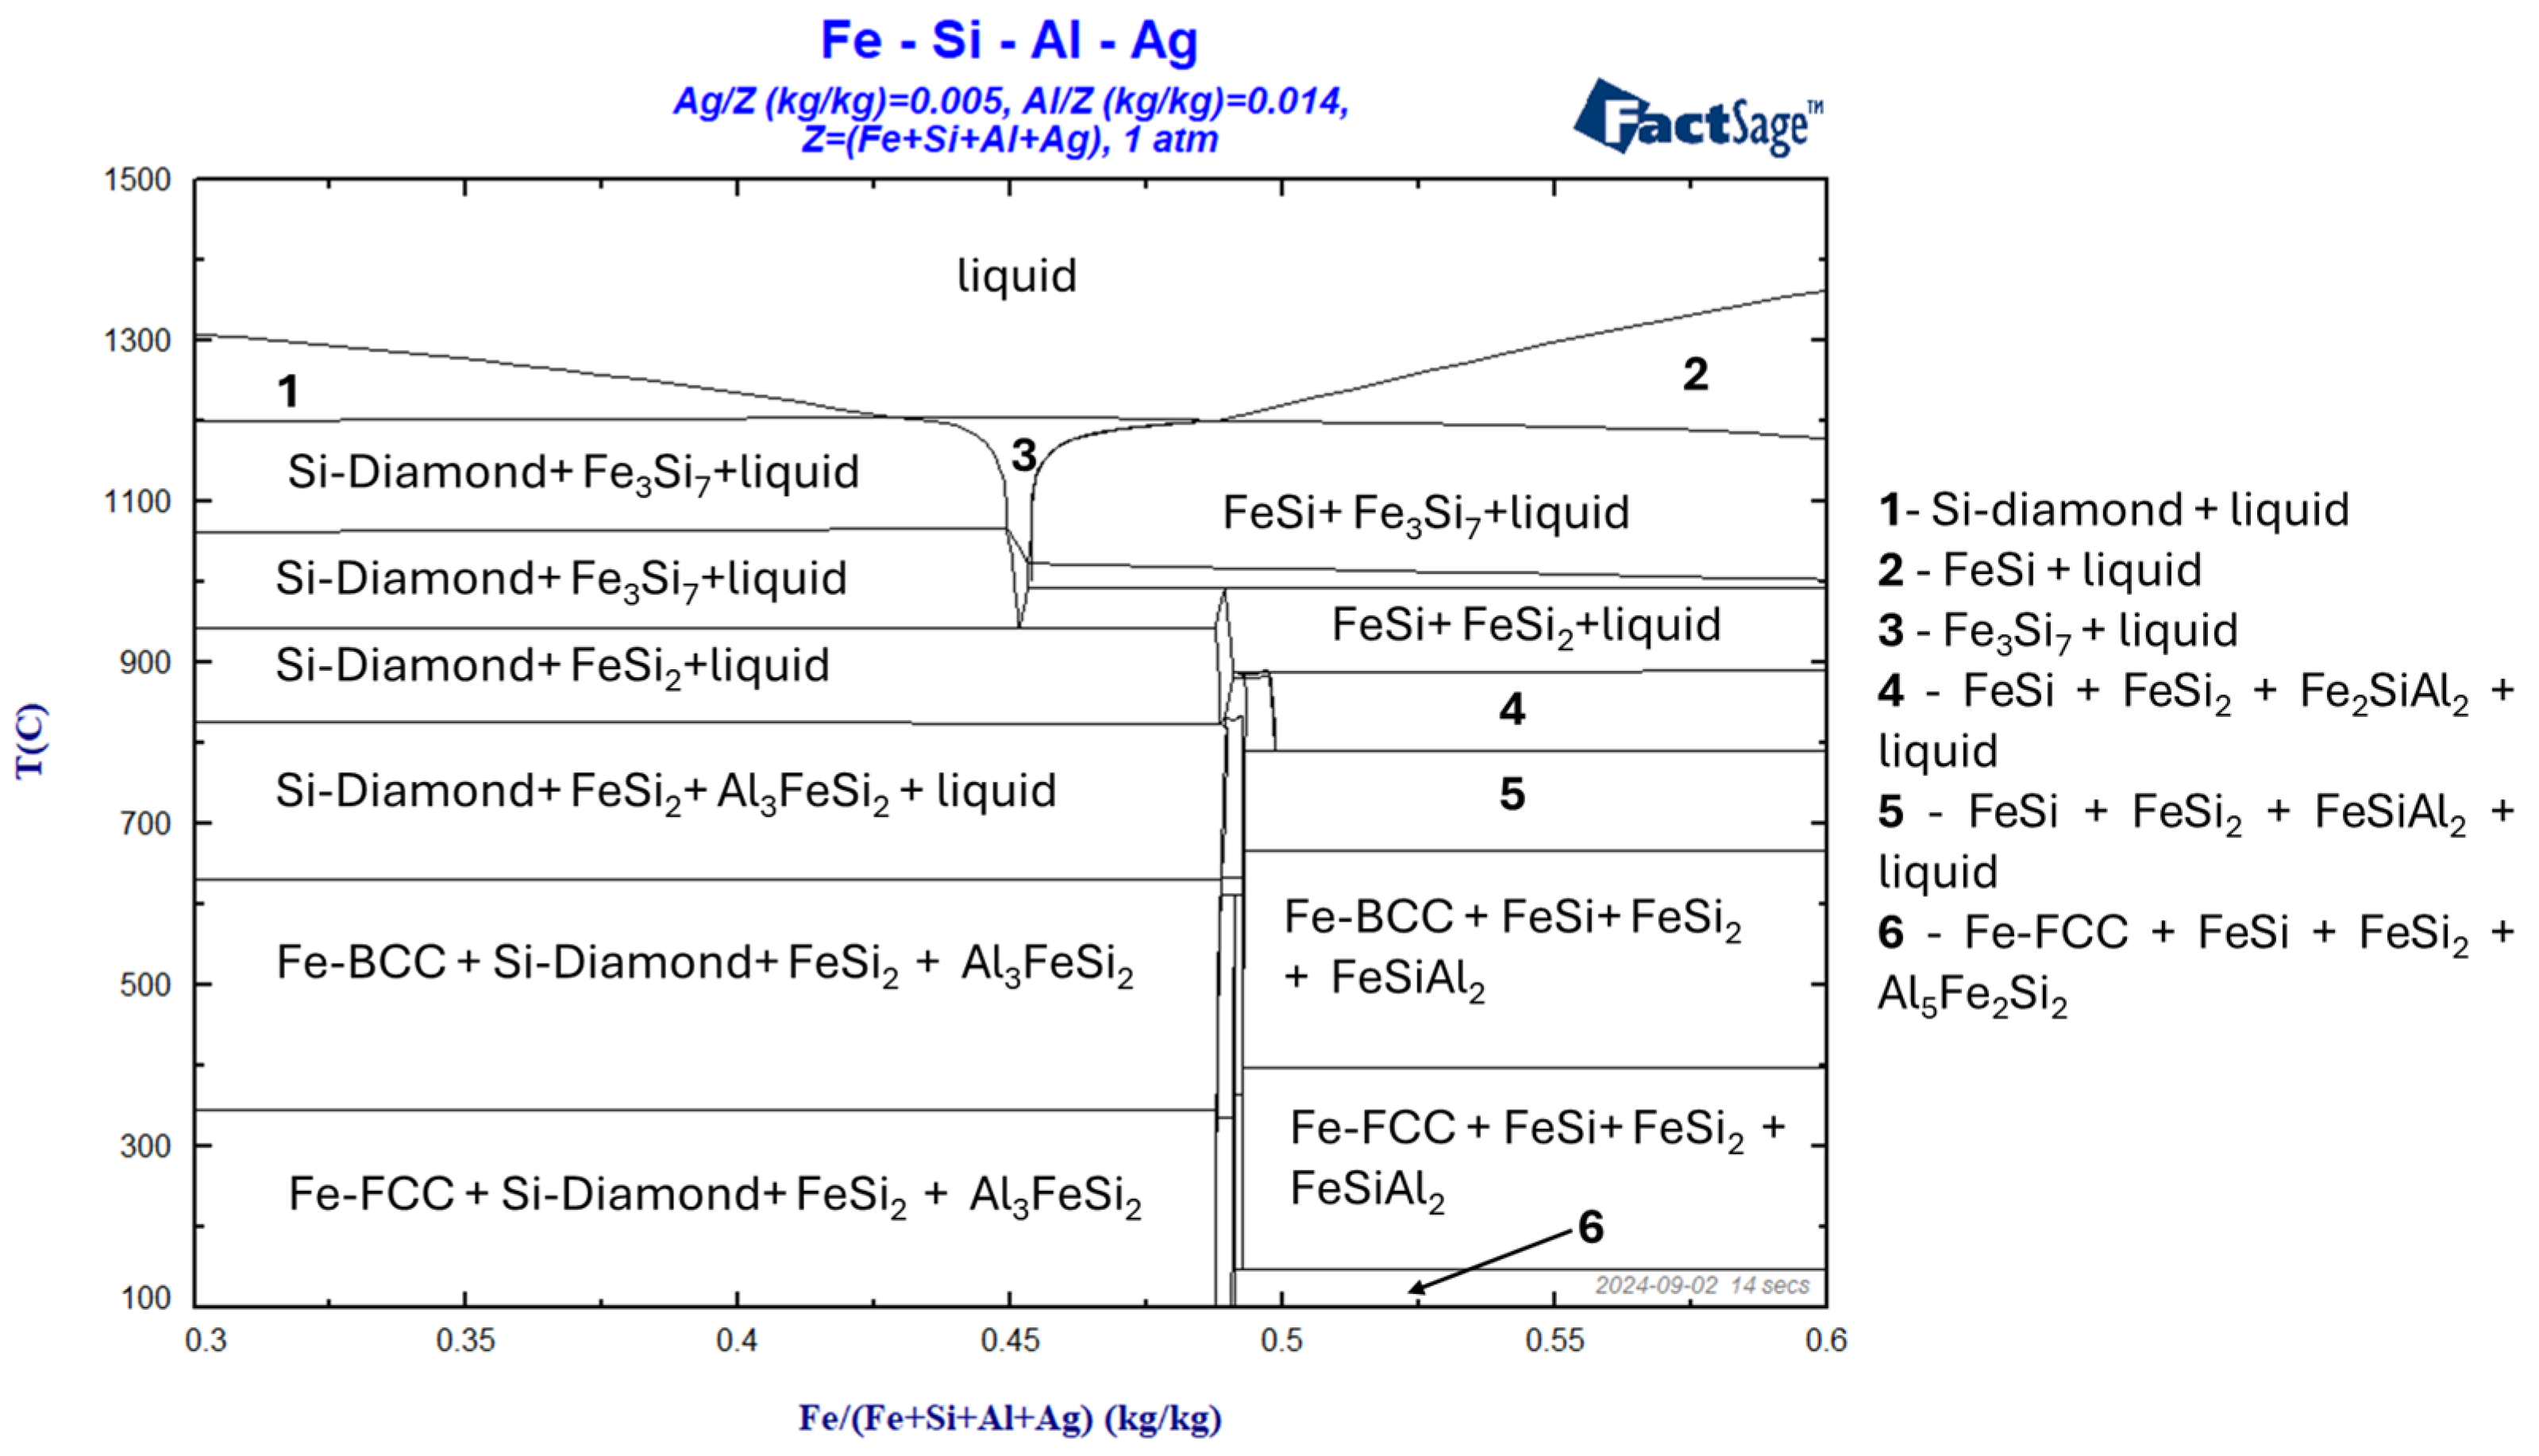
Figure 1. Phase diagram of the Fe-Si-Al-Ag system as computed with FactSage 8.3.
Proceedings 108 00018 g001
Table 1. Typical materials and energy demand for smelting of FeSi in closed furnaces (for 1 ton of alloy) [4].
FeSi AlloyFeSi20FeSi25FeSi45FeSi65FeSi75Al
Quartzite, kg37055293115681930
Iron chips, kg810780658343250
Coke, kg200280438720845
Electrode paste, kg1081643.354
Electricity, MWh/t2.12.74.87.48.8
Silicon yield, %94–9597–98.598–9992–9491–93
Table 2. Approximate content (in percentage) of impurities commonly found in silicon recovered from e-waste [11,12,13,14,15].
NoMaterialPercentage in e-Waste [%]
1Copper (Cu)1–3%
2Aluminum (Al)3–5%
3Silver (Ag)1–3%
4Tin (Sn)0.5–1%
5Lead (Pb)0.5–1%
6Silicon (Si)Remaining
Table 3. Approximate composition (in kg) of the hypothetical furnace charge for FeSi production, where Si is sourced from e-waste while scrap steel is used as a source of Fe.
Alloy
Systems
Fe [kg]Si [kg]Ag [kg]Al [kg]Cu [kg]Sn [kg]Pb [kg]Total [kg]
S-05545 100
S-154.744.80.5 100
S-253.944.20.51.4 100
S-353.644.00.51.40.5 100
S-453.543.90.51.40.50.2 100
S-553.443.80.51.40.50.20.2100
Disclaimer/Publisher’s Note: The statements, opinions and data contained in all publications are solely those of the individual author(s) and contributor(s) and not of MDPI and/or the editor(s). MDPI and/or the editor(s) disclaim responsibility for any injury to people or property resulting from any ideas, methods, instructions or products referred to in the content.