1. Introduction
Research proves that today’s perception of the city and digital arts can create a new form of interaction and perception, defined as “dynamic urban projection mapping”.
The evolution of the city is linked to a different way to move across it, since the current means of transport and infrastructures have changed the travel speed.
The perception of urban landscape depends on its intended use as well as on mobility, which follows visual, anthropological and infrastructural automatic mechanisms.
Projection mapping is a particular type of augmented reality. It is generated through digital processing, which interacts with an area that is not necessarily flat, projecting an image or a flow of images onto it. A further development is “dynamic projection mapping”, where a different message is displayed according to the observer’s displacement speed. In this case, the observer’s displacement speed is considered in addition to the type of perception and the flow of data displayed; in the case of a motor vehicle, it is detected by special sensors and can be used to generate a message that changes with the vehicle speed.
2. Perception of the Urban Landscape
Perception is a subjective processing of the information received from the sense organs based on one’s own interests, habits, culture and mental patterns. People belonging to the same society, with similar cultural patterns, are likely to have similar perceptions of the same object. However, one’s own cultural and emotional background prevent an identical perception, which varies in a subjective way.
An urban landscape is the set of shapes of a space and therefore does not change unless the features that characterize it change. However, it is not perceived in the same way by every individual, since it depends on the point of view, the direction we look at, and above all on our way of life and how we see things. The perception of a place is tied to the time dimension; an observer cannot grasp all aspects of an urban landscape. First, we identify the prevailing aspects; then, as exposure increases, we perceive more aspects, more specific or less visible. In an urban space, a building or another piece of architecture are perceived instantly as compared to other elements over the same landscape.
As to the perception of a city and its urban landscape, several researchers from different disciplines, ranging from urban anthropology, environmental psychology, and urbanism have explored it.
Among these latter, it is worth recalling the studies conducted in the 1960s by Kevin Lynch [
1], Gordon Cullen [
2], by the anthropologist Edward Twitchell Hall [
3], later resumed by Jan Gehl in the ‘70s [
4] and in the’ 90s [
5]. In recent times, the Oxford College [
6] began a.new recent research work in 2012.
The anthropologist Edward T. Hall [
3] focused his studies on the use of space by individuals, hypothesizing a conditioning bond between specific behaviors and the subject’s culture and way of life. He also emphasized how each individual’s behavior is affected by the presence of other individuals, creating mass attitudes.
He introduced the concept of “proxemics”, namely the importance and value in human social behavior resulting from the distance between the individual and the others, or between the individual and the objects. A phase of proximity and distance can be discerned in every type of relationship; the anthropologist Hall classified such distance into four distinct types: intimate distance, between 0 and 45 cm; personal distance, between 45 and 120 cm; social distance, between 120 and 350 cm; public distance, over 350 cm. Distance moves from bodily communication to a predominantly verbal type of communication. Finally, in public distance the verbal communication is minimized and the non-verbal one takes over, where the visual component prevails over the whole sensory sphere.
The American urbanist Kevin Lynch carried out several studies on the analysis of urban space perception. According to this author, the relationship between objects and individuals unfolds through a series of automatic behaviors where perception pre-arranges and organizes the use of the urban space.
In 1960, Kevin Lynch published “The Image of the City” [
1], a landmark work in the contemporary urban debate. He tried to clearly define the relationship between the modern city and its inhabitants. Lynch attempted to analyze the formation of the urban image through the way it is perceived by its inhabitants. Perception is not only a sensory aspect related to vision but involves cultural and social facts. Lynch broke down the city structure into recurring and easily identifiable elements: paths, edges, neighborhoods, nodes, and references.
Gordon Cullen further developed Lynch’s city studies by focusing on the route analysis. In “Townscape” [
2], the author focused his attention on the individual episodes that occur daily and systematically within the cities and that help determine the urban landscape. Cullen explained and classified the events that are linked to each other within a path, a flow, a walk through the architecture of the city itself. The urban space is not an independent entity, but rather the perception of a consequential series of architectural and landscape shapes along a journey in a given time span. A city is not just the sum of its inhabitants and the urban space is more than the total number of its buildings.
In Life between Buildings [
4], Gehl examined the relationship between patterns of space use, specifically in outdoor activities, and the spatial properties of the physical environment. Gehl suggested a straightforward approach to improve the urban shape, which derives from systematically documenting the performance of urban spaces and analyzing what factors influence their use. Gehl used the human dimension as a starting point in his analysis and measured the success of the urban environment by quantifying the levels of pedestrian flows, levels and length of stationary activity—including human contact and social interaction. To Gehl, the urban landscape should be considered through the five human senses and experienced at walking rather than driving speed.
In Public Spaces Public Life (1996 with Lars Gemzøe) [
5], Gehl described his research about downtown Copenhagen. He analyzed the impact of the pedestrianization policy and public space refurbishing projects that were carried out in the Danish city from the early 1960s onwards. Today, it can be stated that those policies increased the vitality of social practices and improved the enjoyment of public spaces.
In “Movement in Urban Space: Drake’s Place Garden Case Study” [
6], these topics are considered in the context of urban theories. Space Syntax theories and methodologies play an important role in understanding socio-spatial integration and segregation, and the impact of distance perception when choosing a given route. This latter can be influenced by a clear understanding and subtle urban design qualities. These have an impact on the perceived walkability of a sequence of spaces.
These methodologically different approaches can be taken as a reference to understand the dynamics of contemporary cities and can be applied to new types of situations arising from a changing urban fabric in modern society.
In addition, it is interesting to understand how the perception of the urban landscape can change depending on the speed of use and the viewpoint of the observer.
Cullen’s studies focus on perception from the viewpoint and speed of a walking man.
Today, thanks to multiple means of transport, the modes of perception of the anthropic space are enriched by further procedures. In these latter, the distance and position between the observer and the object varies. The same applies to the speed of use, and the shape, material and consistency of the medium through which we observe a given space (without any medium, with a glass/transparent material, with double glass/transparent material or with glass/laminated transparent material). This generates a visual perception of a moving vehicle, where the point of view is that of an individual sitting on a car’s seat. It may vary by a score of inches between a very low car and, for example, the top floor of a double decker bus; a train, where the observer is in a higher position than that of the motor vehicle and, in this case, may also enjoy a ride from the top wagon (as with Italian regional trains). Finally, a view from above, from the window of an aircraft as it takes off or lands.
3. Projection Mapping
Projection mapping (or video mapping) is a particular type of augmented reality. It is generated through digital processing, which interacts with an area that is not necessarily flat, projecting an image or a flow of images onto it.
The term “projection” means the act of projecting on a surface, while the technical word “mapping” indicates the mapping of the surface on which to project, i.e., its breakdown into less complex geometries with which it is possible to interact.
Perception from the viewer’s perspective increases, with the addition of certain proposed information, which may both add and subtract both the perceived and existing features. Augmented reality, however, allows to perceive and interact with physical reality, but uses different media to enrich it, for example through the use of smartphones, earphones, sensors, camcorders or as in the case of “projection mapping” with the use of a projector [
7].
The geometric study and architectural survey are two key points in designing a projection on an architectural structure that consists of several layers and includes:
a direct or indirect survey of the structure or environment that will be covered by “projection mapping”. The choice of the survey methodology depends on a number of factors, such as the complexity of the object to be “mapped” in terms of size (height and width), shape and details of the facade on which the projection will be performed. For simple shaped objects, it is sufficient to perform a direct survey with traditional instruments and a photographic survey of the surface of interest. More complex objects, like the façade of a church or archeological finds, can be surveyed through 3D laser scanning or photomodeling. The objective of the survey is to create and control a virtual 3D model;
generation of a measurable 3D mesh model, a virtual replication that perfectly matches (whatever its scale is) with the real object being surveyed. The subsequent processing and transformation are made on the 3D model to create a “projection mapping” performance;
study and realization of geometric transformations, in order to match the virtual architectural 3D model with the real one. Here, some principles of descriptive geometry such as homotetics, homography, and anamorphism are applied.
Homothety is a geometric transformation that allows a dilatation or contraction of the detected space while maintaining the shape, angles, and relationship between them unchanged. Having the homothety as a point of reference, the object of interest undergoes a homogeneous transformation to generate a second space whose points exactly correspond to those belonging to the architecture taken as a reference point. After designing the animation on the detected space, the projected image on the architectural surface is adjusted to correct any aberrations, the so-called “wrapping”. The resulting illusion consists of a distorted image on the surface that can be perceived correctly by the observer from a precise position, through the rules of anamorphism; after selecting or creating the object to be projected, a special software “maps” the video onto the surface on which it is projected, moving the corners of the video to fit the shape of such surface. Alternatively, you can choose to map the entire 3D scene using a “mask” to adjust the video to the surface on which it should be projected. The next step is called “masking,” where opacity “templates” are used to “map” the right shapes and place the images on different building elements or “projection space”. In “3D mapping”, the coordinates of the object to be projected relative to the XYZ location of the video projector and the lens characteristics must be known. BLAM! [
8] is an add-on software for Blender 3D open source modeler.
Finally, one must consider the power of the video projector. For outdoor video projections on large buildings, it should have a minimum power of 20,000 lumen, whereas 2200 lumen can be sufficient indoor.
After choosing or creating the object to be projected, a specific software maps the corners of the video to the surfaces.
First, one must choose the images or video to project. Then, each video must be placed onto the selected surface. Alternatively, one may choose to map the entire scene in 3D and attempt to project and mask the image back onto its framework. The next step is called “masking”, which means using opacity templates to actually “mask” the exact shapes and positions of the different elements of the building or space of projection. In 3D Mapping, coordinates need to be defined with respect to the object position vis-à-vis the projector, XYZ orientation, position, and lens specification of the projector. This gives rise to a pre-determined virtual scene. One tool to help achieve this end is BLAM! add-on for blender 3D’s open source 3D animation suite. Adjustments are generally required. They are made by manually tweaking either the physical or virtual scene for best results. 20,000 lumen projectors or more powerful ones are used for large-scale projections such as on skyscrapers. As to smaller projects, a projector with fewer lumen is sufficient. A 2200 lumen projector is adequate for most projections under indoor light or theatrical lighting.
Thanks to this methodology, architecture looks liquid and moving; it adheres like a film, deforms and disengages from the real surface.
“Projection mapping” is a new frontier of art, technology and visual design to create the smart city, an immediately recognizable modern urban area. “Projection mapping” is a sophisticated projection technique that transforms any type of surface into a dynamic display, turning architecture into a new communication media.
Animations, videos, and lights effects can convey an advertising message, information, or describe the story of an object or environment. The final result is an explosion of images that can totally engage the viewer with every event turning into a mass illusion.
The digital art of projection mapping is now commonly employed. It raises an ever-growing interest in the urban sphere, where it follows two prevailing directions. On the one hand, merely artistic performances, where the goal is to arouse “emotions” in the viewer; on the other hand, however, it entails a more complex “story telling” that is intended to tell the story of the place or object on which the video projection is performed.
Some of the most recent examples of art performances include RO_map [
9], organized in the heart of Rome in 2015 and 2016, and LPM (Live Performers Meeting) [
10]: created in 2004, it is a live variation of “projection mapping” with experiences related to vjing, v (ideo) j (ockey).
As regards “dissemination”, the Augustus Forum and the Caesar’s Forum in Rome are two convincing examples. Since 2014, the two Fora have come to life thanks to a self-narration with images, animated projections and lights colors: Journeys through Ancient Rome [
11].
4. Research Objectives
Our research aims at analyzing the use of colors, light and shapes in the world of design and “cultural heritage” using new technologies to interact with the space surrounding a moving observer and understand the most probable future scenarios.
A case in point is the promotion of a showroom on the Grande Raccordo Anulare (GRA, Ring road) in Rome, based on perception from moving vehicles.
The showroom location is particularly interesting since it exhibits the following features:
the area is located in a place delimited on both sides by the GRA following the completion of the 3rd lane in 2000. Due to the massive presence of craft workshops that could not be demolished or expropriated, ANAS was forced to split the GRA. They placed the lane of the outer ring in the old site whereas the craft workshop area is located next to the inner lane limit, toward the city;
the presence of several workshops and plants along this section of GRA often causes a slowdown in the vehicle flow both in the inner and external lanes, with some congestion times;
it allows a visual design that focuses on a visual interaction with architectural structures or settings through audio, video, and site-specific installations.
Our research explores a number of previously analyzed aspects within the framework of urban landscape perception, “projection mapping” and “interactive design”. Its purpose is to create an attractive identity of a building or urban area to the observer’s eye. The observer has intrinsic features of movement and mobility.
Likewise, the application is smooth and dynamic. “Projection mapping” (
Figure 1) is made on an industrial architecture, with an adaptive (interactive) design according to the various space-time conditions around it.
An automatic interaction and management system has been created. It suits the structure or space considered. The interaction with the observer controls and modifies the content, depending on the movement (displacement) of this latter. More specifically, visual themes are exhibited based on the flow of traffic around the selected building or space, and adapt themselves to the perception of motorists and possibly any car passengers.
A further variable, linked to the sensor, is the use of Google Maps and a system to display the vehicle flow with real-time monitoring. The data from the monitoring system, combined with those gathered on site, determine a vehicle flow pattern, with respect to which the “projection mapping” application changes brightness and contents, in a sort of “interactive design” linked to the movement of vehicles.
5. Perception Analysis, Vehicle Flows and Light Hours in the Selected Area
After identifying the site for a methodological exemplification, the urban landscape is analyzed in an effort to contextualize the selected building. The preliminary survey aims at evaluating the effects that the landscape exerts on the observer’s perception. In particular, reference is made to the studies conducted by Kevin Lynch and Gordon Cullen.
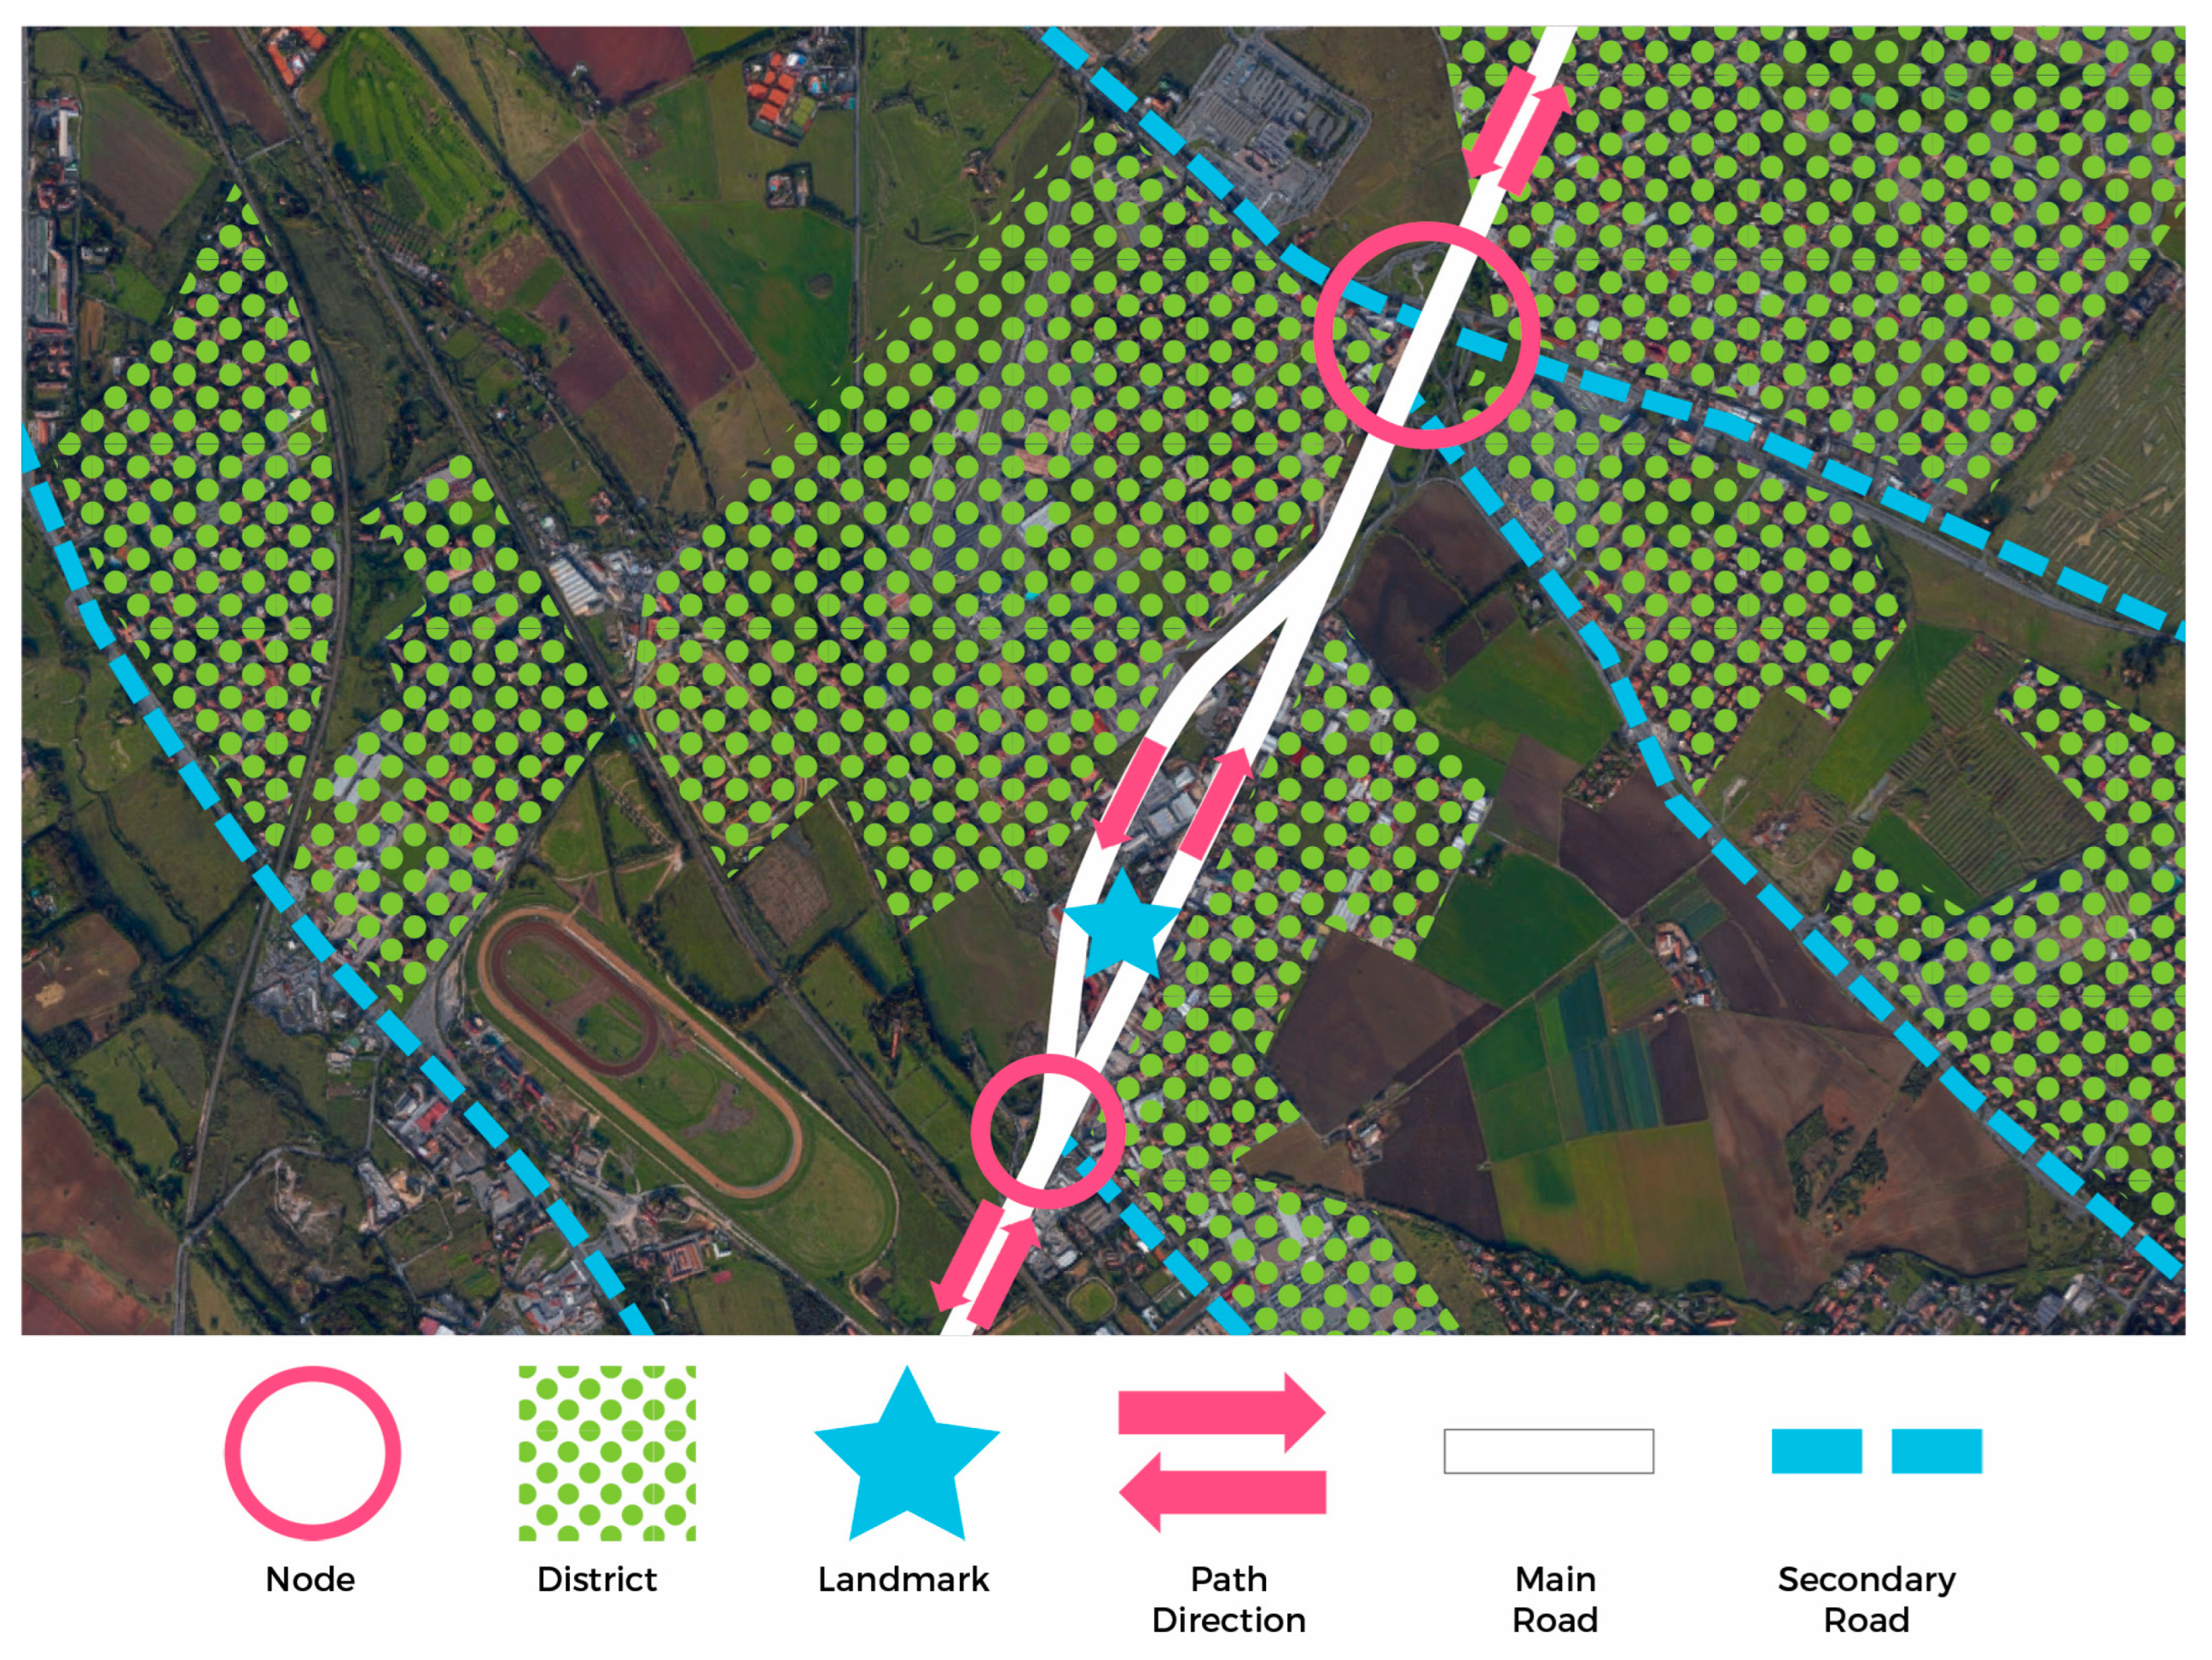
Following the classification proposed by Lynch, satellite views of the area around the showroom are used to identify the “main” and “secondary” road arteries. In addition to accommodating a continuous flow of cars, they act as barriers and define some agglomerations of houses and commercial buildings, called “districts”. At their intersections, they identify “directional nodes”, key point for road traveling.
According to the legend, inspired by the one developed by Lynch, one can observe how the showroom (landmark) is located at the center of the bifurcation of the Grande Raccordo Anulare, between two nodes (
Figure 2).
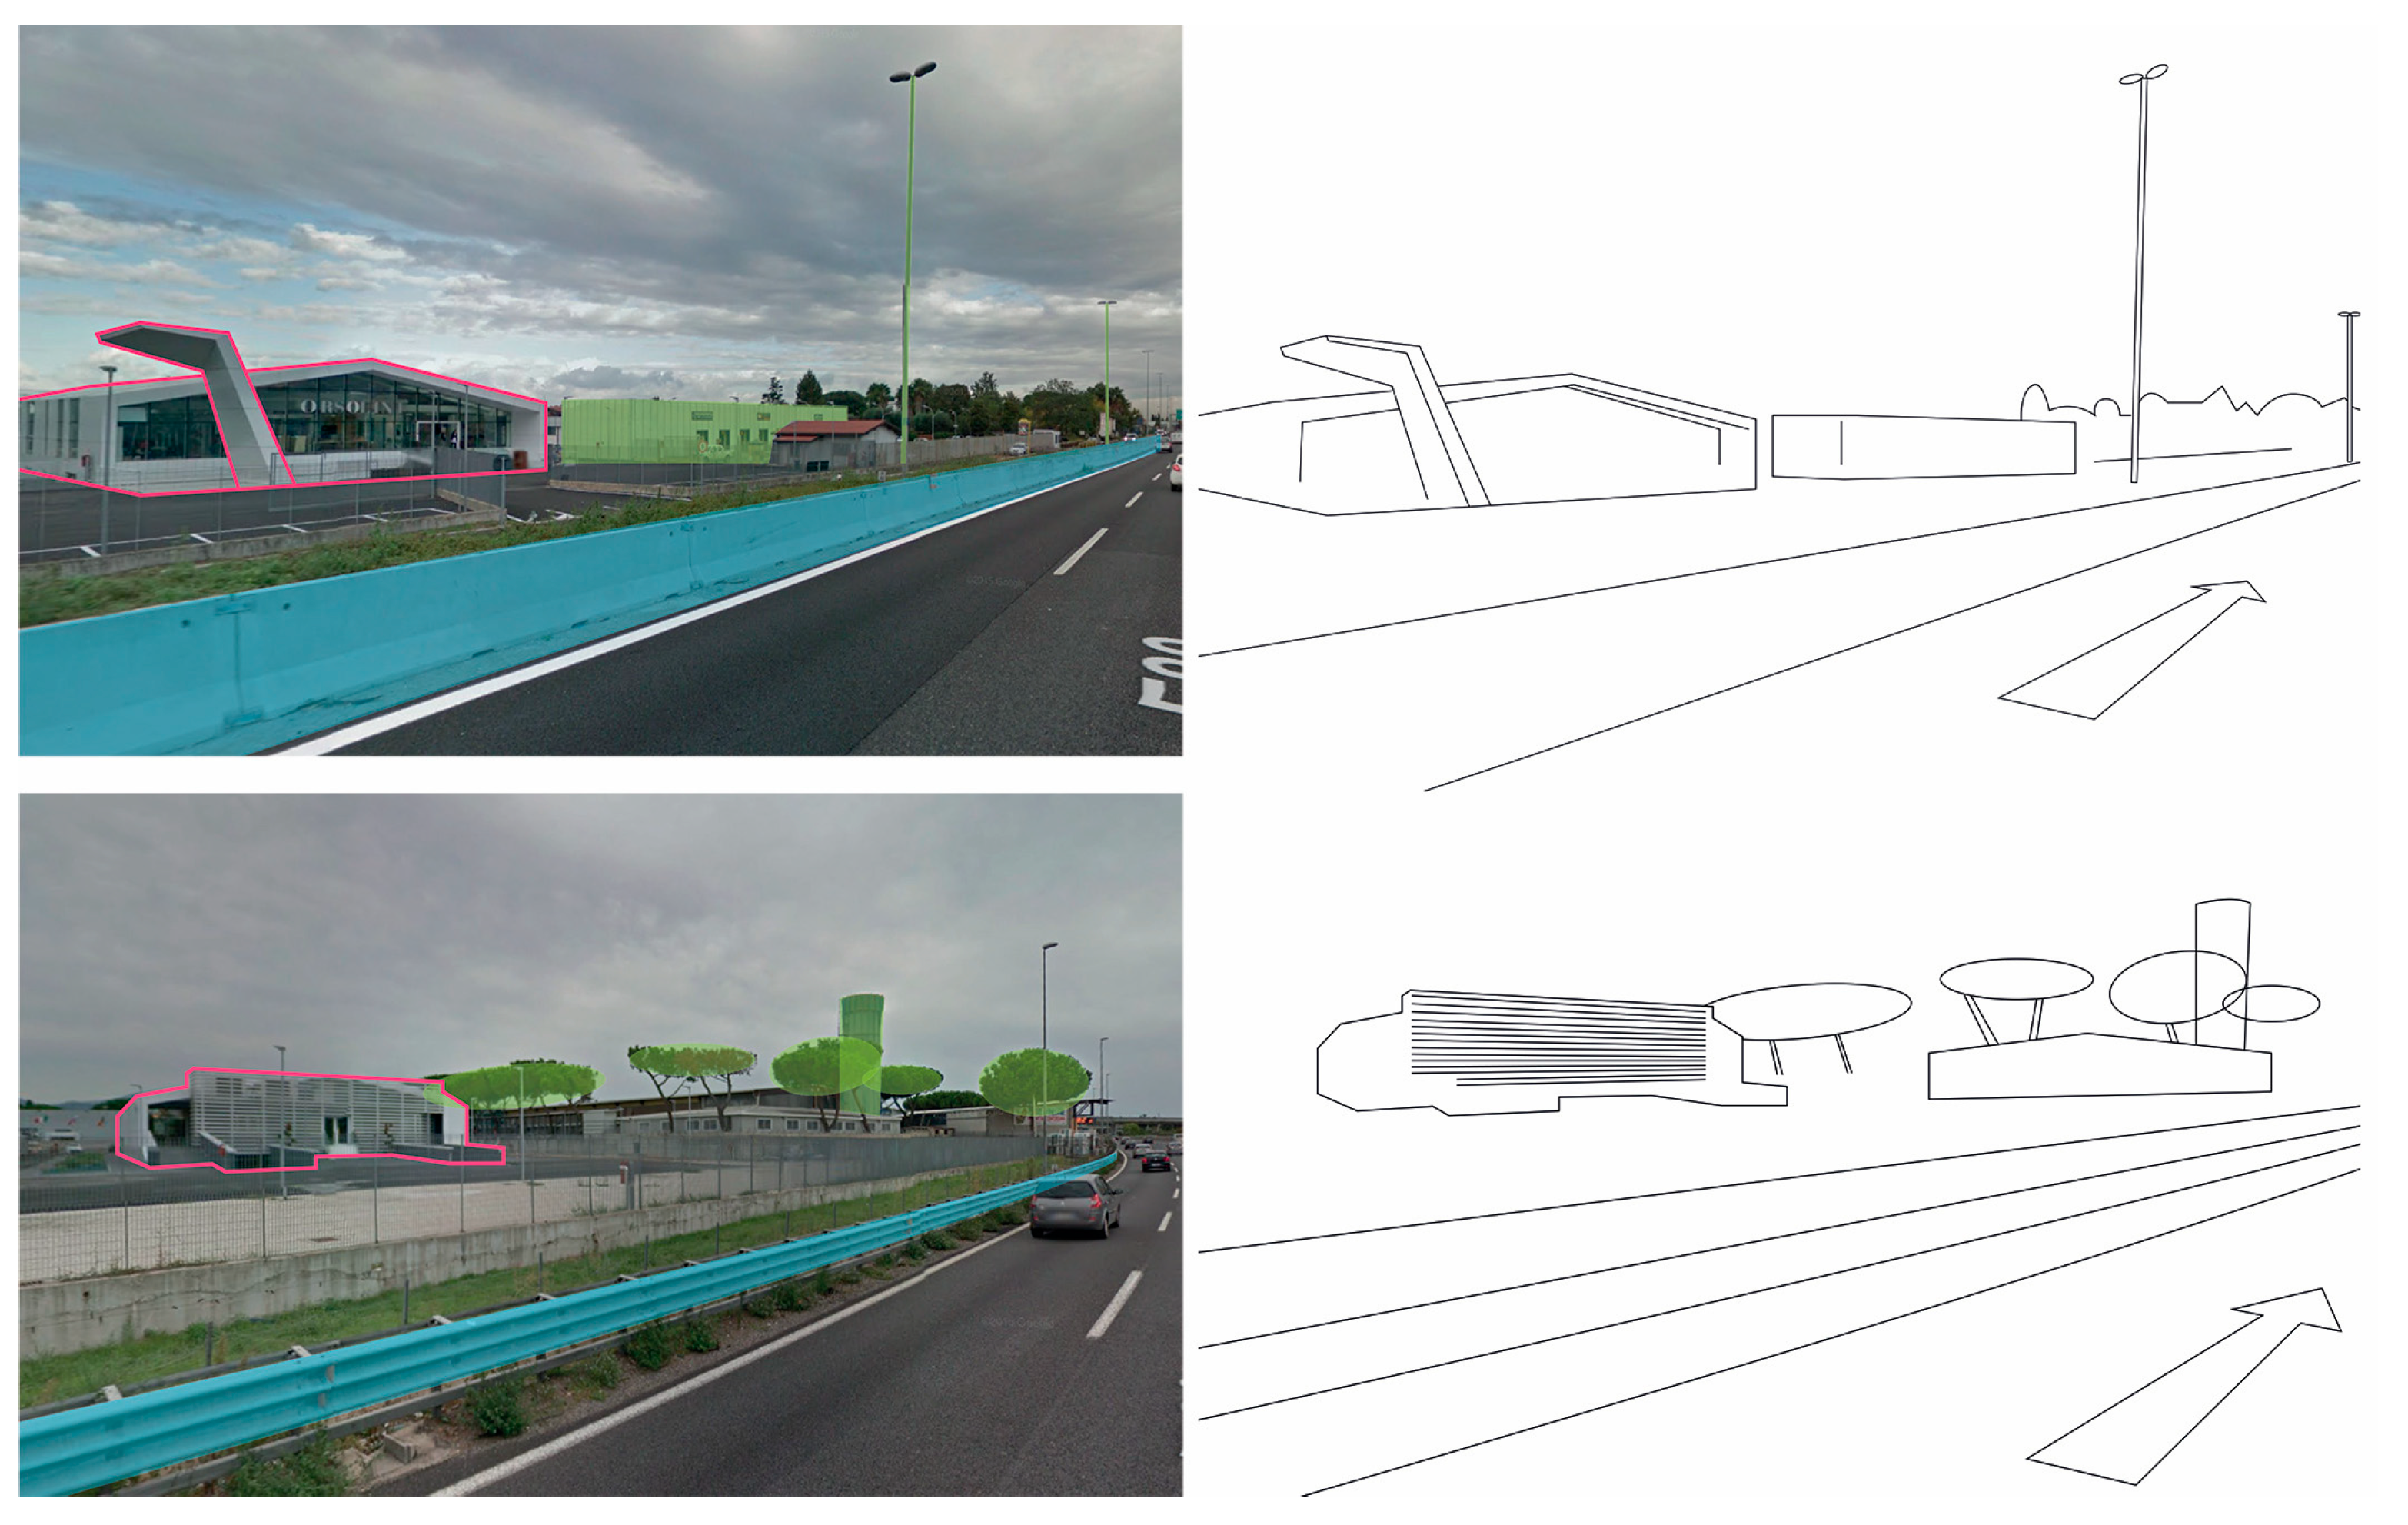
In line with Cullen’s studies, the perceptual influence is analyzed in a more specific way and from the eye of an observer inside a car (
Figure 3). The analysis focuses on identifying the predominant characters of the visual field and, consequently, on their perception, marking them with different colors. The front side of the showroom (external carriageway of GRA) is a contemporary architecture that can be clearly distinguished from the surrounding landscape. The back of the showroom (inner carriage of GRA), on the other hand, has a simpler and more compact architectural shape.
The report published by Studio Associato per il Trasporto, il Traffico e l’Ambiente (StudioTTA) in collaboration with Azienda Nazionale Autonoma Strade (ANAS) was taken into consideration to examine the mobility flows on the road network of Rome. The study analyzes the traffic flow on Rome’s GRA and especially between Tuscolana (Anagnina) and Appia junctions. The analysis was carried out with a dynamic traffic simulation software. A detailed analysis of the two junctions highlighted the main causes of slowdowns and traffic jams at peak times. Traffic measurements have confirmed, based on the time slot as well as on in-depth measurements taken at regular intervals, that the road capacity dramatically exceeds its rated value, with peaks reaching 200% of its range. The result shows the presence of conflict points due to design errors in the entrance and exit junctions of GRA. Roads, therefore, suffer from severe congestion at several times during the day. This is due to the intense flow of transit traffic and the resulting vehicle density, well above the predicted figures. Discontinuity and congestion occur repeatedly. They result from the inefficiency of outbound vehicle junctions: at times, they cause minimal slowdowns that in normal circumstances would be irrelevant for the mainstream traffic. The causes of such irregularities can be found in the reduced maneuvering space between adjacent vehicles near the entrance and exit junctions, which immediately multiply such slowdowns along the entire road.
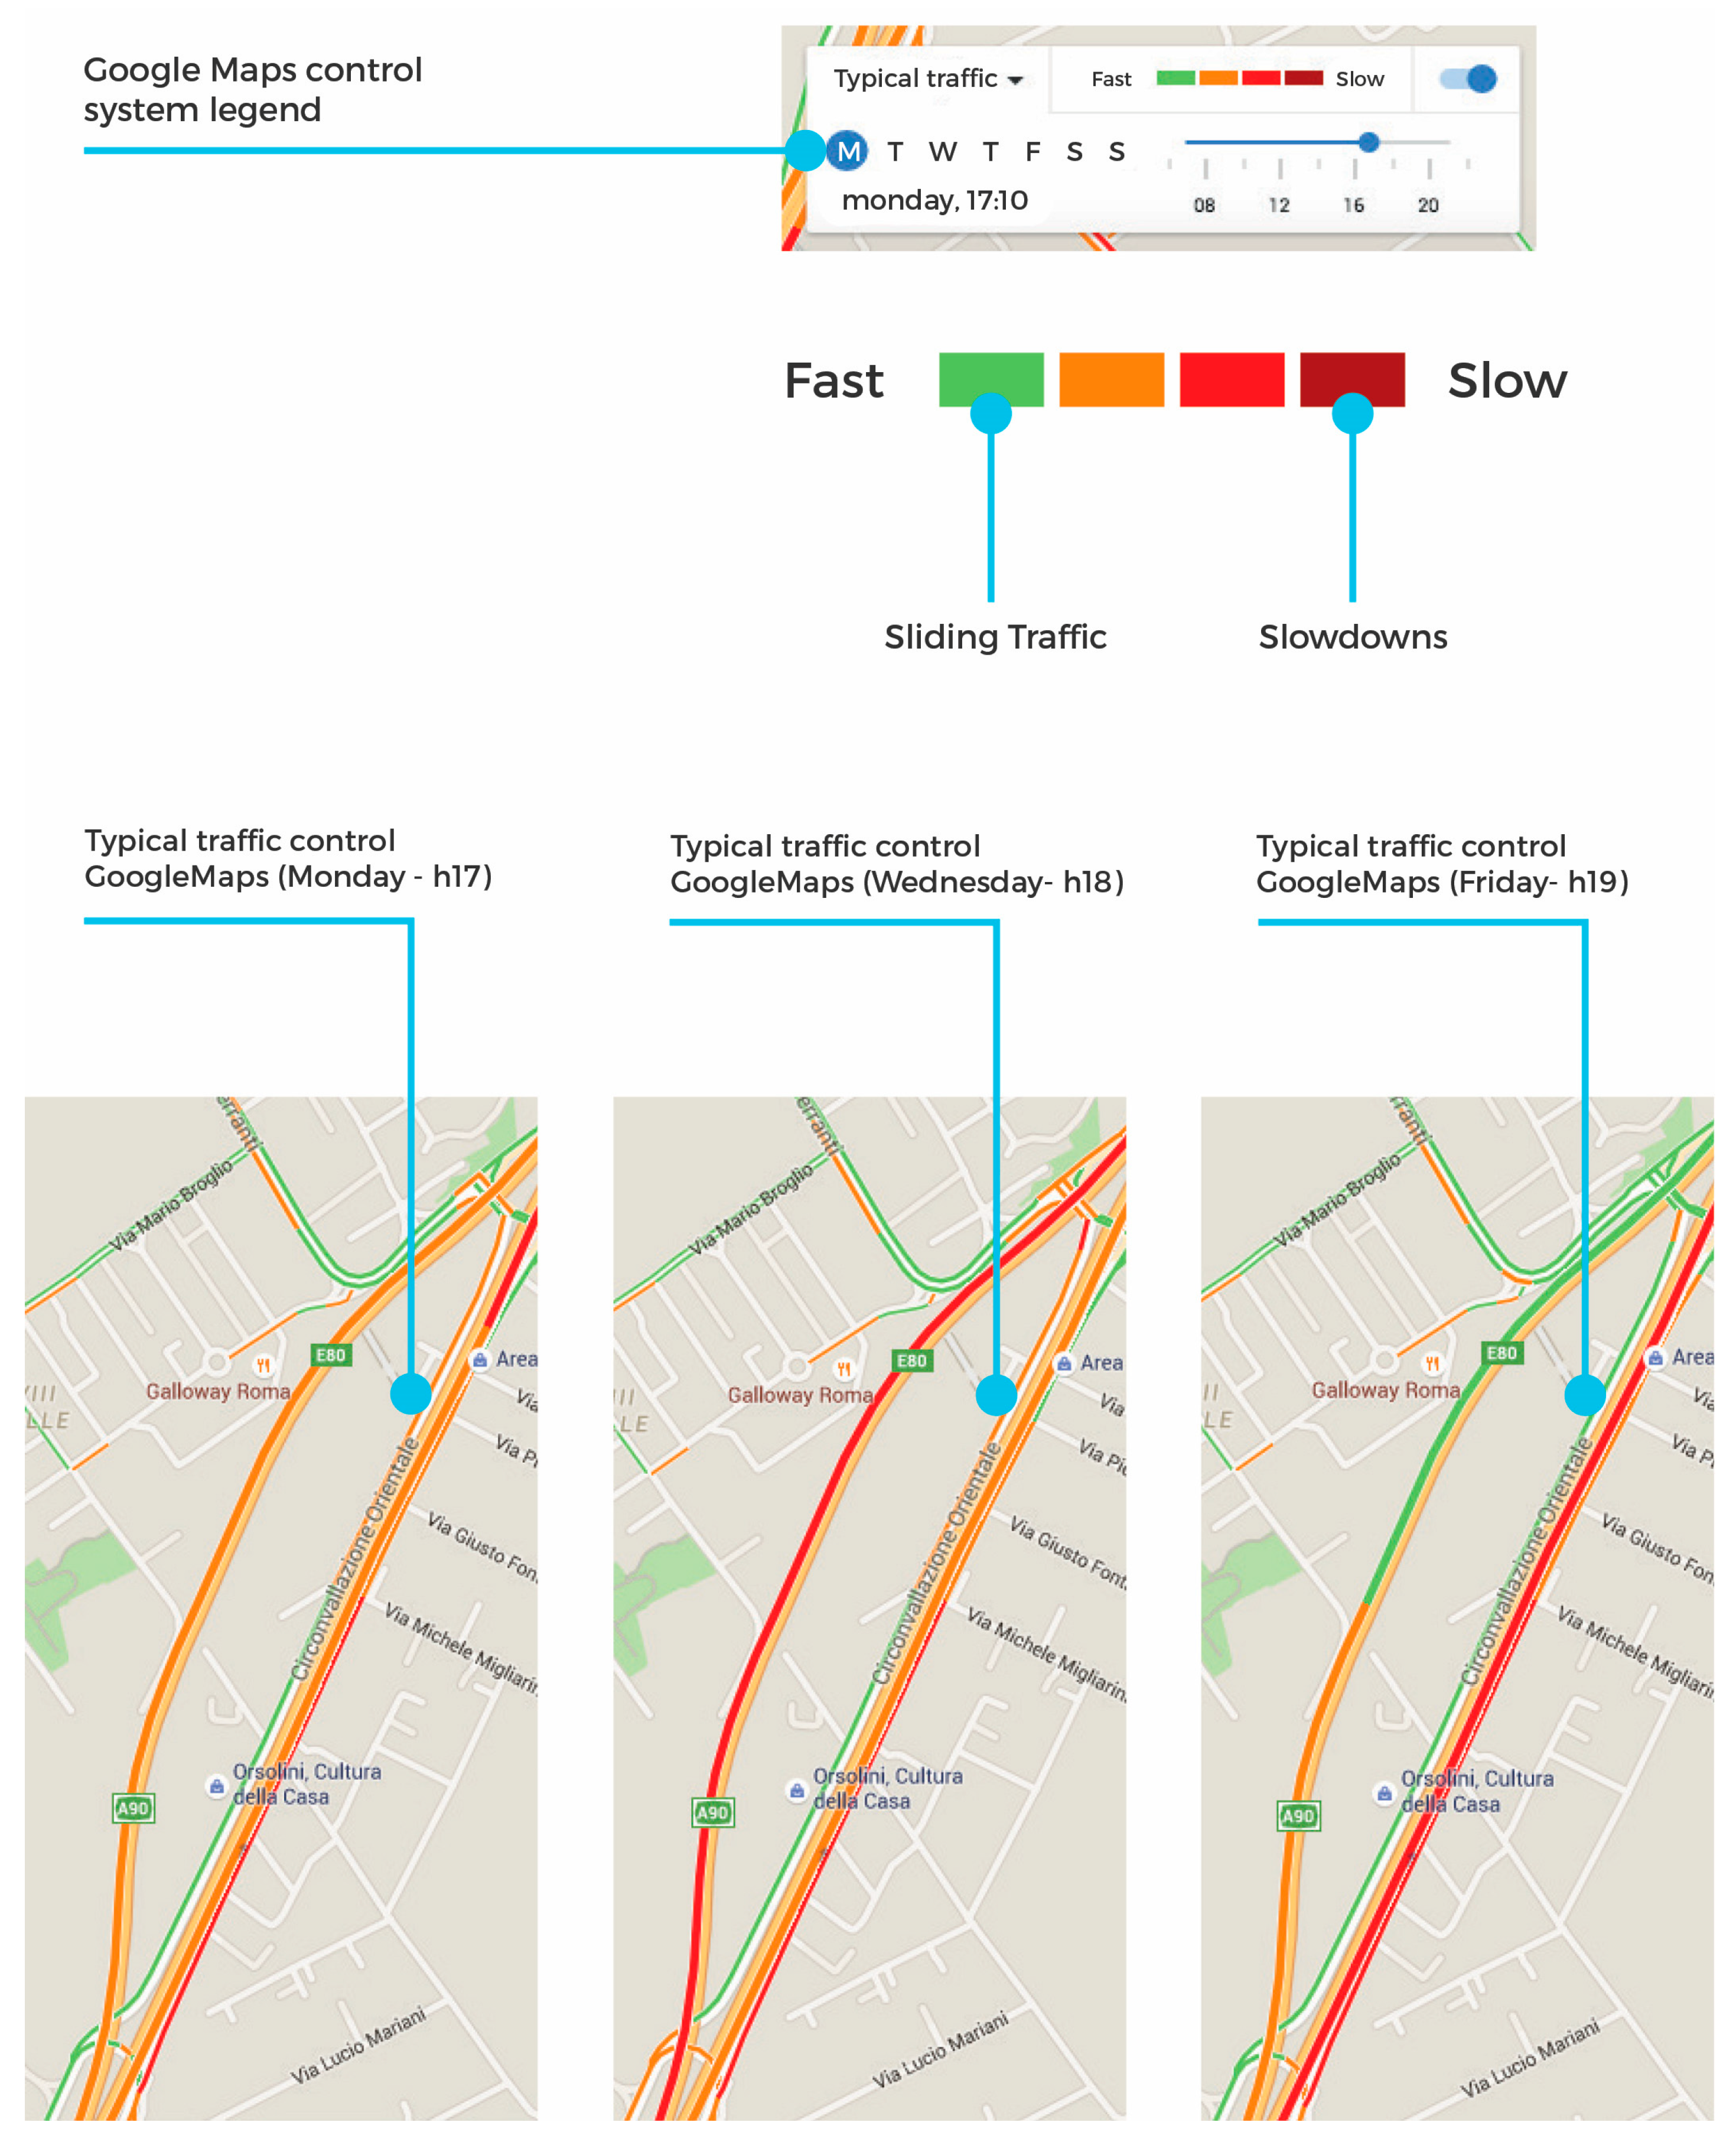
Another traffic flow analytical tool in the area of interest—related to time slots—is publicly available through Google Maps application (
Figure 4). The application embeds a system displaying the vehicle flow with real-time monitoring. Its ease of use and friendly nature is within the reach of any user. We took into account the evaluation scale used by Google Maps and some samplings in the area around the “showroom” on the East Section of GRA.
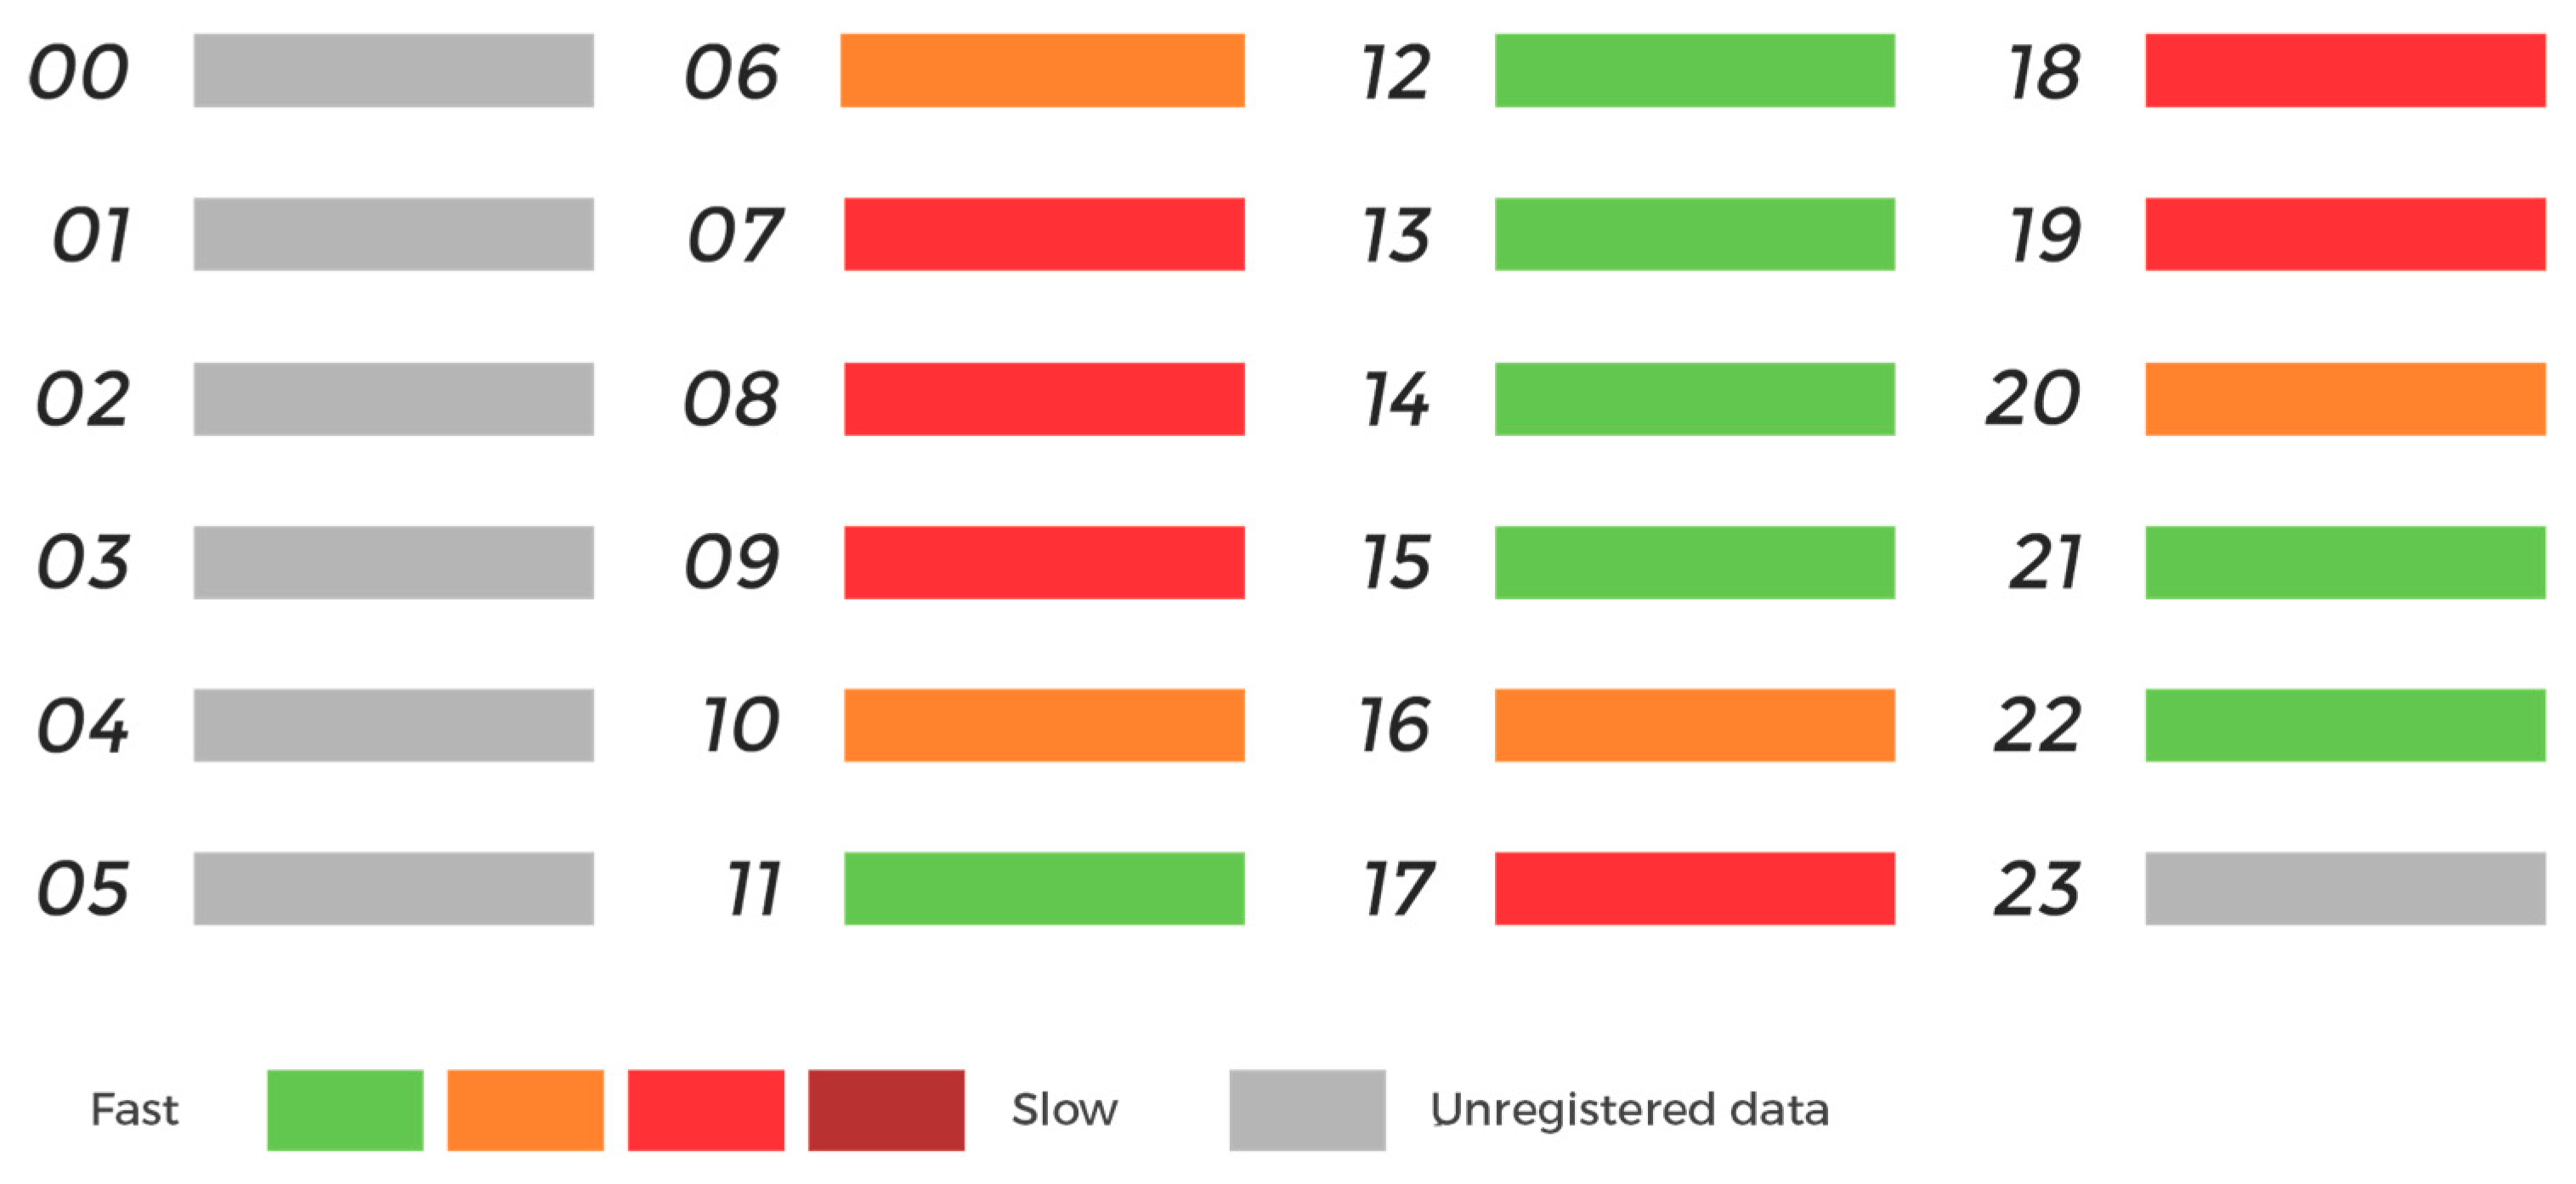
The hourly monitoring sets a limit to the system between 06:00 a.m. and 22:00 p.m. (
Figure 5), since traffic at nighttime is irrelevant. The peak hours are in the morning and in the afternoon, at the beginning and end of the work hours. The vehicle flow along this stretch does not belong to a specific population group; more generally, it consists of people who use the same space at the same time, a so-called “meeting point” or “touch point”. To achieve an effective “projection mapping” performance, you need to focus on “ambient advertising” techniques during the busiest timeslots.
The “projection mapping” technique, and therefore the projection of contents on a structure, requires favorable environmental conditions in spatial terms; above all, there must be a low brightness. At a design and communication level, the exposure of contents has a time limit during the day associated with sunset, when natural lighting dims. This data varies physically depending on the seasons, months, days and even the geographical area. It is therefore impossible to define a univocal projection start time.
By comparing the hourly traffic data on this GRA section, the daily hours of darkness, sunrise and sunset time in Rome, it can be inferred that the best design choice is to perform the projection in the busy traffic afternoon hours, also because of the environmental darkness. An environmentally friendly design includes a control system, which checks the presence of vehicles after 10 pm.
6. Dynamic Urban Projection Mapping
The survey and analysis of the showroom is the first step to define the nature and materials covering the “mapping” surfaces, both on the front (outer) and rear (inner) side.
The survey is executed directly by having access to project designs (the pavilion was recently renovated). It aims at verifying whether the execution is compliant and faithful to the design drawings, in terms of size, building partitions, and distance from the ring road.
Survey and design data are used to generate a 3D mesh model, on which project choices are made. These latter are related to the breakdown of the prospecting surfaces, and then mapped to adjust the “dynamic urban projection mapping”.
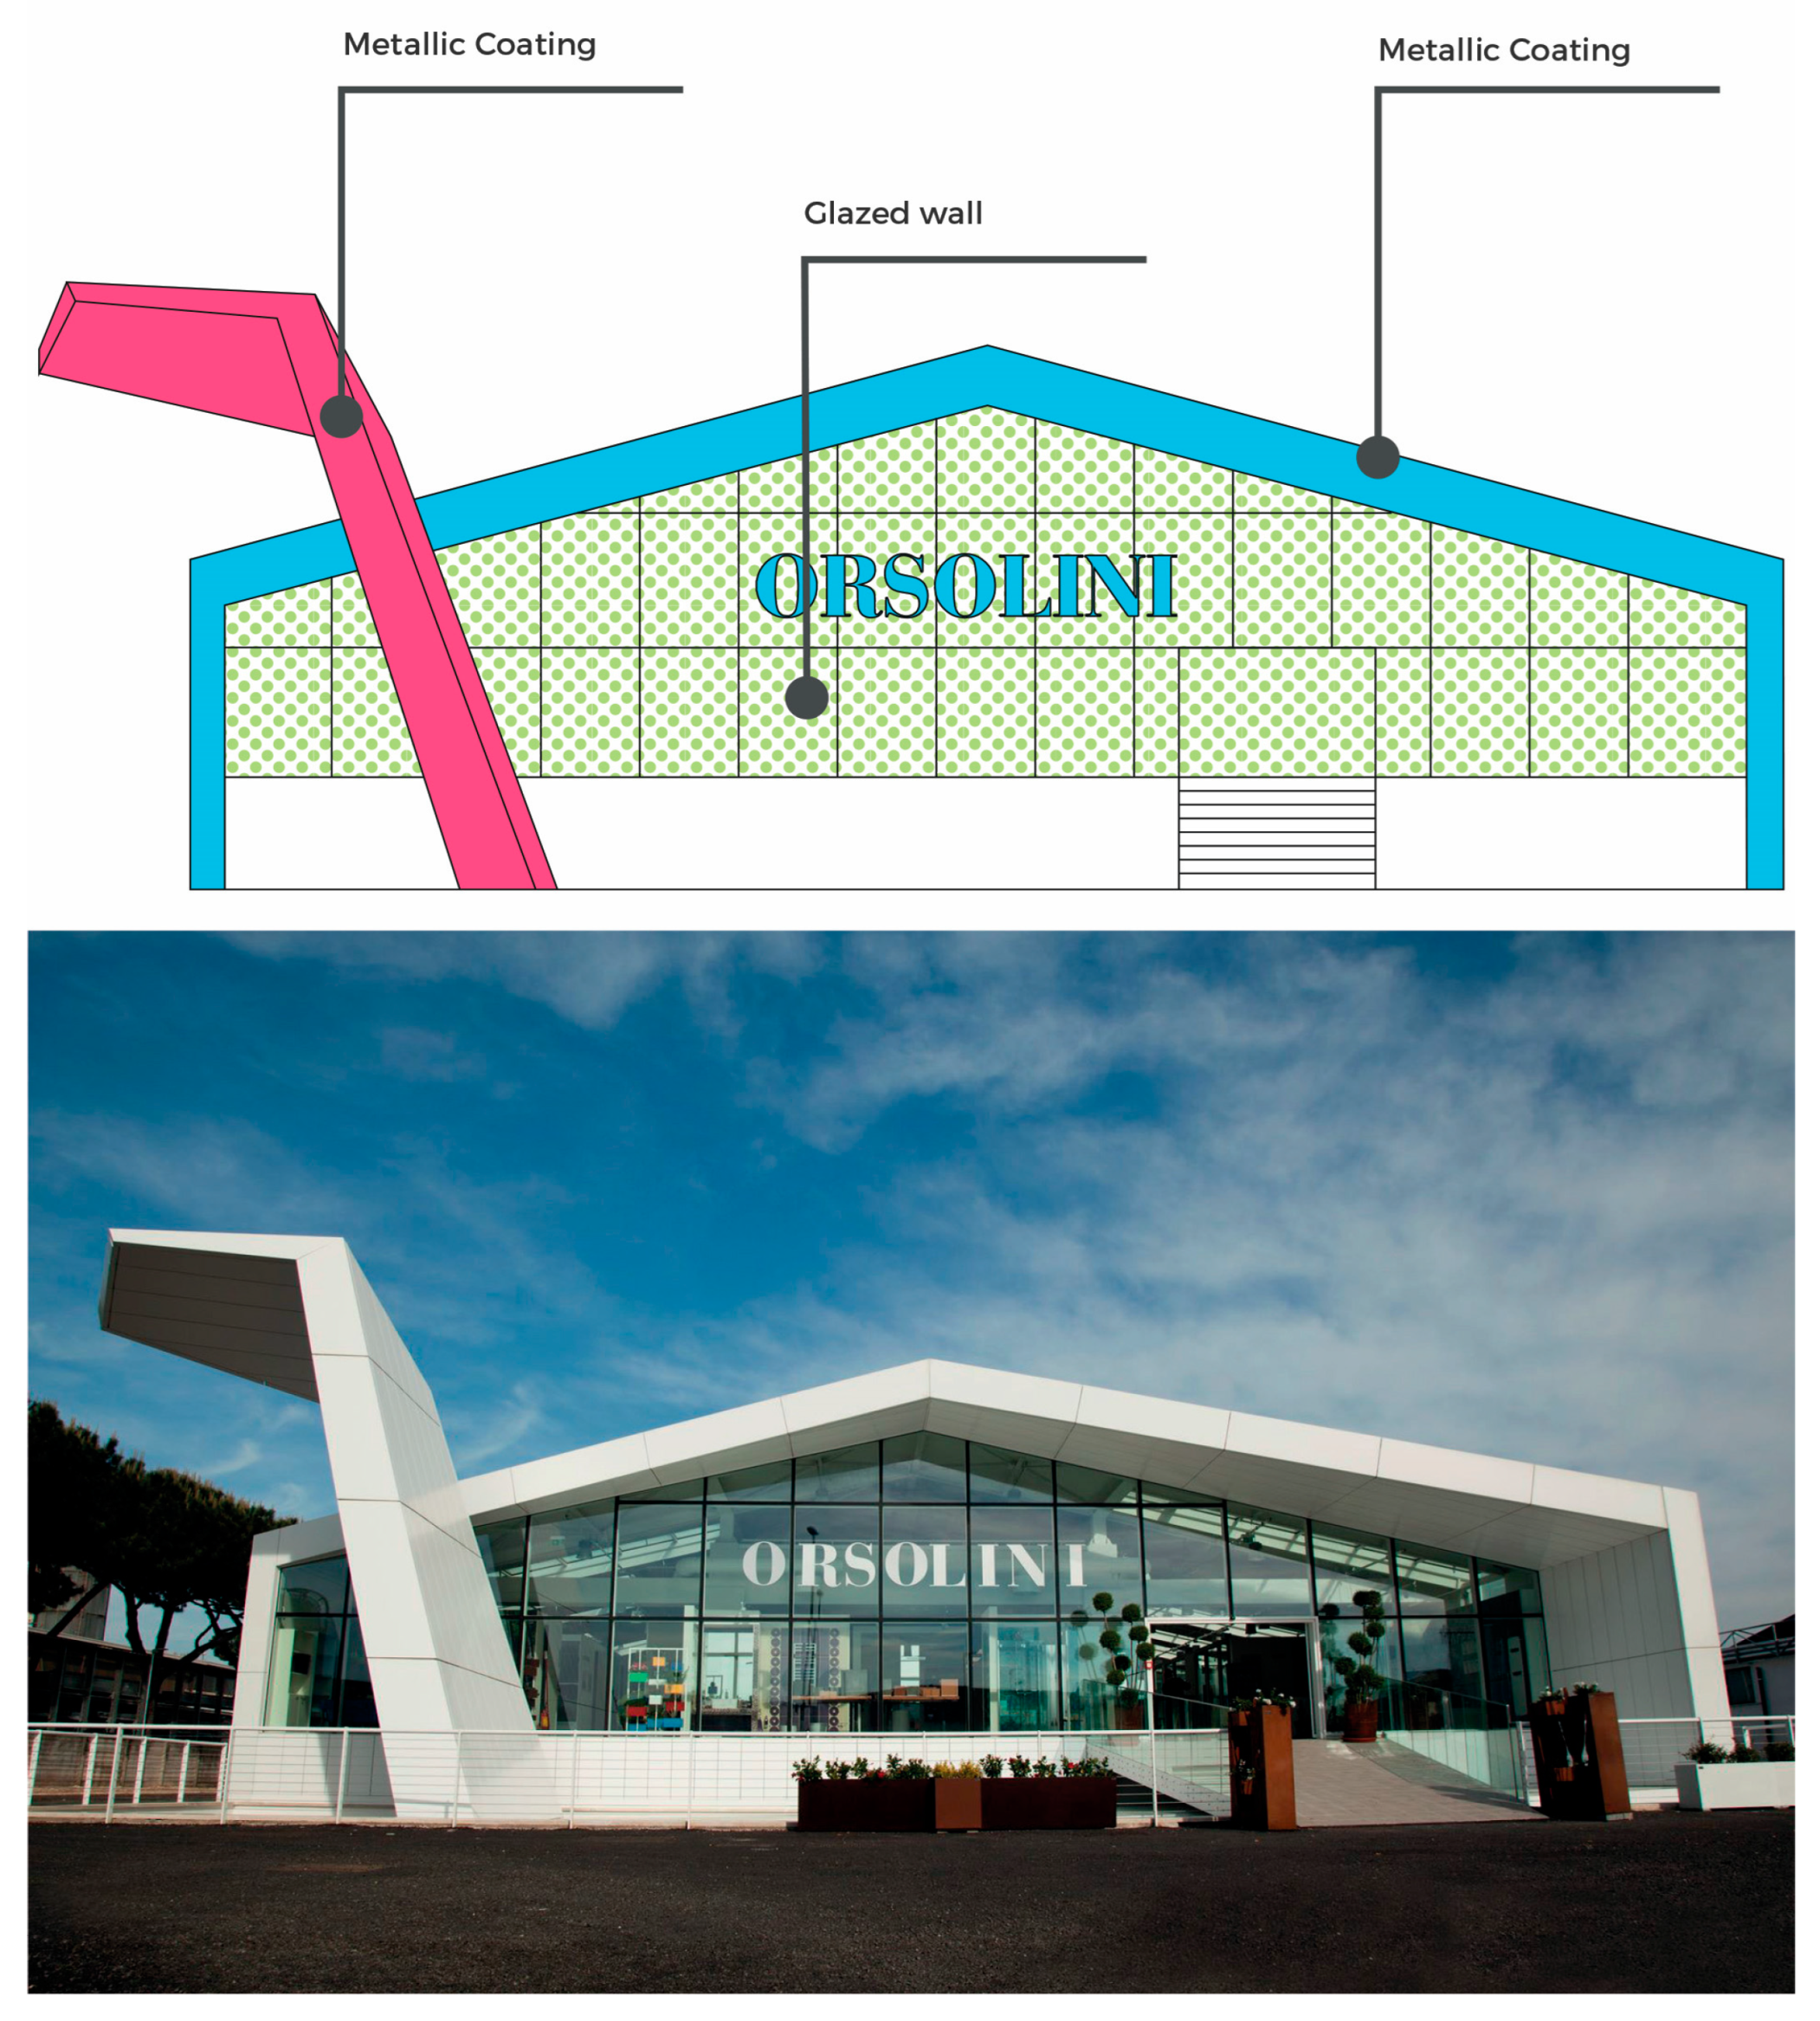
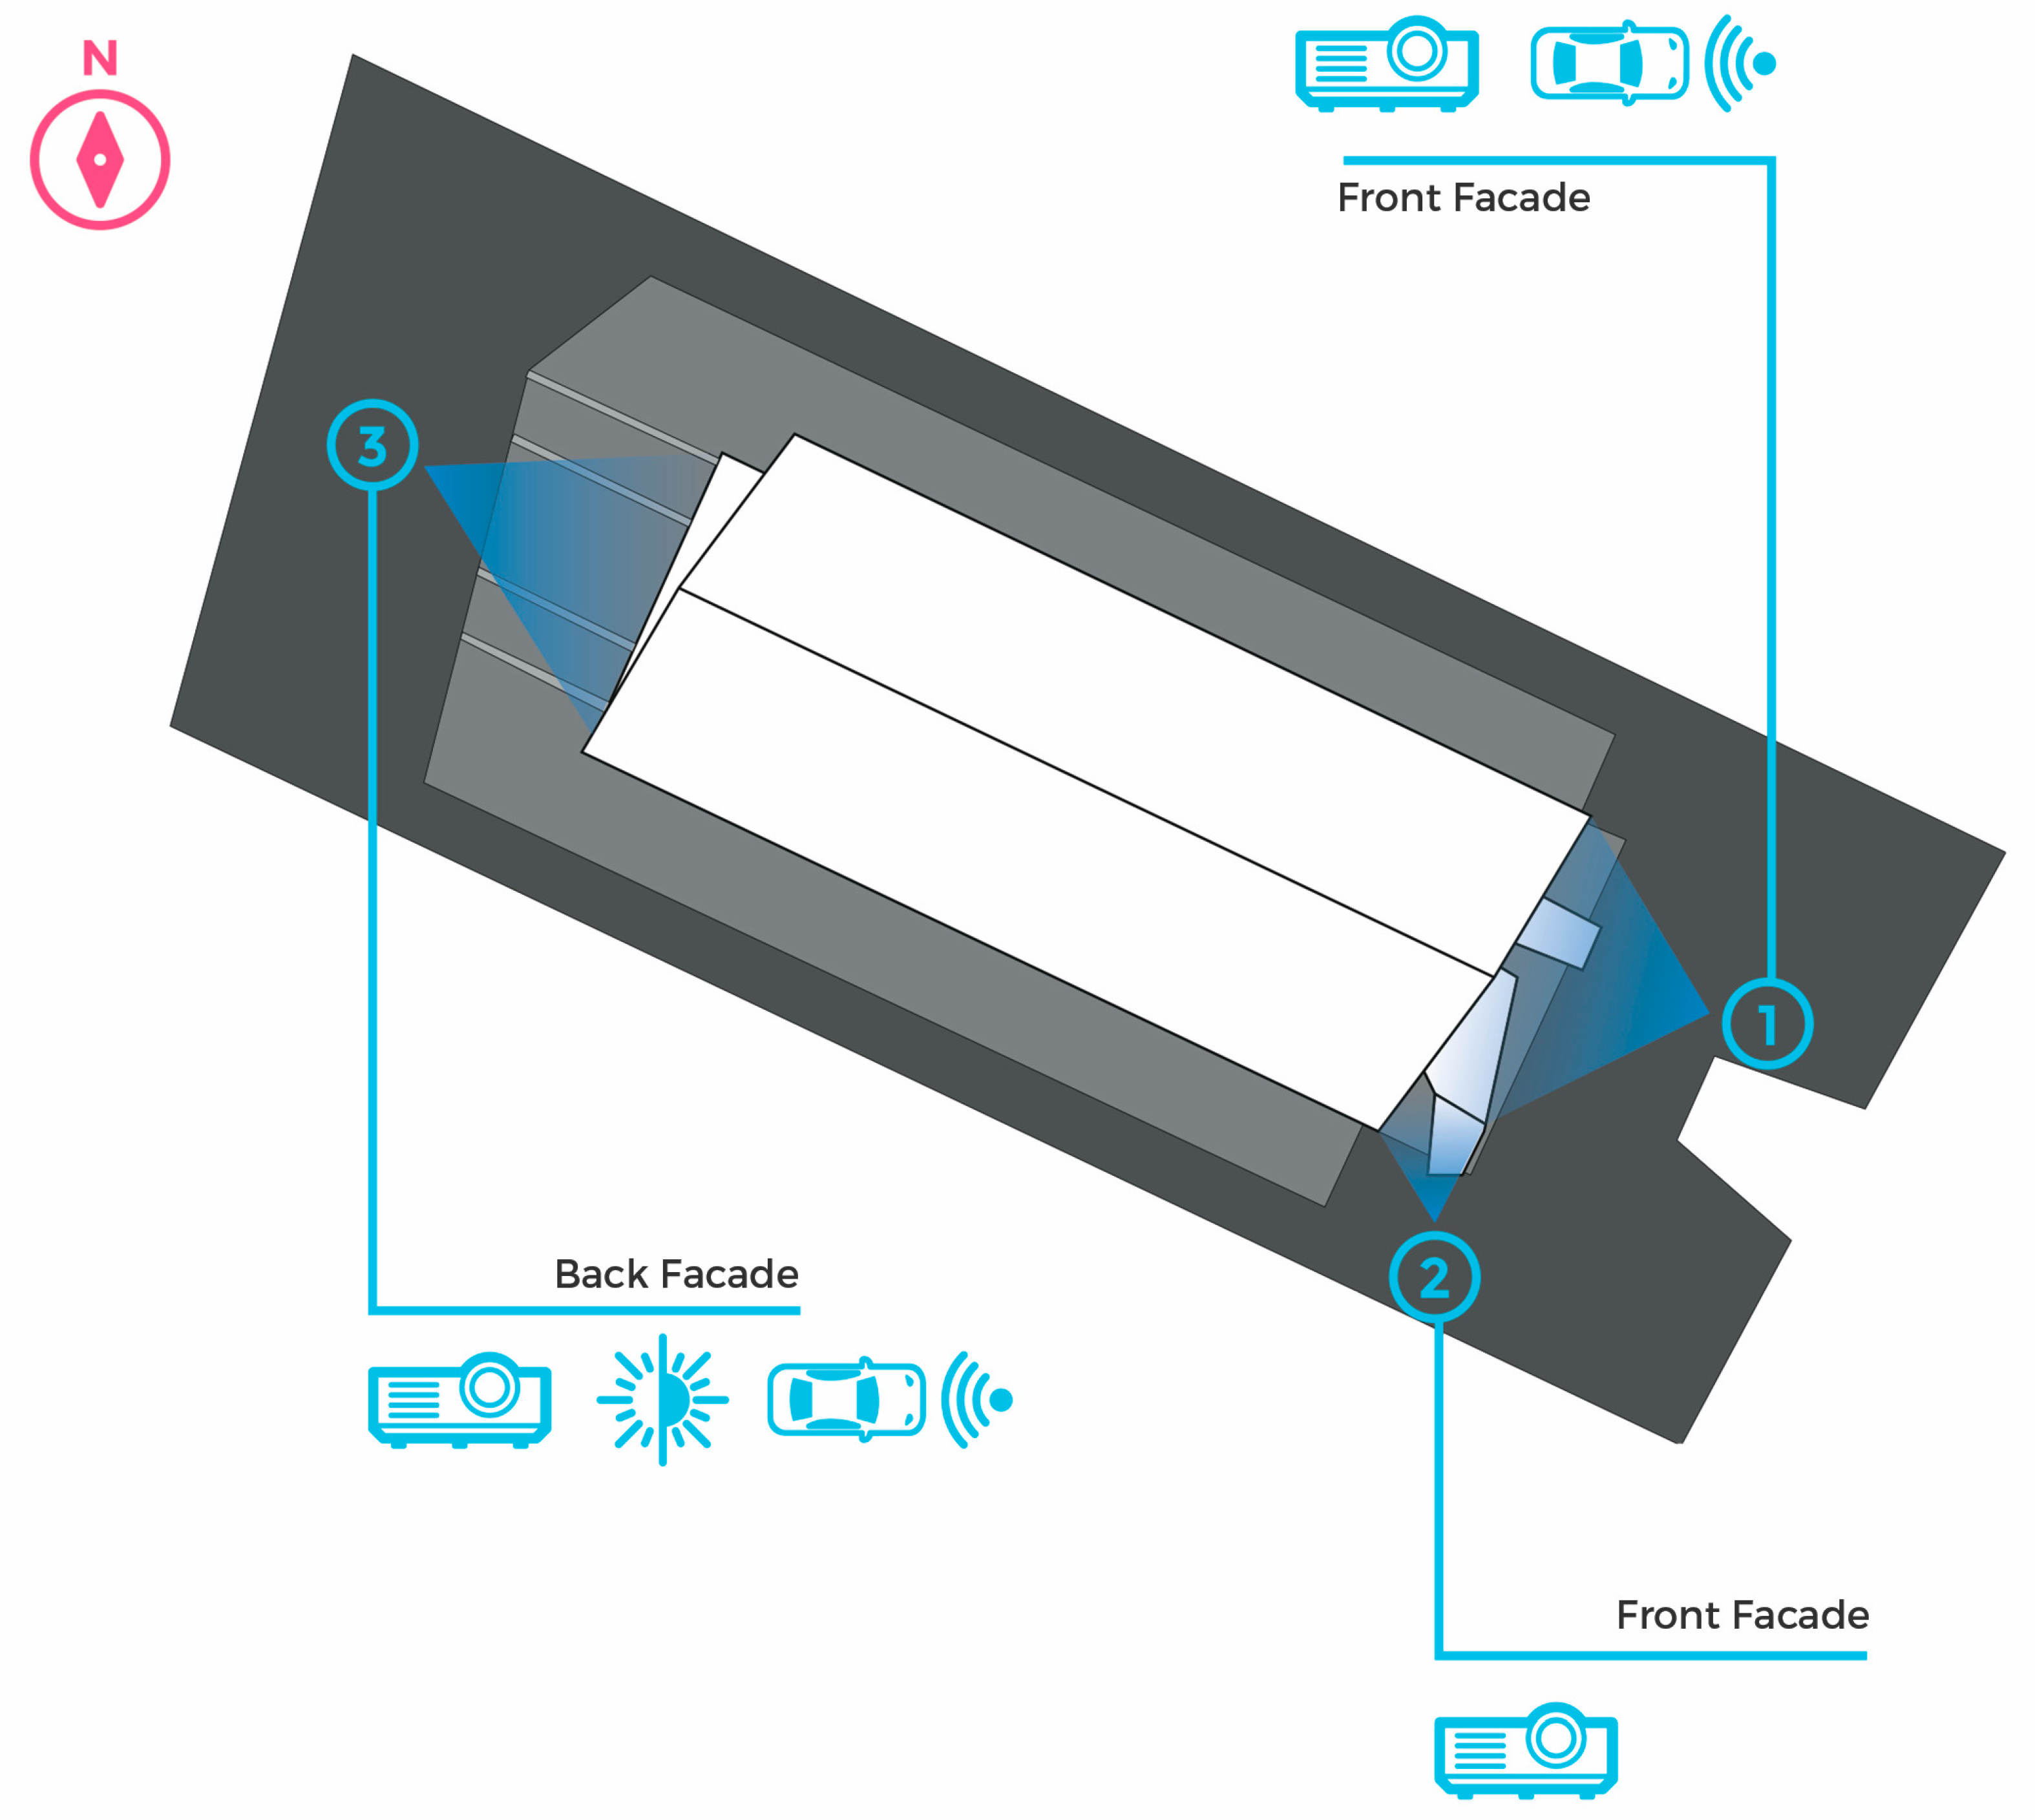
The front facade can be covered by 2 projectors (
Figure 6). A critical feature is the glass portion of the façade. This material allows the projector light flows to cross it. A good fix is a special transparent film to set and lock an image even when the indoor lights are on. It can be applied on any transparent glass, acrylic or plexiglas surface.
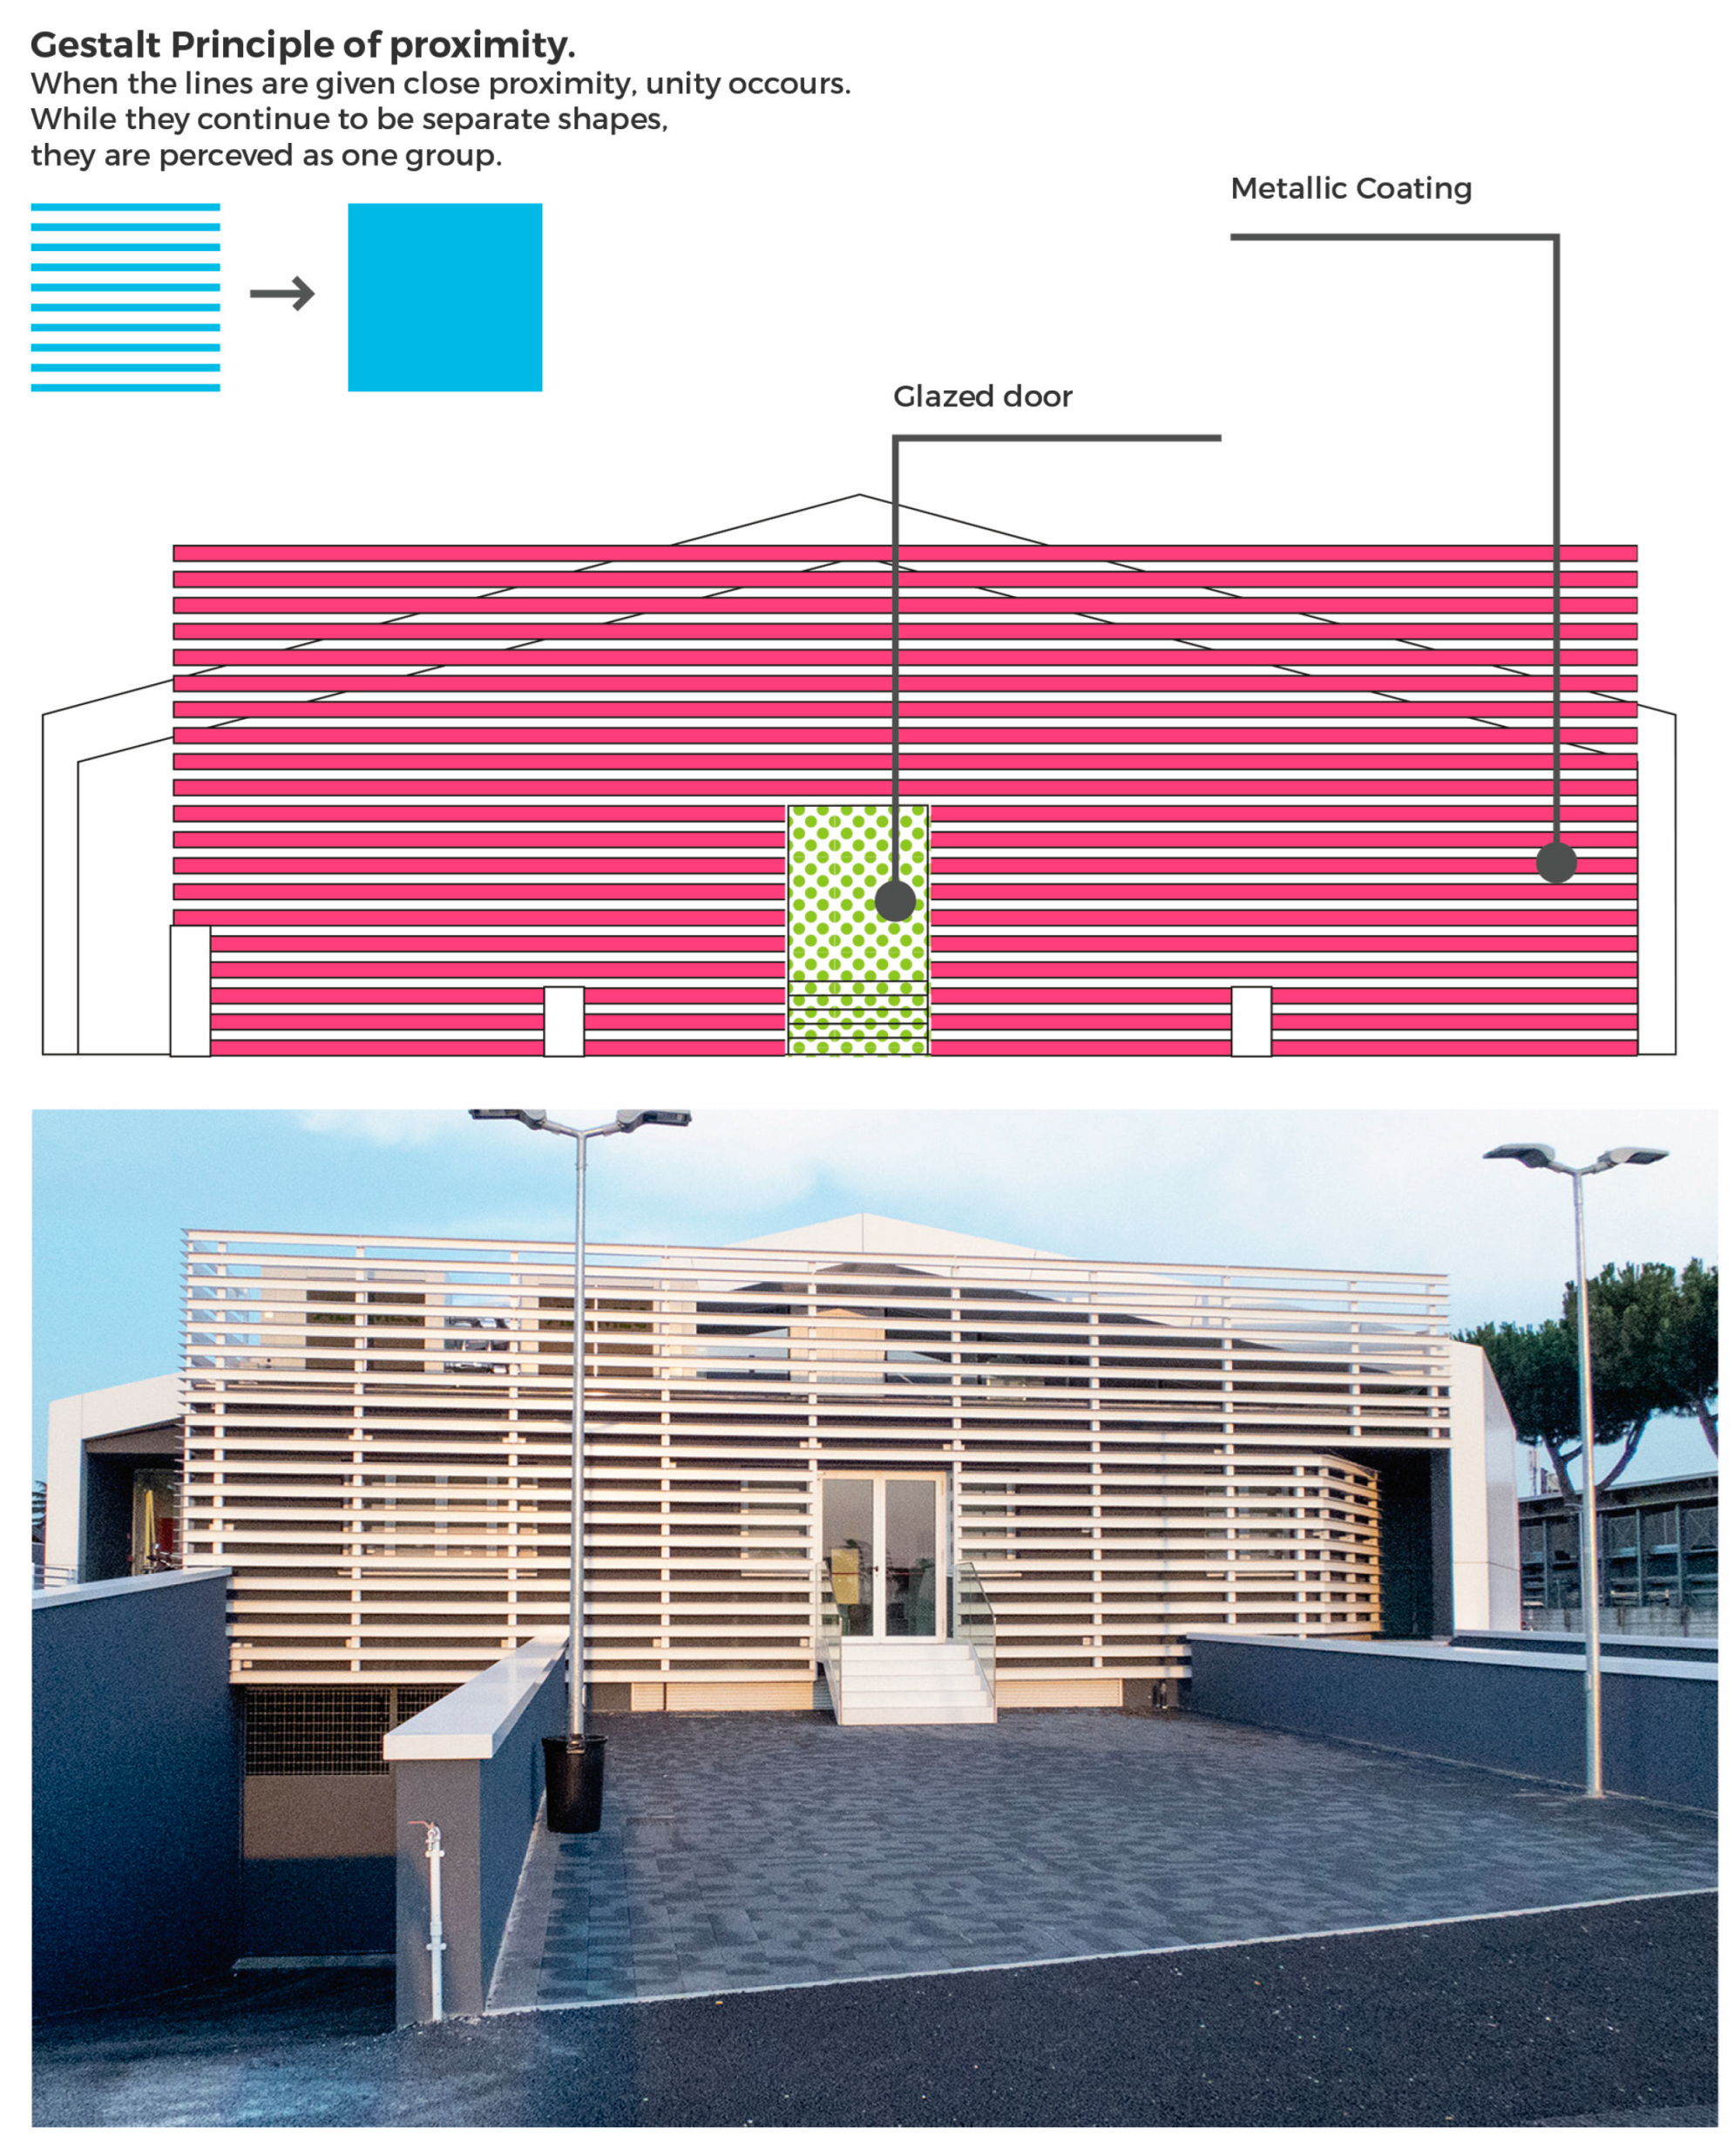
On the back of the building, a single projector positioned frontally is sufficient (
Figure 7). The projection surface consists of a series of horizontal metal strips, arranged in regular bands with an empty space between them. Taking into account the principle of proximity of Gestalt and the distance from the observation point, motorists perceive the facade as a single surface. For a proper viewing, however, it is necessary to avoid multimedia content with small-sized details. These would be poorly visible due to the shape of the coating structure (
Figure 10).
The projection system is designed to work autonomously by capturing data from the external environment and from web applications through an internet connection. A computer with a powerful graphics card locally handles the video stream while a node-based program synchronizes the different projectors. The computer, through an internet connection, captures video content from an online media server. This solution allows a remote upgrade and control. The video projection system is handled and managed by Google Traffic API data, a brightness sensor and a speed sensor. They support and integrate Google API data, which can suddenly switch from “slow” to “fast”. The system begins operating at sunset, when the brightness sensor indicates a favorable condition for video projection; this is the busiest time of the day in terms of traffic along both directions of the ring road adjacent to the sides of the showroom.
As to the “projection mapping” content, a different media product is processed for each traffic status categorized by Google Maps.
API data control takes place at 15-min regular intervals. When the traffic situation changes, the relevant content changes, too. A speed sensor for each driving direction acts as control and feedback of data captured by API Google Traffic. It can also function as an auxiliary system if there are problems with the network data flow. The shutdown takes place at midnight after testing the vehicle flow sensor.
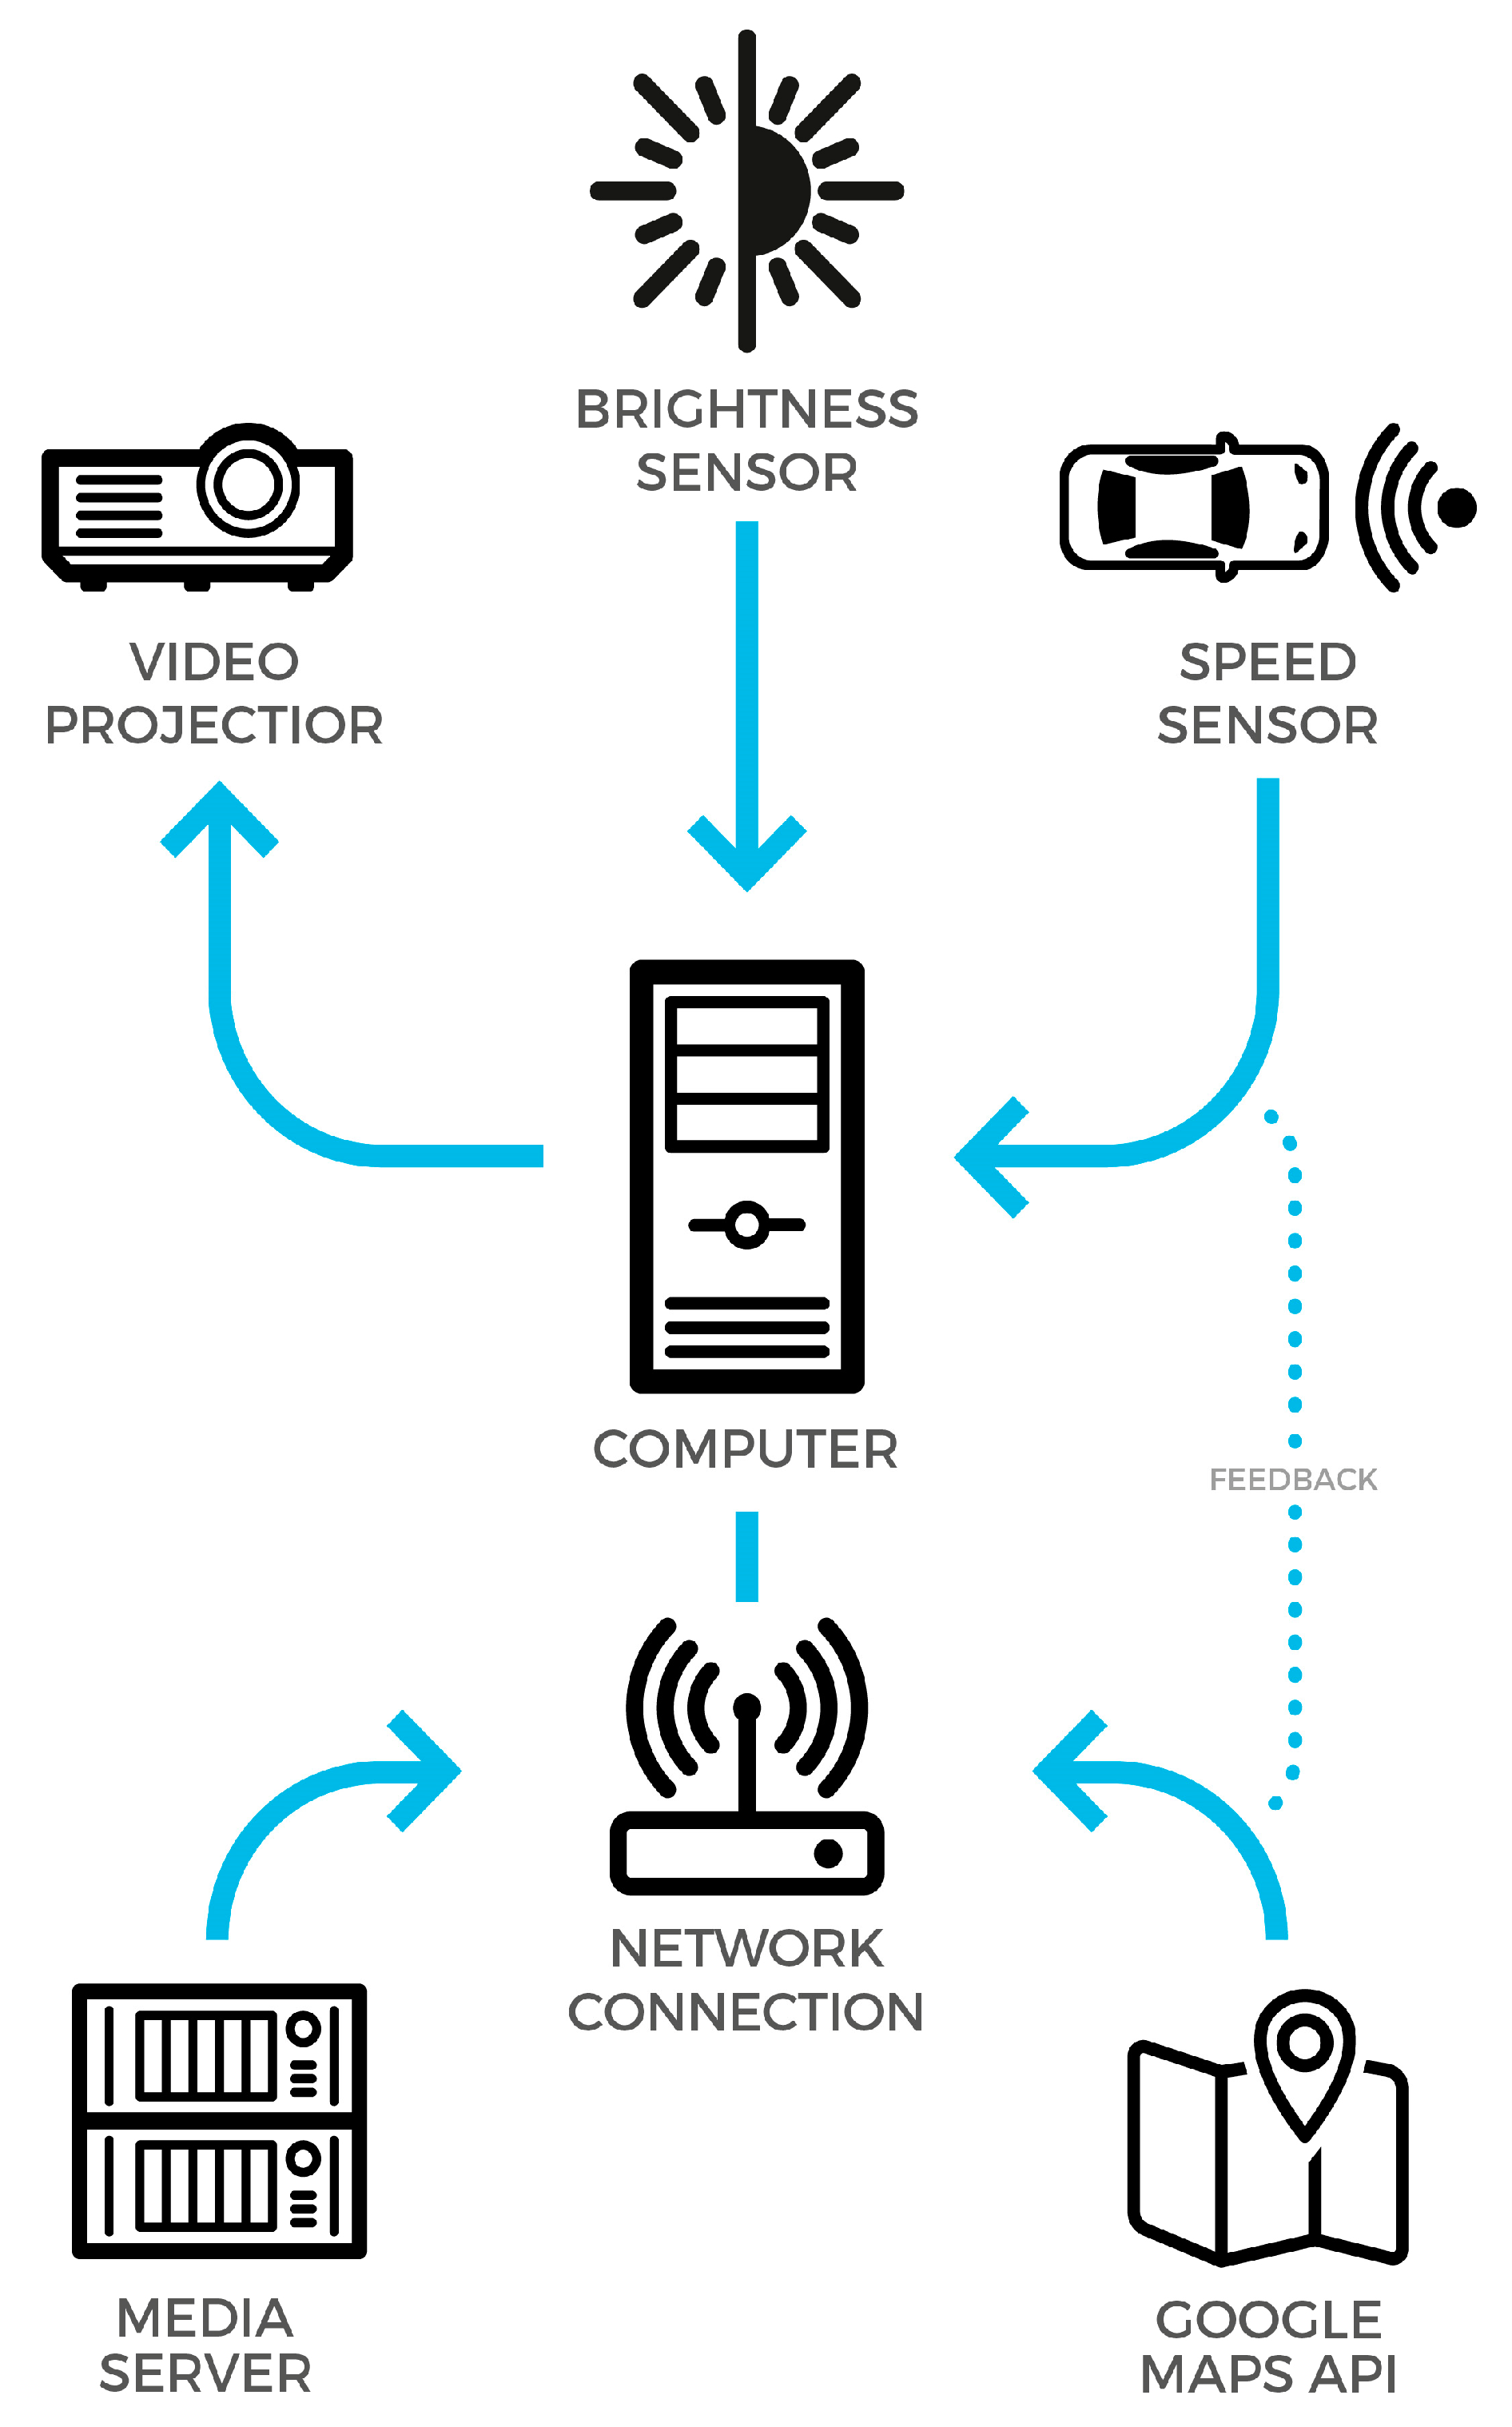
In particular, the system consists (
Figure 8) of:
Brightness sensor: within the established nighttime operating range, it allows to spot the low light conditions best suited for “projection mapping”. In the event of a bright light, the system does not start the projection.
API Google Maps: Google’s traffic data allow a dynamic and automated content management of contents uploaded on media servers. Data is checked every 5 min to possibly update the projected content.
Speed sensor: it controls the road data obtained by Google. In addition to its feedback function, it acts as an emergency system in case of network malfunction.
Media server: it is a cloud service, where the contents to be displayed in the video projection are loaded. It allows a remote control of the system and an update of the video projection contents.
The system management scheme requires a computer for data analysis and video content management purposes. Its function is to convert data from physical sensors and online applications (API Google Maps) into video-projection run commands. High-performance computing components are required, but also an external graphics card to manage the video stream captured by the online media server. The software tested for system management is VVVV, a product developed for Windows
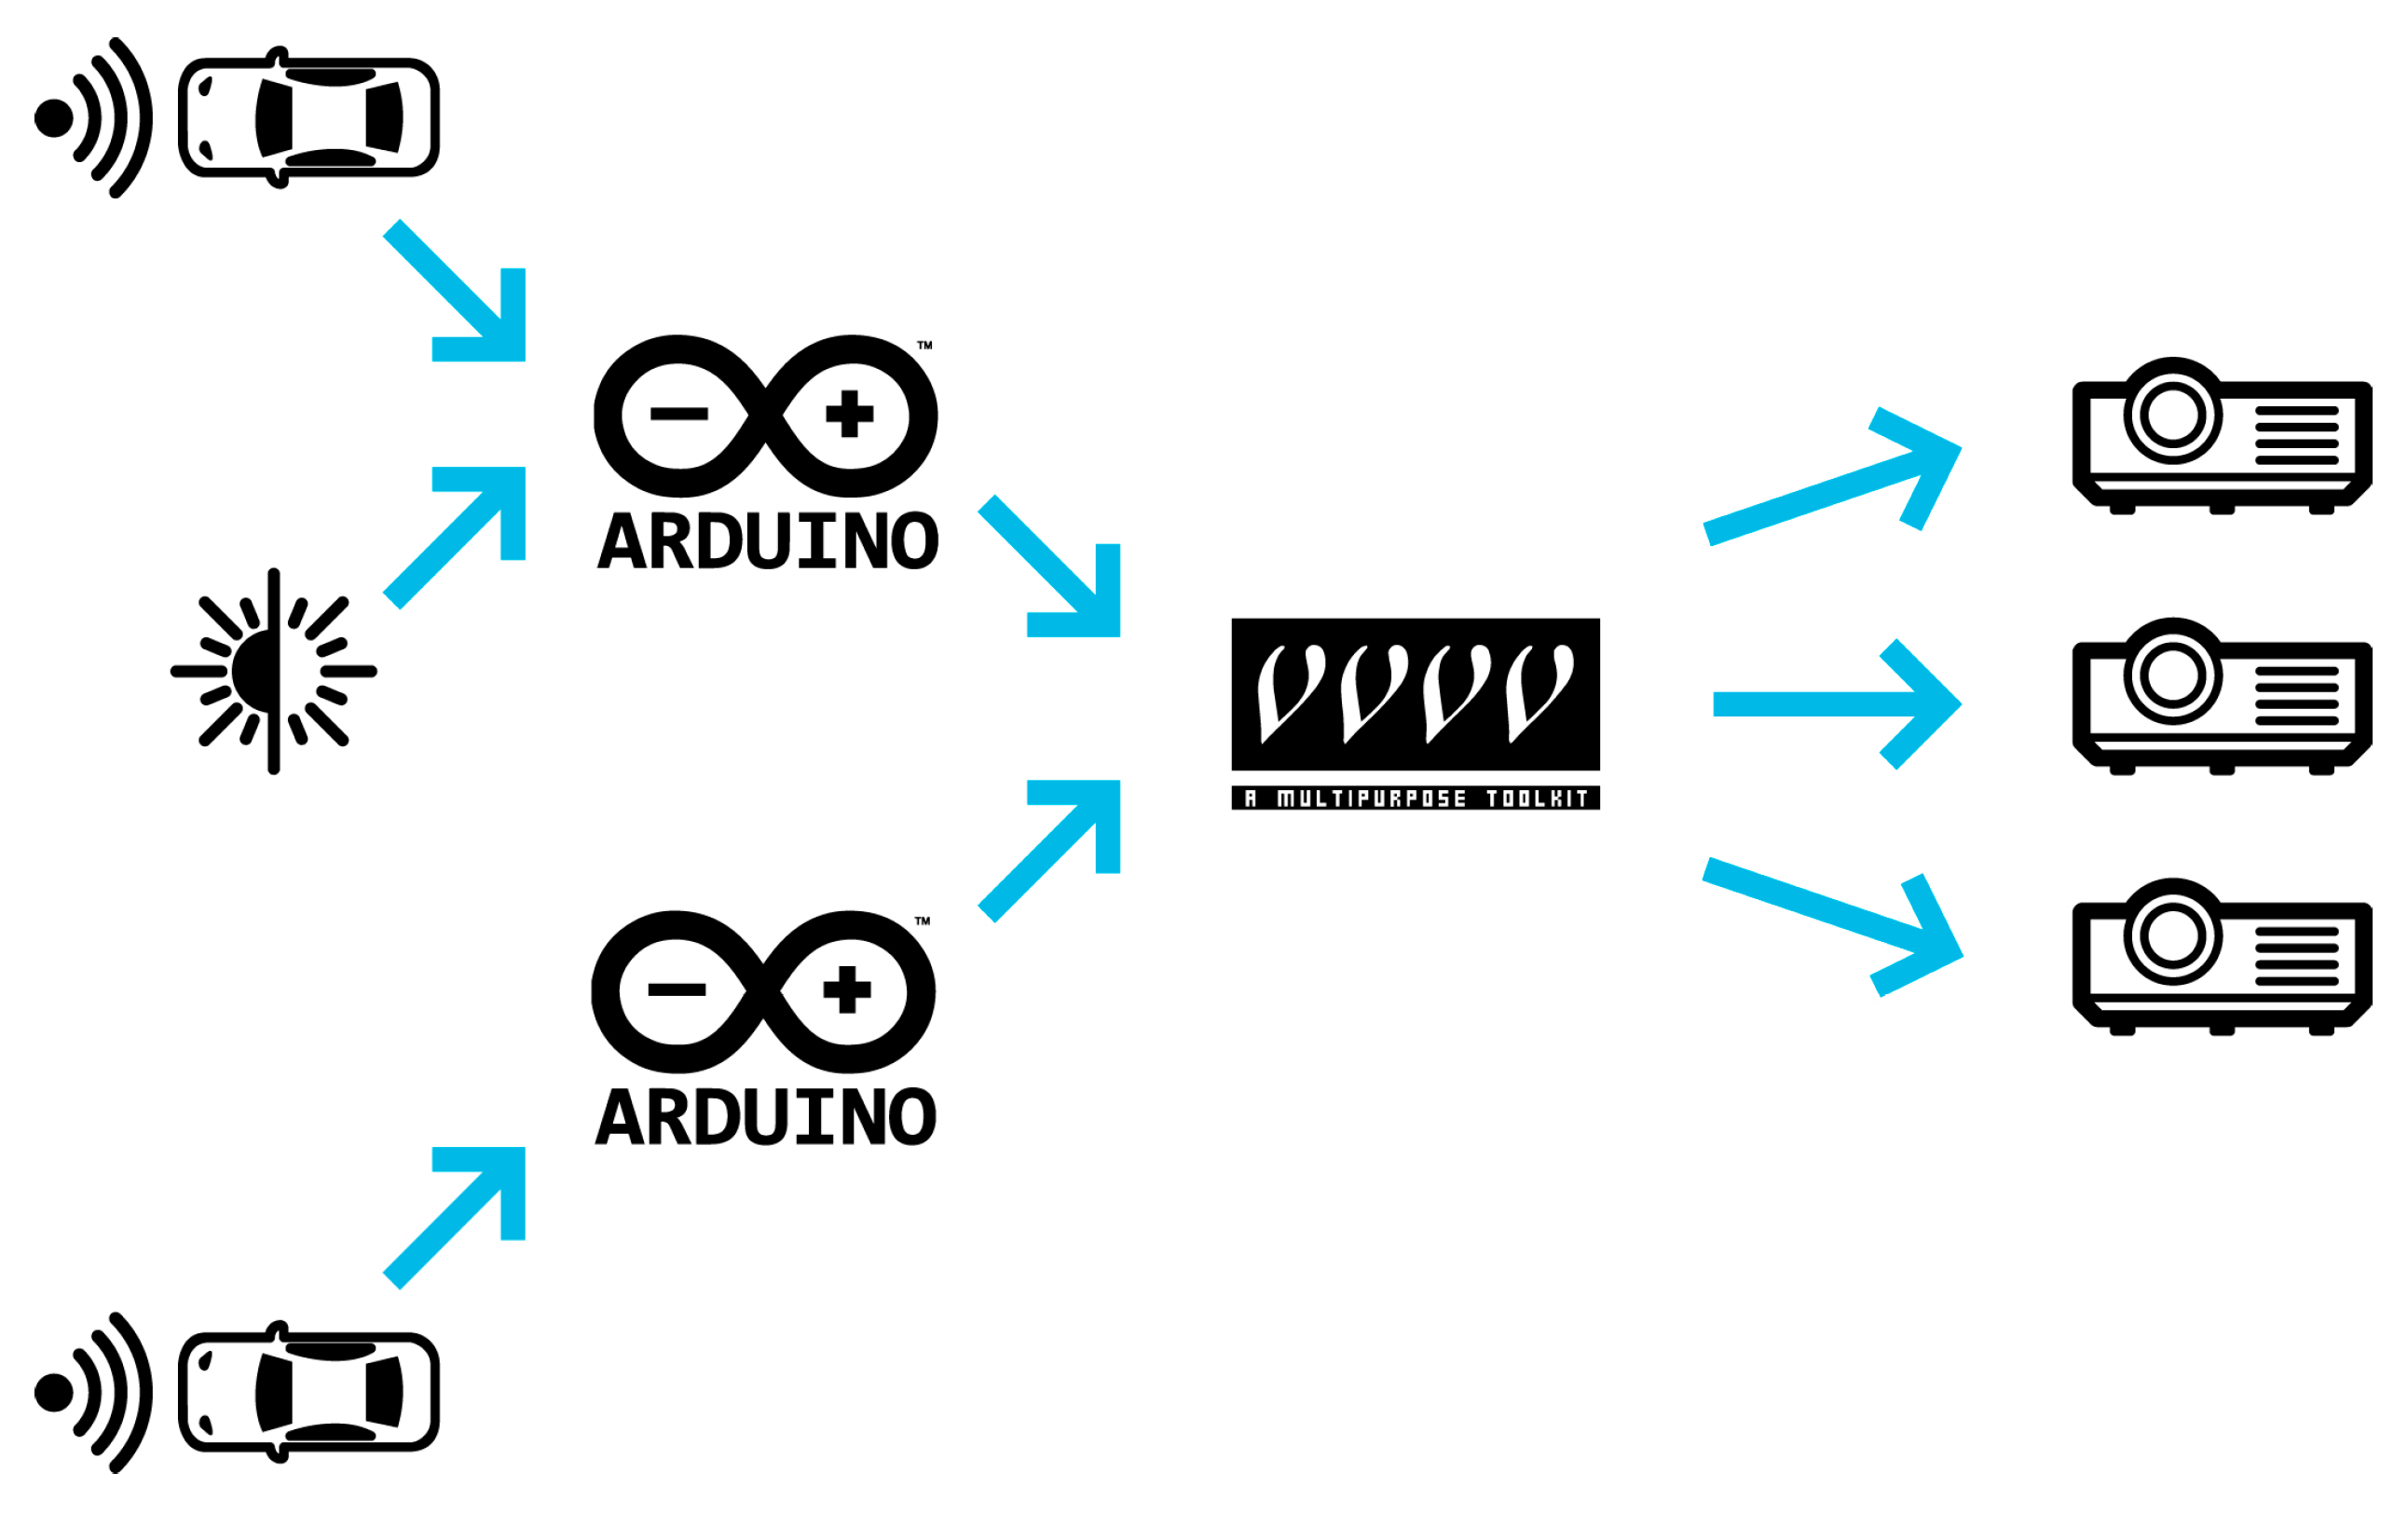
® environment. It is a hybrid environment for graphical and text programming, based on nodes or directly with the code. VVVV is a versatile instrument that allows to connect physical inputs to digital outputs and vice versa. Traffic control data are detected by Google Maps application. Use is enabled by public, free Google APIs (an application programming interface), which is a set of procedures available for programmers to create applications that read and write data from Google services. As noted above, the system needs a physical control device for scanned data and a system for switching on/off the video projection stream. Two different types of sensors are connected to an Arduino
® card, a small hardware to convert signals from sensors into computer-usable data (
Figure 9).
A brightness sensor checks the switch on/starts, whereas a speed camera-like system checks traffic data. It is provided with two infrared led, one emitting and one receiving.
The content of “dynamic urban projection mapping” (
Figure 11) can be of a diverse nature, ranging from the story of the evolution of the industrial/crafts area, to the marketing of the showroom products or the promotion of the company’s history and, therefore, of its brand.
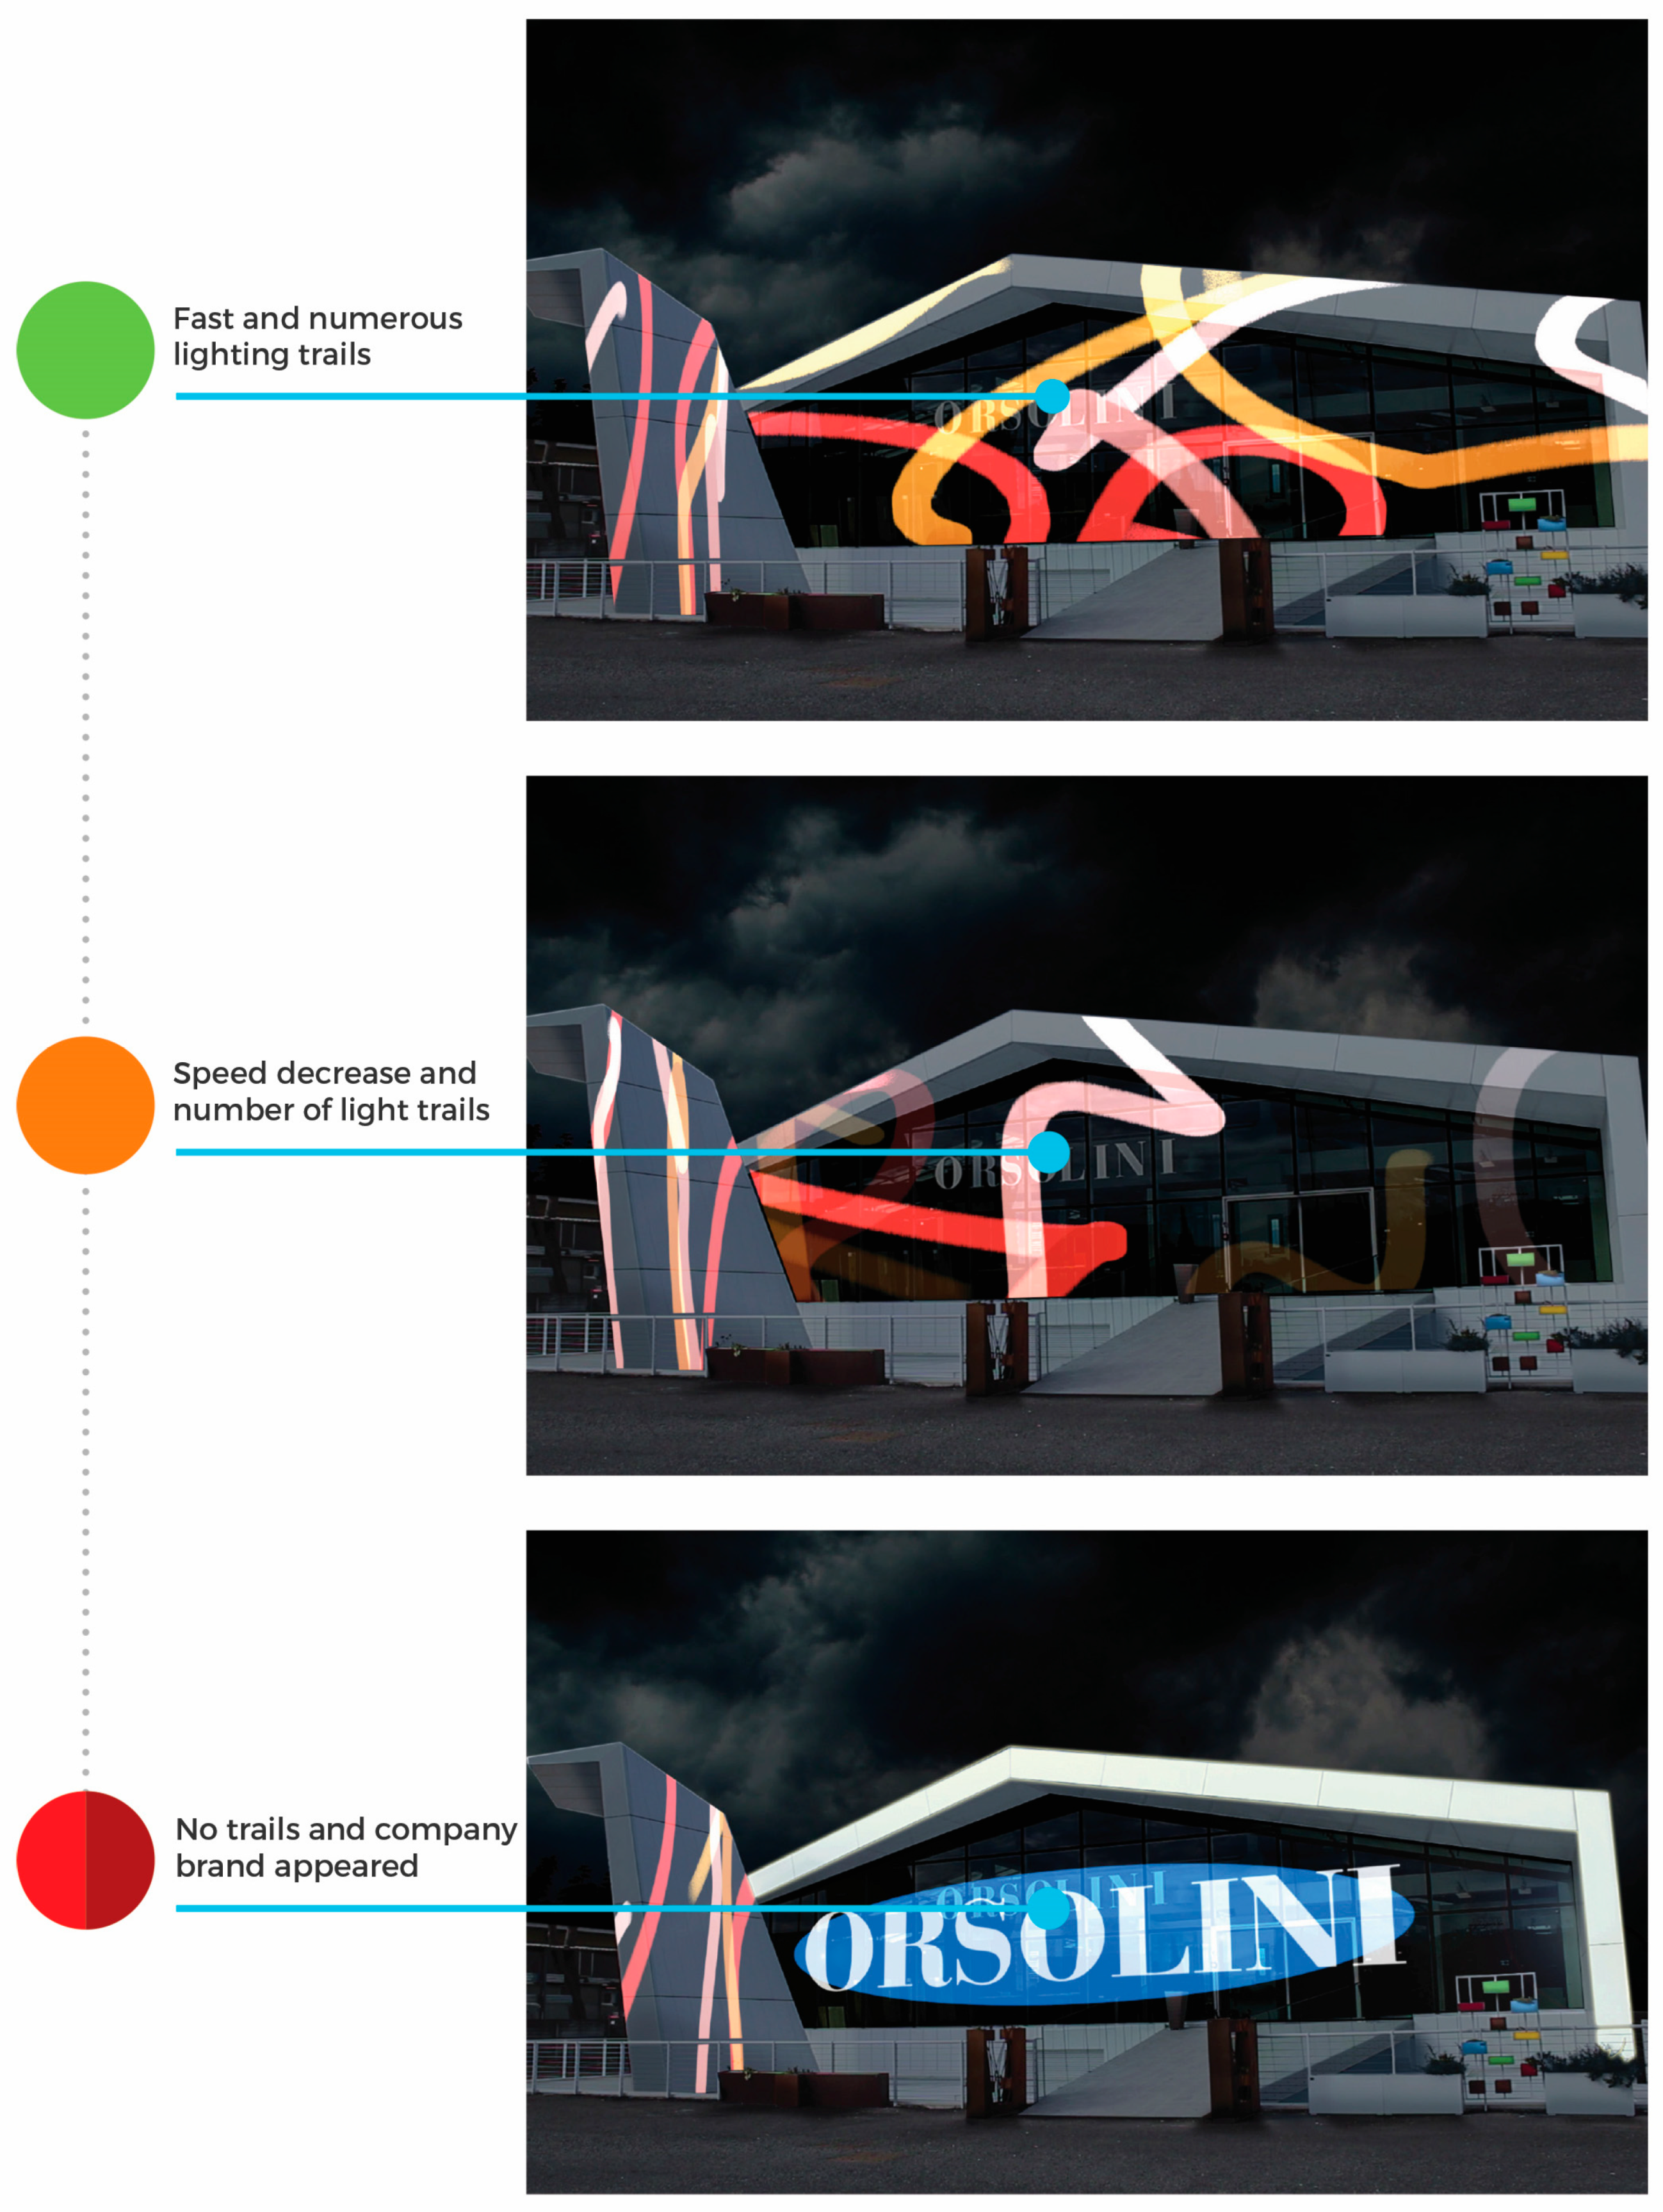
The key aspect is that content is in-sync with the speed of the vehicle’s flow and is perceived by travelers accordingly. It is perceived faster or more superficially when the vehicle flow is fast, in greater detail when traffic is congested with severe slowdowns.
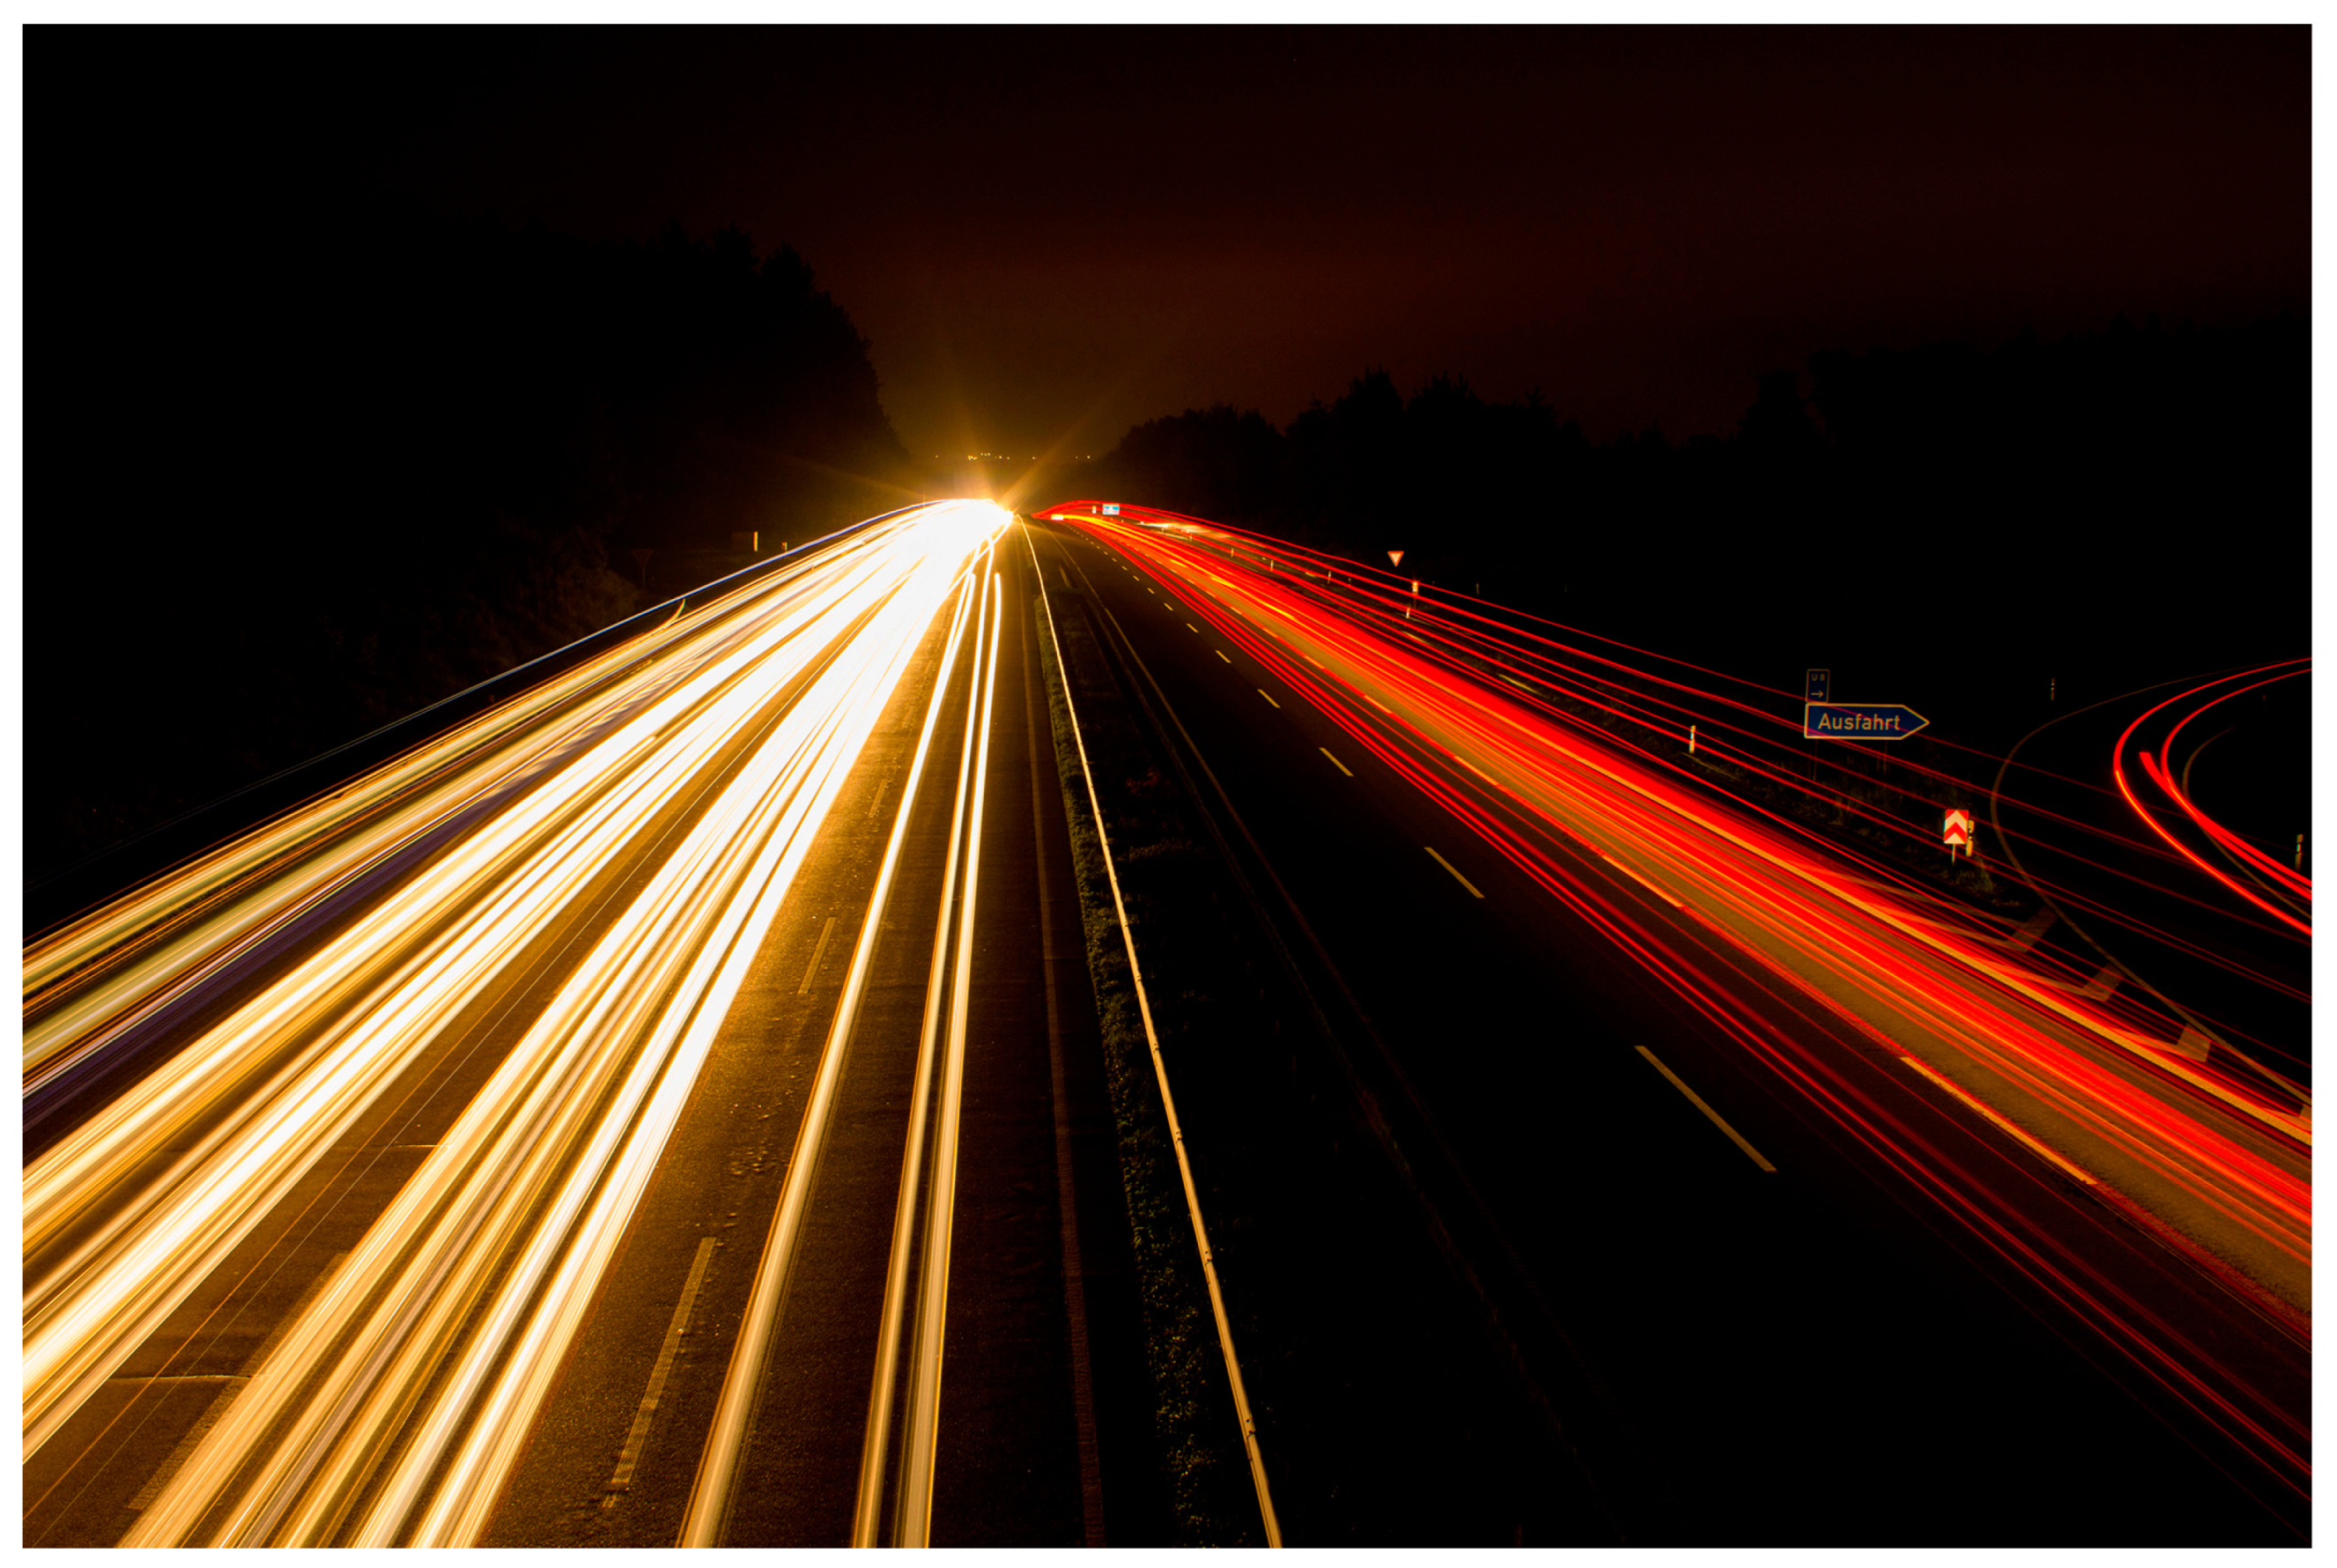
The “dynamic urban projection mapping” hypothesis is inspired by the surrounding environment and by the traffic flow, where observers continuously move within the urban landscape. In visual terms, it is based on the colorful light-flashes generated by cars and immortalized in long-exposure photos. Such flashes are replaced by the company’s brand projection at times of heavy traffic.
The video installation (
Figure 12) is based on an automatic speed control system in the surrounding road. When traffic is smooth, the structure will be crossed by bright flashes, gently moving to draw paths. As the travel speed decreases, the flashes decrease in number and their movements become gradually slower. In a heavy traffic situation, when people travel at low speed, the flashes disappear on the main facade and are replaced by a cyclical animation that enhances the company logo.
7. Conclusions
“Dynamic urban projection mapping” well fits marketing and visual graphics applications and allows a new and different form of business promotion no longer based on the use of static (archi-graphic) or dynamic images (chromatic variation of lighting) but rather on the observer’s moving speed.
One aspect to be checked is the New Traffic Laws and, possibly, public land occupation or public lighting interruption. However, these latter are not applicable when “projection mapping” is carried out on a private property.
Art. 23 of the New Traffic Laws regulates billboards and advertising installed along the roads and on means of transport. Paragraph 1 reads: along roads or in their vicinity, it is forbidden to place signs, posters, advertising or propaganda, horizontal advertising signs, light sources, visible from vehicles traveling along the road where such items, due to their size, shape, color, design and location may be confused with road signs, or be difficult to understand or reduce visibility or impair the safety of road users or distract them, with a resulting danger for a safe traveling.

