1. Introduction
In its kick-off meeting, the Me2 Consortium decided to create an initial survey in order to map and typify the platform’s potential final consumer, particularly considering electric car drivers. Both development and management of this survey was delegated to Me2 partner Católica Lisbon, focusing its main goal on presenting the preliminary results that will provide the fundamental basis for all this project’s implementation, whether in its technical feature regarding the technological and design creation of the Me2 platform, as well as its specific feature regarding the Lisbon pilot’s investigation plan’s implementation. The results displayed in this article will follow closely the survey’s structure, describing the different measures, as well as all main results obtained.
2. Demographics/Methods
A convenience sample was used, comprising 206 participants that fully responded to the survey. The average age was 46.96 years; 51.46% were female participants. It is particularly significant to point out the fact that the survey queried participants about their possible prior participation in similar projects. Remarkably, the vast majority of the participants (94.12%) denied ever having participated in similar projects. Furthermore, a preliminary evaluation was conducted regarding participants’ level of schooling and average household income. Such evaluation was considered fundamentally relevant concerning consumers’ segmentation, as well as very useful for guiding the Lisboa pilot’s implementation. Regarding participants’ schooling level, a large proportion of respondents has a university degree (N = 145, 70.39%), whilst there are no significant disparities to be found in all other schooling levels. Also, to be noted, the vast majority of the sample stated an average household gross income over 1000 €, which, in Portugal’s present economy, corresponds to middle class and upper-middle class (<1000 = 11.22%/>1000 = 88.78%).
3. Attitudes towards Energy Saving-Environmental Domestic Routine
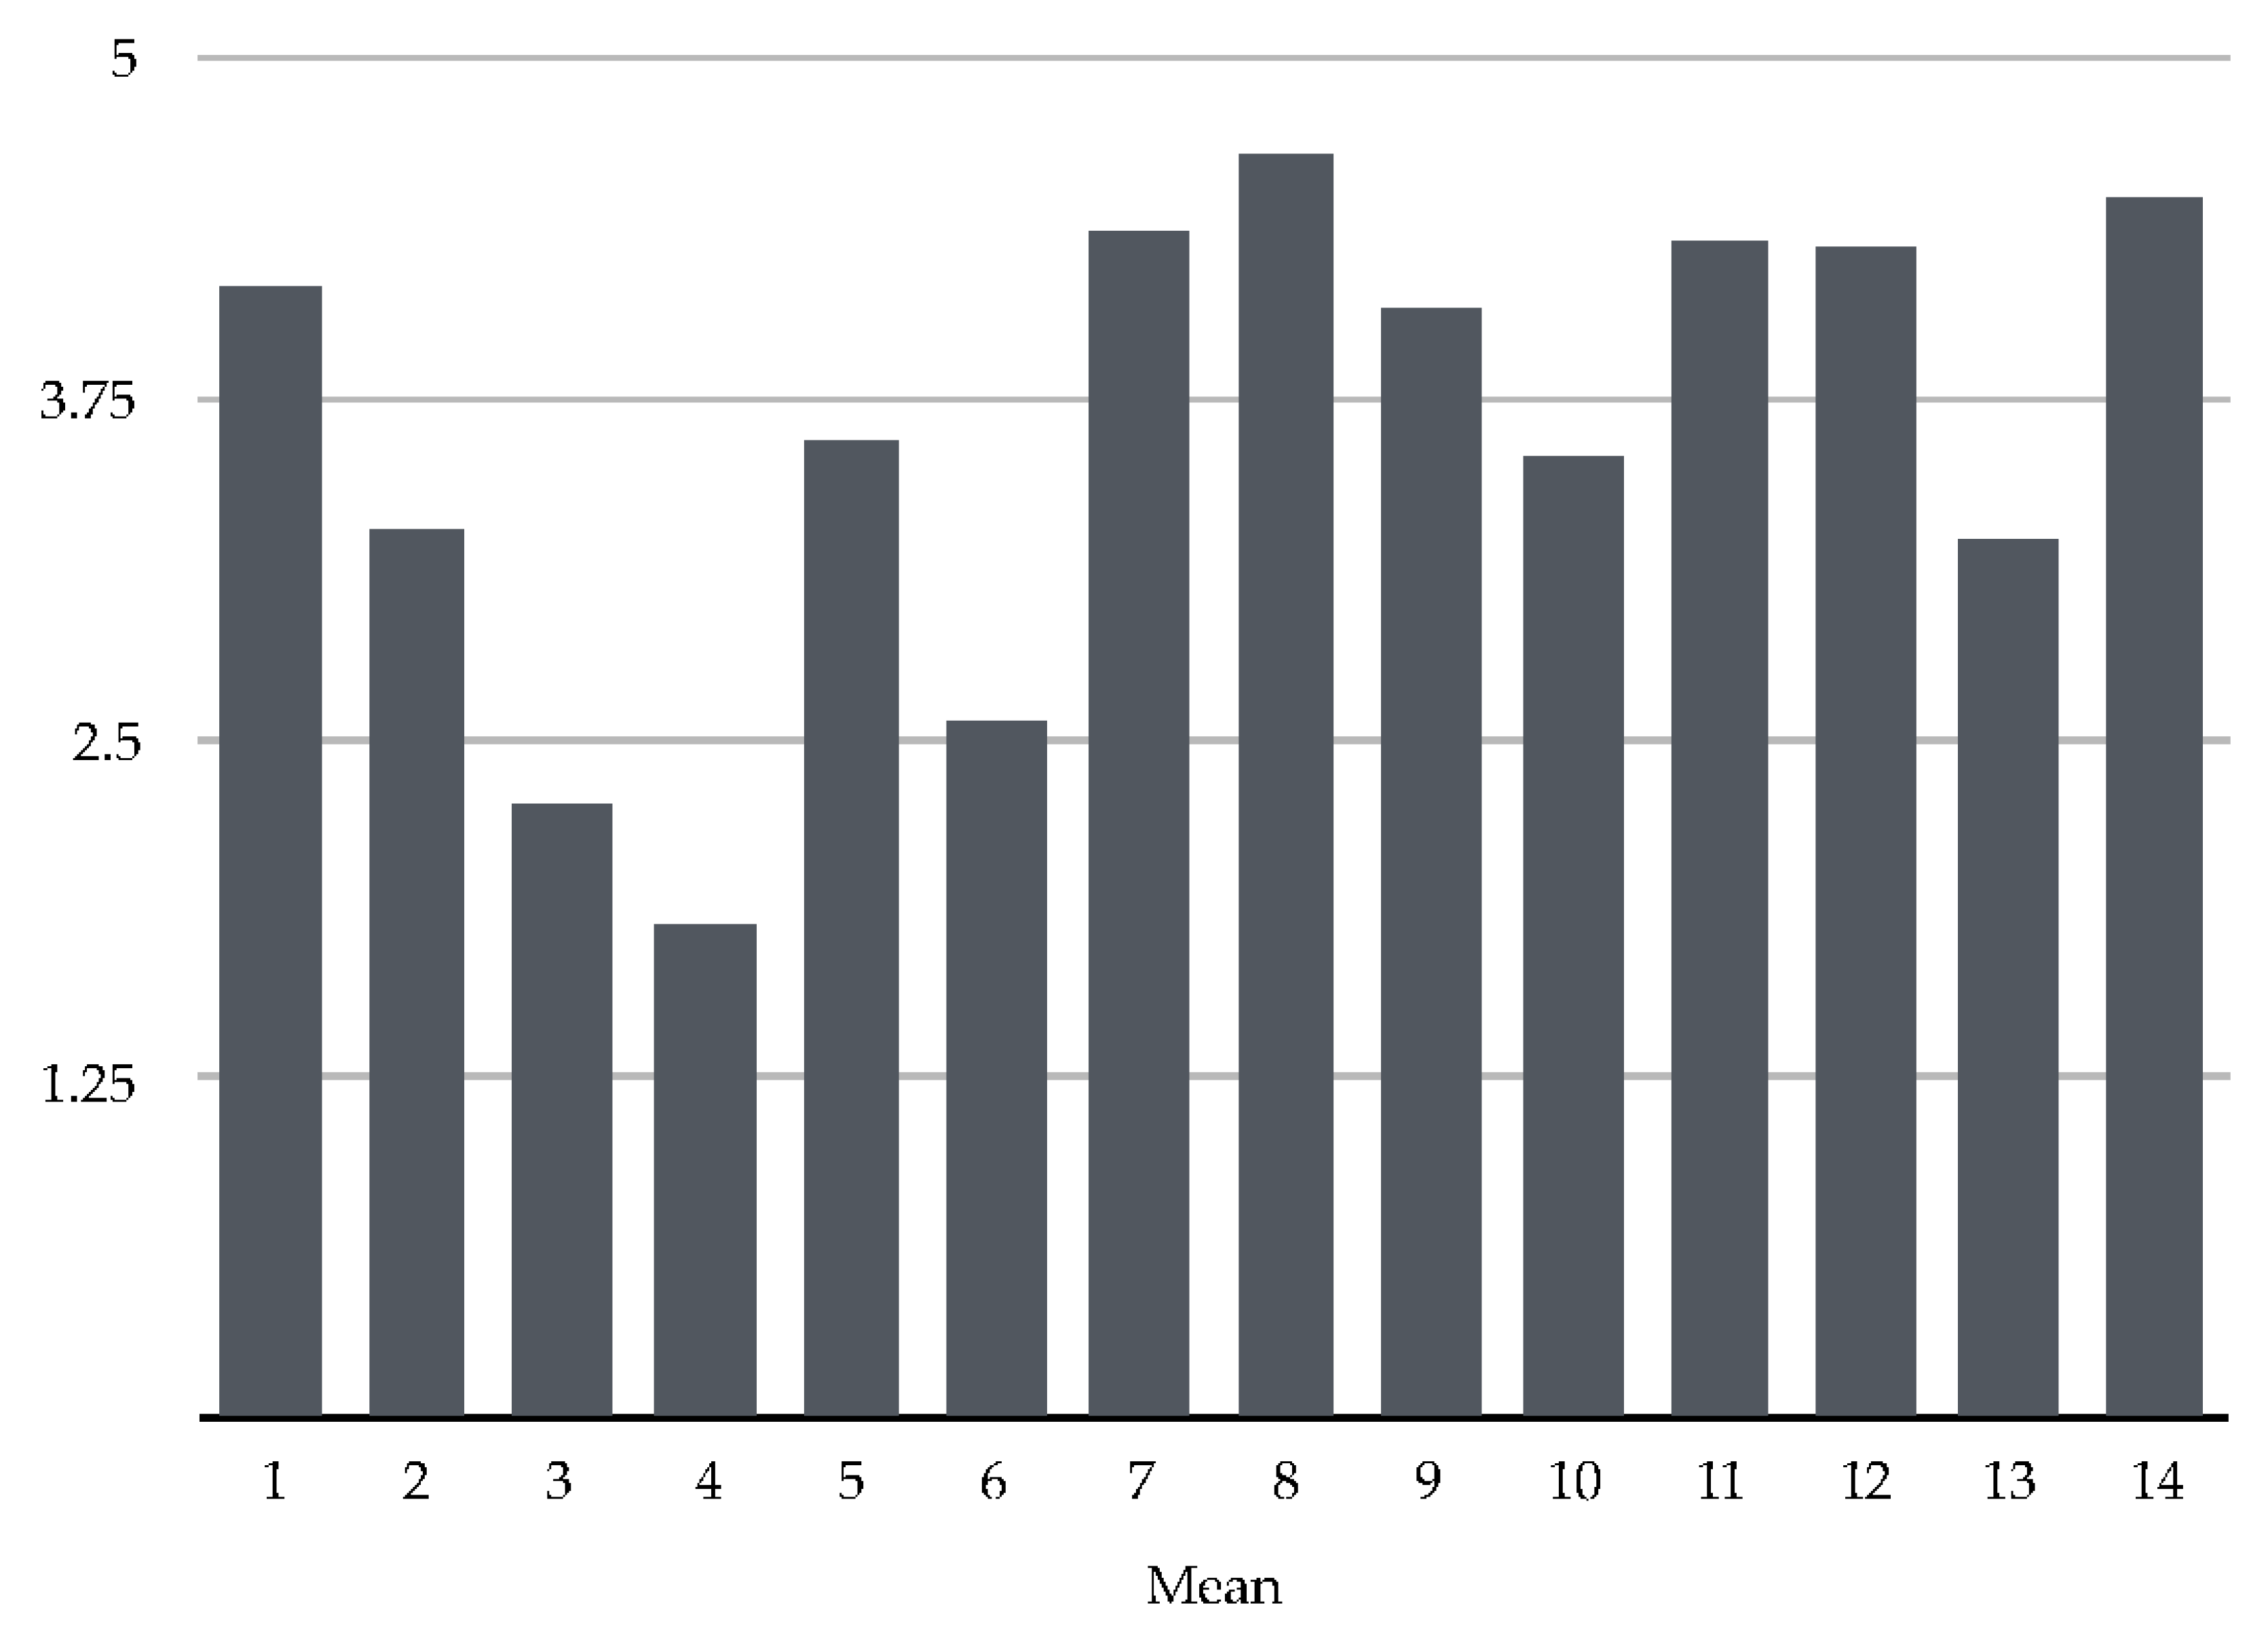
The second section of the survey focused on evaluating energy saving attitudes, specifically aiming to assess participants’ environmental domestic routine behavior. Participants were directly asked: Please indicate how often you generally carry out the following activities: (1—Never to 5—Always), consecutively listing all the items participants used and, therefore, already examined. Environmental domestic routine behavior results can be found in the following chart (
Figure 1), expressed in average scores.
It is important to note that the listed items are divided among positive attitudes and negative attitudes regarding energy saving (see
Appendix A).
Figure 1.
Environmental domestic routine behavior results in average scores.
Figure 1.
Environmental domestic routine behavior results in average scores.
Analyzing the chart above, we can identify some attitudes opposing what would be considered an energy saving behavior, specifically: Item 1—Use the standby mode for often used appliances (M = 4.17); Item 2—Start the washing machine with only a half full load (M = 3.27); Item 4—Close the door between heated and not heated rooms (M = 1.81); and Item 5-Shower for more than 10 min (M = 2.60).
4. Attitudes towards Nature
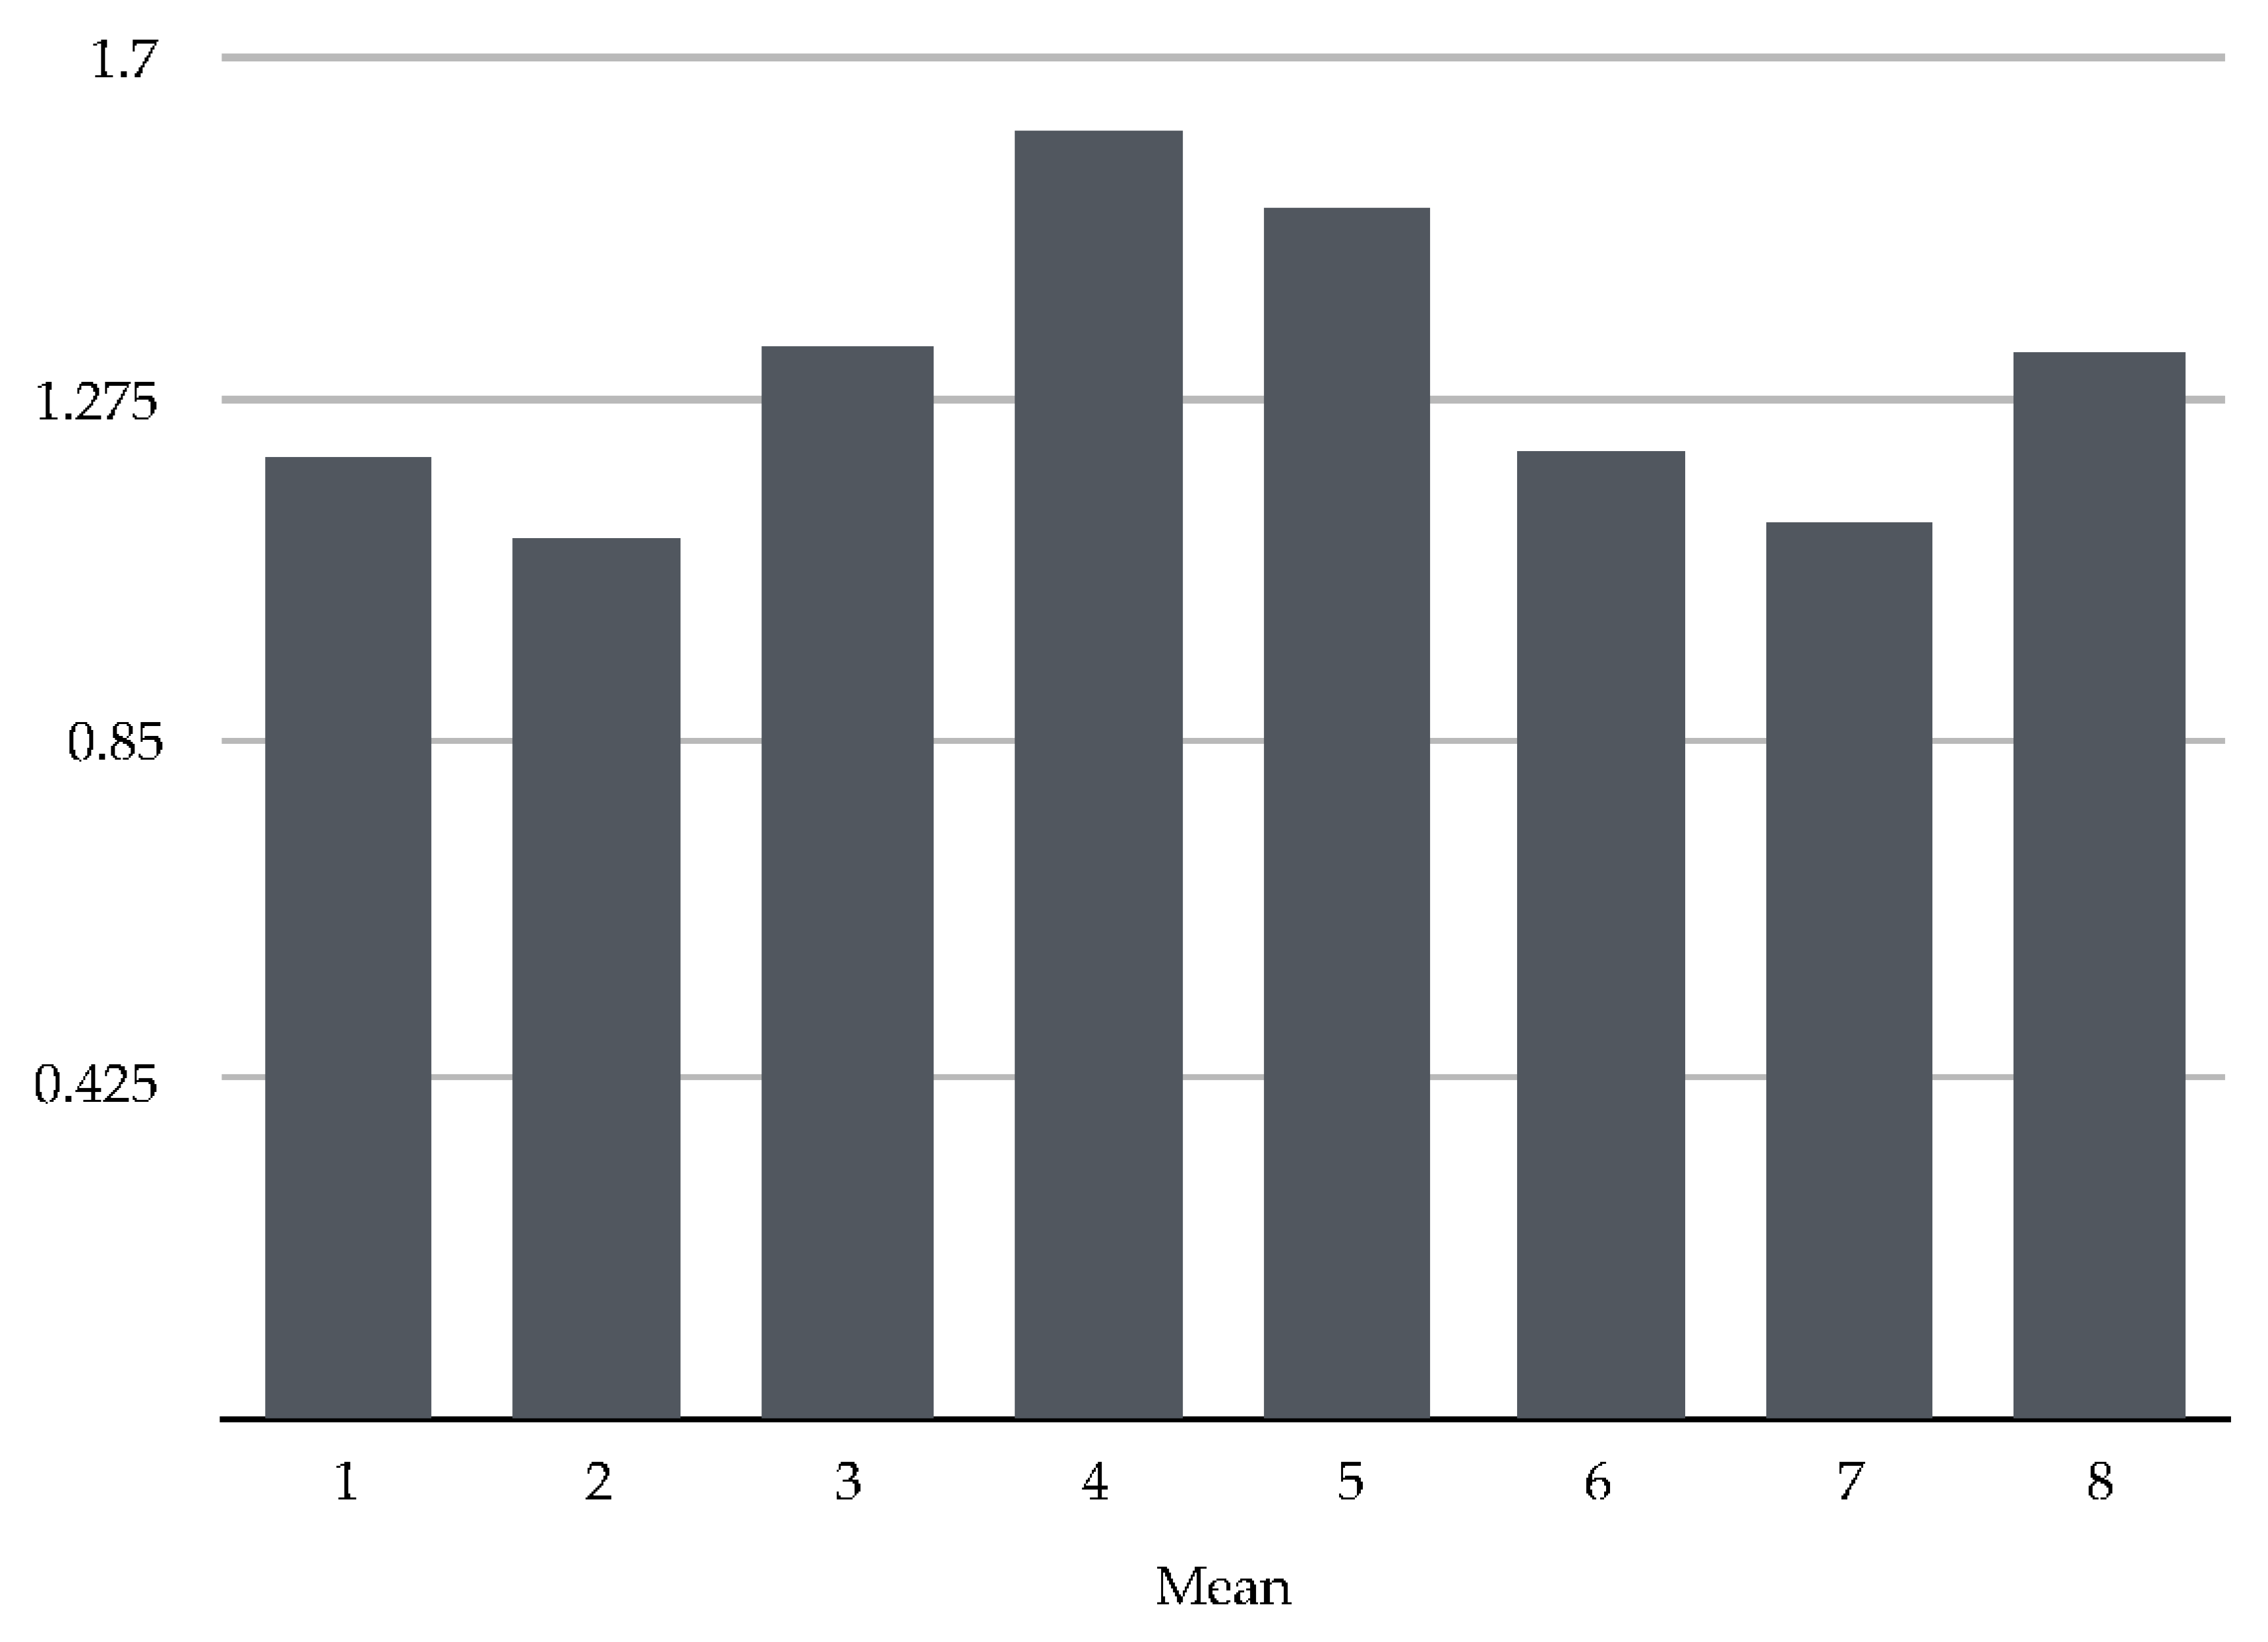
In the following section we aim to directly address the participants’ attitudes towards nature, in a personal assessment of a set of items (see
Figure 2 and
Appendix B). Participants were asked to evaluate the set of items according to the following scale: Please select one level of agreement for each statement to indicate how you feel: (1—I completely agree to 5—I don’t agree with this at all).
Briefly, we can establish that participants have a very positive self-stated attitude towards nature. We can therefore conclude that this group of participants can be considered as what is usually called environmentally friendly.
5. Attitudes towards Energy Saving-Behavioral Changes Perception & Behavioral Changes-Incentives Judgment
In this section we aim to directly address the participants’ assessment of their own ease of adaptation to some attitudes, considering its effectiveness, as well as incentives (see
Appendix C for questions and scales presented, alongside the list of items subject to assessment). Through this comparative analysis, we are able to verify a significant difference between the pattern shown by our participants regarding the adoption of new attitudes and the assessment of the effectiveness of similar behaviors.
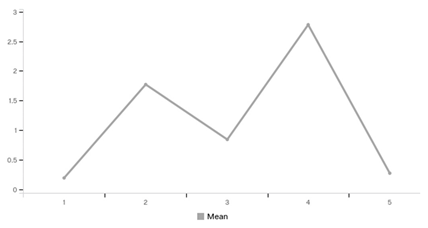
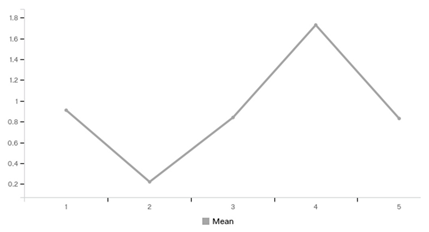
Considering the above
Figure 3a,b, we can state that the perception of ease of adaptation to some attitudes is clearly distinguished from the participants’ assessment of the corresponding behavioral incentives. The first figure shows an average score closer to the highest value (5-Very easily), whilst the second figure shows scores further distant to its lowest value (1-Extremely effective). Thus, in general, participants regard adopting new attitudes easier, although they do not consider its corresponding incentives effective.
6. Electric Vehicles-User Characterization
As initially stated, this survey specially considered electric car drivers, wherefore an entire section was designated to provide these participants’ evaluation (see
Appendix D for questions, as well as the scales and corresponding results in the form of graphs). In our sample, 45% of participants use their employer’s electric vehicle, although 35% of respondents stated having their own electric car. Participants prefer to charge their cars at work, on a private charging point; and secondly, at home, also on a private charging point. Public charging points, whether at work or home, seem to be the least preferred option by these participants. The evening, followed by the sleeping period, are the two most preferred charging periods.
7. Conclusions
The aim of this survey-to collect more detailed data on attitudes and perception about energy consumption-was achieved. Also, the survey gave information about the overall attitude towards more efficient use of energy in their dwellings, as well as EV driver characterization.
Considering the results presented before, some main aspects that were considered are highlighted:
Me2 target population will be middle-aged, middle class/upper-middle class, with university degree or higher schooling level;
Results gathered indicate a population segment clearly environmentally aware;
It seems there is a current positive attitude towards energy efficiency that is not being translated into efficient behavior;
EV drivers in particular seem to present behavioral patterns consistent with the peak hours, a behavior perfectly in line with this project’s main goal.
Acknowledgments
This work is part of the me2 project, funded by the European Smart Cities Member States Initiative, FCT and FAI, under project number 646453.
Conflicts of Interest
The authors declare no conflict of interest. The founding sponsors supported the data collection, but played no role in the analyses, or interpretation of data; in the writing of the manuscript, and in the decision to publish the results.
Appendix A
Items:
1. Use the stand-by mode for often-used appliances
2. Start the washing machine with only a half full load
3. Leave warm water running while brushing teeth
4. Close the door between heated and not heated rooms
5. Shower for more than 10 min
6. Leave the window tilted at night during winter
7. Switch off lights when leaving the room for half an hour
8. Put on warmer clothes before turning up the heating if it gets cold in a room
9. Wash clothes at times of lower price (i.e., at night)
10. Switch off computer when it is no longer used
11. Switch off the light when leaving the room
12. Use a switchable power socket and switch it off when not using any appliances
13. Turn air conditioning (A/C) down during sleep hours
14. Use pots with lids for heating water and food
Appendix B
Items:
1. We, as human beings, have to live in harmony with nature if we want to survive
2. We have to conserve natural resources for future generations
3. Climate change will never stop if we carry on as before
4. If we carry on as before, energy will become increasingly scarce
5. For every kind of problem solving, we always have to consider the consequences for the environment first
6. We should be careful not to disturb the balance of nature
7. Society should promote environmental protection
8. Environmental issues should have precedence in all government decisions
Appendix C
Table A1.
Attitudes toward energy saving—behavioral changes perception; behavioral changes—incentives judgment.
Table A1.
Attitudes toward energy saving—behavioral changes perception; behavioral changes—incentives judgment.
| Topic | Question and scale | Items |
|---|
| Attitudes toward energy saving—Behavioral changes perception | Please indicate how easily you would adopt the following behaviors:
(1. Very hardly to 5. Very easily) | 1. Programming all my electronic appliances to work or charge their battery on lower overload network schedules
2. Performing washing cycles with maximum load
3. Turning off all lights when leaving a room
4. Taking short hot water showers
5. Brushing your teeth without warm water running
6. Using electrical extension cable or power socket with switch and turning them all off when electronic appliances are no longer in use
7. Turning off electronic appliances when no longer in use, not using the stand-by mode
8. Closing of any door between heated and not heated rooms
9. Closing all windows in cold seasons
10. Dressing in multiple layers to keep your core temperature comfortably warm if it gets cold in a room
11. Turning off the computer when it is not in use
12. Turning off all lights when leaving a room for a short period (e.g., half an hour)
13. Turning off AC two hours before going to bed
14. Using pots with lids |
Behavioral Changes
Incentives judgment | Please indicate how effective do you think could be each incentive
(1. Extremely effective to 5. Not effective at all) | 1. Information about your neighbors energy consumption efficiency
2. Energy consumption qualitative ratings. (e.g., low; moderate; high)
3. Information about money savings
4. Track the consumption and coast of each device
5. Bill prediction indications based on actual consumption
6. Information about cost per hour/day
7. Participate in competitions or challenges that test your energy efficiency
8. Usage prediction indications based on actual consumption
9. Receive an email or sms always that is some unusual usage
10. Compare your consumption between past similar periods (e.g., seasons)
11. Information about current usage rate (kWh)
12. Information about unit cost of electricity (€ per kWh)
13. Information about the impact of your energy consumption on the environment
14. Play an energy control online game |
Appendix D
Table A2.
Electric car use and charging.
© 2017 by the authors. Licensee MDPI, Basel, Switzerland. This article is an open access article distributed under the terms and conditions of the Creative Commons Attribution (CC BY) license (http://creativecommons.org/licenses/by/4.0/).


