Proceeding Paper

Impedimetric IgG-Biosensor with In-Situ Generation of the Redox-Probe †

by
Julian D. Schrattenecker
1,*,
Rudolf Heer
1,
Rainer Hainberger
1 and
Günter Fafilek
2
1
AIT Austrian Institute of Technology GmbH, 1220 Vienna, Austria
2
Institute of Chemical Technologies and Analytics, Technische Universität Wien, 1060 Vienna, Austria
*
Author to whom correspondence should be addressed.
Presented at the Eurosensors 2017 Conference, Paris, France, 3–6 September 2017.
Proceedings 2017, 1(4), 534; https://doi.org/10.3390/proceedings1040534
Published: 4 August 2017
(This article belongs to the Proceedings of Proceedings of Eurosensors 2017, Paris, France, 3–6 September 2017)

Abstract

:
For most electrochemical impedance spectroscopy measurements Ferro-/Ferricyanide is used as redox-probe, but it has limitations in its application for biosensors based on gold electrodes because of chemical degradation induced by the Ferro-/Ferricyanide. The in-situ reduction of [Ru(NH3)6]3+ to [Ru(NH3)6]2+ by means of a direct current during EIS measurements is introduced to generate a stable redox-probe for biosensors. This method of enhanced EIS measurement has been applied to determine the charge transfer resistance of a human-IgG biosensor with a linear range from 0.9 to 50 mg/L IgG.

1. Introduction

Information of the total IgG levels can give valuable information about the overall health status of an individual. Periods of psychological stress can lead to an increase of IgG concentrations [1]. For minimizing the risk of burn-out and reducing stress levels, a monitoring of stress biomarkers is indispensable. A highly sensitive and label-free detection method is favored for an easy to use point-of-care measurement.
Electrochemical impedance spectroscopy (EIS) can provide the desired sensitive measurement platform [2]. Here, the analyte binds to the capture molecules immobilized on the surface and increases the charge transfer resistance RCT proportional to the analyte concentration. The charge transfer resistance describes the resistance that a redox-probe experiences on an electrode surface with respect to an electron transfer. Generally, biosensors based on EIS use Ferro-/Ferricyanide as redox-probes, but several authors reported that these redox-probes are not suitable for biosensors with gold electrodes because the impedance values increase during multiple measurements [3] and over a longer time range the electrodes are destroyed [4]. Lazar et al. [5] have shown that the RCT increases during the first 100 min and then decreases over longer measurement times. This unstable behavior renders the redox-probe Ferro-/Ferricyanide useless for highly sensitive EIS biosensors in combination with gold electrodes.
A suitable replacement for the aforementioned redox-probe has to meet several major requirements. First, it should not inhibit the measurements, second, both oxidative states should be stable in aqueous solutions and, third, it should not destroy the electrodes or the functionalization. The number of potential candidates meeting these requirements is scarce because most redox-pairs are unstable in the reduced state.
Therefore, we chose the following approach based on [Ru(NH3)6]3+. In aqueous solutions [Ru(NH3)6]3+ is present without its reduced state. By applying a direct current (DC), [Ru(NH3)6]2+ can be produced in-situ during the EIS measurement. In order to obtain a low starting charge transfer resistance, the concentrations of [Ru(NH3)6]3+ and [Ru(NH3)6]2+ close to the electrode surface have to be made nearly identical by adjusting the DC bias. This method has been used to characterize monolayers [6], but has so far not been applied to biosensing.

2. Materials and Methods

2.1. Chemicals and Reagents

AffiniPure Goat Anti-Human IgG (H + L)-specific (109-005-006; IgG-Ab) were obtained from Jackson ImmunoResearch Europe Ltd (Newmarket, UK). 11-mercapto undecanoic acid 95% (MUA), N-(3-Dimethylaminopropyl)-N′-ethylcarbodiimide hydrochloride 99% (EDC), bovine serum albumin 98% (BSA), N-Hydroxysulfosuccinimide sodium salt 98% (Sulfo-NHS), IgG from human serum c = 4.87 mg/mL in buffered aqueous solution, 2-(N-morpholino)ethanesulfonic acid 99% (MES) and Hexaammineruthenium (III) chloride 98% were obtained from Sigma-Aldrich (St. Louis, MO, USA). Other chemicals were of analytical quality and were used without further treatment.

2.2. EIS Measurement

For the electrochemical impedance spectroscopy measurements an Autolab PGSTAT30 (www.metrohm-autolab.com) with FRA2 module was used for impedance analysis. The measurements were performed with a DC bias of −160 mV and an AC amplitude of 5 mV. The measured frequencies ranged from 120 kHz to 1 Hz. The measurement solution consisted of 10 mM Hexaammineruthenium (III) chloride in 10 mM PBS puffer at pH 7.4. The curve fitting was performed in NOVA 2.0, from Metrohm Autolab B.V. (Utrecht, The Netherlands), and in Matlab (Natick, MA, USA).

2.3. Gold Surface Functionalization

Sensors of the type SC1.W1.R1 from BVT Technologies, a.s. (www.bvt.cz), with gold working, gold counter and Ag/AgCl reference electrode (AC1.W1.R1) screen printed on a ceramic substrate were used. First, the electrodes were cleaned by ultrasonication in water and ethanol for 10 min each. After cleaning, the sensors were immersed in 10 mM MUA solution in a mixture of 95% ethanol and 5% de-ionized water for ~16 h to form the monolayer. Next, the sensors were washed with ethanol and de-ionized water. In the subsequent step, the carboxylic acid groups were activated with a 5 mM EDC and 5 mM Sulfo-NHS solution in 60 mM MES buffer solution with pH 6.0 for 1 h. Then, the sensors were washed again with de-ionized water and incubated with 90 μL (H + L)-specific IgG Ab solution (c = 240 μg/mL IgG-Ab in PBS) for 2 h. Finally, the sensors were washed with a 100 μg/mL BSA solution and incubated for 1 h in about 100 μL of this solution to block the remaining activated carboxylic acid groups.

3. Results and Discussion

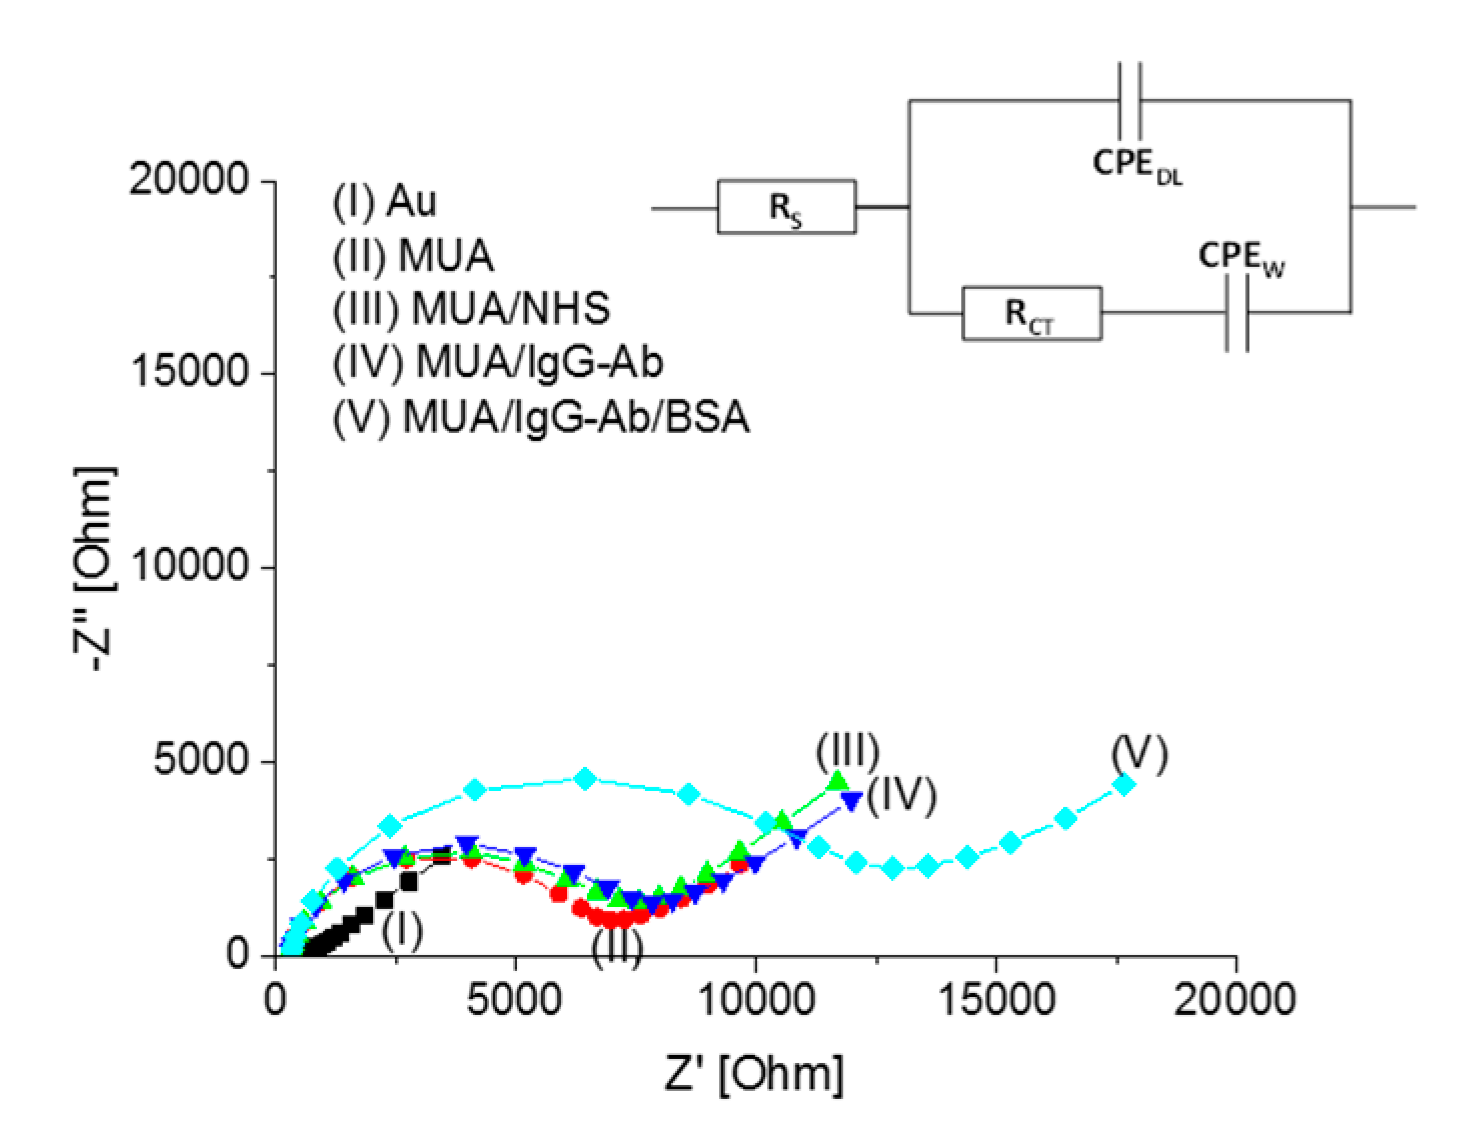
3.1. Characterization of the Functionalization Steps

The cleaned gold surface and each step of the functionalization were characterized with EIS as shown in Figure 1. By curve fitting with the corresponding Randles circuit, shown in Figure 1, the RCT of each step was determined. The impedance spectra of the cleaned gold surface provided the lowest RCT of about 500 Ω. The formation of the MUA self-assembled monolayer increased the RCT significantly to 5600 Ω. By activation of the carboxylic acid groups and the binding of the Sulfo-NHS the RCT further raised to about 6500 Ω. With the binding of the (H + L)-specific IgG Antibody the RCT was only increased to about 7000 Ω. The growth of the impedances in comparison with the size of the bound antibody was relatively low. This may be either explained by the low antibody concentration during the binding process or by steric hindrance due to antibodies that have already bound to carboxylic acid groups on the surface. Both effects leave large holes in the newly formed layer and, thus, increased RCT only slightly. To circumvent this issue, the Sulfo-NHS was displaced with the much smaller BSA, which filled up the left holes and boosted the RCT tremendously. After the binding of the BSA and blocking of the surface, the RCT amounted to about 11 kΩ.

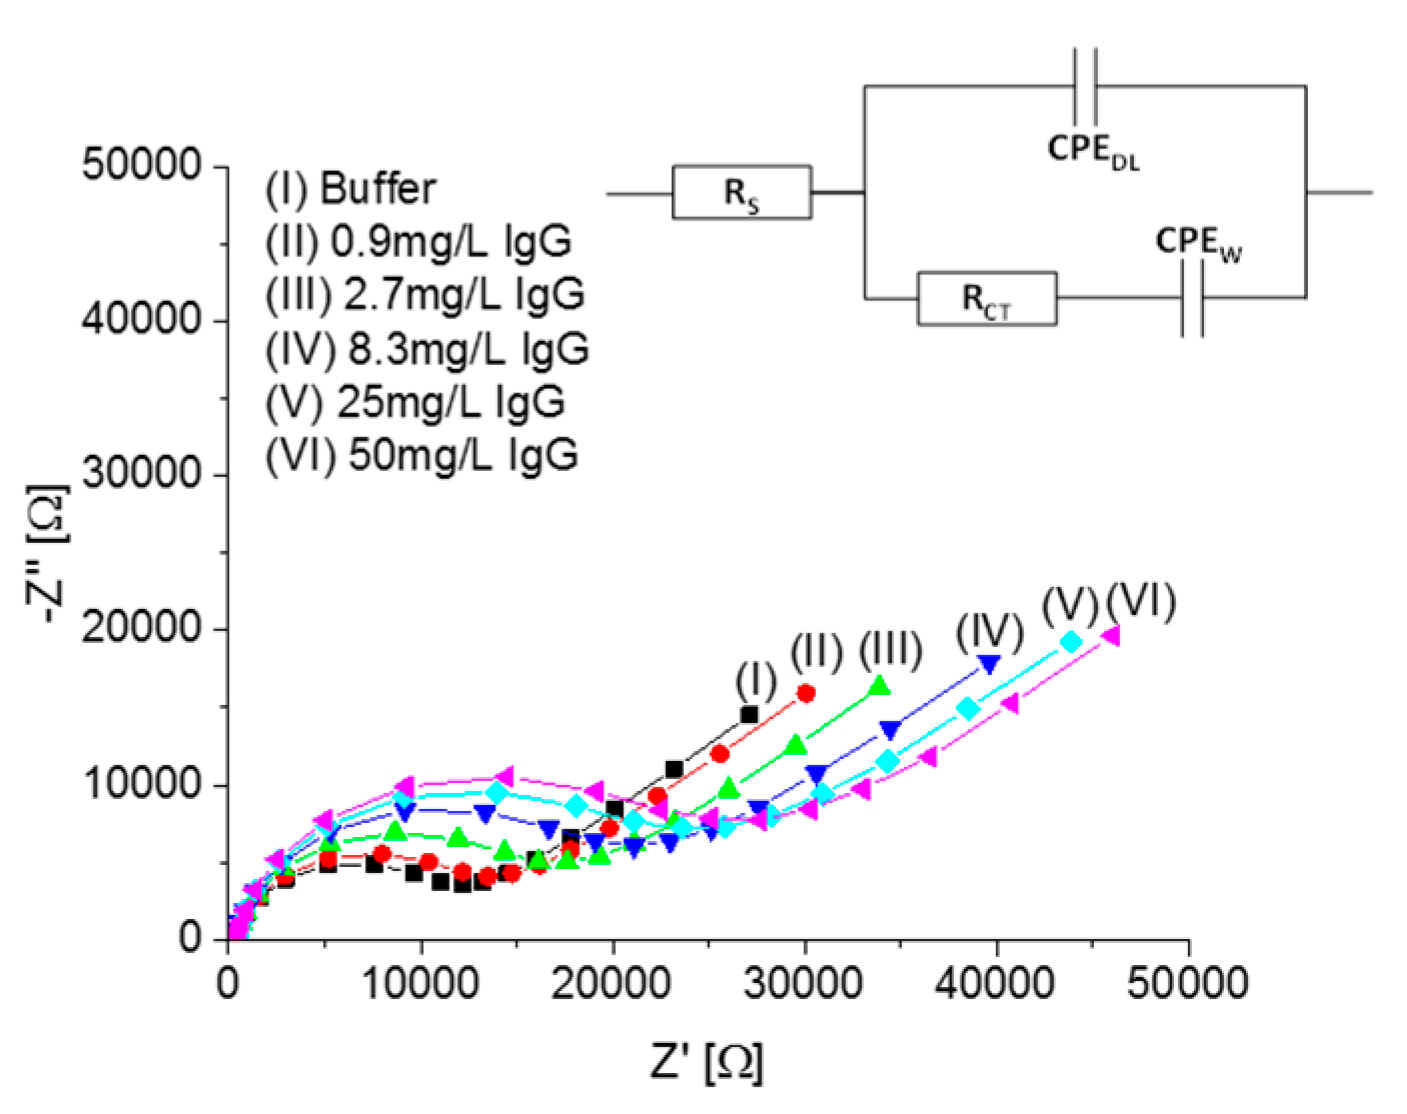
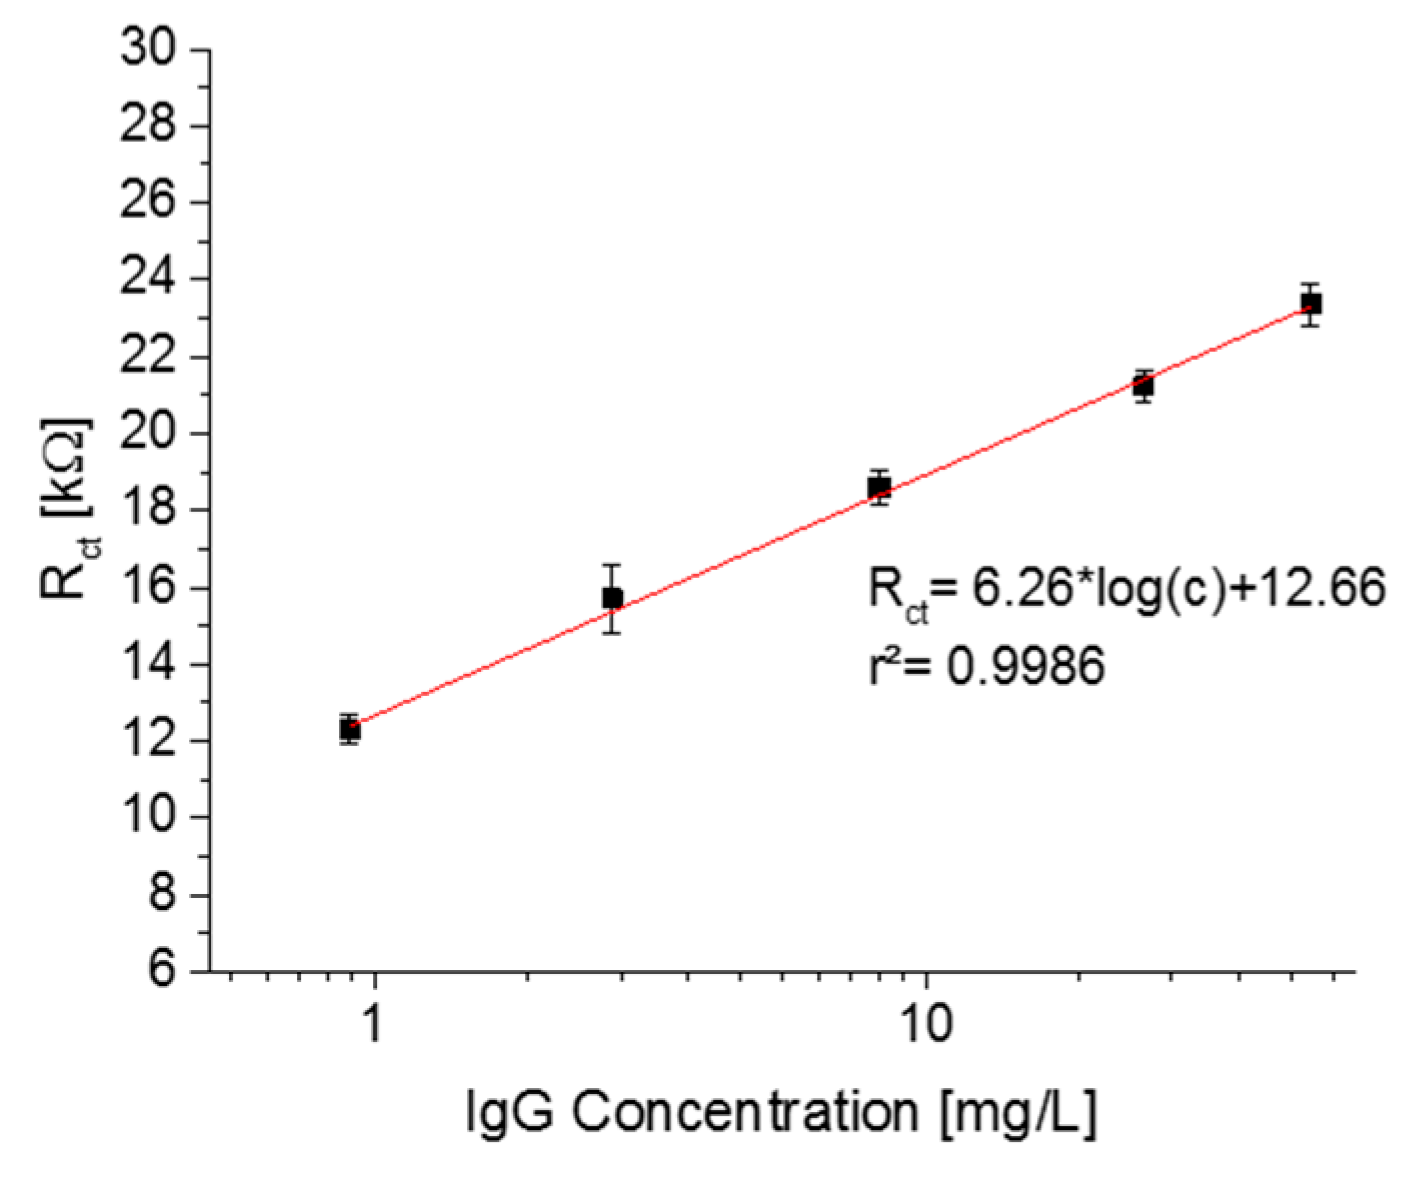
3.2. EIS Response to IgG Binding

Figure 2 shows the EIS spectra of the functionalized Au/MUA/(H + L)-specific IgG-Ab/BSA biosensor for the blank measurements and human IgG in concentrations of 0.9, 2.7, 8.3, 25 and 50 mg/L in PBS. The biosensor was incubated with each solution for 30 min and then washed with PBS. The impedances were recorded with 10 mM [Ru(NH3)6]3+ solution in PBS. With higher IgG concentrations the real and imaginary part of the impedances increase. For each concentration three measurements with new measurement solution were performed. Table 1 summarizes the average RCT for each concentration. The variation in the RCT for each measured concentration is comparatively small, which indicates that the application of [Ru(NH3)6]3+ as redox-probe solves the problem of unstable signals during the measurement as reported by Bogomolova et al. [2]. The linear relationship between the logarithmic concentration of human IgG and the RCT values is shown in Figure 3. The fabricated biosensors provide a sensitivity of 6.26 kΩ/decade and a linear correlation coefficient of 0.9986.

4. Conclusions

We have successfully applied in-situ generation of [Ru(NH3)6]3+ with DC bias as redox-probe for biosensors based on EIS. The use of [Ru(NH3)6]3+ solves the issue of degradation of gold electrodes and surface functionalization caused by the conventionally used redox-pair Ferro-/Ferricyanide. We have demonstrated this technique by an Au/MUA/IgG-Ab/BSA biosensor, which shows a linear dependence on log(c) from 0.9 to 50 mg/L with a high linear correlation coefficient of 0.9986.

Acknowledgments

This study was supported by Infineon Technologies Austria AG.

Conflicts of Interest

The authors declare no conflict of interest. The founding sponsors had no role in the design of the study; in the collection, analyses, or interpretation of data; in the writing of the manuscript, and in the decision to publish the results.

References

  1. Matos-Gomes, N.; Katsurayama, M.; Makimoto, F.H.; Santana, L.L.O.; Paredes-Garcia, E.; Becker, M.A.d.; Dos-Santos, M.C. Psychological stress and its influence on salivary flow rate, total protein concentration and IgA, IgG and IgM titers. Neuroimmunomodulation 2010, 17, 396–404. [Google Scholar] [CrossRef] [PubMed]
  2. Randviir, E.P.; Banks, C.E. Electrochemical impedance spectroscopy: An overview of bioanalytical applications. Anal. Methods 2013, 5, 1098–1115. [Google Scholar] [CrossRef]
  3. Bogomolova, A.; Komarova, E.; Reber, K.; Gerasimov, T.; Yavuz, O.; Bhatt, S.; Aldissi, M. Challenges of electrochemical impedance spectroscopy in protein biosensing. Anal. Chem. 2009, 81, 3944–3949. [Google Scholar] [CrossRef] [PubMed]
  4. Dijksma, M.; Boukamp, B.A.; Kamp, B.; van Bennekom, W.P. Effect of Hexacyanoferrate(II/III) on Self-Assembled Monolayers of Thioctic Acid and 11-Mercaptoundecanoic Acid on Gold. Langmuir 2002, 18, 3105–3112. [Google Scholar] [CrossRef]
  5. Lazar, J.; Schnelting, C.; Slavcheva, E.; Schnakenberg, U. Hampering of the Stability of Gold Electrodes by Ferri-/Ferrocyanide Redox Couple Electrolytes during Electrochemical Impedance Spectroscopy. Anal. Chem. 2016, 88, 682–687. [Google Scholar] [CrossRef] [PubMed]
  6. Doubova, L.M.; Fabrizio, M.; Daolio, S.; Forlini, A.; Rondinini, S.; Vertova, A. Electron transfer across the interface gold/self-assembled organic monolayer. Comparison of single- and two-component systems. Russ. J. Electrochem. 2012, 48, 351–363. [Google Scholar] [CrossRef]
Figure 1. EIS spectra of the functionalization steps for (I) Au; (II) Au/MUA; (III) Au/MUA/Sulfo-NHS; (IV) Au/MUA/(H + L) specific-IgG-Ab; (V) Au/MUA/F(ab)2-IgG-Ab/BSA.
Proceedings 01 00534 g001
Figure 2. EIS spectra of the functionalized sensor for (I) buffer; (II) 0.9 mg/L; (III) 2.7 mg/L; (IV) 8.3 mg/L; (V) 25 mg/L; and (VI) 50 mg/L IgG.
Proceedings 01 00534 g002
Figure 3. Dependence of charge transfer resistance on IgG concentration; c0 = 1 mg/L.
Proceedings 01 00534 g003
Table 1. Average RCT and standard deviations for samples with different IgG concentrations.
ConcentrationAverage RCTStandard Deviation
Blank11.0 kΩ0.75 kΩ
0.9 mg/L IgG12.3 kΩ0.36 kΩ
2.7 mg/L IgG15.7 kΩ0.90 kΩ
8.3 mg/L IgG18.6 kΩ0.46 kΩ
25 mg/L IgG21.2 kΩ0.42 kΩ
50 mg/L IgG23.4 kΩ0.55 kΩ
Publisher’s Note: MDPI stays neutral with regard to jurisdictional claims in published maps and institutional affiliations.

