Abstract
nEMoS (nano Environmental Monitoring System) is an all-in-one, low-cost, web-connected and 3D-printed device aimed at assessing the Indoor Environmental Quality (IEQ) of buildings. It is built using some low-cost sensors connected to an Arduino microcontroller board. The device is assembled in a small size case and the integrated air temperature and relative humidity sensor and the globe thermometer could be affected by thermal effect due to overheating of some nearby components. A thermographic analysis was made to rule out this possibility. The paper shows how the pervasive technique of Additive Manufacturing can be combined with the more traditional thermographic technique to redesign the case and to verify the accuracy of the optimized system in order to prevent instrumental systematic errors in terms of difference between experimental and actual values of air temperature, relative humidity and radiant temperature.
1. Introduction
In the field of temperature measurement, several techniques are used: invasive, semi-invasive and non-invasive [1]. The last one may be carried out by exploiting the physical principle whereby, any body at a temperature above absolute zero transmits infrared radiation corresponding to the temperature of the object. Such temperature depends on molecular motion: the greater the intensity of the movement, the greater the temperature of the object. Through thermography it is possible to measure the infrared radiation emitted by an object and its temperature distribution.
Thermography is applied in all fields where it is important to know the surface temperature of a body or parts of it. Through appropriate correlations it is possible to determine the effect associated with a particular temperature.
In this article the Additive Manufacturing and thermography techniques were used to evaluate the thermal irregularities and to optimize the functional distribution of a series of sensors placed within an integrated device for monitoring the environmental variables [2].
Local variations in temperature, in fact, may lead to an alteration of the measurement of heat-sensitive sensors and, in extreme cases, to a malfunction or breakage of the sensors. In both cases it is useful to proceed to an analysis of the temperature distribution to optimize the component layout. The monitoring systems more and more are going to non-invasive technologies. The interest of the professionals to the use of shared and customizable hardware solutions is always greater. Over the past years several shared projects and low-cost alternative technologies have grown, allowing the end users to approach the electronics in a simple and fast way. The user becomes supporter and promoter of the “maker” movement and of the Do It Yourself (DIY) approach, shooting down structural and technological limits. The spread of this movement allowed a proliferation of devices always connected in a communicating-actuating network (i.e., objects connected to the web and interconnected to each other named Internet of Things). The revolution of DIY is the last one in chronological order. After the agricultural and the industrial revolutions, the information age, the so called Third Wave, draws upon the read/write functionality of the Internet and digitally-driven design/manufacture, to enable ordinary people to invent, design, make and, sometimes, sell goods and services. Anybody at any location could carry out the principles of DIY philosophy through enabling technologies, for example Arduino or Genuino.
The evaluation of the IEQ requires the use of tools able to detect specific environmental variables. Following the so-called Internet of Things approach, that has allowed the web to evolve from the static web pages of the 90s to the web 2.0 (social networking web) of the 2000s and up to the web 3.0 (ubiquitous computing web) of the present day, a specific device has been built. ITC-CNR has developed a useful tool, called nEMoS, for assessing the Indoor Environmental Comfort (IEQ). nEMoS is based on the inexpensiveness and the consistency of the detected data. For the former of these purposes only low cost sensors and microcontrollers have been chosen. For the latter the detected data have been compared with those acquired by typical commercial sensors. The article describes the problems of the first prototype and the steps that led to the optimization of the case.
2. Materials and Methods
The hardware configuration of nEMoS is summarized in Table 1.

Table 1.
Hardware of nEMoS.
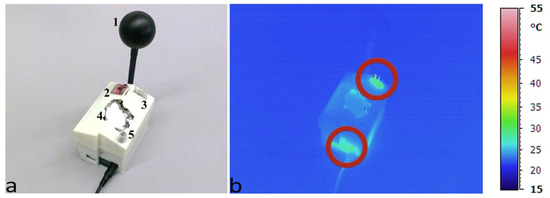
Prior to carrying out the phases of design and construction of the first prototype of the case of nEMoS, all low-cost sensors are tested for direct comparison with professional sensors in a controlled environment [3]. The case consists of three main parts: a base, the side structure with the housings for the various sensors and a top lid. It was conceived in an extremely compact way, made with 3D printing, with dimensions (L × H × W) equal to 8.5 cm × 6 cm × 7.5 cm The model, made in 3D CAD, has been printed with successive deposits of ABS (Acrylonitrile Butadiene Styrene), starting from the lower layer. The dimensional tolerances were in the order of ±0.5 mm along the axes x, y and z (Figure 1a). The Dimension Elite 3D printer used is based on FDM (Fused Deposition Modeling) technology.

Figure 1.
1st Case: (a) Disposition of sensors; (b) Thermal imaging at starting time.
Figure 1a shows the assembly of monitoring station. All the sensors are positioned on the top: 1—the globe thermometer, 2—the air temperature and relative humidity sensor (HIH6130), 3—the anemometer (Wind sensor made by modern device), 4—the CO2 concentration sensor (k-30 made by CO2 meter) and 5—the LDR (that works as a luxmeter).
3. Thermal Analysis First Test
In order to evaluate the behavior of the device and to detect instrumental systematic errors in real working conditions, an analysis was performed with the aid of a portable infrared camera (Figure 1b), Avio TVS-700, whose optical system is sensitive to infrared radiation with a wavelength in the range of 2 ÷ 14 µm, range in which the materials generally used in electronics radiate energy thus showing their thermal behavior [4]. The analysis was carried out for two different cases in two distinct phases: at the beginning of test and after one day of operation.
At the beginning of the test (Figure 1b) it is possible to notice an almost constant distribution of temperature along the case, slightly lower than 25 °C. Two localized increases in temperature can be observed at the resistor of the anemometer as well as in the lower part near the power jack, where the voltage regulator of the Arduino UNO is located.
A hot-wire anemometer, based on the heating of an element at a constant temperature, slightly above 50 °C (Figure 2a) is used to measure the air speeds that are normally medium-low in closed environments. The electrical power required to maintain the constant temperature is a function of the air speed changes.

Figure 2.
Thermal imaging: (a) Anemometer; (b) Voltage regulator of Arduino UNO.
The system is powered by a 12 V (Vin) AC/DC adapter. The voltage regulator mounted on the Arduino UNO board provides an output voltage of 5 V (Vout). The current (I) through nEMoS is about 160 mA. The power dissipated in the voltage regulator almost equal to 1 W is given by the product of the voltage that passes through it multiplied by the current through it (1).
The voltage regulator mounted on the Arduino UNO board is the ncp1117st50t3g type with 318-H casing version. The value of the Junction−to−Case thermal resistance (Rt) obtained from the datasheet is equal to 15 °C/W.
Considering a surrounding temperature (Tsurr) of about 24.5 °C the surface temperature of the voltage regulator (Tc) is equal to about 40 °C (2).
The thermographic analysis (Figure 2b) highlights how effectively the temperature value in the proximity of the voltage regulator can be compared to the calculated value.
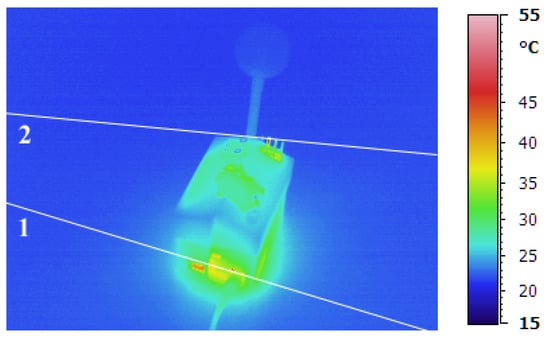
After approximately 24 h of use of the first prototype of nEMoS (Figure 3), a maximum temperature slightly above 50 °C was noticed on the top of the case in correspondence of the anemometer as well as a temperature of about 40 °C in the lower part near the power jack, where the voltage regulator is located.

Figure 3.
1st Case, Thermal imaging after 24 h.
Profile 1 highlights the disturbance in temperature distribution due to the voltage regulator (Figure 4a). It can be observed how a disturbance of the temperature range due to the voltage regulator and to the nearby power jack extends to a diameter of about 10 cm. Profile 2 shows the field of perturbation due to the anemometer (Figure 4b). In this case the perturbation of the temperature due to the anemometer extends to a diameter of about 6 cm.

Figure 4.
Temperature distribution: (a) Profile 1; (b) Profile 2.
Figure 5a describes the trend of the air temperature (Ta) and relative humidity (RH) recorded by the integrated sensor mounted on the monitoring system. Figure 5b describes the trend of radiant temperature (Trad). The values recorded by the device are compared to that measured by two reference sensors: a thermoigrometric sensor (Reference_Ta and Reference_RH in Figure 5a) and a globe thermometer (Reference_Trad in Figure 5b).

Figure 5.
1st Case: (a) Air temperature and relative humidity data; (b) Radiant temperature data.
As it may be noticed, a rapid increase in temperature measured values occurs during the first minutes elapsed after the start of the test. The increase in temperature of the device affects the temperature measurement of the sensor. After one hour of operation the curve tends to be almost constant and equal to about 29 °C, which is a sign that it is necessary to wait about an hour to reach thermal equilibrium. Overall, according to the characteristics of the case described above, the system records a temperature about 4.5 °C higher than that of the surrounding air.
The aforementioned irregularity is confirmed also regarding the detection of RH and Trad due to the presence of the nearby hot wire anemometer.
4. Optimization and Results
The thermographic analysis shows an interference in the measurement of the real temperature due to local overheating. To obviate the above observed drawbacks a new case was designed and 3D-printed with polylactic acid, a biodegradable thermoplastic derived from renewable resources.
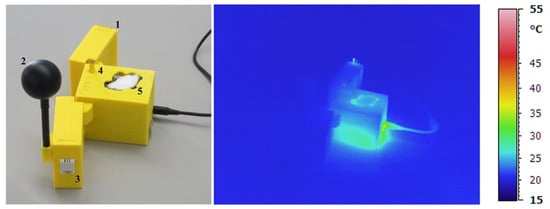
The new case (Figure 6a) consists of a central part and two side wings: the end of one wing provides the anemometer housing (1), while the globe thermometer (2) and the air temperature and relative humidity sensor (3) are housed at the end of the opposite wing. The central part contains the sensors not susceptible to temperature changes, the LDR (4) and the CO2 concentration sensor (5). The auxiliary components for the data logging functions are also housed in the central part of the case.

Figure 6.
Optimized case: (a) Disposition of sensors; (b) Thermal imaging after 24 h.
The thermography performed after one day of operation (Figure 6b) shows no localized heating in the proximity of the globe thermometer and of the air temperature and relative humidity sensor. At this stage the data recorded by the monitoring system as regards air temperature,relative humidity (Figure 7a) and radiant temperature (Figure 7b) do not show any anomaly.

Figure 7.
2nd Case: (a) Air temperature and relative humidity data; (b) Radiant temperature data.
5. Conclusions
The use of low-cost sensors in replacement of the professional ones allows to create very little and technologically advanced devices with cloud storage features. However, using low-cost equipment without a preliminary verification of the performance can lead to errors of measurement due to a faulty calibration or to a wrong assembly that, as shown, may cause measurement errors due to a combination of sensors with incompatible characteristics. For this reason infrared technology has been used to verify the behavior of nEMoS in real operating conditions. In this specific case, through the combined use of Additive Manufacturing and thermographic techniques it was possible to detect anomalies in the distribution of temperature and correcting the causes that generated them.
In fact the thermographic analysis allowed to identify the hottest points, establishing the scope of perturbation due to sensors and circuit elements that heat the most and, finally, to optimize the 3D-printed case of nEMoS for a proper evaluation of indoor environmental comfort.
The optimization of the case allowed to improve the accuracy of the instrument in terms of the difference between the experimental and the real values of the air temperature, relative humidity and radiant temperature.
Author Contributions
The work presented in this paper is a collaborative development by all of the authors. In particular, F. Salamone and I. Meroni have performed the thermographic analysis. F. Salamone has developed the case. L. Danza and M. Cristina Pollastro have performed the data analysis. Writing of the paper was shared between the authors.
Acknowledgments
This work has been supported within the Framework Agreement between the Lombardy Region and National Research Council of Italy (CNR).
Conflicts of Interest
The authors declare no conflict of interest.
References
- Childs, P. Practical Temperature Measurement; Butterworth-Heinemann: Oxford, UK, 2001. [Google Scholar]
- Salamone, F.; Belussi, L.; Danza, L.; Ghellere, M.; Meroni, I. New scenarios of characterization of internal environmental comfort. Sustainable Housing Construction. In Proceedings of the 40th IAHS World Congress on Housing, Funchal, Portugal, 16–19 December 2014; p. 128. [Google Scholar]
- Salamone, F.; Belussi, L.; Danza, L.; Ghellere, M.; Meroni, I. Design and Development of nEMoS, an All-in-One, Low-Cost, Web-Connected and 3D-Printed Device for Environmental Analysis. Sensors 2015, 15, 13012–13027. [Google Scholar] [CrossRef] [PubMed]
- Lanzoni, D. Termografia; Maggioli Editore: Rimini (RN), Italy, 2014. [Google Scholar]
Publisher’s Note: MDPI stays neutral with regard to jurisdictional claims in published maps and institutional affiliations. |
© 2016 by the authors. Licensee MDPI, Basel, Switzerland. This article is an open access article distributed under the terms and conditions of the Creative Commons Attribution (CC BY) license (https://creativecommons.org/licenses/by/4.0/).