1. Introduction
Asset failures in the high voltage grid can cause power blackouts for large numbers of customers, thus predictive maintenance of the assets is paramount to avoid undesired failures [
1]. Several techniques are used to carry out predictive maintenance but the measurement of partial discharges (PD) is a common method since PD phenomena can unveil aged or defective devices within electrical facilities [
2]. PD occurs in inhomogeneous locations within or on insulating materials stressed by high voltage. These pulses radiate electromagnetic energy fields which are measurable with antennas [
3]. The PD source can be located by deploying an appropriate set of antennas and processing the acquired electromagnetic emissions correctly [
4,
5].
To estimate the PD source position it is required to know the antenna positions and the time differences of arrival (TDOA) of the emissions between antennas. There may be many sources of errors related to the process of PD sources location [
6]. For instance, the antenna layout and the relative positions of the antennas within the array in relation to the source affects the location accuracy [
7,
8], since some positions of the source are less sensitive than others to errors for any given array. One of the variables used in the location of the source of PD is the known position of the antennas in the coordinate system. Though the antennas must be positioned carefully and accurately there always exists an uncertainty in their known positions. Obviously, these errors will affect the TDOA used for the localization of the PD source. Usually, when the data is processed, the theoretical position of the antennas does not include these systematic errors, but unfortunately, the TDOA will be affected. As a consequence, when executing the location algorithm the determined PD source location will be shifted from the actual position.
In this paper, using simulations systematic errors of only one centimeter in the position of the antennas within arrays which have antennas separated by around 2 m are shown to propagate to the estimated location of the source. Three antenna layouts (square, pyramidal and trapezoidal) and several representative PD source positions —the source surrounded by the antennas and the source outside the array— are studied. In each case, a statistical analysis is made to compare how the positioning errors are propagated differently for each configuration.
2. Location Algorithm
The principles of PD source location are based on the simple kinematics of rectilinear movement, so the distance
covered by the emissions from the source to the
antenna is equal to the time spent propagating on this path,
, multiplied by,
c, the speed of propagation:
In (
1),
c and the antenna positions,
are known so the target is to calculate the source position
. Unfortunately, the time of flight
from the PD source to the
antenna cannot be determined because the initial time of the emission is not known. To solve this issue the time differences of arrival of the emissions to the different antennas are used instead [
9]. Thus Equation (
1) is modified to:
The variable
is the difference in distances from the source to the antennas
i and
j. The variables
and
are relative signal detection onsets which depend on the configuration of the acquisition with
being the measured TDOA, which always depends on the antenna array arrangement and PD source geometry. Since there are three unknown variables,
, three equations are required to find the PD source position. This is achieved using four antennas to obtain at least three TDOA values. An optimization technique called particle swarm optimization (PSO) can be used to solve this system of nonlinear equations, leading to accurate theoretical results for this application [
5,
10]. The target of PSO is to find the PD source position
which minimizes the equation:
The variable
is the difference in distance from the estimated source to antennas
i and
j; this already includes any positioning error since the position of the antennas has been altered by a determined quantity. The analytic calculation of the error determined in Equation (
3) in the estimation of
may theoretically be calculated through applying propagation of errors techniques. In general, considering a Gaussian distribution of the uncertainties, the propagation of the error in the variables
in a general function
can be obtained by calculating the partial derivatives of the function with respect to each variable multiplied by its own uncertainty
and squaring the quadratic sum of all terms for each variable, see Equation (
4).
In this case, omitting the TDOAs, there are 12 variables, 3 for each antenna. The analytic calculation of the error generated in each dimension depends on the other dimensions of the PD source so the sole definition of the problem requires a high degree of sophistication and its solution requires high computational resources. For this reason, it is difficult to undertake the analytic calculation of the propagated error. In this paper, the propagated error is quantified by simulations as described in
Section 4.
3. Antenna Layouts
The antenna layout affects the source location due to the different sensitivity in errors in the time differences of arrival [
6]. In this paper, three commonly used antennas configurations (square, pyramid and trapezoidal) shown in
Figure 1 have been analyzed. The square arrangement is the most widely used for PD source location [
4]. The pyramidal array has also been widely used but this arrangement provides results which are not as satisfactory. The trapezoidal layout has been used in some publications yielding good results in a wide range of directions [
7]. In the following simulations, all antenna layouts have one of the antennas positioned in a different plane from the plane formed by the other 3 antennas. This is required because if all antennas are placed in the same plane, the location is not possible. For instance, with all antennas placed in the XY plane, there will be no positional resolution in the Z dimension making it impossible to 3D locate the desired source.
4. Results and Discussion
The study in this Section quantifies the uncertainty in the position of the source when a systematic error is present in the positioning of the antennas. The procedure of the study is, first, to define the theoretical position of the antennas and the source, then, to apply the errors to the antenna positions and to calculate the resulting TDOA with the errors included. Then, the localization algorithm is executed both for the correct positions of the antennas and also using the TDOA with the positioning error. As a result, the location of the source is shifted from the actual position. Running this procedure for different source positions gives an indication of which antenna layout would be the best for certain PD source directions.
The simulations consider an
positioning error in the antennas; this error is applied as follows. One antenna has each positional component
changed independently by
, keeping the other 3 antennas in the correct positions. The other 3 antennas are then changed in the same way. As a result, for each configuration and each position of the source there are 24 cases (4 antennas and 2 errors (
cm) on each coordinate
).
Table 1 shows the six cases for antenna
i out of four antennas.
As a result 24 scatter points localization is obtained.
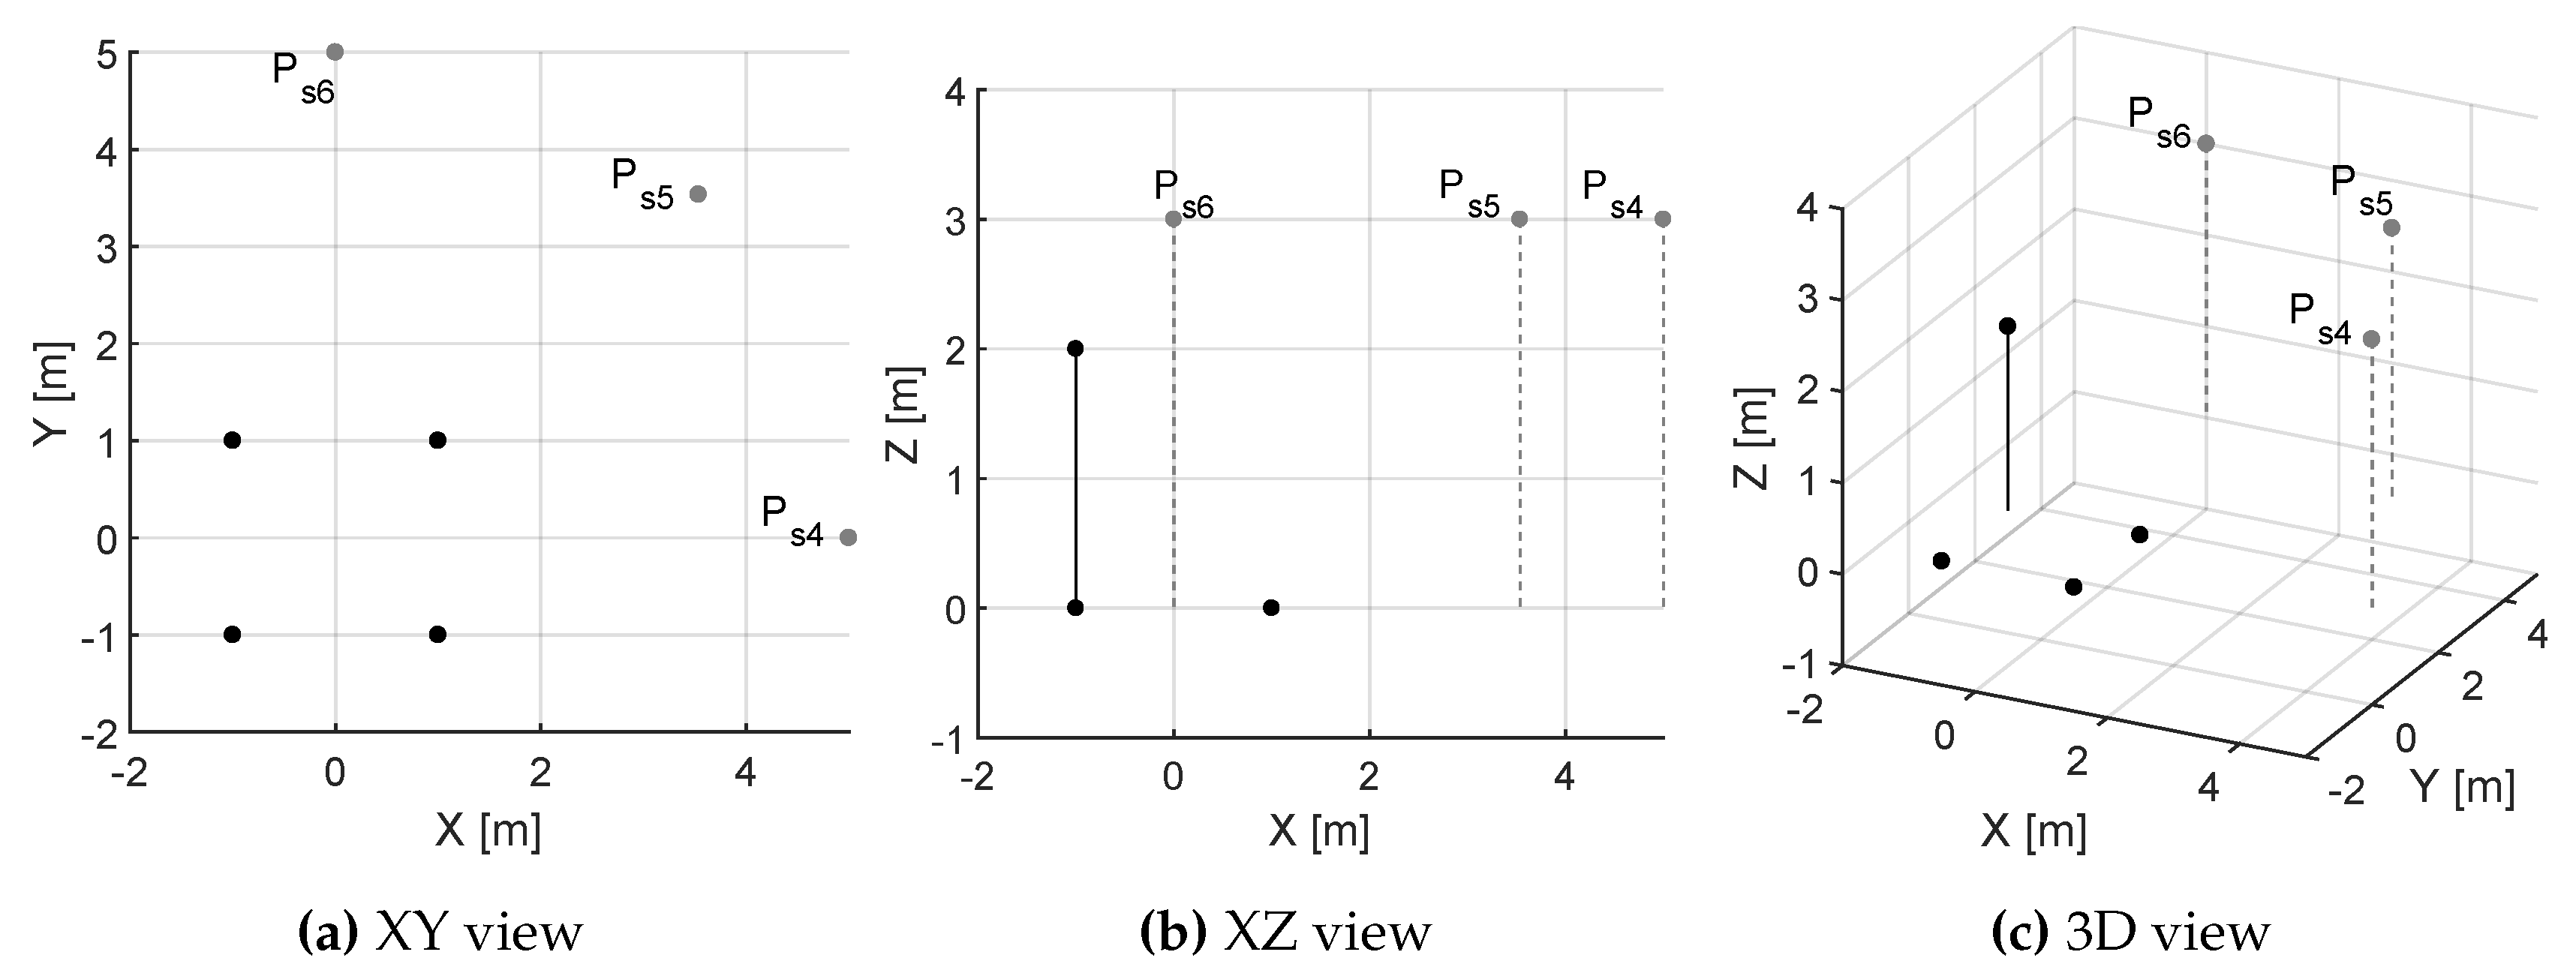
Figure 2 shows the case where the PD source is located at
m from different points of view. The different antennas are marked as large black points, the theoretical source position with large grey points and the cluster resulting of solutions for all cases resulting in shifted PD sources locations with small black points.
The error in distance
from the shifted PD sources locations,
to the actual position is calculated by Equation (
5). This procedure is repeated for several PD source positions with different antenna layouts and a statistical analysis of the location errors is made to ascertain which antenna layout and which directions are more or less affected by the antenna positioning errors.
4.1. Error Considering the Distance of the PD Source to the Antenna Array
The effect of the distance between the PD source and antenna layout is evaluated. Different PD sources have been placed in certain fixed directions but at different distances to the antenna layouts. When the PD source is surrounded by the antennas, that is, when
m, the errors are in the range of millimeters with all the antenna layouts providing similar errors, see
Figure 3a. The effect of the distance of the PD source to the array in the location error can be observed comparing points
m and
m —placed in the same direction but doubling the distance from the origin. The result is as expected since the localization error for each configuration of antennas is larger when the source is farther away, see the box plots shown in
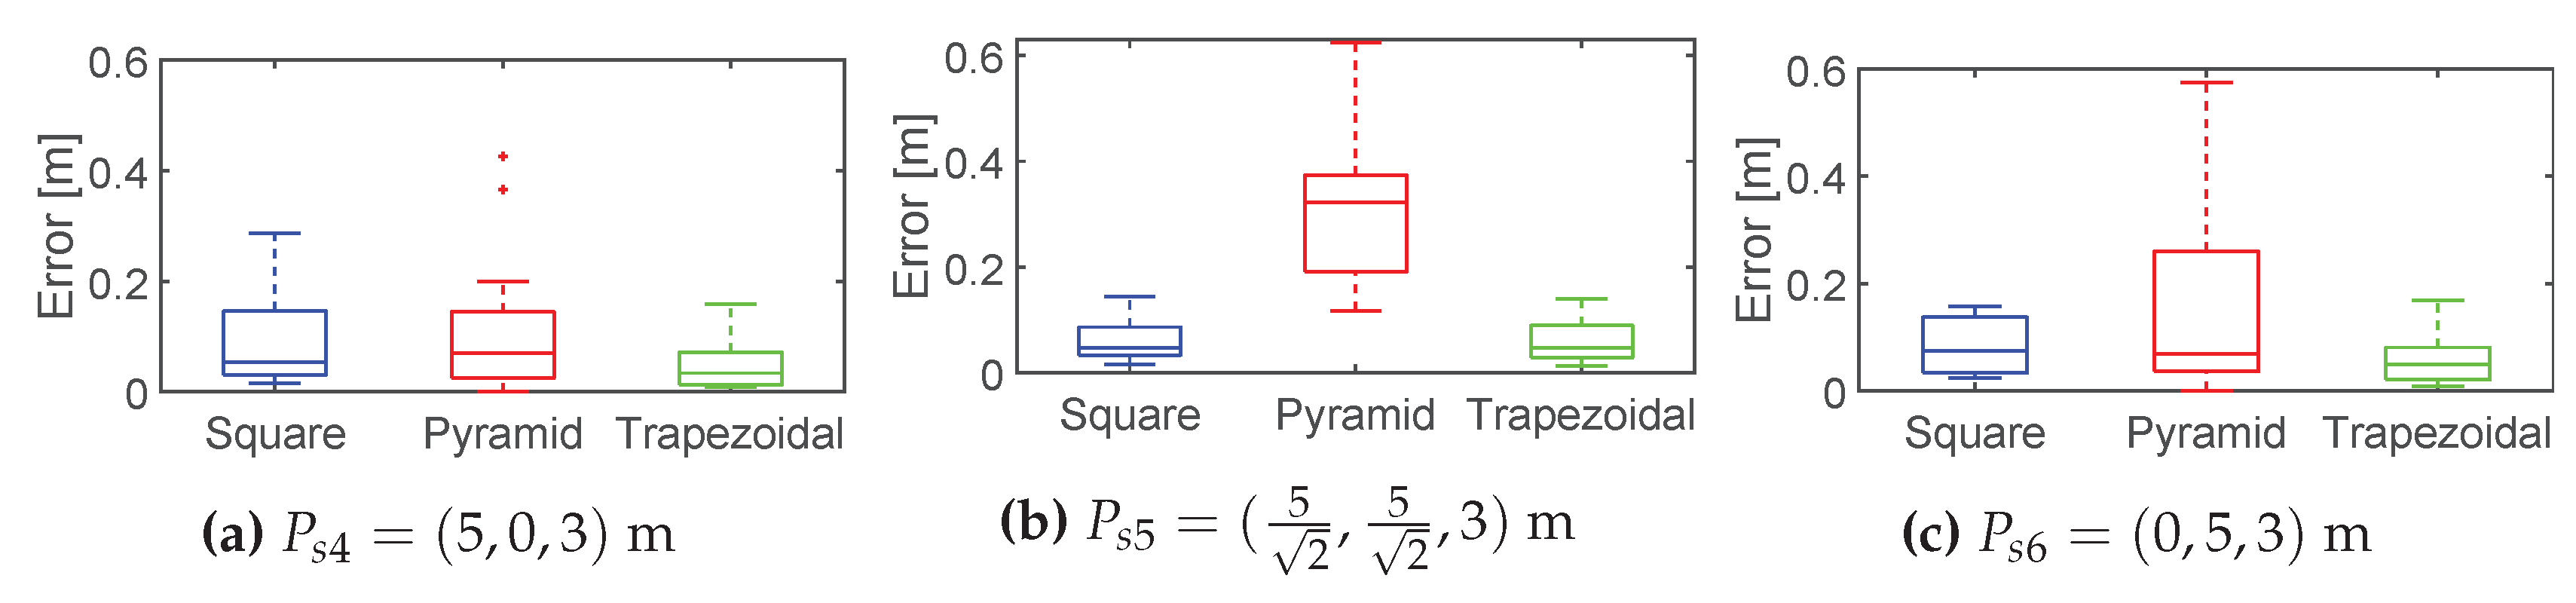
Figure 3. In the box plots the horizontal line inside the rectangle represents the median of the error, the box top represents the 75
th percentile, the box bottom represents the 25
th percentile, the horizontal lines outside the box represent the maximum and the minimum errors, with the small red cross representing the outliers.
In the square configuration, at m, the median of all 24 possible errors is 0.054 m and at m is 0.27 m, five times larger though the distance is only doubled. The same happens in the pyramidal configuration: at m the median is 0.070 m and at m is 0.32 m. Finally, in the trapezoidal configuration, at m the median is 0.034 m and at m the median is 0.08 m, which is 2.35 times larger. Therefore, it can be concluded that, in this direction, the trapezoidal configuration is better for two reasons: namely it has the lowest location errors in both cases and the error for longer distances has a lower rate of growth.
4.2. Error Considering the Direction of the PD Source from the Antenna Array
The effect on the error in the PD source location regarding the direction between the antenna arrays and the PD source is studied in this Section. Three points are analyzed:
m,
m and
m, see grey points in
Figure 4. All of the points are at the same distance from the center of each antenna array but with different directions. The results shows that the square configuration has a median in localization error for all 24 possibilities of 0.054, 0.047 and 0.074 m respectively for the three analysed PD positions. The pyramidal layout has a median of 0.070, 0.322 and 0.064 m respectively and, finally, the trapezoidal arrangement has error medians of 0.034, 0.047 and 0.049 m respectively. As these results show, the direction of the PD source and the antenna arrangements affect the localization errors. In the analysed directions, the trapezoidal layout reports lower and more stable location errors than the other configurations. The full statistic results are shown in the box plots displayed in
Figure 5.
It can be seen that the trapezoidal configuration yields a more compact scatter point localization set than the square and pyramidal configurations confirming that, in the directions considered, the trapezoidal configuration appears to produce lower errors than the other configurations.
5. Conclusions
In agreement with previous work, the antenna layout arrangement affects the localization of PD sources in the presence the antenna positioning errors. The best antenna layout for the selected source positions appears to be the trapezoidal arrangement since it reports lower location errors. The relative position of the PD source with respect to the antennas also affects the propagated error in the source location. When the PD source is enclosed by antennas, the errors in the location are very small. With the same absolute errors in the antennas positioning, the errors in the source location are larger as the source-antennas distance increases. In the cases where the source is far from the antennas, errors of one centimeter in the antenna positioning can be translated into tens of cm of error in the source location. The PD source direction with respect to the antenna arrays also affects in the localization error thus it is recommended to place the antennas following the best or preferred directions to minimize the uncertainty in the estimated position of the source.
Finally, as a general recommendation, the position of the antennas should be carefully measured in a reference system to avoid adding an important uncertainty to the calculated location of the source. Additionally, the array should be placed as close to the estimated position of the source as possible and oriented to the direction where the configuration is less sensitive to errors. When possible, the best alternative is to surround the estimated position of the source to minimize the uncertainty.
Author Contributions
The main idea of the paper was conceived by Jose M. Fresno, Brian G. Stewart and Guillermo Robles. The simulations were designed and carried out by José M. Fresno. All the authors contributed to the writing of the manuscript.
Acknowledgments
Simulations were undertaken at the Universidad Carlos III of Madrid and the University of Strathclyde Glasgow. The work undertaken in this paper has been funded by the Spanish Government under contract DPI2015-66478-C2-1. Jose M. Fresno received an international travel grant from the Universidad Carlos III of Madrid.
Conflicts of Interest
The authors declare no conflict of interest.
References
- Zhang, X.; Gockenbach, E.; Wasserberg, V.; Borsi, H. Estimation of the Lifetime of the Electrical Components in Distribution Networks. EEE Trans. Power Deliv. 2007, 22, 515–522. [Google Scholar] [CrossRef]
- IEEE. IEEE-P1434/D1.1.IEEE Guide for the Measurement of Partial Discharges in AC Electric Machinery; IEEE Std 1434-2014 (Revision of IEEE Std 1434-2000); IEEE: New York, NY, USA, 2014; pp. 1–89. [Google Scholar]
- Yao, C.; Chen, P.; Huang, C.; Chen, Y.; Qiao, P. Study on the Application of an Ultra-High-Frequency Fractal Antenna to Partial Discharge Detection in Switchgears. Sensors 2013, 13, 17362–17378. [Google Scholar] [CrossRef] [PubMed]
- Moore, P.J.; Portugues, I.E.; Glover, I.A. Radiometric location of partial discharge sources on energized high-voltage plant. IEEE Trans. Power Deliv. 2005, 20, 2264–2272. [Google Scholar] [CrossRef]
- Robles, G.; Fresno, J.M.; Martínez-Tarifa, J.M. Separation of Radio-Frequency Sources and Localization of Partial Discharges in Noisy Environments. Sensors 2015, 15, 9882–9898. [Google Scholar] [CrossRef] [PubMed]
- Robles, G.; Fresno, J.M.; Sánchez-Fernández, M.; Martínez-Tarifa, J.M. Antenna Deployment for the Localization of Partial Discharges in Open-Air Substations. Sensors 2016, 16, 541. [Google Scholar] [CrossRef] [PubMed]
- Stewart, B.G.; Nesbitt, A.; Hall, L. Triangulation and 3D location estimation of RFI and Partial Discharge sources within a 400kV substation. In Proceedings of the 2009 IEEE Electrical Insulation Conference, Montreal, QC, Canada, 31 May–3 June 2009; pp. 164–168. [Google Scholar]
- Hui-juan, H.; Ge-hao, S.; Xiu-chen, J.; Hong, G.; Yu-ying, S. Error analysis of location algorithm for partial discharge in substation. In Proceedings of the 2012 International Conference on Condition Monitoring and Diagnosis (CMD), Bali, Indonesia, 23–27 September 2012; pp. 786–789. [Google Scholar]
- Tang, L.; Wu, Z.; Li, H.; Nie, D. Location of partial discharges in power transformers using computer-aided acoustic techniques. Can. J. Electr. Comput. Eng. 1996, 21, 67–71. [Google Scholar] [CrossRef]
- Harris, R.M.; Judd, M.D. Locating Partial Discharge Using Particle Swarm Optimisation. In Proceedings of the 2011 46th International Universities’ Power Engineering Conference (UPEC), Soest, Germany, 5–8 September 2011; pp. 1–6. [Google Scholar]
| Publisher’s Note: MDPI stays neutral with regard to jurisdictional claims in published maps and institutional affiliations. |
© 2016 by the authors. Licensee MDPI, Basel, Switzerland. This article is an open access article distributed under the terms and conditions of the Creative Commons Attribution (CC BY) license (https://creativecommons.org/licenses/by/4.0/).


