Article

Assessing Controlled Traffic Farming as a Precision Agriculture Strategy for Minimising N2O Losses

by
Bawatharani Raveendrakumaran
1,2,
Miles Grafton
1,
Paramsothy Jeyakumar
1,*,
Peter Bishop
1 and
Clive Davies
3
1
School of Agriculture and Environment, Massey University, Palmerston North 4410, New Zealand
2
Department of Agricultural Engineering, Faculty of Agriculture, Eastern University, Chenkalady 30350, Sri Lanka
3
School of Advanced Technology, Massey University, Palmerston North 4410, New Zealand
*
Author to whom correspondence should be addressed.
Nitrogen 2025, 6(3), 63; https://doi.org/10.3390/nitrogen6030063
Submission received: 24 June 2025 / Revised: 28 July 2025 / Accepted: 31 July 2025 / Published: 4 August 2025

Abstract

Intensive vegetable farming emits high nitrous oxide (N2O) due to traffic-induced compaction, highlighting the need for preventing nitrogen (N) losses through better traffic management. This study examined the effects of Controlled Traffic Farming (CTF) and Random Traffic Farming (RTF) on N2O emissions using intact soil cores (diameter: 18.7 cm; depth: 25 cm) collected from a vegetable production system in Pukekohe, New Zealand. Soil cores from CTF beds, CTF tramlines, and RTF plots were analysed under fertilised (140 kg N/ha) and unfertilised conditions. N2O fluxes were monitored over 58 days using gas chambers. The fertilised RTF system significantly (p < 0.05) increased N2O emissions (5.4 kg N2O–N/ha) compared to the unfertilised RTF system (1.53 kg N2O–N/ha). The emission from fertilised RTF was 46% higher than the maximum N2O emissions (3.7 kg N2O–N/ha) reported under New Zealand pasture conditions. The fertilised CTF system showed a 31.6% reduction in N2O emissions compared to fertilised RTF and did not differ significantly from unfertilised CTF. In general, CTF has demonstrated some resilience against fertiliser-induced N2O emissions, indicating the need for further investigation into its role as a greenhouse gas mitigation strategy.

1. Introduction

Agriculture plays a pivotal role in New Zealand’s economy, accounting more than 50% of the nation’s total export value [1]. Approximately 45% of the country’s land area is allocated to agricultural use, of which 93% is managed under a pastoral system. The remaining portion is used for a diverse mix of annual and perennial cropping and horticultural practices [1]. The industry encompasses around 55 different crops and operates across approximately 50,000 hectares of land, primarily concentrated in regions such as Pukekohe, Hawke’s Bay, Canterbury, and Gisborne [2]. These regions provide favourable climatic and soil conditions for year-round production of both field and greenhouse vegetables. Despite its productivity, the sector faces growing challenges related to land use intensification, environmental regulations, and climate variability (Ministry for Primary Industries [3]). Over the past 20–30 years, significant land use intensification has occurred across New Zealand, resulting in various adverse environmental consequences, including soil compaction [4].
Soil compaction poses a critical challenge in New Zealand’s intensive vegetable production, particularly in regions like Horowhenua, Pukekohe, and Canterbury, where frequent machinery use and short crop rotations are common. Soil compaction is a critical issue as it alters soil structure, reducing pore space and impeding oxygen diffusion. This promotes anaerobic conditions that facilitate the microbial process of denitrification, ultimately leading to the production of nitrous oxide (N2O) [5,6]. Nitrous oxide is of particular concern as it is both a potent greenhouse gas and an ozone-depleting substance [7,8]. In addition to this, it also represents a significant loss of applied N fertiliser, undermining both environmental sustainability and agricultural efficiency [9]. One study demonstrated that N2O emissions could be up to four times higher in compacted soils compared to non-compacted soils [10]. This substantial increase is primarily attributed to reduced oxygen availability, which enhances denitrification, the principal biological pathway responsible for N2O generation.
Topsoil compaction due to field traffic can increase N2O emissions by 1.3 to 42 times, a process that is further exacerbated in the presence of high nitrogen (N) inputs due to enhanced conditions for microbial denitrification [11]. The influence of tractor compaction and N fertiliser rate on N2O emissions from an irrigated potato crop was estimated in New Zealand, and it was reported that 2.5 to 2.9 kg N2O–N/ha was emitted from the tractor-compacted furrows [12]. However, the emissions were only 0.4 to 1.2 kg N2O–N/ha from either the ridges or uncompacted furrows. They also reported that the influence of tractor compaction on N2O emissions was higher than the soil mineral N concentration at 70 to 90 kg N/ha. However, except this one known study, there is no information published in the literature on N2O emission due to traffic-induced soil compaction in other vegetable cropping systems in New Zealand.
To address soil compaction, vegetable growers in New Zealand have increasingly adopted Controlled Traffic Farming (CTF), which is a precision agriculture strategy that minimises unnecessary soil disturbance. CTF operates as an in-field traffic management system, maintaining permanent separation between crop zones and traffic lanes through the integration of advanced technologies such as satellite navigation and auto-guidance systems [13,14]. Satellite navigation and auto-guidance systems play a key role in implementing CTF by ensuring the accurate and repeatable movement of machinery along permanent traffic lanes. These technologies help maintain consistent wheel paths, minimizing random trafficking and preserving soil structure in crop zones [15]. This spatial separation ensures that the crop zone remains uncompacted, leading to improved root growth and increased crop yields [16]. Simultaneously, the deliberate compaction of traffic lanes improves vehicle traction efficiency compared to conventional Random Traffic Farming (RTF) practices [17]. Additionally, CTF has been shown to improve soil physical properties by preserving porosity and aeration in the crop zone, creating a favourable environment for gaseous exchange [18,19].
N2O emissions have been shown to be significantly lower under CTF systems compared to RTF systems, with reductions of 45.4%, 21%, 24.8%, and 38.3% reported for spinach, sown onions, planted onions, and carrots, respectively [19]. After five years of partial CTF implementation, emission reductions in the crop zone ranged from 21% to 45% relative to RTF [19]. Emissions from trafficked soils were found to be consistently 2.2 times higher than those from non-trafficked soils [18], and simulated random traffic generated similar emissions to permanent traffic lanes but significantly higher emissions than those from non-trafficked crop beds [20]. Potential reductions in N2O emissions from CTF systems were estimated to range between 20% and 45%, with at least a 20% reduction in direct emissions from field operations compared to non-CTF systems [21]. Overall, total soil emissions could be reduced by 30% to 50% through the adoption of CTF, with consistent results across various soil types, crop rotations, and environmental conditions [22]. Therefore we hypothesize that implementing a CTF system will significantly reduce N2O emissions compared to RTF in New Zealand’s intensive vegetable production systems. The prominent intervention highlighted in this study is the application of CTF as a strategic field management practice to mitigate N2O by reducing soil compaction and preserving soil physical structure in the crop zone.
Despite extensive evidence supporting the agronomic and environmental benefits of CTF, particularly in reducing N2O emissions, there remains a lack of empirical data quantifying these effects within New Zealand’s vegetable-growing regions. Limited studies suggest that CTF implementation may contribute to mitigating N2O emissions while also alleviating traffic-induced compaction [18,19]. However, direct comparative measurements under New Zealand conditions are lacking. To address this research gap, the present study aimed to quantify and compare N2O emissions under CTF and RTF systems using soil cores collected from commercial vegetable fields in Pukekohe, New Zealand.

2. Materials and Methods
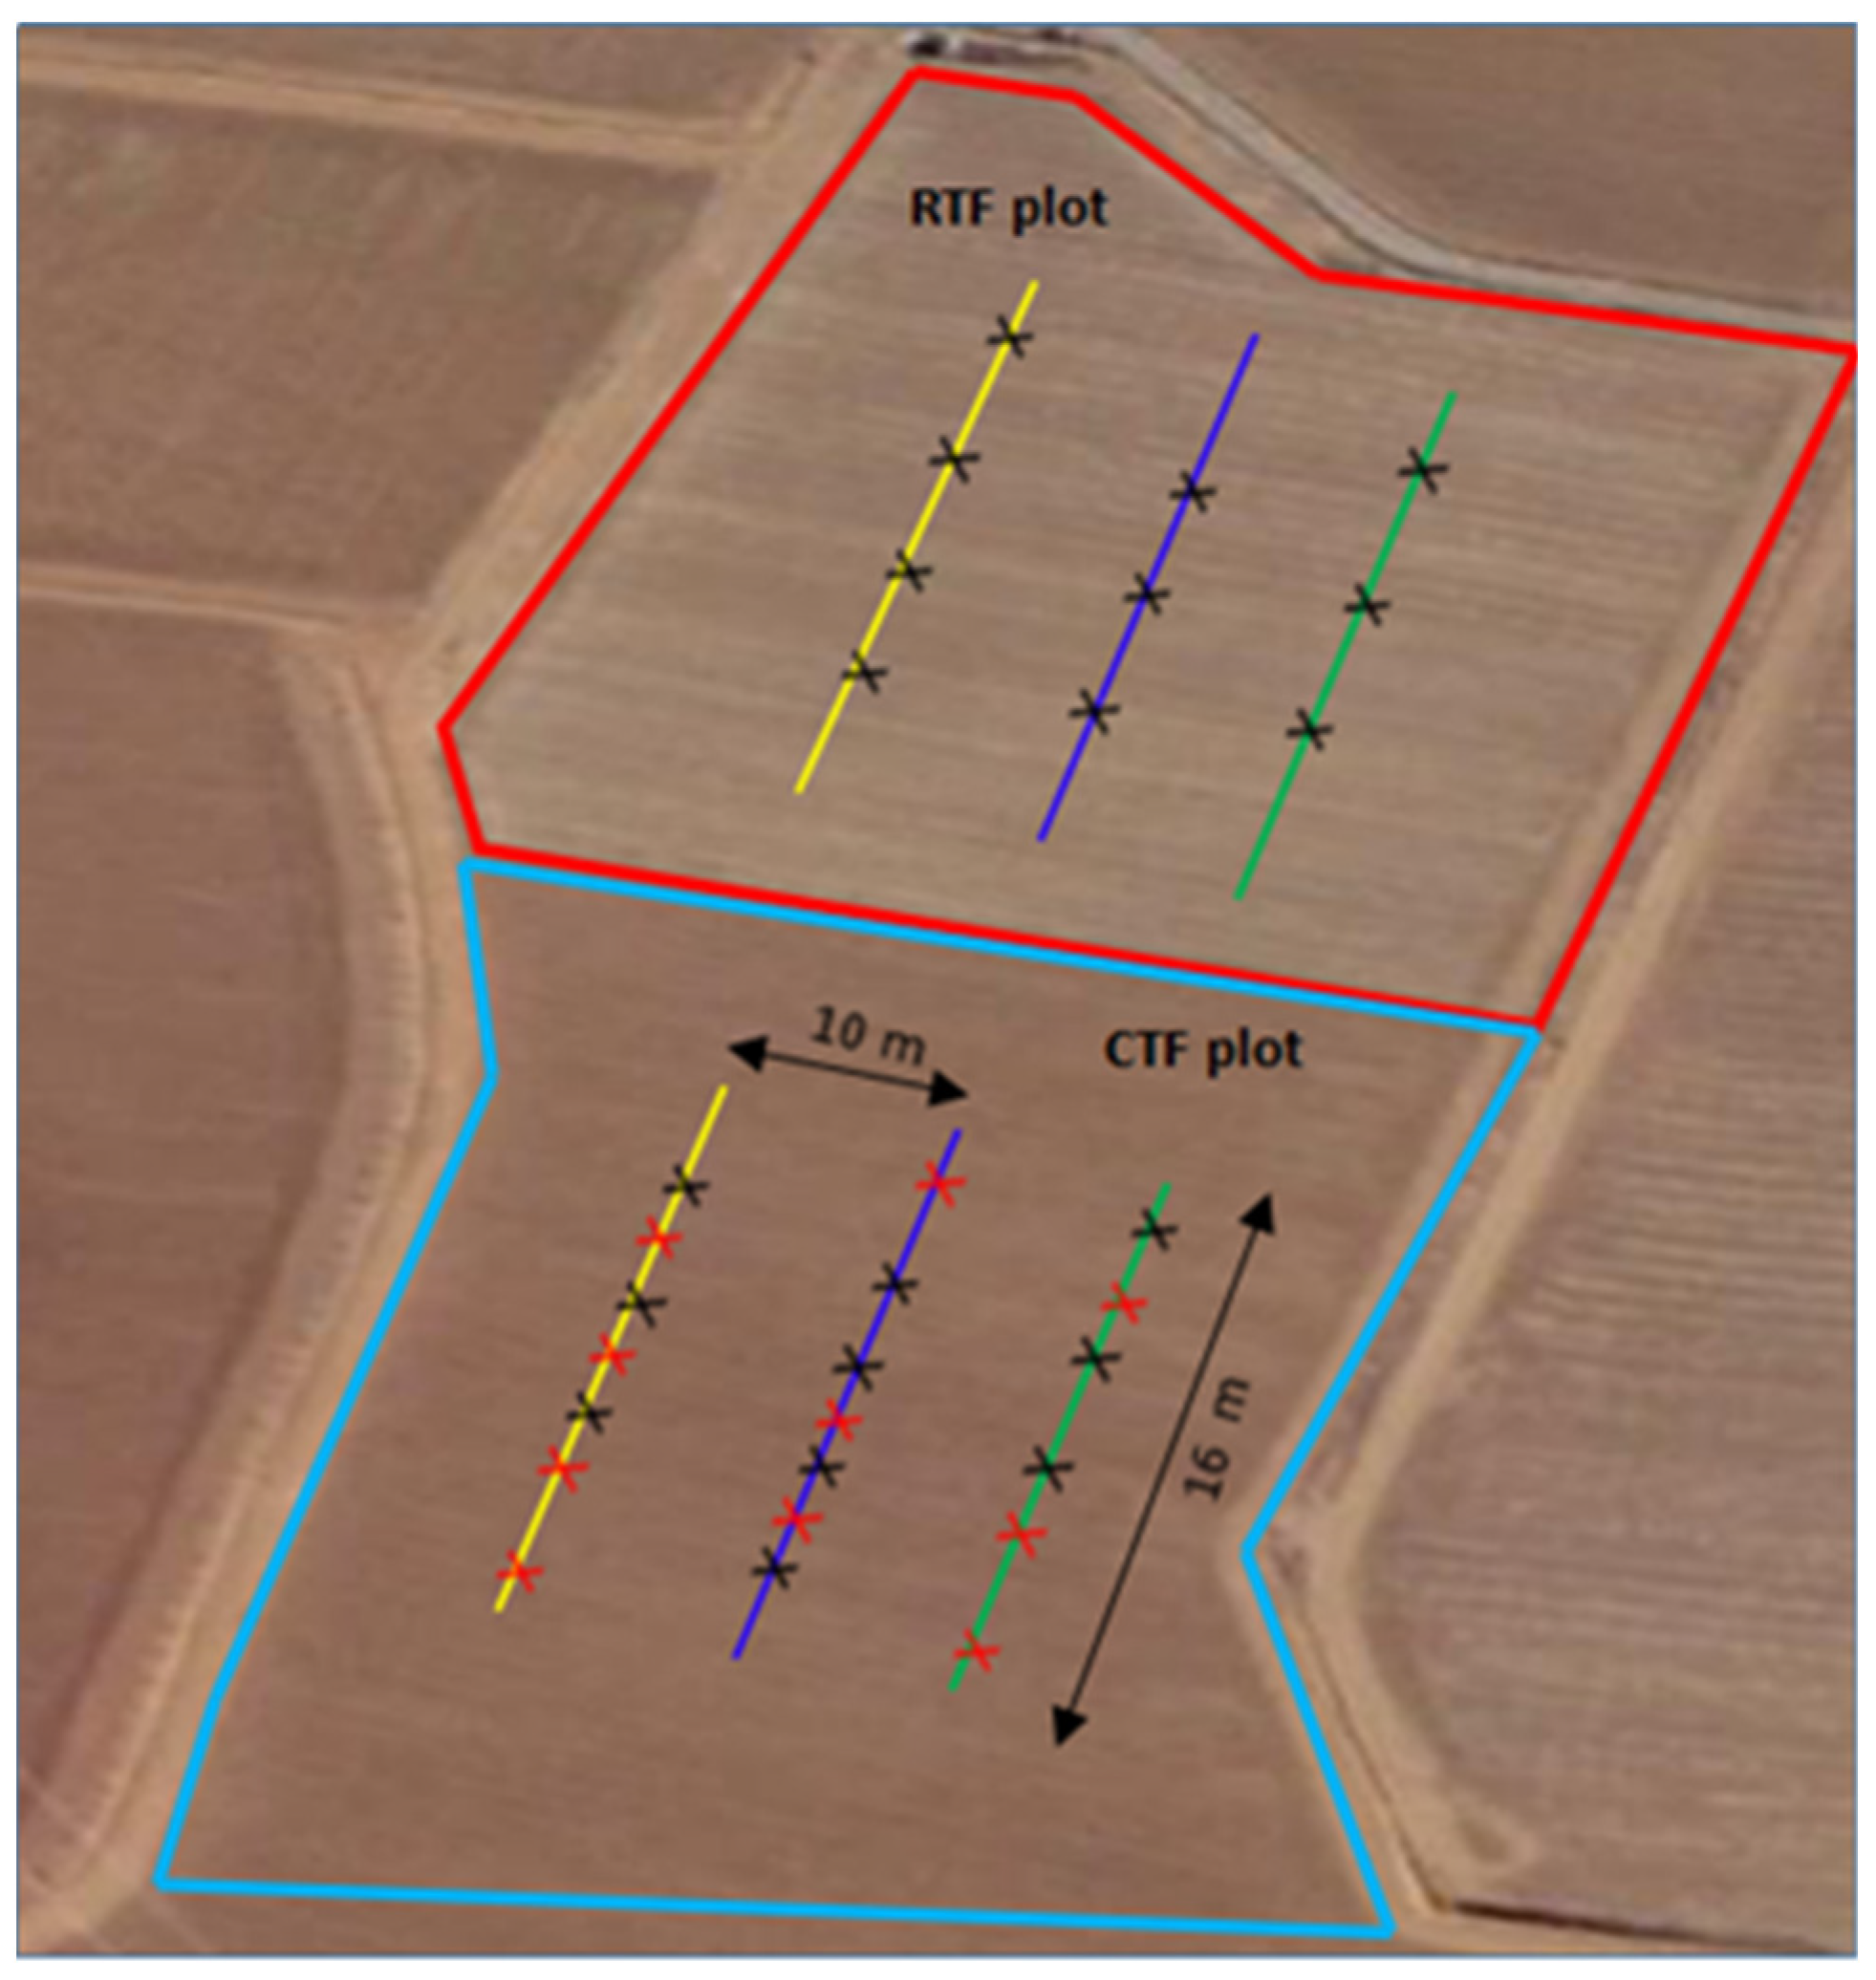
2.1. Study Area

This study was conducted in two commercial-scale vegetable plots in Pukekohe, New Zealand (37.3187° S, 174.9985° E). The soil is characterised as volcanic ash with dark reddish-brown clay-loam texture and slightly acidic to neutral soil pH. An area of 4 ha was managed under a CTF system, while an adjacent 4 ha plot was operated under an RTF system. The CTF plot comprised 130 established beds of a 1.72 m basic module width and 260 intermediate tramlines having a 0.24 m width (wheel tracks in between the beds). Tramline spacing typically occurred at approximately 1.72 m with a wheel gauge width of 1.72 m as the basic module. The distance between two permanent tramlines (spray line) at the plot was 15.5 m, which corresponds to 9 times the basic module width of 1.72 m (Figure 1). CTF techniques have been practised at this plot for a period of 10 years. All machineries used for tillage were run on defined traffic lanes (tramlines with reduced tillage on the CTF plot). The RTF plot was conventionally managed without designated wheel tracks or structured traffic paths, allowing unrestricted machinery movement across the field. The crops cultivated at the experimental site during the four years preceding the study included potatoes, oats, carrots, and grass.

2.2. Soil Core Sampling

Both the CTF and RTF fields were situated on sloped terrain. To account for topographical variation, each field was divided into three transects, namely upper, middle, and lower, spanning a horizontal distance of 16 m across the field. These transects included both crop beds and tramlines in the CTF system, whereas the RTF field was managed without defined beds or tramlines. The lower transect was established at the bottom of the field, the upper transect was located at the top, and the middle transect was positioned equidistantly between the two. The horizontal distance between adjacent transects was 10 m. Soil core samples were collected along each transect in both fields (Figure 2).
Random undisturbed soil core samples were collected from CTF beds, CTF tramlines, and RTF plots [23]. Undisturbed soil cores were sampled using plastic cylinders of an internal diameter of 18.7 cm from CTF beds, RTF, and tramlines (TRM) along the upper, middle, and lower transects (Figure 2). Sampling transects are indicated by the solid yellow (lower transect), blue (middle transect), and green (upper transect) lines. Black crosses indicate soil core sampling locations at CTF beds and RTF along the lower, middle, and upper transects. Red crosses indicate soil core sampling locations on tramlines along lower, middle, and upper transects in CTF plots. In total, 30 soil cores (10 cores from each treatment location) were collected at a soil depth of 25 cm from the soil surface. This sampling depth was selected because significant differences in soil compaction were observed up to 25 cm, with minimal or no variation beyond this depth. Undisturbed soil cores were collected using plastic cylinders, driven into the soil to maintain the natural structure, porosity, and layering of the field soil. The cores were then sealed at both ends during transport to prevent moisture loss or disturbance.

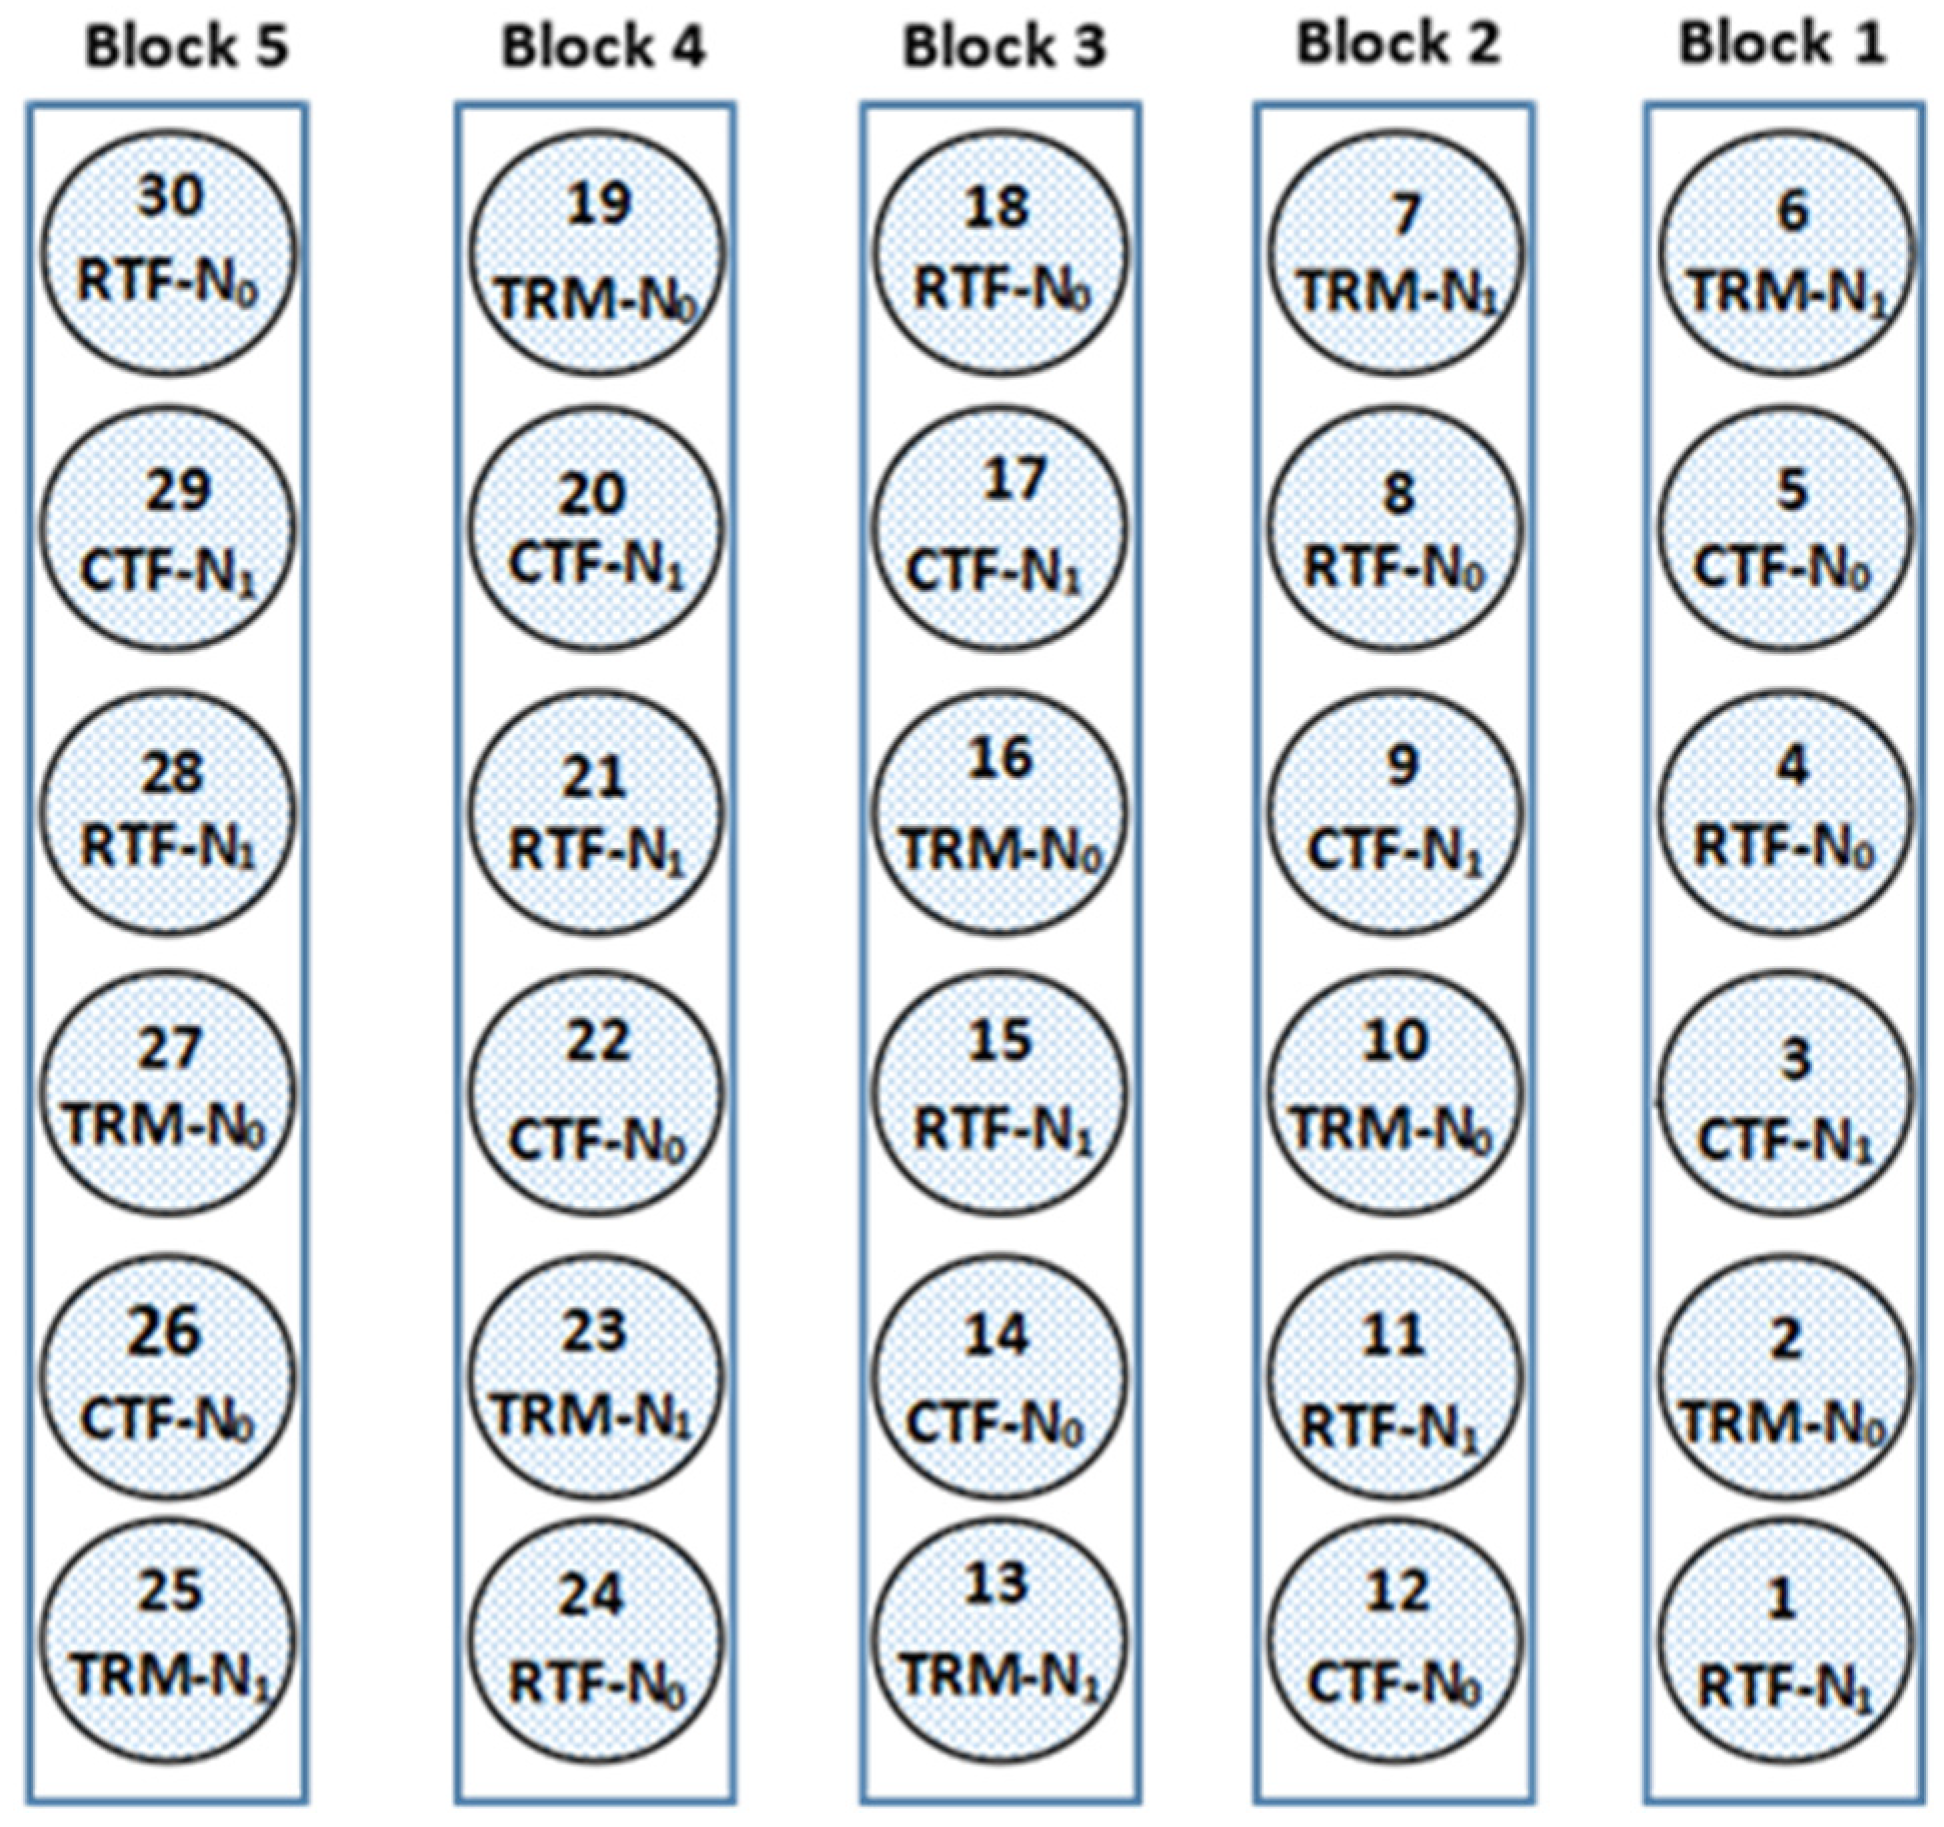
2.3. Soil Core Experiments

Soil core experiments were conducted over a period of 58 days, starting from mid November 2020. The study evaluated relative N2O emissions from three traffic systems of CTF, RTF, and CTF tramlines (TRM) in a vegetable production field in Pukekohe, New Zealand. The experiment included two rates of N application of 0 kg N/ha (unfertilised) and 140 kg N/ha (fertilised), resulting in six treatment combinations (Table 1) with five replicates. Specifically, 0.83 g of urea (46% N) was manually applied to each soil core, corresponding to a field-equivalent application rate of 140 kg N ha−1. The soil cores contained pre-established Tama grass (Lolium multiflorum) at the time of collection, as they were sampled directly from the field with intact vegetation.
The soil cores containing plastic cylinders were transferred to the Dairy No. 1 farm facility of Massey University, Palmerston North, on 16th November 2020 and were subsequently installed at a depth of 10 cm into the soil using a Randomised Complete Block Design (RCBD) as illustrated in Figure 3. The experiment utilised the existing stand of Tama grass that was already growing in the soil cores at the time of collection. The soil cores were installed in the field immediately after sampling. Nitrous oxide emissions from each core were evaluated using emission chambers over a 56-day period following fertiliser application. The soil cores were exposed to ambient environmental conditions, including natural rainfall and dry periods, to simulate field conditions. The cores were sealed only during gas sampling events to maintain airtight conditions for N2O flux measurements. A lid was placed on top of each soil core at the time of sampling to seal off a fixed volume of air in the headspace volume.

2.4. Gas (N2O) Sample Collection and Analysis
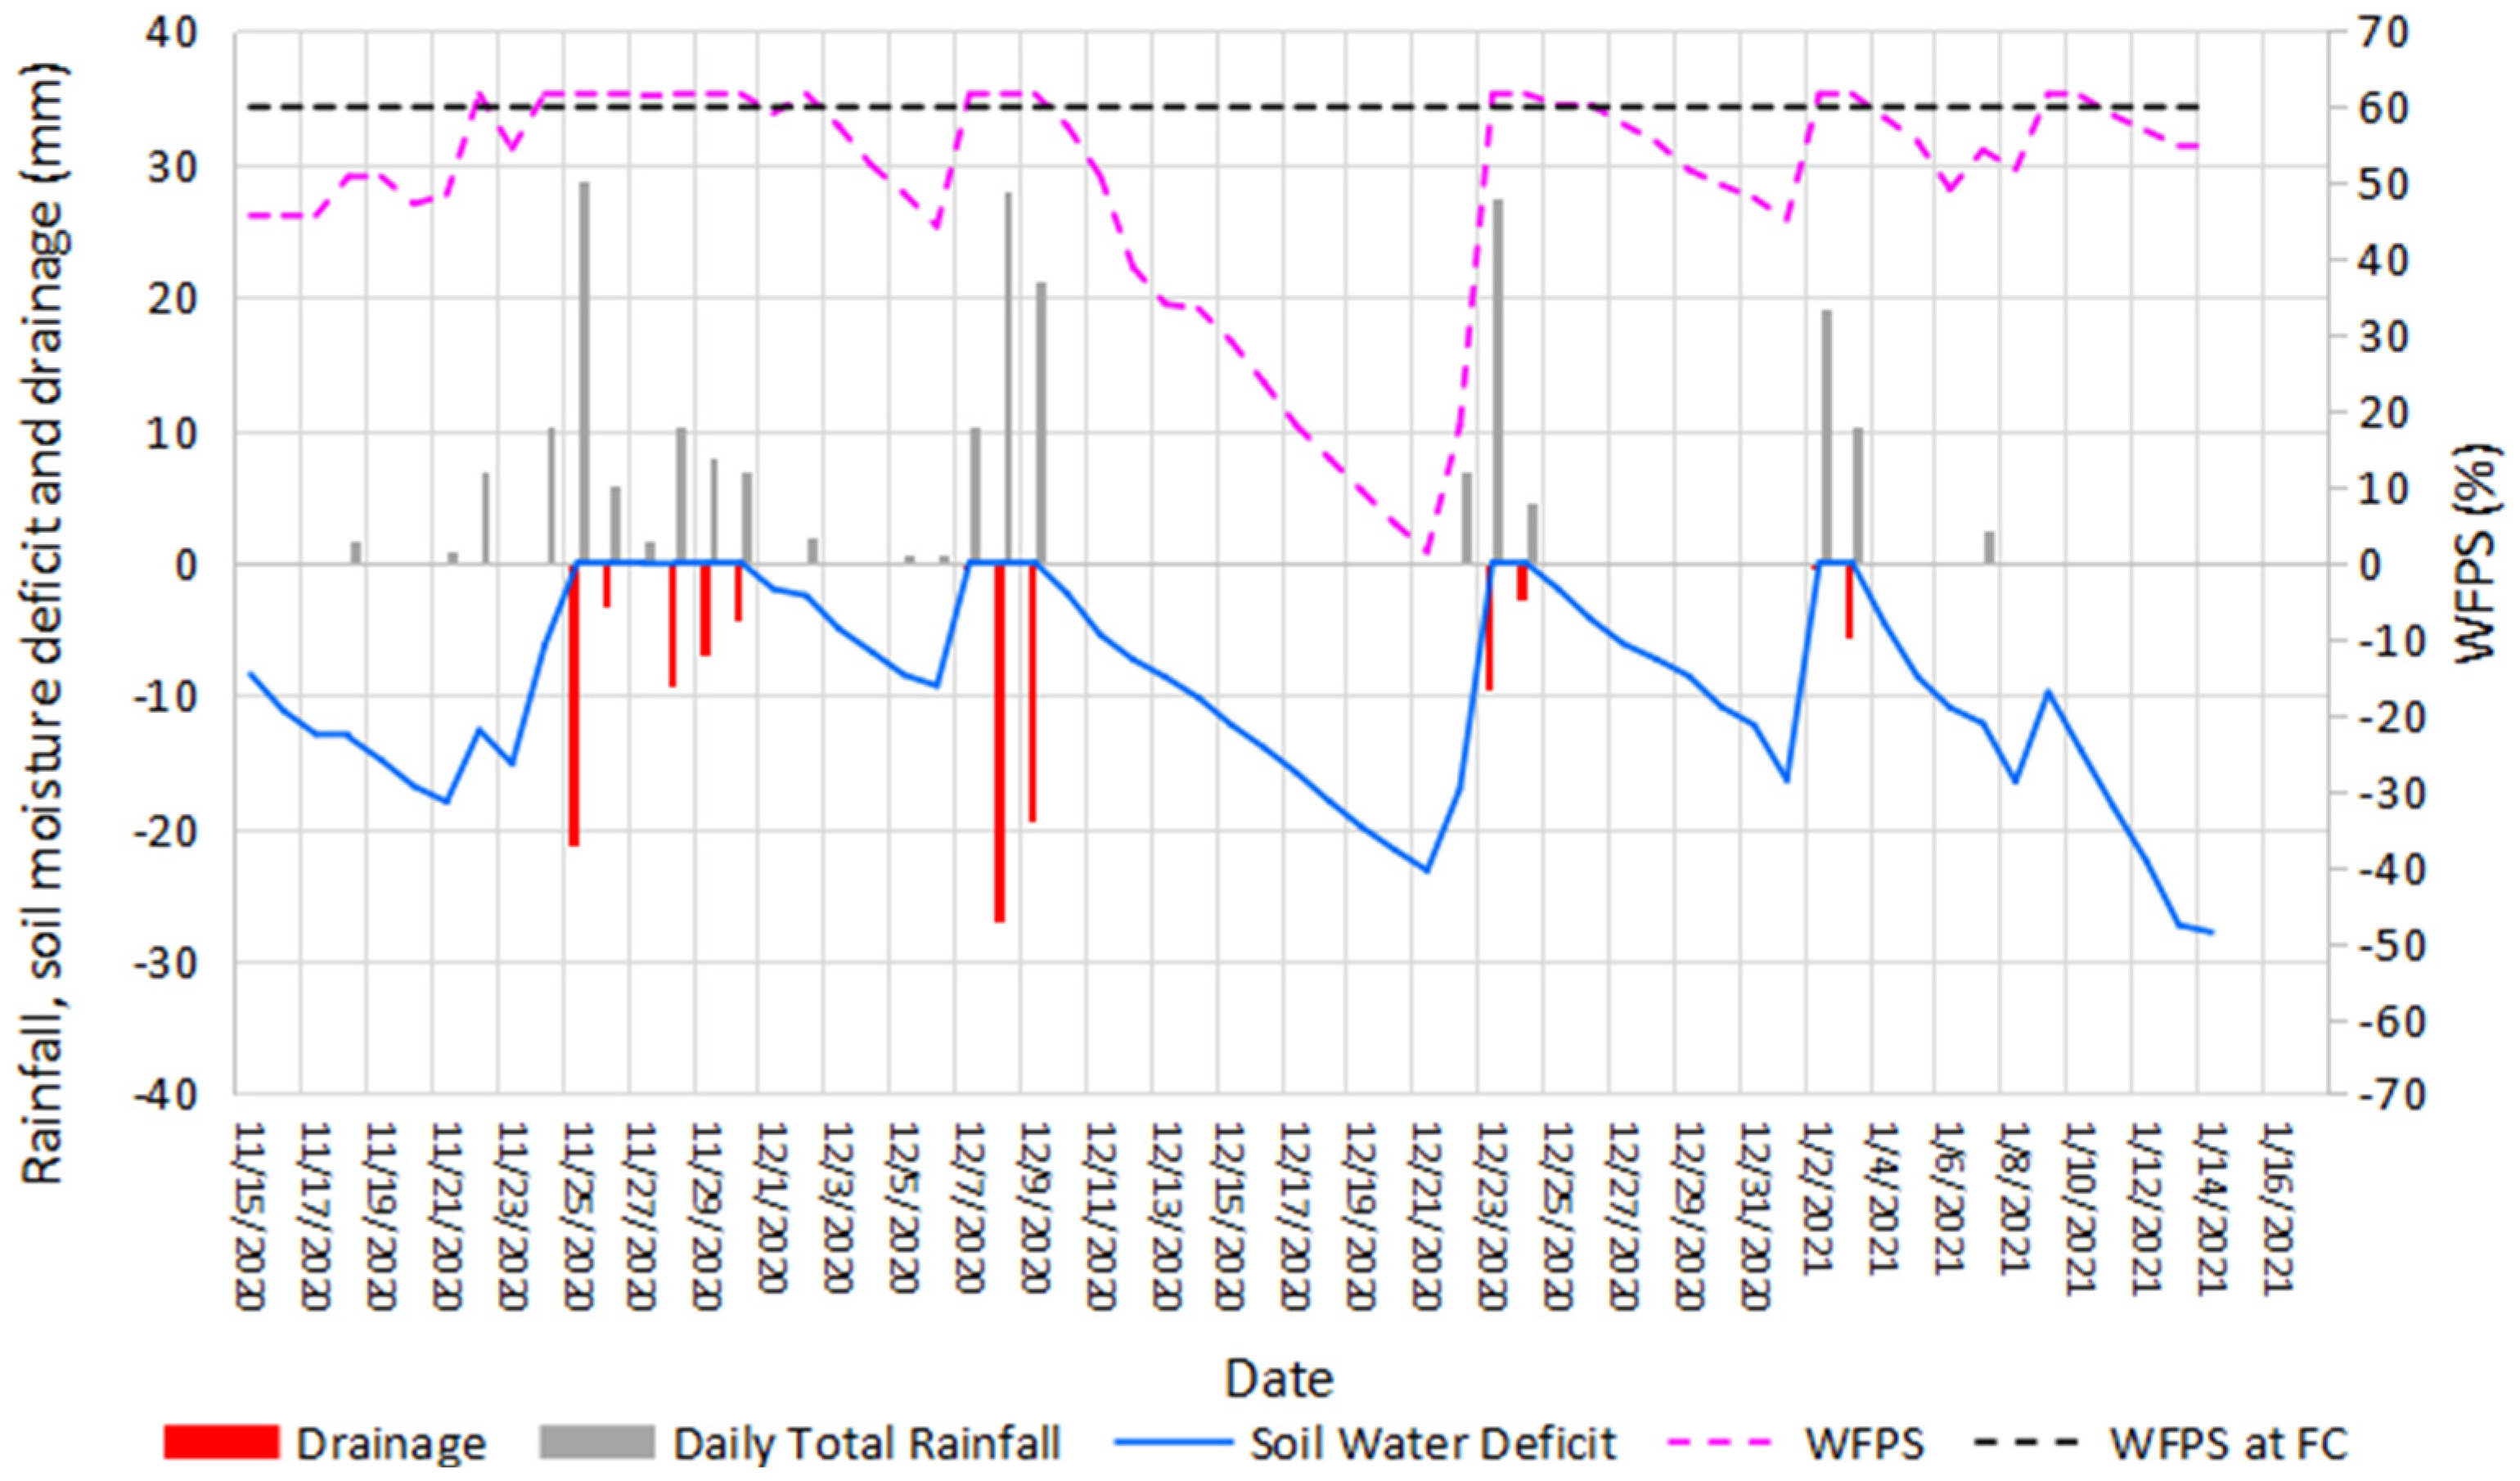
Gas samples were collected twice weekly for one month following fertiliser application, and then weekly for an additional four weeks, during which N2O fluxes had returned to background levels. N2O was the sole gas measured in this study, as the primary objective was to identify a management strategy to minimise N fertiliser losses through denitrification. As a key intermediate and indicator of denitrification processes, N2O measurement alone was considered sufficient to address the study’s aim. CO2 and CH4 emissions were not assessed in this study, as they are not directly influenced by N fertiliser application and do not reflect fertiliser-derived N losses.
Sampling was conducted using the static chamber technique. Gas samples were drawn from the airtight headspace, which was equipped with a three-way stop valve, using a 12 mL pre-evacuated syringe. Three consecutive gas samples were collected at a predetermined sampling interval of 45 min (0, 45, and 90 min). The sampling time was restricted between 10 am and 1 pm to avoid large temperature fluctuations during sampling. At each sampling time, the air within the soil cores was aerated by drawing air into the syringe and expelling it twice. Continuous soil temperature measurements were recorded using temperature sensors placed both inside and outside the soil cores, and at a depth of 2 cm below the soil surface. Gas samples were transported to the laboratory and analysed for N2O concentrations using the Shimadzu GC-2010 gas chromatograph. The N2O flux rates were calculated based on the rate of change in N2O concentration within the headspace of the soil cores, which was estimated as the slope of linear regression between N2O concentration and time [24]. Daily flux rates were estimated from the linear increase in headspace gas concentration over time. The N2O flux on a particular day was calculated using the following equation:
F = d c d t × ρ × H
F is the N2O flux (µg N m−2h−1); d c d t is the increment in the headspace in one hour (µL L−1); ρ is the N2O gas density (gm−3); and H is the soil core height (m).
The resulting flux rates were then integrated over the measurement period using the trapezoidal rule to estimate cumulative emissions. The integrated flux was converted to a per-hectare basis and expressed as kg N2O/ha over the defined period.

2.5. Weather Data

Daily rainfall, evapotranspiration, air temperature, RH, wind speed, and mean daily air temperature for the entire experimental period were obtained from the NIWA data base [25]. Water-filled pore space (WFPS) for the entire period was simulated using the NIWA water balance model [25] with the initial and final moisture content measured from the soil cores at the beginning and end of the experiment.

2.6. Grass Harvesting and Analysis for N Uptake

Grass was harvested three times during the experiment, with the 1st cut being made 14 days after planting grass. The 2nd and 3rd cuts were made 20 and 41 days after the 1st cut, respectively. The total N uptake by the plants was determined by digesting 0.1 g of sub-sample from each treatment using the micro-Kjeldahl digestion method. The total N concentration was then analysed using a Technicon Autoanalyser, Series 2 [26]. The total N uptake of the plants was estimated as the product of dry matter yield and plant N concentration (%).

2.7. Soil Analysis

At the end of the 56-day experiment, bulk density and total residual N content of all soil cores were determined at 10 cm depth. Total residual inorganic N content was determined by extracting soil samples with 2 M KCl. The soil samples were passed through a 2 mm sieve and homogenised. About 3 g of moist soil was weighed into screw-capped centrifuge bottles and added to 30 mL of 2 M KCl. Sub-samples of the soil were oven-dried at 105 °C to determine the moisture factor. The centrifuged bottles were shaken on an end-over-end shaker for one hour and then centrifuged at 1118× g for 10 min, and the supernatant was filtered through No. 42 Whatman filter paper. The NO3–N and NH4+–N concentrations were analysed using a Technicon Autoanalyser [27].
N i n o r g a n i c = C × V W
where N is the total inorganic N content (mg/kg dry soil); C is the N concentration of soil extract (mg/L); V is the volume of solution (KCl + soil moisture) (L); and W is the mass of oven-dried soil (kg).
The amount of inorganic N accumulation (N min, kg N/ha) was calculated by
N m i n = T × ρ b × N i n o r g a n i c 10
where T is the soil thickness (cm); ρ b is the soil bulk density (g/cm3); and N inorganic is the soil inorganic N content, which is defined as the sum of NH4+–N and NO3–N (mg/kg).

2.8. Statistical Analysis

The Anderson–Darling test for normality was conducted using Minitab 19.1.1, and the data did not meet the assumption of normality (p < 0.05). Therefore, N2O flux data were log10-transformed before performing further analyses. Two-way ANOVA with the PROC GLM procedure was used to test the main effects of traffic systems and fertiliser as well as their interaction effects on N2O flux and grass yield using SAS version 9.4 [28]. A post hoc Tukey’s test was performed to compare the treatment means at p < 0.05.

3. Results

3.1. Climate

A total of 22 precipitation events occurred during the sampling period. Rainfall started the day after urea application and continued for a week, followed by a drought period lasting for 12 days. Soil temperature fluctuated from 17.5 to 27.8 °C and averaged 20.8 °C during the experimental period. The simulated WFPS values derived from the NIWA water balance model ranged from 45.7% to 61.7% across all treatments, with an average of 48.9%. During the periods from 16th to 23rd November and 11th to 22nd December 2020, the WFPS values were below the critical threshold of 60% which is considered optimal for denitrification and elevated N2O emissions (Figure 4).
In the present study, no significant differences in N2O emissions were observed between CTF and RTF systems. Post-experimental soil core analysis revealed no significant effect of traffic systems on soil bulk density. Consequently, the resulting soil porosities and moisture levels across CTF and RTF treatments were statistically not significant (Table 2).

3.2. Initial and Final Soil Inorganic N Content

Both gravimetric soil moisture contents and the total residual N contents across all the soil cores were statistically similar at the beginning of the experiment. The total soil N (NO3 + NH4+) at the beginning of the experiment was less than 7 kg N/ha within the 0–25 cm depth across all soil cores. The soil residual N content in the upper 10 cm of the soil for the corresponding 8-week post-fertilisation period shows that the inorganic N content in the fertilised treatments was significantly higher (p < 0.05) compared to the unfertilised treatments (Table 3). Soil inorganic N was recorded in the range between 34 and 56 kg N/ha at the depth of 10 cm in the fertilised soil cores, while it remained below 2 kg N/ha in all the unfertilised soil cores from different traffic systems. In both fertilised and unfertilised soil cores, the inorganic N content exhibited no significant variation across the traffic systems (Table 3).

3.3. Traffic System–Fertiliser Nitrous Oxide Emission Profile

The N2O fluxes obtained from all the cores before urea application denote that the background N2O fluxes were ranging from 4.86 to 10.3 g N2O–N ha/day. Nitrous oxide fluxes showed an increase only from RTF-N1 with emissions of 36.6 g N2O–N/ha/day within two days of urea application. All the treatments showed two major distinct N2O–N peaks at 14 and 24 days following urea application, where the emissions from RTF-N1 were the highest, with 210.1 and 594.2 g N2O–N/ha/day, respectively. Nitrous oxide fluxes from all treatments returned to background levels 24 days after urea application and remained low for the rest of the experiment (Figure 5).
The first notable peak in N2O emissions occurred 14 days post-fertilisation, following two rainfall events of 28.8 mm and 5.8 mm on 25th and 26th November, respectively. These precipitation events raised the WFPS to 61.7%, with values remaining elevated until 30th November (Figure 4). On the 14th day, WFPS was recorded at 59.2%, which is close to the threshold above which denitrification becomes a dominant process. A second emission peak was detected 24 days after fertilisation (11th December), which was more pronounced in fertilised cores (Figure 5). At this point, WFPS had declined to 50.9%, which was lower than the 60% threshold (Figure 4).
The integrated N2O emission profile revealed that the fertilised CTF system (CTF-N1) did not significantly increase emissions compared to its unfertilised counterpart (CTF-N0). Daily N2O emission was significantly higher (p < 0.05) in fertilised RTF (RTF-N1) two days after urea application relative to all other treatments (Table 4). Fertilised CTF (CTF-N1) treatments showed significant differences (p < 0.05) from their unfertilised counterparts except at 24 and 41 days after urea application. However, RTF-N1 showed significantly higher (p < 0.05) emissions than its unfertilised counterpart at 2, 17, 24, and 41 days after urea application. The TRM-N1 treatment showed significantly higher emission only at 41 days after urea application. Mean integrated emissions of 5.4 kg N2O/ha were recorded from RTF-N1, which was significantly higher by 253% (p < 0.05) than the emissions from RTF-N0 (Table 4). The integrated N2O flux over the experimental period reveals that the traffic systems did not show any impact on N2O emissions. However, the CTF-N1 treatment resulted in a 31.6% reduction in emissions compared to the RTF-N1 treatment.

3.4. Grass N Uptake

Grass N uptake was significantly affected by both N application (p < 0.00001) and traffic treatments (p < 0.01) at the time of 2nd grass cut, but neither the traffic nor fertiliser affected at the 1st cut. Nitrogen uptake was affected by fertiliser treatment not by traffic at the time of 3rd cut. Overall, total N uptake across treatments was significantly higher (p < 0.05) for all the fertilised traffic treatments compared to the unfertilised counterparts (Table 5). However, the N uptake from CTF and RTF were not statistically significant regardless of N fertiliser application. The N uptake from TRM-N1 was not different from that of CTF-N1 and RTF-N1 but the N uptake from TRM-N0 was significantly lower (p < 0.05) from CTF-N0 treatment.

4. Discussion

4.1. Effect of Traffic System on N2O Fluxes

Soil aeration, governed by bulk density and water content, plays a pivotal role in N2O emissions, with higher bulk density typically reducing oxygen diffusion and potentially promoting denitrification-driven emissions [29,30]. The absence of statistically significant differences in bulk density and porosity across traffic treatments (CTF, RTF, TRM) suggests that the imposed traffic regimes did not substantially alter soil compaction. The narrow range of bulk density values (0.76 to 0.87 g cm−3), with porosity remaining above 0.66 across all treatments, is generally considered sufficient to maintain aerobic conditions and limit denitrification-driven N2O emissions [31]. These findings are consistent with previous research indicating that moderate variations in bulk density do not necessarily lead to elevated N2O fluxes unless relative gas diffusivity approaches a critical threshold (~0.006) [32].
The similarity in porosity between CTF and RTF treatments further supports the notion that traffic-induced compaction effects may be buffered under certain soil conditions, suggesting that traffic intensity is insufficient to induce measurable changes in the soil [33]. Furthermore, certain soils exhibit natural resilience to compaction, which can also maintain uniform physical properties even under mechanical stress [34]. This inherent resilience may have contributed to the stability of the soil structure and gas exchange pathways in the soil cores, further explaining the lack of a treatment effect on N2O emissions.
The 31.6% reduction in N2O emissions from the fertilised CTF (CTFF-1) treatment is consistent with previous findings from organic vegetable farming in the Netherlands, where CTF was shown to reduce N2O emissions by 20–50% [19]. The reduction was attributed to the seasonal control of wheel traffic, which preserved soil structure and minimised compaction in trafficked zones, thereby enhancing aeration and reducing conditions favourable for denitrification. The reduced emission reduction in our CTF system can similarly be attributed to better preservation of soil structure and reduced subsurface compaction in CTF, which enhances gas diffusivity and oxygen availability [35]. However, these improvements were not sufficient in soil cores to produce statistically significant differences in N2O emissions.
The elevated cumulative N2O emissions observed under the RTF treatment (5.4 kg N2O ha−1) appear to be primarily driven by the application of urea fertiliser. This finding demonstrates that increases in N2O fluxes are significantly amplified only when N fertiliser is present, suggesting that soil compaction alone exerts minimal influence on N2O emissions unless accompanied by enhanced N availability [36,37,38]. Mechanistically, this enhancement may be attributed to the synergy between reduced gas diffusivity under increased substrate availability for microbial nitrification and denitrification processes following fertiliser application [39,40]. Particularly in trafficked field systems, the temporal proximity of N input appears critical, with peak N2O emissions typically occurring within days of urea application due to rapid hydrolysis and subsequent nitrate formation [41].

4.2. Effect of WFPS on N2O Fluxes

The observed consistency in water-filled pore space (WFPS) across traffic treatments indicates that vehicular compaction had a limited effect on soil moisture dynamics during the study period. This suggests that traffic-induced changes in soil structure did not substantially alter the soil’s water retention capacity. The sub-threshold WFPS levels observed during the periods from 16th to 23rd November and 11th to 22nd December 2020 imply that denitrification was likely constrained, and N2O emissions were predominantly driven by nitrification pathways. This aligns with findings that N2O production via denitrification becomes dominant only when WFPS exceeds 60–70%, depending on soil type and microbial community structure [42]. Similarly, previous studies reported that peak N2O fluxes typically occur when WFPS surpasses 65%, reinforcing the moisture sensitivity of denitrification-driven emissions [42,43,44].
The temporal pattern of N2O emissions observed in this study closely reflected the combined effects of soil N availability and moisture dynamics. No substantial increase in N2O emissions was observed until six days after urea application (Figure 5). This delay was expected in the unfertilised treatments, where emissions were likely constrained by low residual soil N levels (Table 2). In the fertilised cores, however, the initially delayed emissions may be attributed to the dry spell that occurred between 16th and 23rd November 2020, resulting in a soil water deficit of 11.1 to 15.2 mm (Figure 4 and Figure 5). This finding aligns with the fact that fertiliser applications during dry weather often result in negligible N2O losses due to insufficient moisture for microbial activity and gas production [45,46].
The first notable peak occurred 14 days post-fertilisation, coinciding with two rainfall events (28.8 mm and 5.8 mm on 25th and 26th November, respectively), which elevated the WFPS to 61.7%. Although WFPS on the 14th day was recorded at 59.2%, slightly below the commonly cited denitrification threshold of 60%, the sustained wet conditions likely facilitated the formation of anaerobic microsites, thereby promoting denitrification-driven N2O emissions [42,44]. At the second emission peak, detected 24 days after fertilisation, the WFPS had declined to 50.9%, which is a level considered sub-optimal for denitrification but conducive to nitrification processes. Under these moderately aerobic conditions, N2O emissions were likely driven by autotrophic nitrification pathways [47,48,49]. Previous studies have shown that nitrification is a significant source of N2O when WFPS ranges between 35% and 60%, with peak emissions often occurring near 50–55% WFPS due to optimal oxygen availability [47,48]. This alternation between wet and dry soil conditions during the experimental period, as reflected by WFPS fluctuations, likely triggered shifts in microbial pathways responsible for N2O production.

4.3. Effect of N Fertiliser on N2O Fluxes

The integrated N2O emission profiles in this study demonstrate a potential buffering effect of these traffic-managed configurations on soil denitrification processes. These findings are partially consistent with previous work in winter wheat systems, where fertiliser applied at 80 kg N ha−1 did not result in significantly higher N2O emissions from RTF zones compared to tramlines [20]. Such results underscore the importance of strategic fertiliser placement within traffic-managed systems as a means to suppress emission hotspots and enhance N use efficiency.
Absence of elevated emissions from fertilised TRM treatments suggests that the interactions among N inputs, soil moisture, crop uptake, and N dynamics collectively influence the soil microbial processes responsible for N2O generation [50]. Although CTF-N1 in our study did not show a statistically significant reduction in emissions compared to fertilised RTF, it resulted in a 31.6% reduction in cumulative N2O emissions. This reduction is comparable to the 22.4% and 42.7% emission reductions previously reported for CTF systems with varying traffic intensities (12% and 100% wheeled area, respectively) when compared to RTF systems with a 50% and 100% wheeled area [18]. Given that our CTF system had 13% traffic lanes with 100% wheel coverage, the 31.6% emission reduction indicates a notable improvement in soil physical conditions under CTF and reflects effective mitigation potential.
When benchmarked against data from New Zealand, where N2O emissions under ryegrass pasture range between 0.45 and 3.74 kg N2O ha−1 [51], the emissions from our CTF and TRM treatments fell within a similar range (Table 6). However, the fertilised RTF treatment (RTF-N1) showed significantly higher emissions of 5.4 kg N2O ha−1, exceeding the upper threshold of pasture-based emissions by 46% and indicating a 253% increase compared to its unfertilised counterpart (RTF-N0), which emitted 1.53 kg N2O ha−1 (Table 4). These elevated emissions highlight the potential risks associated with fertilised RTF systems.
The lack of a significant increase in N2O emissions following fertiliser application under the CTF system suggests that it may help maintain favourable soil physical conditions that limit denitrification potential. The absence of compaction-related increases in bulk density likely preserved soil aeration, thereby reducing the formation of anaerobic microsites responsible for N2O production. These findings support the possibility that CTF systems help moderate N2O emissions, although the extent of their effectiveness may depend on environmental factors. However, it is too early to evaluate the function of CTF in N2O mitigation as this study was based on a single-season soil core experiment. Long-term, multi-season field studies are needed to validate these findings.

4.4. Nitrogen Uptake and N2O Emissions

The lack of significant grass cover at the beginning of the study, along with the low N uptake of 4.2 kg N/ha within two days after urea application, indicates that plant N uptake had a minimal impact on N2O emissions during the initial phase. In this context, the significantly higher N2O emissions of 26.3 g N2O–N/ha/day from RTF-N1 underscore the role of the RTF system in amplifying N2O emissions when fertilised (Table 4). Despite the increasing N uptake by growing vegetation, our study found no consistent inverse relationship between N uptake and N2O emissions across treatments. As vegetation gradually established over the subsequent days, increased plant N uptake may have masked the effects of traffic-induced soil physical changes on N2O emissions. This trend aligns with findings from previous studies, which emphasise that plant N uptake is a key determinant of soil N availability and subsequent gaseous losses in temperate agricultural systems [53]. Moreover, variations in vegetation cover and growth dynamics can significantly influence both the magnitude and temporal variability of N2O emissions [54]. These findings suggest that the increasing influence of vegetation through N uptake and canopy development became more prominent as the study progressed.

5. Conclusions

N2O emissions were mainly driven by fertiliser application, with traffic treatment having no significant effect. Although cumulative emissions did not differ significantly between CTF and RTF systems, the fertilised CTF treatment resulted in a 31.6% reduction compared to fertilised RTF, which recorded the highest emission level of 5.4 kg N2O ha−1, underscoring the emission risks associated with nitrogen fertiliser use. These findings are indicative, as field-based experiments in Pukekohe could not be conducted due to travel restrictions imposed during the coronavirus pandemic, and this study was therefore carried out as a pot experiment. Under the given soil and environmental conditions, traffic-induced changes in bulk density and moisture appeared minimal, suggesting that the soils may possess a degree of structural resilience that limits compaction-related impacts on N2O emissions. The soil core experimental setup may have limited the representation of complex field interactions. Therefore in situ studies are needed to comprehensively assess the impact of CTF on N2O emissions.

Author Contributions

B.R.: Investigation, data collection and analysis, and writing—original draft. M.G.: Supervision, methodology, writing—review and editing, and project administration. P.J.: Supervision, methodology, and writing—review and editing. P.B.: Supervision, conceptualisation, methodology, and technical support. C.D.: Supervision and gas sample analysis arrangements. All authors have read and agreed to the published version of the manuscript.

Funding

The authors sincerely acknowledge the financial support provided by Massey University’s Research Fund (MURF) for this study.

Data Availability Statement

The data presented in this study are available on request from the corresponding author.

Acknowledgments

The authors acknowledge the School of Advanced Technology, Massey University, for granting access to gas chromatography facilities.

Conflicts of Interest

The authors declare no conflicts of interest.

Abbreviations

The following abbreviations are used in this manuscript:
CTFControlled Traffic Farming
RTFRandom Traffic Farming
WFPSWater-Filled Pore Space
N2ONitrous Oxide
NNitrogen

References

  1. Statistics New Zealand. Land and Soil—Estimated Long—Term Soil Erosion. 2016. Available online: https://www.stats.govt.nz/topics/land/ (accessed on 19 April 2020).
  2. HortNZ. Annual Report 2020/21. Horticulture New Zealand. 2021. Available online: https://www.hortnz.co.nz (accessed on 15 August 2022).
  3. Ministry for Primary Industries (MPI). Fit for a Better World—Accelerating Our Economic Potential. New Zealand Government. 2020. Available online: https://www.mpi.govt.nz (accessed on 15 August 2022).
  4. Hu, W.; Drewry, J.; Beare, M.; Eger, A.; Müller, K. Compaction induced soil structural degradation affects productivity and environmental outcomes: A review and New Zealand case study. Geoderma 2021, 395, 115035. [Google Scholar] [CrossRef]
  5. Soane, B.D.; van Ouwerkerk, C. Implications of soil compaction in crop production for the quality of the environment. Soil Tillage Res. 1995, 35, 5–22. [Google Scholar] [CrossRef]
  6. Yamulki, S.; Jarvis, S.C. Short-term effects of tillage and compaction on nitrous oxide, nitric oxide, nitrogen dioxide, methane and carbon dioxide fluxes from grassland. Biol. Fertil. Soils 2002, 36, 224–231. [Google Scholar] [CrossRef]
  7. Saggar, S.; Tate, K.; Giltrap, D.; Singh, J. Soil-atmosphere exchange of nitrous oxide and methane in New Zealand terrestrial ecosystems and their mitigation options: A review. Plant Soil 2008, 309, 25–42. [Google Scholar] [CrossRef]
  8. Wuebbles, D.J. Nitrous oxide: No laughing matter. Science 2009, 326, 56–57. [Google Scholar] [CrossRef]
  9. Wu, X.; Du, J.; Gao, Y.; Wang, H.; Zhang, C.; Zhang, R.; He, H.; Lu, G.; Wu, Z. Progress and challenges in nitrous oxide decomposition and valorization. Chem. Soc. Rev. 2024, 53, 8379–8423. [Google Scholar] [CrossRef]
  10. Sitaula, B.K.; Hansen, S.; Sitaula, J.I.B.; Bakken, L.R. Effects of soil compaction on N2O emission in agricultural soil. Chemosphere—Glob. Change Sci. 2000, 2, 367–371. [Google Scholar] [CrossRef]
  11. Pulido-Moncada, M.; Petersen, S.O.; Munkholm, L.J. Soil compaction raises nitrous oxide emissions in managed agroecosystems: A review. Agron. Sustain. Dev. 2022, 42, 38. [Google Scholar] [CrossRef]
  12. Thomas, S.; Barlow, H.; Francis, G.; Hedderley, D. Emission of nitrous oxide from fertilised potatoes. In Proceedings of the SuperSoil 2004: The 3rd Australia New Zealand Soils Conference, Sydney, Australia, 5–9 December 2004. [Google Scholar]
  13. Bochtis, D.D.; Vougioukas, S.G. Minimising the non-working distance travelled by machines operating in a headland field pattern. Biosyst. Eng. 2008, 101, 1–12. [Google Scholar] [CrossRef]
  14. Raper, R.L. Agricultural traffic impacts on soil. J. Terramech. 2005, 42, 259–280. [Google Scholar] [CrossRef]
  15. Tullberg, J.N.; Yule, D.F.; McGarry, D. Controlled traffic farming—from research to adoption in Australia. Soil Tillage Res. 2007, 97, 272–281. [Google Scholar] [CrossRef]
  16. Li, Y.X.; Tullberg, J.N.; Freebairn, D.M. Wheel traffic and tillage effects on runoff and crop yield. Soil Tillage Res. 2007, 97, 282–292. [Google Scholar] [CrossRef]
  17. Taylor, J.H. Reduction of traffic-induced soil compaction e special issue. Soil Tillage Res. 1992, 24, 301–302. [Google Scholar] [CrossRef]
  18. Tullberg, J.; Antille, D.L.; Bluett, C.; Eberhard, J.; Scheer, C. Controlled traffic farming effects on soil emissions of nitrous oxide and methane. Soil Tillage Res. 2018, 176, 18–25. [Google Scholar] [CrossRef]
  19. Vermeulen, G.; Mosquera, J. Soil, crop and emission responses to seasonal-controlled traffic in organic vegetable farming on loam soil. Soil Tillage Res. 2009, 102, 126–134. [Google Scholar] [CrossRef]
  20. Tullberg, J.; McHugh, A.D.; Khabbaz, B.G.; Scheer, C.; Grace, P. Controlled traffic/permanent bed farming reduces GHG emissions. In Proceedings of the 5th World Congress of Conservation Agriculture 2011: Resilient Food Systems for a Changing World, Canberra, Australia, 14 January 2011; Australian Centre for International Agricultural Research: Canberra, Australia, 2011. [Google Scholar]
  21. Gasso, V.; Oudshoorn, F.W.; Sørensen, C.A.G.; Pedersen, H.H. An environmental life cycle assessment of controlled traffic farming. J. Clean. Prod. 2014, 73, 175–182. [Google Scholar] [CrossRef]
  22. Tullberg, J.N. Developments in mechanization technology: Controlled traffic farming. In Advances in Agricultural Machinery and Technologies; Chen, G., Ed.; Taylor & Francis Group (CRC Press): London, UK, 2018; Chapter 2; pp. 27–47. [Google Scholar]
  23. Knowles, O.; Dawson, A. To grid or not to grid. A review of current soil sampling methods. In Farm Environmental Planning—Science, Policy and Practice; Currie, L.D., Christensen, C.L., Eds.; Massey University: Palmerston North, New Zealand, 2018; Available online: https://www.massey.ac.nz/~flrc/workshops/18/Manuscripts/Paper_Knowles_2018.pdf (accessed on 9 January 2022).
  24. Saggar, S.; Harvey, M.; Singh, J.; Giltrap, D.; Pattey, E.; Bromley, T.; McMillan, A. Chambers, micrometeorological measurements, and the New Zealand Denitrification–Decomposition model for nitrous oxide emission estimates from an irrigated dairy-grazed pasture. J. Integr. Environ. Sci. 2010, 7, 61–70. [Google Scholar] [CrossRef]
  25. NIWA. CliFlo: NIWA’s National Climate Database on the Web, NIWA. 2021. Available online: https://niwa.co.nz/ (accessed on 9 January 2022).
  26. McKenzie, H.; Wallace, H. The Kjeldahl determination of Nitrogen: A critical study of digestion conditions-Temperature, Catalyst, and Oxidizing agent. Aust. J. Chem. 1954, 7, 55–70. [Google Scholar] [CrossRef]
  27. Blakemore, L.; Searle, P.; Daly, B. Methods for Chemical Soil Analysis, New Zealand Soil Bureau Scientific Report 80; Department of Scientific and Industrial Research: Lower Hutt, New Zealand, 1987; pp. 72–103. [CrossRef]
  28. SAS Institute. Statistical Analysis Software for Windows, Version 9.4; SAS Institute: Cary, NC, USA, 2016.
  29. Gregorich, E.G.; Rochette, P.; VandenBygaart, A.J.; Angers, D.A. Greenhouse gas contributions of agricultural soils and potential mitigation practices in Eastern Canada. Soil Tillage Res. 2005, 83, 53–72. [Google Scholar] [CrossRef]
  30. Singurindy, O.; Molodovskaya, M.; Richards, B.K.; Steenhuis, T.S. Nitrous oxide emission at low temperatures from manure-amended soils under corn (Zea mays L.). Agric. Ecosyst. Environ. 2009, 132, 74–81. [Google Scholar] [CrossRef]
  31. Rousset, C.; Clough, T.J.; Grace, P.R.; Rowlings, D.W.; Scheer, C. Soil type, bulk density and drainage effects on relative gas diffusivity and N2O emissions. Soil Res. 2020, 58, 726–736. [Google Scholar] [CrossRef]
  32. Klefoth, R.R.; Clough, T.J.; Oenema, O.; van Groenigen, J.W. Soil bulk density and moisture content influence relative gas diffusivity and the reduction of nitrogen-15 nitrous oxide. Vadose Zone J. 2014, 11, 1–8. [Google Scholar] [CrossRef]
  33. Deepagoda, C.T.K.K.; Clough, T.J.; Thomas, S.M.; Balaine, N.; Elberling, B. Density effects on soil-water characteristics, soil-gas diffusivity, and emissions of N2O and N2 from a re-packed pasture soil. Soil Sci. Soc. Am. J. 2019, 83, 118–125. [Google Scholar] [CrossRef]
  34. Ali, A.; Bennett, J.M.; Roberton, S.; Krwanji, D.; Zhu, Y.; West, D. Selection of a stress-based soil compaction test to determine potential impact of machine wheel loads. Eur. J. Soil Sci. 2024, 75, e13501. [Google Scholar] [CrossRef]
  35. Ball, B.C.; Campbell, D.J.; Douglas, J.T.; Henshall, J.K.; O’sullivan, M.F. Soil structural quality, compaction and land management. Eur. J. Soil Sci. 1997, 48, 593–601. [Google Scholar] [CrossRef]
  36. Schmeer, M.; Loges, R.; Dittert, K.; Senbayram, M.; Horn, R.; Taube, F. Legume-based forage production systems reduce nitrous oxide emissions. Soil Tillage Res. 2014, 143, 17–25. [Google Scholar] [CrossRef]
  37. Ball, B.C.; Scott, A.; Parker, J.P. Field N2O, CO2 and CH4 fluxes in relation to tillage, compaction and soil quality in Scotland. Soil Tillage Res. 1999, 53, 29–39. [Google Scholar] [CrossRef]
  38. van der Weerden, T.J.; Kelliher, F.M.; de Klein, C.A.M. Influence of pore size distribution and soil water content on nitrous oxide emissions. Soil Res. 2012, 50, 125–135. [Google Scholar] [CrossRef]
  39. Smith, K.A.; Ball, T.; Conen, F.; Dobbie, K.E.; Massheder, J.; Rey, A. Exchange of greenhouse gases between soil and atmosphere: Interactions of soil physical factors and biological processes. Eur. J. Soil Sci. 2003, 69, 10–20. [Google Scholar] [CrossRef]
  40. Flechard, C.; Ambus, P.; Skiba, U.; Rees, R.; Hensen, A.; van Amstel, A.; Dasselaar, A.v.D.P.-V.; Soussana, J.-F.; Jones, M.; Clifton-Brown, J.; et al. Effects of climate and management intensity on nitrous oxide emissions in grassland systems across Europe. Agric. Ecosyst. Environ. 2007, 121, 135–152. [Google Scholar] [CrossRef]
  41. Butterbach-Bahl, K.; Baggs, E.M.; Dannenmann, M.; Kiese, R.; Zechmeister-Boltenstern, S. Nitrous oxide emissions from soils: How well do we understand the processes and their controls? Philos. Trans. R. Soc. B 2013, 368, 20130122–20130197. [Google Scholar] [CrossRef]
  42. Bateman, E.; Baggs, E. Contributions of nitrification and denitrification to N2O emissions from soils at different water-filled pore space. Biol. Fertil. Soils 2005, 41, 379–388. [Google Scholar] [CrossRef]
  43. Congreves, K.A.; Phan, T.; Farrell, R.E. Using 15N2O isotopomers to understand the relationship between soil moisture and N2O production pathways. Soil 2019, 5, 265–274. [Google Scholar] [CrossRef]
  44. Wang, H.; Yan, Z.; Ju, X.; Song, X.; Zhang, J.; Li, S.; Zhu-Barker, X. Quantifying nitrous oxide production rates from nitrification and denitrification under various moisture conditions in agricultural soils. Front. Microbiol. 2022, 13, 1110151. [Google Scholar] [CrossRef]
  45. Schils, R.; Van Groenigen, J.; Velthof, G.; Kuikman, P. Nitrous oxide emissions from multiple combined applications of fertiliser and cattle slurry to grassland. Plant Soil 2008, 310, 89–101. [Google Scholar] [CrossRef]
  46. Zhang, J.; Han, X. N2O emission from the semi-arid ecosystem under mineral fertilizer (urea and superphosphate) and increased precipitation in northern China. Atmos. Environ. 2008, 42, 291–302. [Google Scholar] [CrossRef]
  47. Kim, S.U.; Lee, H.H.; Moon, S.M.; Han, H.R.; Hong, C.O. Nitrous oxide emissions and maize yield as influenced by nitrogen fertilization and tillage operations in upland soil. Appl. Biol. Chem. 2021, 64, 18. [Google Scholar] [CrossRef]
  48. Carter, M.S. Contribution of nitrification and denitrification to N2O emissions from urine patches. Soil Biol. Biochem. 2007, 39, 2091–2102. [Google Scholar] [CrossRef]
  49. Wang, C.; Amon, B.; Schulz, K.; Mehdi, B. Factors that influence nitrous oxide emissions from agricultural soils as well as their representation in simulation models: A review. Agronomy 2021, 11, 770. [Google Scholar] [CrossRef]
  50. Mahama, G.; Prasad, P.; Roozeboom, K.; Nippert, J.; Rice, C. Reduction of nitrogen fertilizer requirements and nitrous oxide emissions using legume cover crops in a No-tillage sorghum production system. Sustainability 2020, 12, 4403. [Google Scholar] [CrossRef]
  51. Smith, L.C.; deKlein, C.A.M.; Catto, W.D. Effect of dicyandiamide applied in a granular form on nitrous oxide emissions from a grazed dairy pasture in Southland, New Zealand. N. Zeal. J. Agric. Res. 2008, 51, 387–396. [Google Scholar] [CrossRef]
  52. Ellis, S.; Yamulki, S.; Dixon, E.; Harrison, R.; Jarvis, S. Denitrification and N2O emissions from a UK pasture soil following the early spring application of cattle slurry and mineral fertiliser. Plant Soil 1998, 202, 15–25. [Google Scholar] [CrossRef]
  53. Freibauer, A.; Kaltschmitt, M. Controls and models for estimating direct nitrous oxide emissions from temperate and sub-boreal agricultural mineral soils in Europe. Biogeochemistry 2003, 63, 93–115. [Google Scholar] [CrossRef]
  54. Stehfest, E.; Bouwman, L. N2O and NO emission from agricultural fields and soils under natural vegetation: Summarizing available measurement data and modeling of global annual emissions. Nutr. Cycl. Agroecosyst. 2006, 74, 207–228. [Google Scholar] [CrossRef]
Figure 1. Machinery integration of 1.72 m track width with spray lines showing working widths as integer of basic module width in CTF system in Pukekohe.
Nitrogen 06 00063 g001
Figure 2. Locations of random soil core sampling along the transects from CTF and RTF in Pukekohe (−37.3187° S, 174.9985° E). Imagery date: 3 November 2016. Source: Adapted from Google Earth (2020).
Nitrogen 06 00063 g002
Figure 3. Field experimental lay-out of fertilised and unfertilised soil cores.
Nitrogen 06 00063 g003
Figure 4. Simulated water-filled pore space % (WFPS) in the soil cores from the traffic systems at 0 to 5 cm depth over the 58 days of the experimental period as per the NIWA water balance model.
Nitrogen 06 00063 g004
Figure 5. Daily N2O flux as influenced by traffic systems (CTF, RTF, and TRM) and N fertiliser (urea). Error bars show standard error (n = 5).
Nitrogen 06 00063 g005
Table 1. Treatment combinations of the soil core experiments.
TreatmentDescription
CTF-N1Controlled Traffic Farming + 140 kg N/ha
RTF-N1Random Traffic Farming + 140 kg N/ha
TRM-N1Tramline + 140 kg N/ha
CTF-N0Controlled Traffic Farming + 0 kg N/ha
RTF-N0Random Traffic Farming + 0 kg N/ha
TRM-N0Tramline + 0 kg N/ha
N1 denotes fertiliser application at a rate of 140 kg N/ha, while N0 represents no fertiliser application.
Table 2. Status of bulk density and porosity in the cores at 0 to 10 cm depth.
TreatmentMean Bulk Density (g/cm3)Porosity
CTF-N10.810.69
RTF-N10.830.69
TRM-N10.870.66
CTF-N00.770.71
RTF-N00.760.67
TRM-N00.870.67
p valuensns
ns, not significant at p < 0.05 (n = 5).
Table 3. Initial moisture content and mean residual inorganic N content at 10 cm soil depth in Pukekohe clay loam across treatments.
TreatmentInitial Gravimetric Water Content (g/g soil)Initial Residual Inorganic N (kg N/ha)Final Residual Inorganic N (kg N/ha)
CTF-N10.25 ± 0.025.81 ± 2.0534.04 ± 14.28 a
RTF-N10.23 ± 0.023.29 ± 0.1043.52 ± 7.47 a
TRM-N10.22 ± 0.012.51 ± 0.4056.03 ± 11.98 a
CTF-N00.23 ± 0.026.80 ± 4.301.92 ± 0.32 b
RTF-N00.25 ± 0.013.49 ± 0.301.86 ± 0.33 b
TRM-N00.2 ± 0.022.46 ± 0.351.71 ± 0.38 b
p valuensns<0.0001
Data are mean ± standard error. Different letters indicate significant differences between depths at p < 0.05 using Tukey’s test (n = 5).
Table 4. Effect of traffic system on daily and integrated N2O emissions over the experimental period.
Days After Urea Application
−12691417242734414956
Treatments g N2O/ha/day Integrated flux (kg N/ha)
CTF-N19.08 a 5.85 b17.07 a 74.43 a 109.88 a49.29 ab378.52 ab37.89 a9.56 ab25.33 ab29.36 a4.57 ab 3.69 abc
RTF-N110.3 a 26.3 a12.96 a 59.61 a210.16 a68.69 a594.27 a30.6 ab16.46 a34.10 a43.33 a5.2 a 5.40 a
TRM-N14.86 a 3.12 b9.98 a 86.88 a 137.15 a32.40 ab414.39 ab30.2 ab5.44 ab14.85 b29.16 a2.82 ab 3.99 ab
CTF-N08.25 a 4.25 b8.92 a 33.11 a 125.2 a48.12 ab103.57 c15.6 ab 8.09 ab7.13 c11.47 b3.87 ab 1.41 c
RTF-N07.79 a 7.92 b8.42 a 71.74 a 92.99 a16.63 b124.08 bc12.22 b8.27 ab5.36 c5.94 b 3.64 ab 1.53 c
TRM-N06.12 a 5.67 b10.26 a 47.93 a 100.41 a33.29 ab303.35 ab20.49 ab 4.65 b4.34 c7.64 b2.31 b 2.49 bc
Mean values with different letters within a column indicate significant differences between treatments at p < 0.05 using Tukey’s test (n = 5).
Table 5. Effect of traffic systems on the N uptake (kg N/ha) of grass over the soil core experimental period.
Treatments1st Cut2nd Cut3rd CutTotal N Uptake
14 dys after planting grass20 days after 1st cut41 days after 1st cut
CTF-N15.10 a19.08 a11.24 abc35.42 a
RTF-N15.84 a16.25 ab12.47 ab34.57 a
TRM-N13.54 a17.88 a15.99 a37.41 a
CTF-N02.48 a11.27 bc6.29 bcd20.06 b
RTF-N03.75 a7.20 cd3.08 cd14.04 bc
TRM-N04.43 a1.58 d0.59 d6.46 c
Mean values with different letters within a column indicate significant differences between treatments at p < 0.05 using Tukey’s test (n = 5).
Table 6. Comparison of N2O emissions with emissions reported from soils under pasture in New Zealand.
TreatmentsTotal Emissions from This Study (kg N2O/ha)Reported Emissions from Other Studies (kg N2O/ha)
CTF-N1 3.69 0.45 [52]
RTF-N1 5.40 3.74 [42]
TRM-N1 3.99 2.40 [50]
CTF-N0 1.41 0.78 [18]
RTF-N0 1.53
TRM-N0 2.49
Disclaimer/Publisher’s Note: The statements, opinions and data contained in all publications are solely those of the individual author(s) and contributor(s) and not of MDPI and/or the editor(s). MDPI and/or the editor(s) disclaim responsibility for any injury to people or property resulting from any ideas, methods, instructions or products referred to in the content.

