Abstract
The growing negative environmental effects associated with chemical fertilizers have led to the promotion of organic fertilizers in agriculture. The purpose of this study was to evaluate the impacts of organic fertilization on nitrogen and phosphorus content, uptake and use efficiency in Origanum dictamnus (Dittany) cultivation. With this aim, a randomized complete blocks field experiment was carried out in Istron Kalou Xoriou (Agios Nikolaos—Crete). The study included three fertilization treatments (N0: 0 kg/ha−1, N1: 1250 kg/ha−1 and N2: 2500 kg/ha−1). Throughout the growing period, measurements were taken for the plant’s content, uptake and efficiency indices of total nitrogen (TN) and phosphorus (P). The findings indicated that the fertilization doses affect nutrient uptake and efficiency. The highest values of TN and P were recorded 60 days after transplants. N1 treatment showed the greatest improvement in nitrogen use efficiency, while phosphorus use efficiency reached its maximum level under N2 treatment. That research can contribute to achieving an in-depth insight of organic fertilization practices for aromatic and medicinal plants such as Dittany, promoting a sustainable agricultural strategy and enhancing product quality.
1. Introduction
Since ancient Greek times, the herb Origanum dictamnus (Dittany) has grown on the island of Crete in the South of Greece, and is thus named “The Dittany of Crete”. It is an endemic, protected species plant mentioned in Greek mythology as “panacea”, which translates verbatim in the Greek language to “wound treatment” [1]. Evidence of Dittany’s use is found in ancient Greek mythology books with religious implications. More concretely, Solomou et al. [2] claimed that the herb was mentioned in seventy books dating back to the 5th century BCE and the end of the Middle Ages. The majority of this written work was for medicinal and pharmaceutical purposes, with the pinnacle of this being Hippocrates’ mentions in his book Nature of Women. Cretans have gathered wild Dittany for centuries, but the difficulty and the risk involved in collecting the plant led to the plant beginning to be commercially farmed in around the 1920s in Herakleion [3]. Nowadays, Dittany grows wildly in the mountains of Crete but the market demand is met through farming, with its parts being used to cure various conditions and diseases, from gastrointestinal to lung issues [4]. The economic benefits of a Dittany farming can be observed in the third year of cultivation, with average yields reaching 366 kg per 0.10 hectares (5000 plants per 0.10 hectares), resulting in 2000 packets of 25 gof Dittany with a selling price of EUR 3.1 per package [5].
Nowadays, Dittany grows wildly in the mountains of Crete and farms all over Europe, with its parts being used to cure various conditions and diseases, from gastrointestinal to lung issues [4]. The role of fertilization and the significance of nitrogen (N) and phosphorus (P) in herb cultivation has been studied extensively [6,7] for many herbs, such as the perennial herb Bupleurum spp. [8], in lavender Lavandula angustifolia Mill. [9], in the garden thyme plant Thymus vulgaris L. [10,11,12], in chamomile Matericaria recutita L. [13,14], in oregano Origanum dubium [14,15] for the Thai basil Ocimum basilicum var. thyrsiflorum [16] and in Dittany [4]. It is widely known that N is a key component of chlorophyll and a building block of amino acids, enabling efficient photosynthesis and proper metabolic functions, respectively [17,18,19]. Consequently, N fertilization promotes shoot and root growth, and increases the percentage of biologically active compounds, such as phenolics, that are crucial for a herb’s therapeutic value [20]. Analogously, P fertilization regulates physiological responses to abiotic stresses, such as drought, and affects root development, resulting in efficient water and nutrient absorption [21,22]. Moreover, P fertilization is essential for floral initiation and seed formation [23].
N and P indices play a vital role in evaluating how effectively crops utilize these essential nutrients, offering key insights that support more precise and sustainable agricultural practices. By quantifying nutrient uptake and use efficiency, these indices help optimize fertilizer application, ensuring that crops receive adequate nutrition without overuse, and thereby enhancing productivity, preserving long-term soil fertility, and minimizing environmental risks such as nutrient runoff and eutrophication. Ultimately, the integration of N and P efficiency indices is crucial for achieving balanced fertilization and promoting environmentally responsible farming [22,23,24,25].
However, the majority of the research conducted on N and P fertilization in correspondence to herb farming has focused on chemical fertilizers, with very few studies examining the effects of biofertilizers and/or organic fertilizers [4,24,25,26].
A well-balanced N and P organic fertilization plan can enrich nutrient use efficiency, increase plant biomass and strengthen the root system. Additionally, it can promote sustainable herb growth while omitting excessive plant development at the expense of essential oil production, and, overall, increase the plant and oil yield, positively impacting the pharmaceutical value and commercial quality of the product.
The present study is guided by the following hypotheses: (1) the application of organic fertilization will induce statistically significant variations in the total nitrogen (N) and phosphorus (P) content and uptake in Origanum dictamnus (Dittany) cultivation; (2) the level of organic fertilizer applied will substantially affect the plant’s nutrient absorption and utilization patterns, with higher application rates expected to enhance overall nutrient uptake and (3) the N1 treatment is hypothesized to optimize nitrogen use efficiency (NUE), whereas the N2 treatment is expected to result in the highest phosphorus use efficiency (PUE).
The aim of this study was to examine the effect of organic fertilization on N and P content, N and P uptake and the N and P use efficiency in Origanum dictamnus (Dittany) cultivation in Istron Kalou Xoriou (Agios Nikolaos—Crete). The scope of the experiments was to enable farmers and researchers to optimize fertilization strategies and to contribute to sustainable agriculture and organic herb farming.
2. Materials and Methods
2.1. Study Area
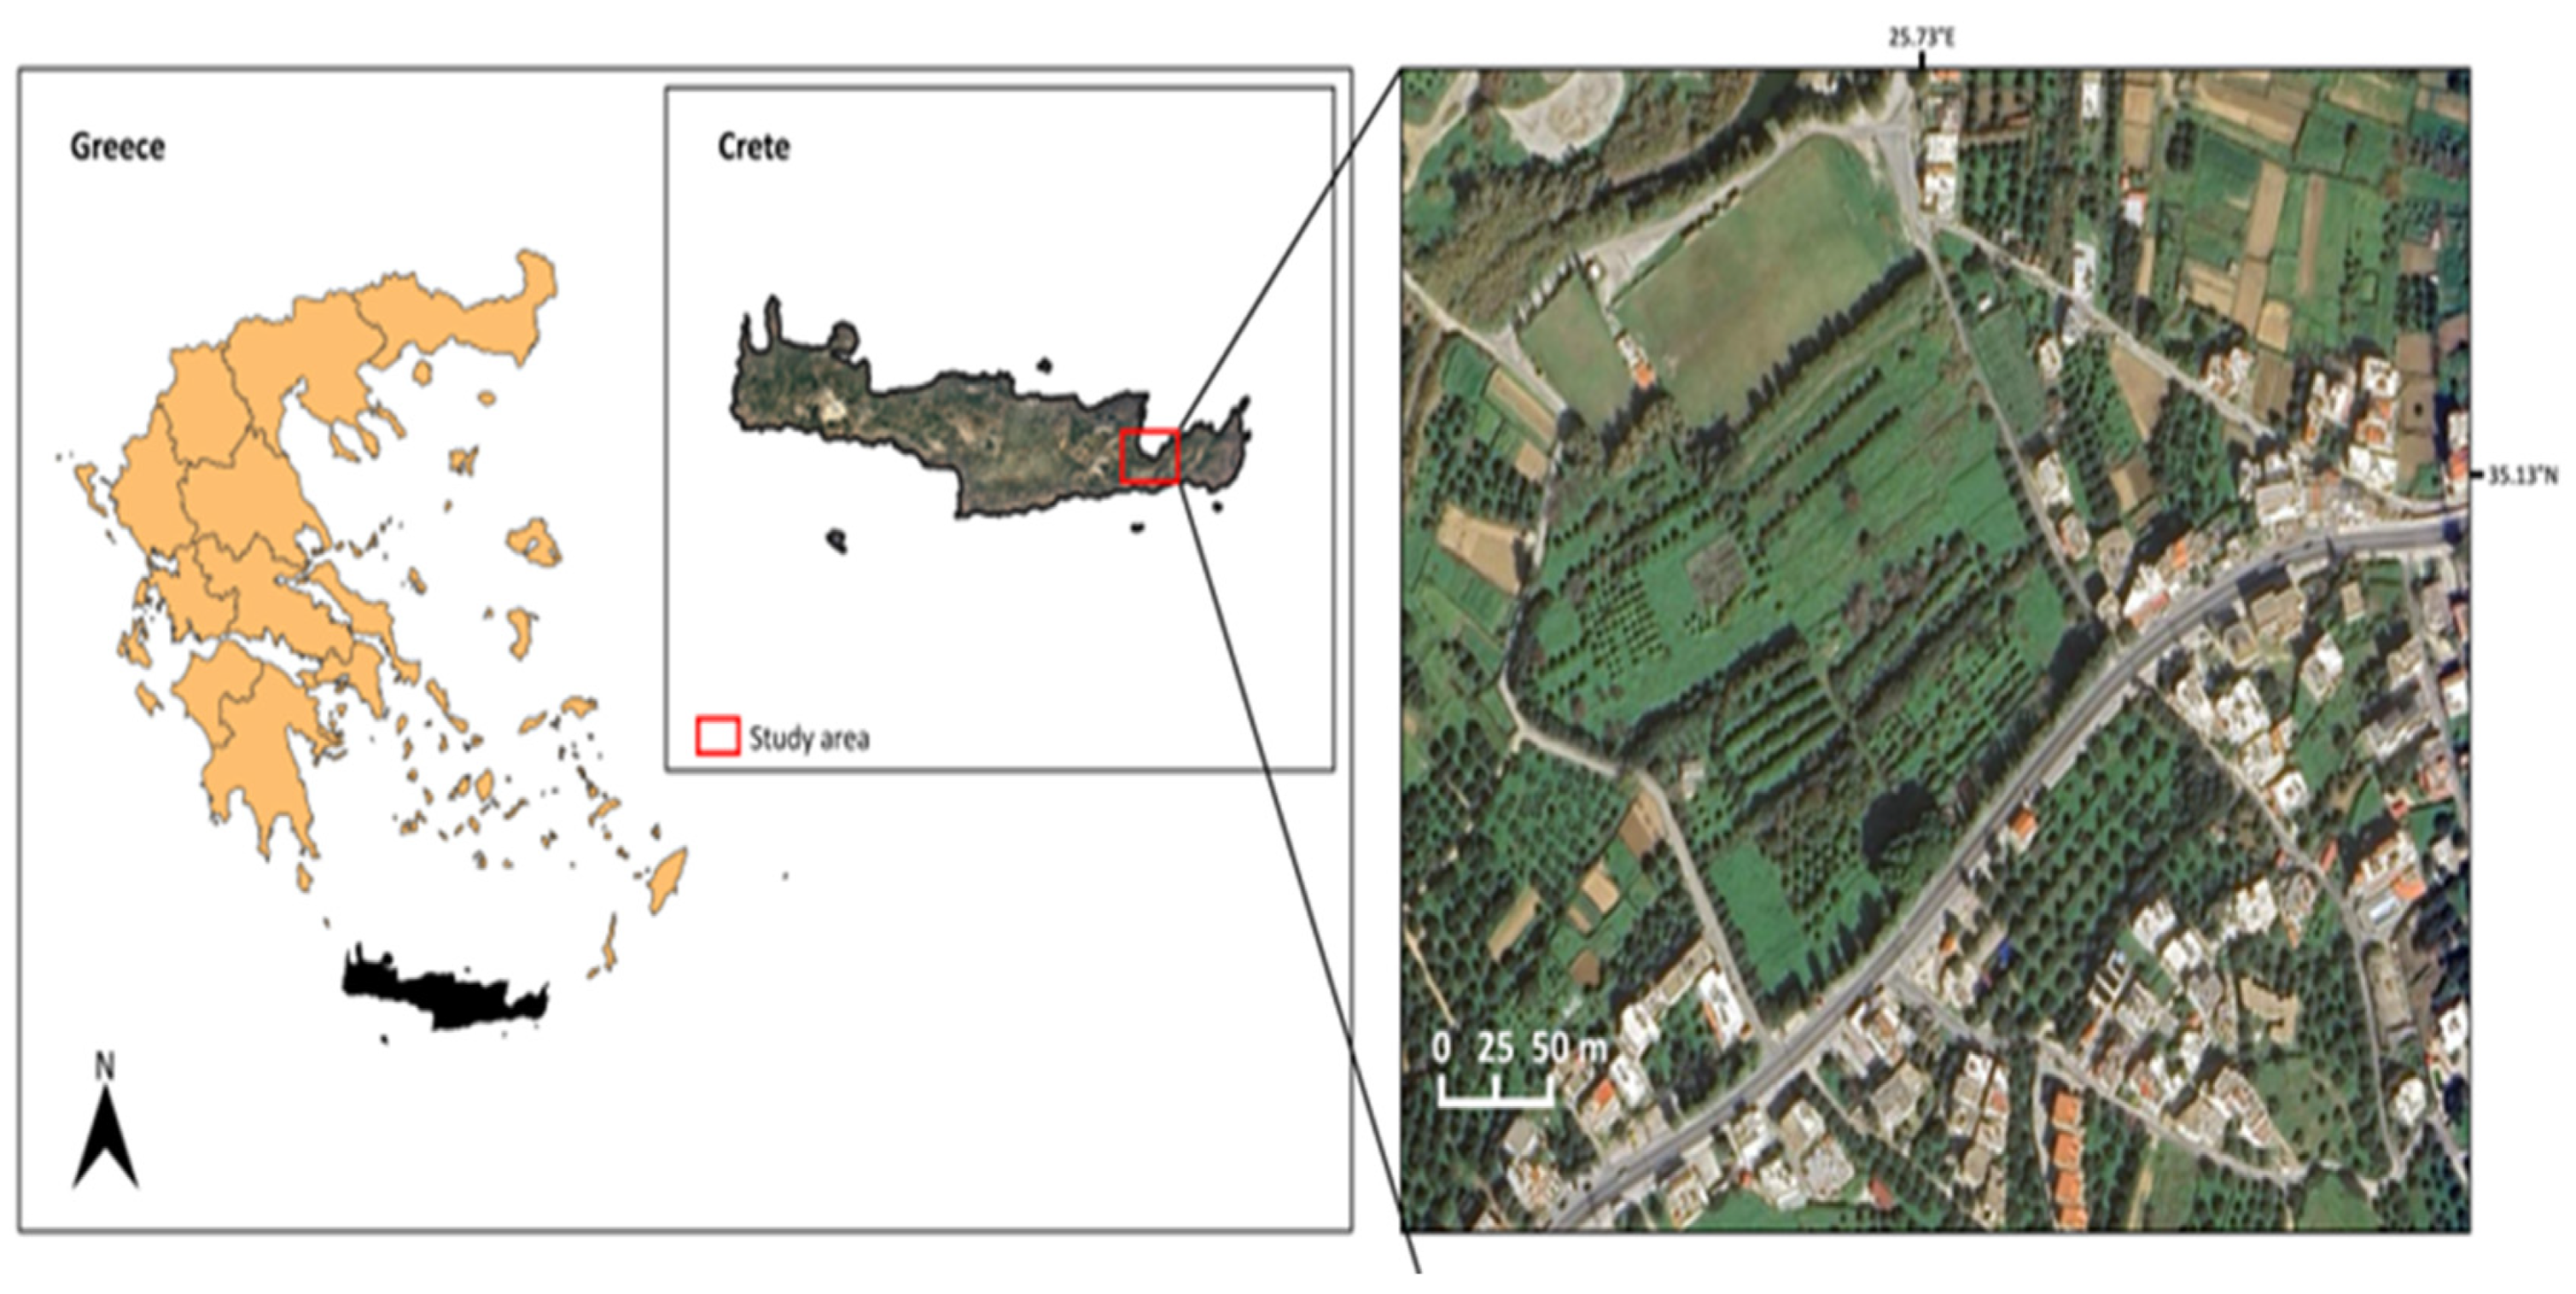
The experiments took place in the southern island of Crete in Greece, at the campus of the Department of Rural Development and Food, situated in Istron Kalou Xoriou within the municipality of Agios Nikolaos, Lasithi (Figure 1). The campus is located at an altitude of 50 m, with coordinates of 35°07′26.6″ N latitude and 25°44′07.0″ longitude.

Figure 1.
The study area of the experiments: Crete and Istron Kalou Xoriou.
2.2. Field Experiment
The field experiment commenced in May 2023, using two-month-old Dittany plants procured from a nursery located in Sitia (Crete). Plant transplantation to the field was conducted on the 2 May 2023 with a planting layout of 40 cm spacing between plants and 60 cm spacing between rows. Each plot covered an area of 0.24 cm2. The soil used was alkaline (pH 7.31) with a sandy loam texture [4], and the experimental design employed was a completely randomized block (CRB). The organic fertilizer (Prima Humica, Ledra Fertilizers, Thessaloniki, Greece) had the following characteristics: 68–78% organic matter, 5% total nitrogen (N), 3% phosphorus pentoxide (P2O5) and no potassium oxide (K2O). Fertilizer applications took place 10 days after transplantation, on the 12 May 2023. Three treatments were involved as follows: N0 (control) = 0 kg/ha−1, N1 = 1250 kg/ha−1 (equal to 6.25 units of N and 3.75 units of P) and N2 = 2500 kg/ha−1 (equal to 12.5 units of N and 7.5 units of P). Each treatment included 10 replicates, totaling 30 plots in the field. Every three days, the plants were watered using an automated drip system equipped with 2 L/h adjustable drippers.
2.3. Measurements
The total nitrogen (TN) and phosphorus (P) content of plants were assessed throughout the experiment, using plant material, which was collected 30, 60 and 110 days after transplant (DAT). Furthermore, nitrogen and phosphorus uptake, nitrogen efficiency indices and phosphorus efficiency indices were assessed. For these measurements, plant material from each plot was collected at 60 and 110 days after transplant (DAT) and were oven-dried for 36 h at 40 °C (L101-0AB—Chemist EU, Niel, Belgium).
2.4. Nitrogen–Phosphorus Content Analysis
The TN content of plant samples was determined by the Kjeldahl method in the Bucchi apparatus (UDK 139 model, VELP China Co. Ltd., Shanghai, China) [27]. For the determination of phosphorus concentration in plant samples, 0.5 g of dried plant material was placed in a porcelain crucible and was ashed at 500 °C for four hours in a muffle furnace (PT—1200M mini muffle furnace—Zhengzhou Protect Technology Co., Ltd., Zhengzhou, China). Then, the ash was dissolved with 20 mL 20% HCl, the solution was filtered and the filtrate was diluted with distilled water to a final volume of 50 mL [28]. The P plant concentration was determined by using a spectrophotometer (LMSP-V310, Anamatrix Instrument Technologies Private Limited, Bengaluru India).
2.5. Nitrogen (N) Indices
The TN uptake by plants was assessed by measuring N absorption in the abovementioned biomass at maturity (60 DAP and 110 DAT) To determine the N uptake, the following indices was used [29]:
N uptake (g/plant) = (N content (%)/100) × Dry weight (g/plant)
Moreover, the N utilization efficiency (NUE, kg/kg−1), the agronomic efficiency of N (NAE, kg/kg−1), the crop recovery efficiency of N (NRE, kg/kg−1) and the physiological efficiency of N (NPE, kg/kg−1) were calculated. The N utilization efficiency (NUE) refers to the efficiency of a plant to convert the nitrogen it has adsorbed into yield or biomass production [30]. The agronomic efficiency of N (NAE) refers to the increase in crop yield that is produced for every unit of nitrogen fertilizer applied [31]. The crop recovery efficiency of N (NRE) defines the percentage of applied nitrogen fertilizer is absorbed by the crop aboveground [32]. Finally, the physiological efficiency of N (NPE) represents the capacity of a plant to transform the absorbed nitrogen into productive yield [33].
The calculation of the above indices based in the following formulas [34]:
2.6. Phosphorus (P) Indices
P-Uptake, P Utilization Efficiency (PUE)
To determine P uptake, the P content (%) was multiplied by the dry weight of the crop biomass, using the following equation [29]:
P uptake (g/plant) = (P content (%)/100) × Dry weight (g/plant)
Additionally, P recovery efficiency (PRE, kg/kg−1), P use efficiency (PUE, kg/kg−1) and P partial factor productivity (PFPP, kg/kg−1) were calculated. P recovery efficiency (PRE) refers to proportion of applied phosphorus fertilizer which a plant absorbs, and indicates the effectiveness of the plant at retrieving and utilizing the added phosphorus from the soil [35]. P use efficiency (PUE) describes the capacity of a plant to take up and utilize phosphorus from soil or fertilizer to support growth and yield [36]. Finally, P partial factor productivity (PFPP) reflects the plant’s ability to convert applied phosphorus fertilizer into yield or biomass [37].
The calculation of the above indices were performed using the formula mentioned below [37]:
2.7. Statistical Analysis
The data were analyzed using SPSS 26.0 (IBM, Armonk, NY, USA). All subsets of data were assessed for normality via the Shapiro–Wilk test and for homogeneity of variance via the Levene’s test. For all cases, normality could safely be assumed. When homogeneity of variance could not be assumed, Welch’s ANOVA was performed to find differences between experimental groups, while when homogeneity of variance was verified, one-way ANOVA was chosen for the same purpose. When Welch’s ANOVA was deemed of significant difference, the Games–Howell test was chosen for paired comparisons between groups. When one-way ANOVA was deemed of significant difference, it was followed by a HSD test between paired groups. Statistical significance was set at p < 0.05. Since a significant interaction between the duration of the experiment (30, 60 and 110 DAT) and experimental dose was possible, a two-ways ANOVA for the N uptake and P uptake parameters was also performed.
3. Results
3.1. Nutrient Content
The TN and P concentration in plants are presented in Table 1 and Table 2. The highest concentration of TN was noticed 60 days after the transplant in both N2 and N1 treatment. In N2 plots the TN content was 5% higher compared to N1. Statistically significant differences were recorded between N1 and N2 fertilization schemes and control treatment during the first, the second and the third measurements. In the third measurement (110 days) of TN, a significant difference was noticed among N2 and N1, as well as between N2 and control plots, with the N2 scheme showing the highest value. This difference between N1 and N2 was not evident at 60 DAT. Additionally, statistically significant differences were observed in both N1 and N2 doses across the different measurement periods; for N1, there was an increase at 60 DAT, which subsequently decreased at 110 DAT, while for N2, this increase was maintained at 110 DAT. As shown in Table 1, the interaction between the dose scheme and DAT was indeed significant; this means that each treatment group showed a distinct pattern in increase in TN content as plant maturity advanced.

Table 1.
Total nitrogen (TN) concentration and two-way ANOVA results for Dittany aboveground biomass.
Table 2.
Phosphorus (P) concentration and two-ways ANOVA results for Dittany aboveground biomass.
The results of P content in plants are illustrated in Table 2. The highest P concentration of Dittany aboveground biomass was observed at both the N1 and the N2 treatments 60 days after transplant. The N2 treatment was 6% higher in comparison to the N1 dose, but between the two fertilizations, there was no statistically significant difference, at any time point. It is remarkable that in the second harvest (110 days after plantation) the P content of plants was lower than in first one (60 days after transplant). Statistically significant differences were recorded in different days after transplantation at the N1 and the N2 fertilization dose. As shown in Table 2, the interaction between the dose scheme and DAT was not significant; this means that, in general, each treatment group showed similar P fluctuations as plant maturity advanced. It is evident that N1 and N2 treatments significantly increased P content in relation to control at all time points.
3.2. Nutrient Uptake
The nitrogen (N) uptake is presented in Table 3. Nitrogen uptake was significantly influenced by the fertilization treatment (p < 0.05). The highest nitrogen uptake was observed in the N2 treatment, both at 60 and at 110 days. Specifically, N uptake at the N2 was significantly higher than at the N1 and the N0, while the N1 was significantly higher than the N0. Different fertilizer treatments, N1 and N2, enhanced N uptake by 54.98% and 65.13% at 60 days after transplanting, and by 46.26% and 61.50% at 110 days, respectively, in comparison to the untreated control (N0). Furthermore, the N2 treatment resulted in an increase in N uptake by 22.54% at 60 days and 28.37% at 110 days after transplanting.
Table 3.
Nitrogen uptake (g/plant) of Dittany plants in three different fertilizer schemes.
Phosphorus (P) uptake results are illustrated in Table 4. A total of 60 days after transplant, P uptake ranges from 0.047 to 0.139 g/plant. The highest value was recorded in the N2 treatment, followed by the N0 and N1. At 110 days, there was a marked increase in P uptake in all treatments. Specifically, the increase between the NI and N0 was 55.52% at 60 days and 57.63 at 110 days. Compared to the N1 treatment, an increase was noticed in the N2 plots, from 17.56% 110 days to 22.96% 60 days after transplant. Across all treatments, P uptake at 110 days was significantly greater than at 60 days, demonstrating a pronounced time-dependent increase. Additionally, the significance of the 60-day difference among treatments highlights the early-stage P uptake dynamics. At 60 DAT, statistically significant differences were evident, as shown by different letters (a, b, c). Specifically, N1 and N2 treatments resulted in substantially higher phosphorus uptake compared to N0, indicating that the applied organic fertilizer had a pronounced effect at early growth stages.
Table 4.
Phosphorus uptake (g/plant) of Dittany plants in three different fertilizer schemes.
3.3. Agronomic Indices of Nitrogen
This study assessed several nitrogen-related efficiency indices, such as nitrogen use efficiency (NUE), nitrogen agronomic efficiency (NAE), nitrogen recovery efficiency (NRE) and nitrogen physiological efficiency (NPE) (Figure 1, Figure 2, Figure 3 and Figure 4) under different fertilizer doses.
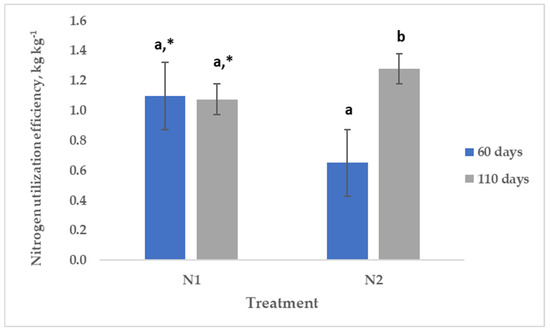
Figure 2.
Nitrogen utilization efficiency (NUE, kg/kg−1) in two different fertilizer schemes. Different letters indicate statistically significant differences between the different days after transplantation in the same fertilization dose. * Indicates statistically significant differences between the different fertilization schemes.

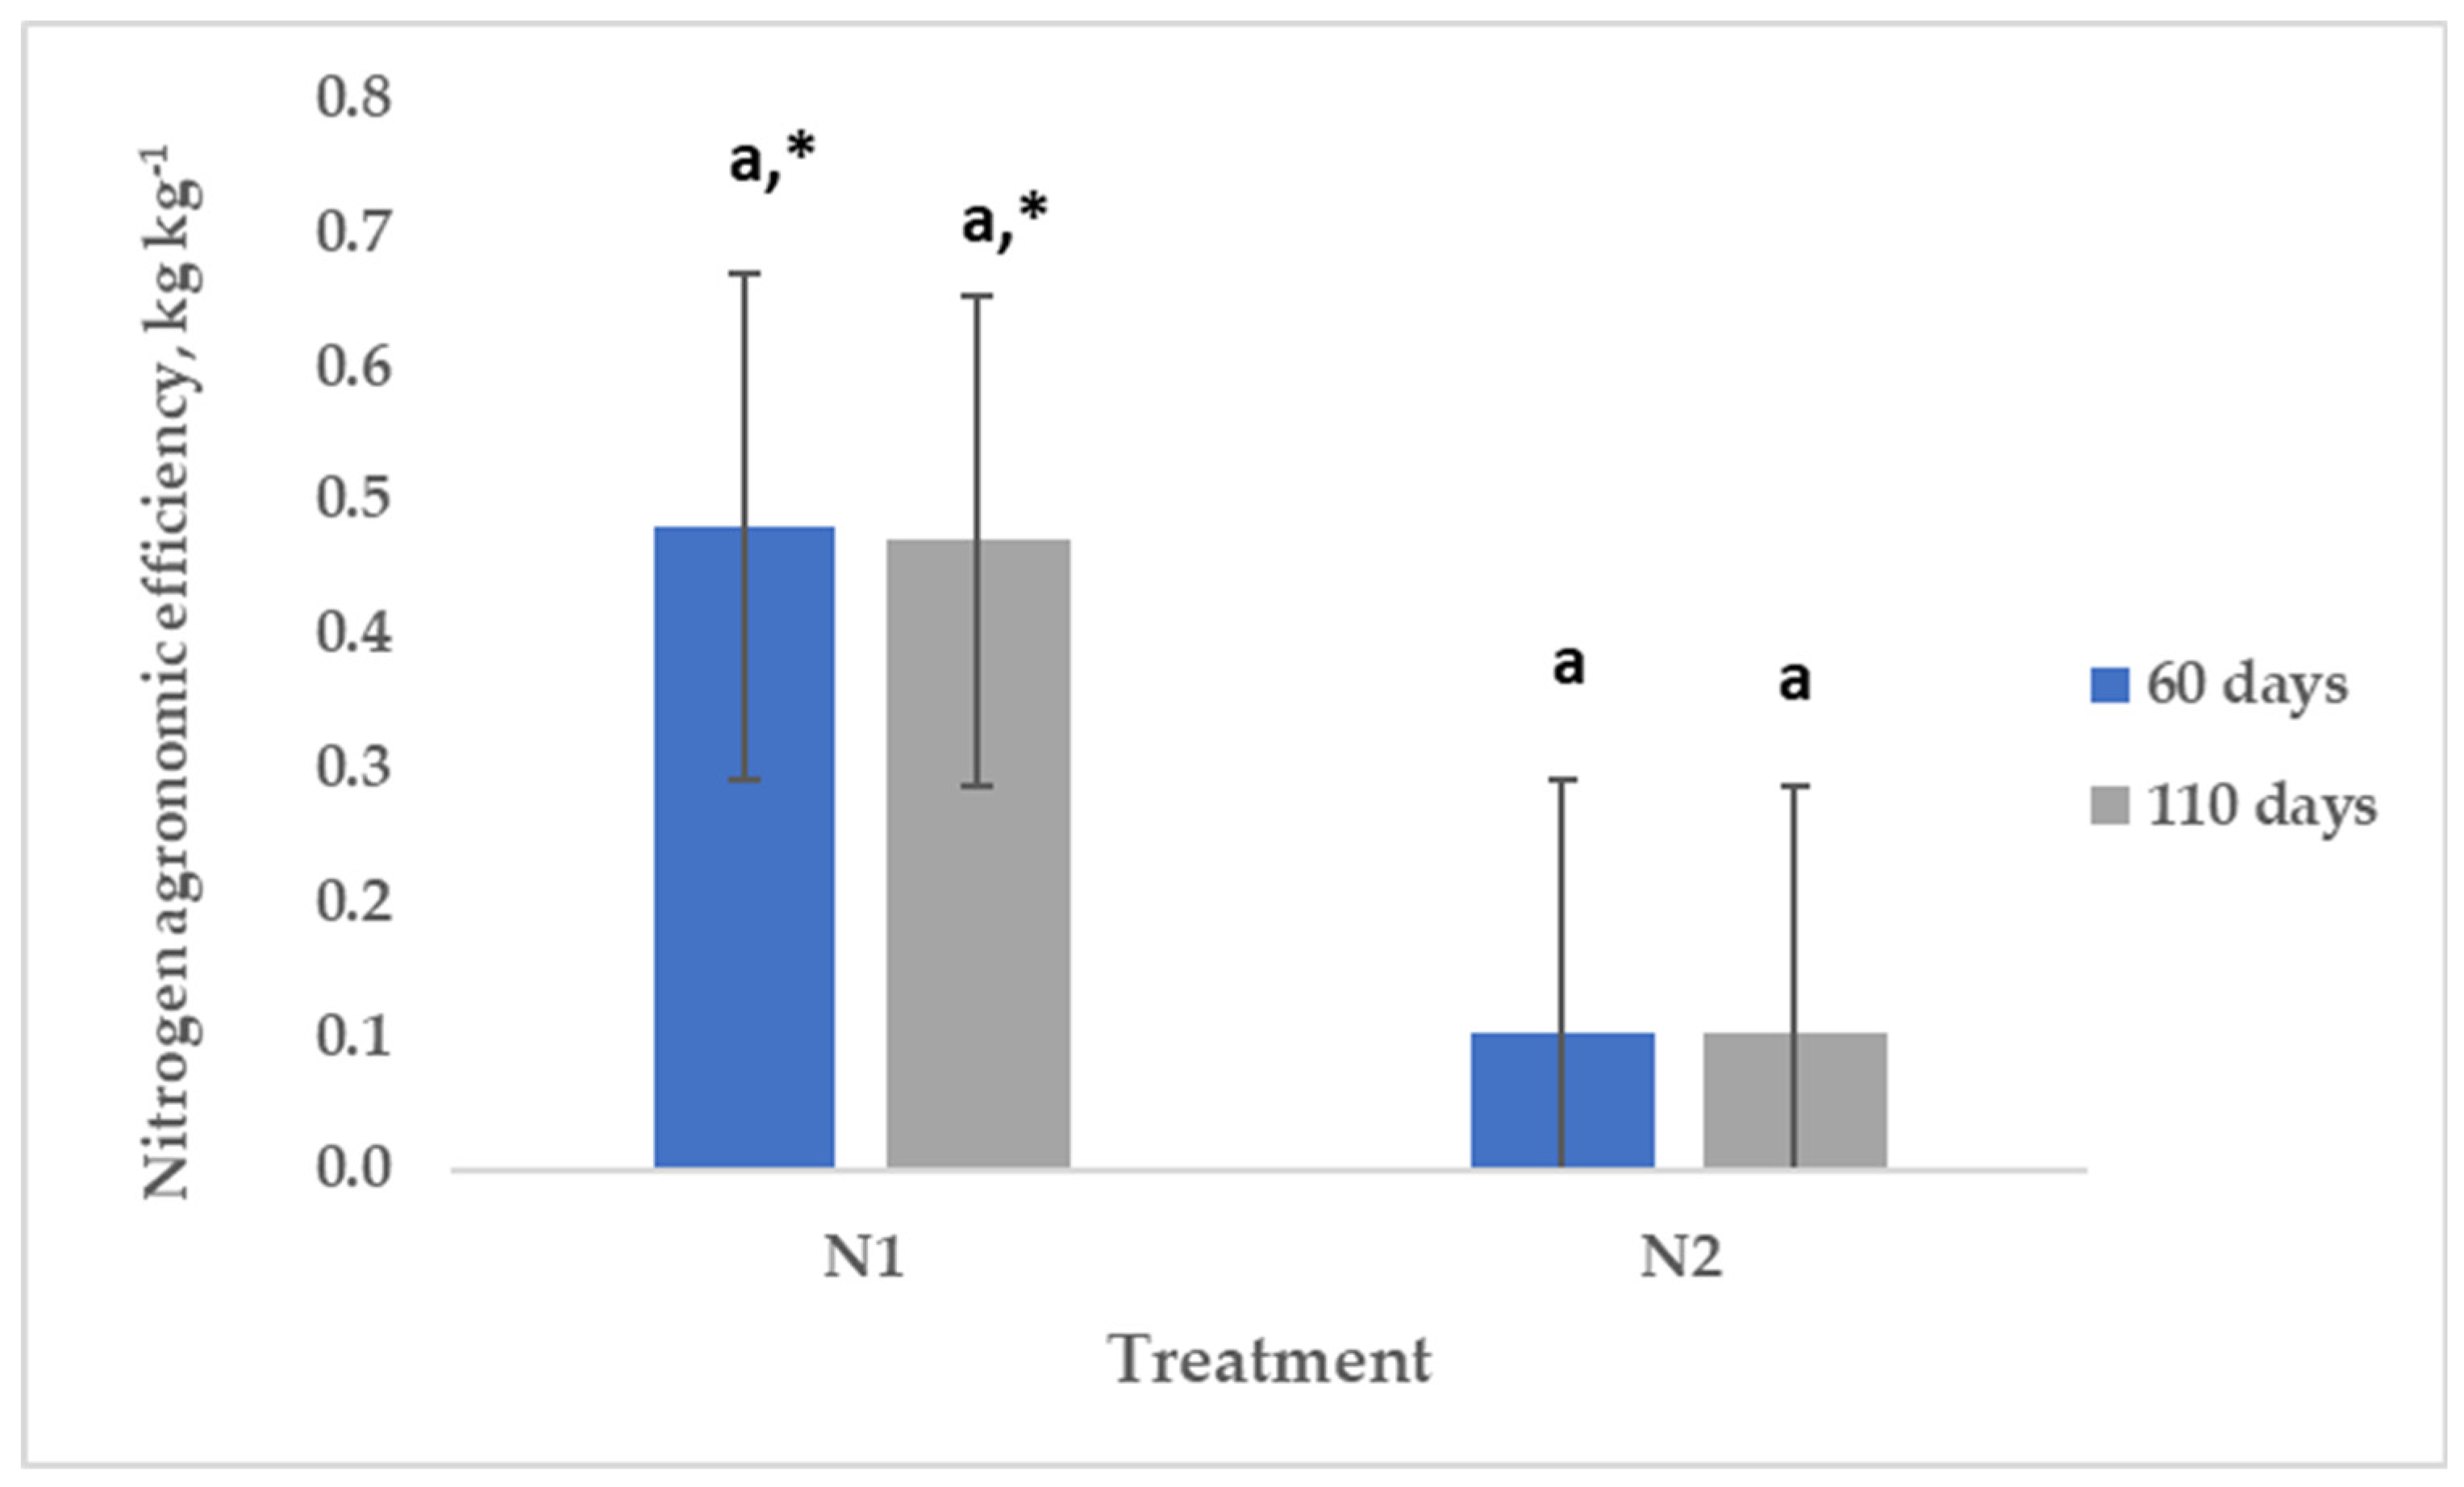
Figure 3.
Nitrogen agronomic efficiency of applied fertilization (NAE, kg/kg−1) in two different fertilizer schemes. Different letters indicate statistically significant differences between the different days after transplantation in the same fertilization dose. * Indicates statistically significant differences between the different fertilization schemes.

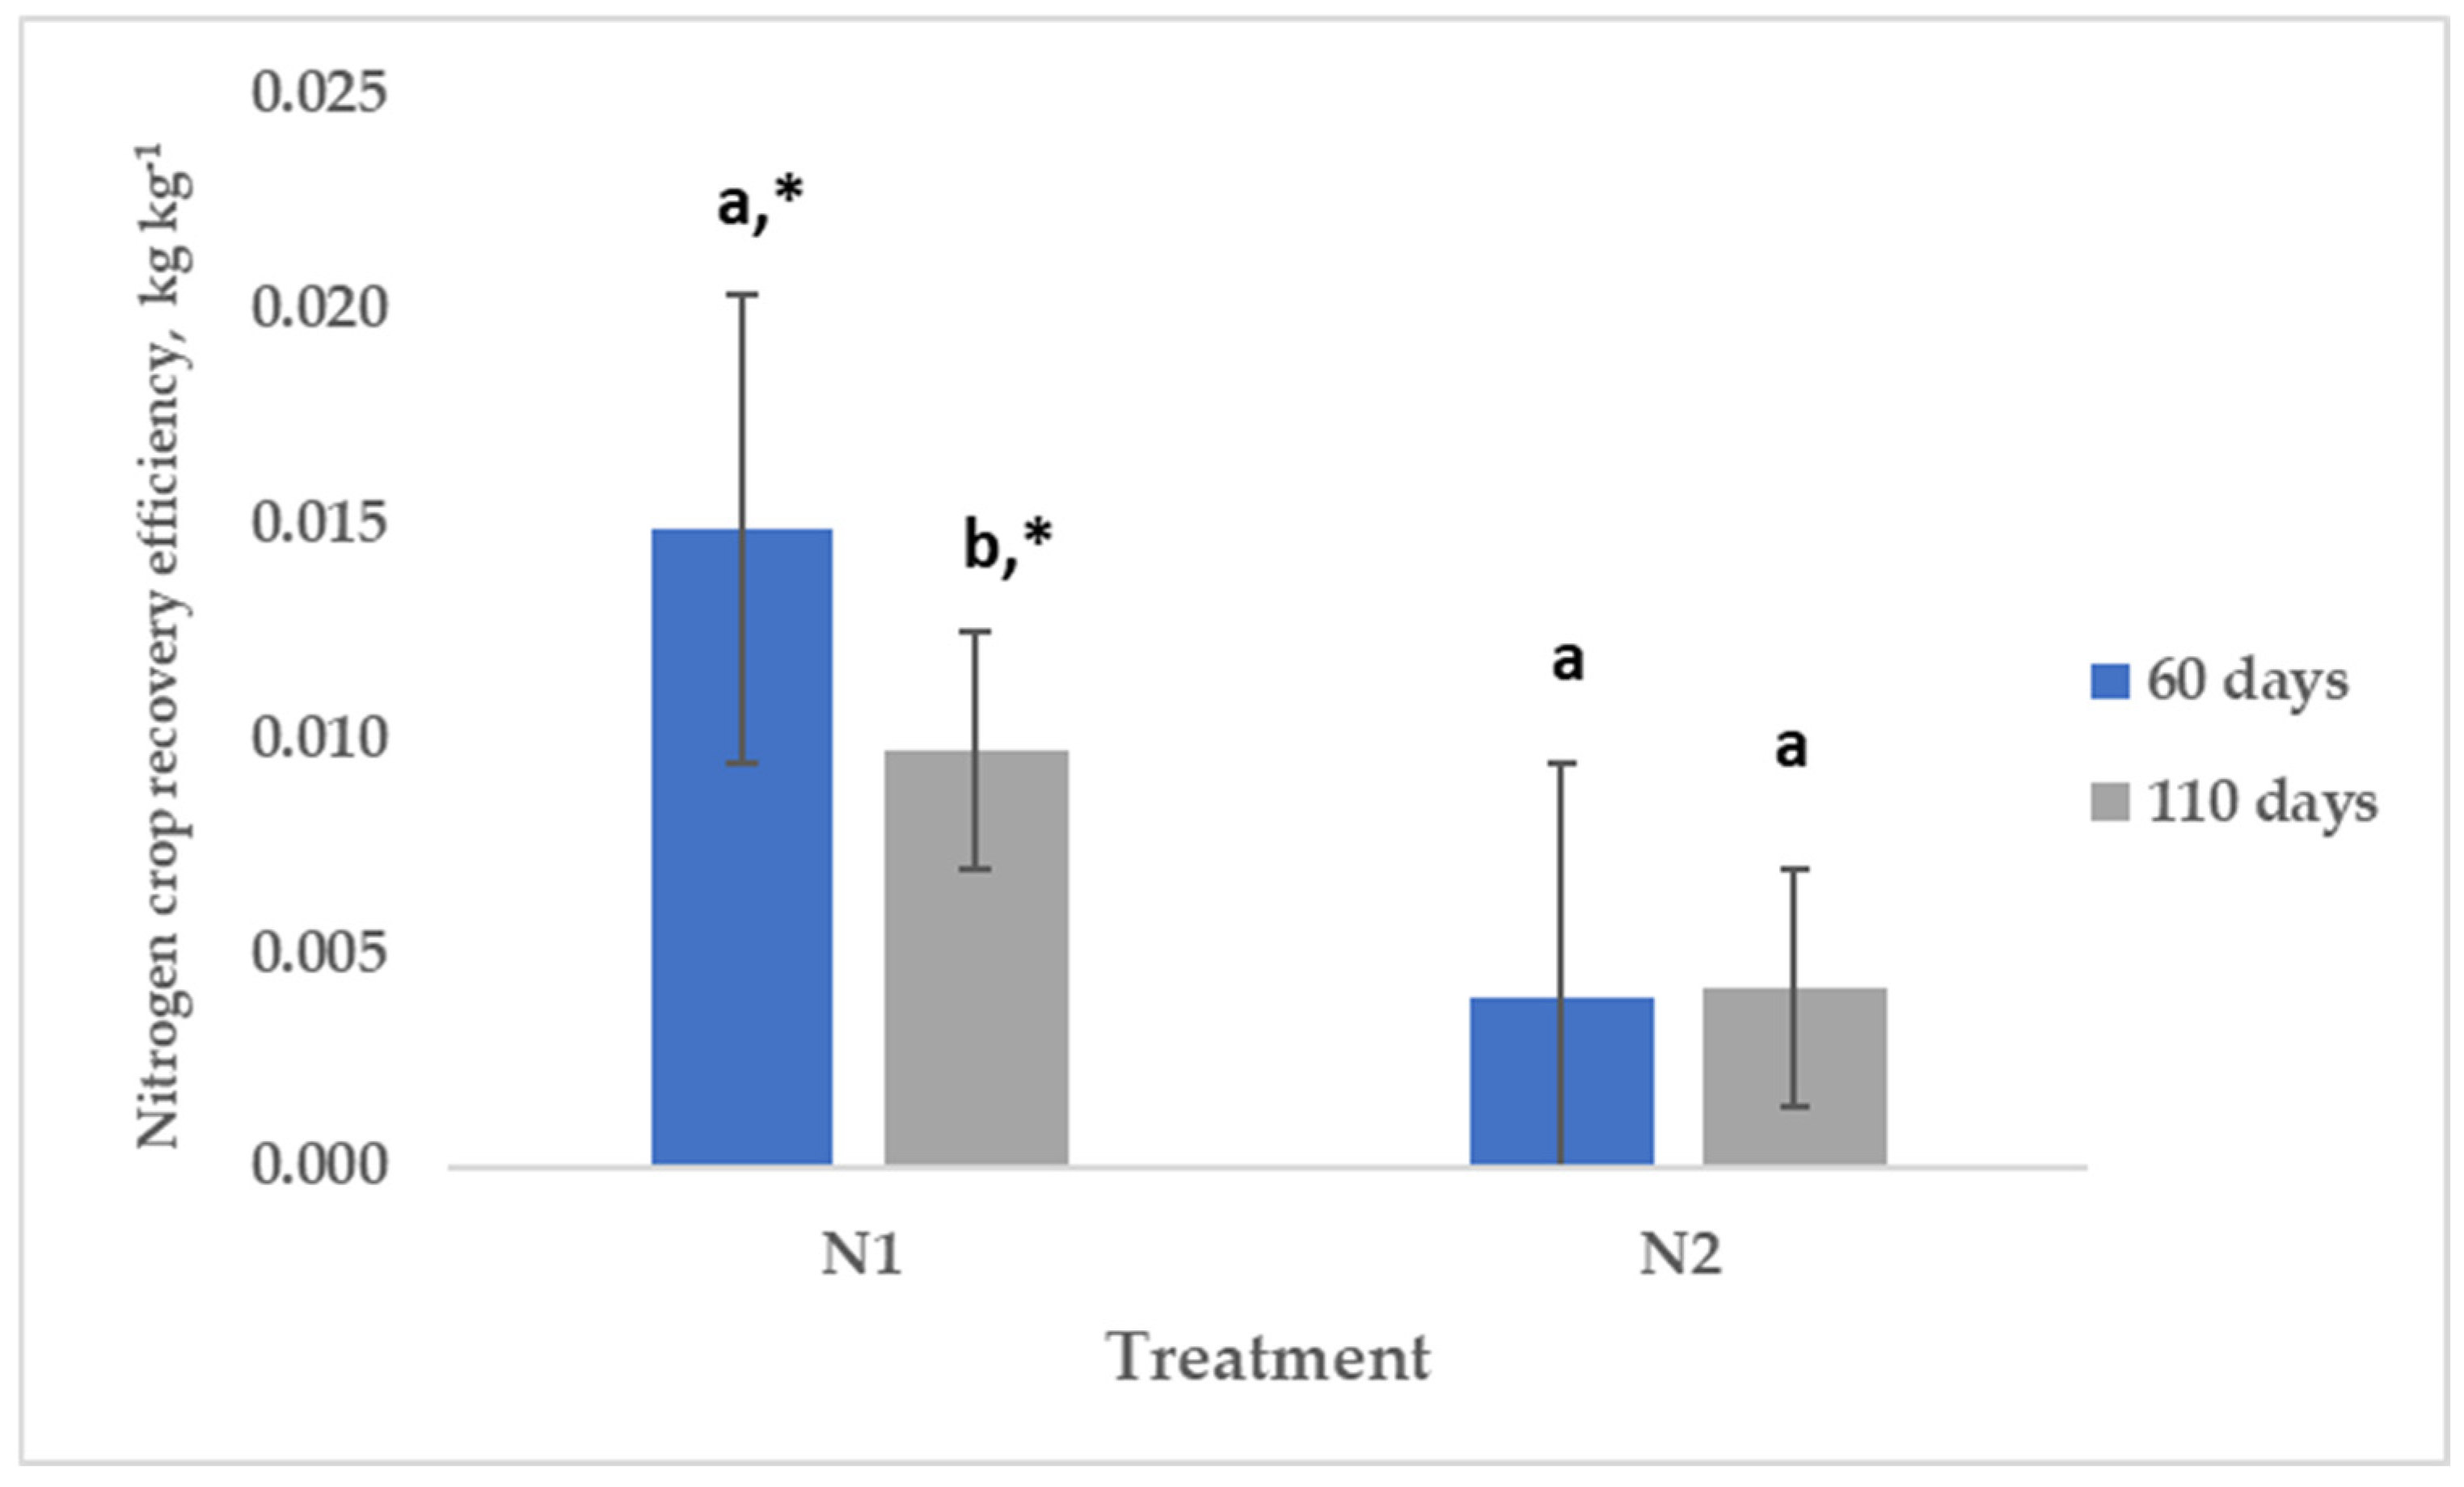
Figure 4.
Nitrogen crop recovery efficiency of applied fertilization (NRE, kg/kg−1) in two different fertilizer schemes. Different letters indicate statistically significant differences between the different days after transplantation in the same fertilization dose. * Indicates statistically significant differences between the different fertilization schemes.
The NUE results are shown in Figure 2. The highest NUE was observed at the N2 treatment, 110 days after transplant (1.279 kg/kg−1), followed by the N1 treatment at 60 days (1.098 kg/kg−1). It is noteworthy that the N2 dose exhibited statistically significant differences across the two different sampling times. Moreover, when comparisons were performed between the NI and N2 schemes, statistically significant differences were noticed, at both 60 and 110 DAT.
Figure 3 provides the measurements of NAE. According to this figure the highest NAE was noticed at 60 and 110 DAT in the N1 fertilizer scheme (0.481 and 0.469 kg/kg−1). Statistically significant differences were observed between the NI and the N2 treatments at both 60 and 110 DAT. Furthermore, the two doses demonstrated no significant variation among the two periods of sampling.
The NRE and NPE values are displayed in Figure 4 and Figure 5. The highest NRE and NPE were noticed at the N1 treatment at 60 DAT (0.0148 kg/kg−1) and at 110 DAT (50.9 kg/kg−1), respectively. It is also important to highlight that the N1 supply showed statistically significant variations, while N2 had no effect across the 60 and 110 DAT in both NRE and NPE. Furthermore, in NRE and NPE, statistically significant differences were observed between the N1 and the N2 schemes.
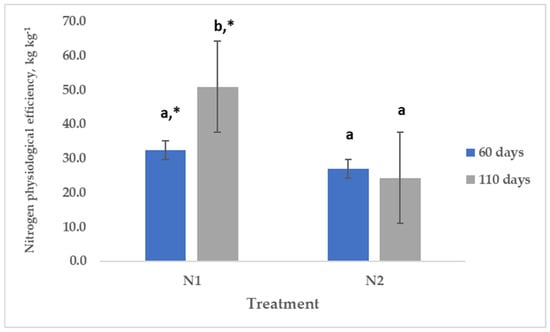
Figure 5.
Nitrogen physiological recovery efficiency of applied fertilization (NPE, kg/kg−1) in two different fertilizer schemes. Different letters indicate statistically significant differences between the different days after transplantation in the same fertilization dose. * Indicates statistically significant differences between the different fertilization schemes.
3.4. Agronomic Indices of Phosphorus
In this experiment, the P partial factor productivity (PFPP), P recovery efficiency (PRE) and P use efficiency (PUE) were evaluated.
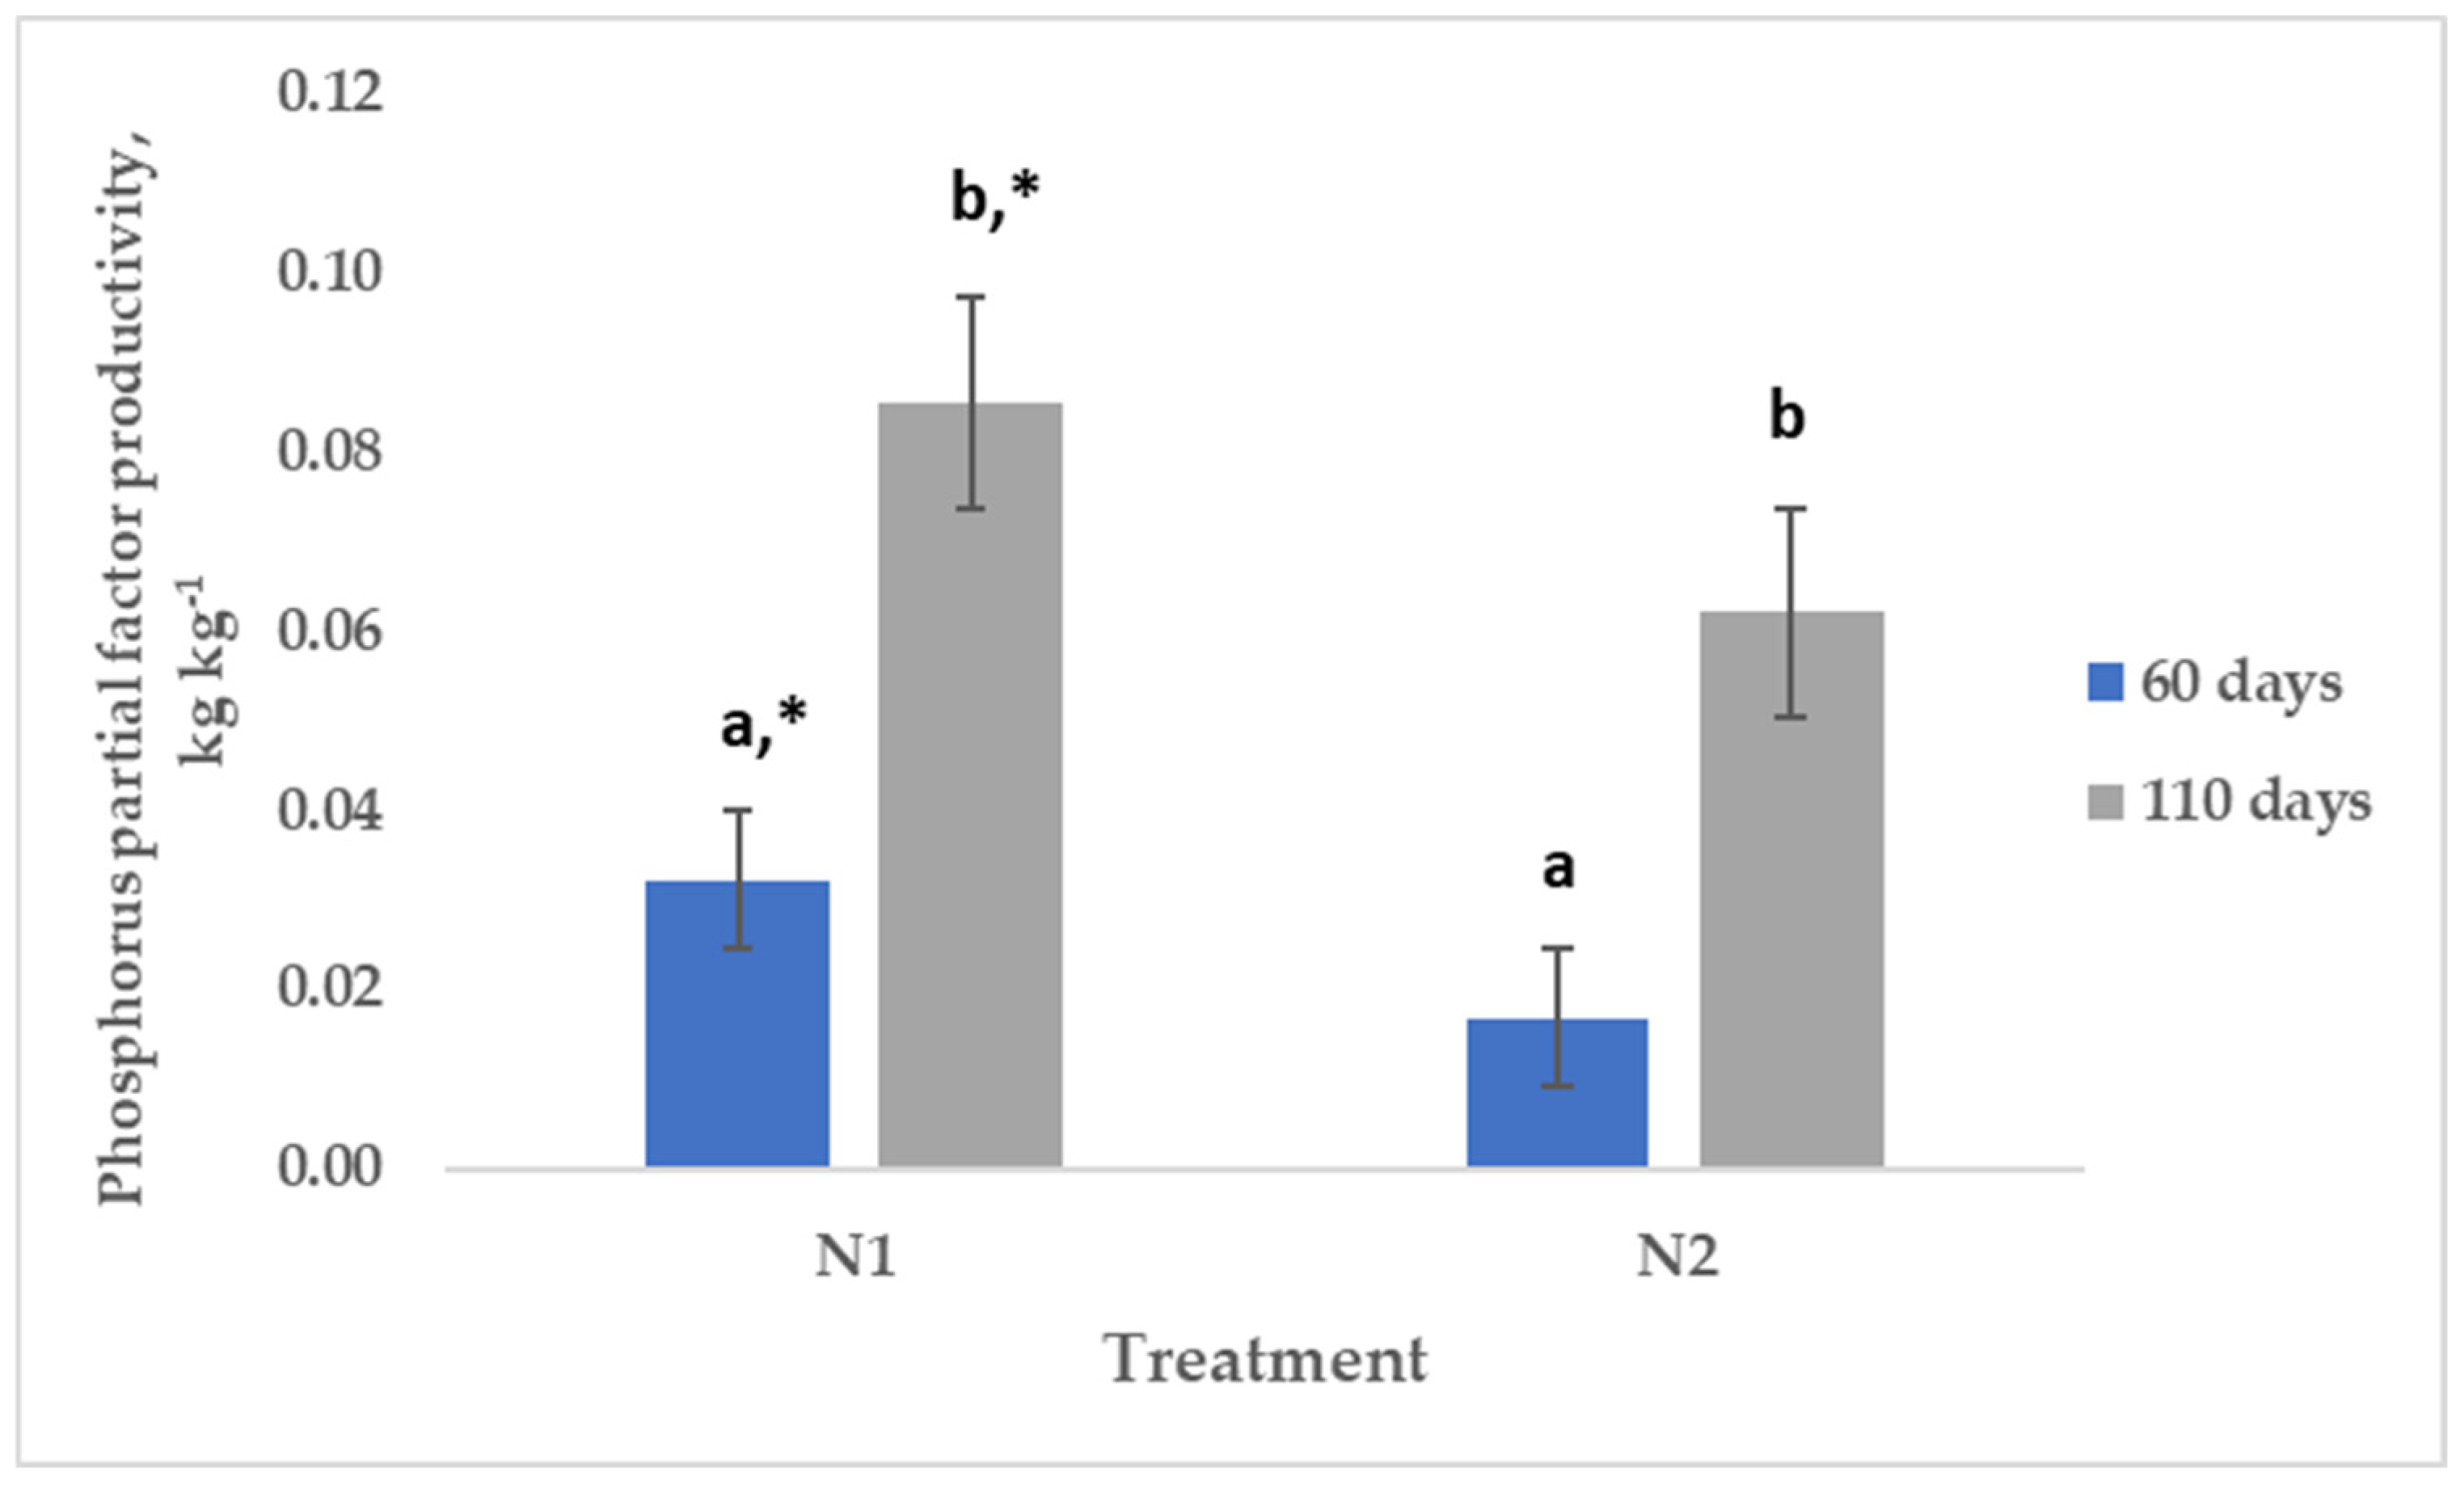
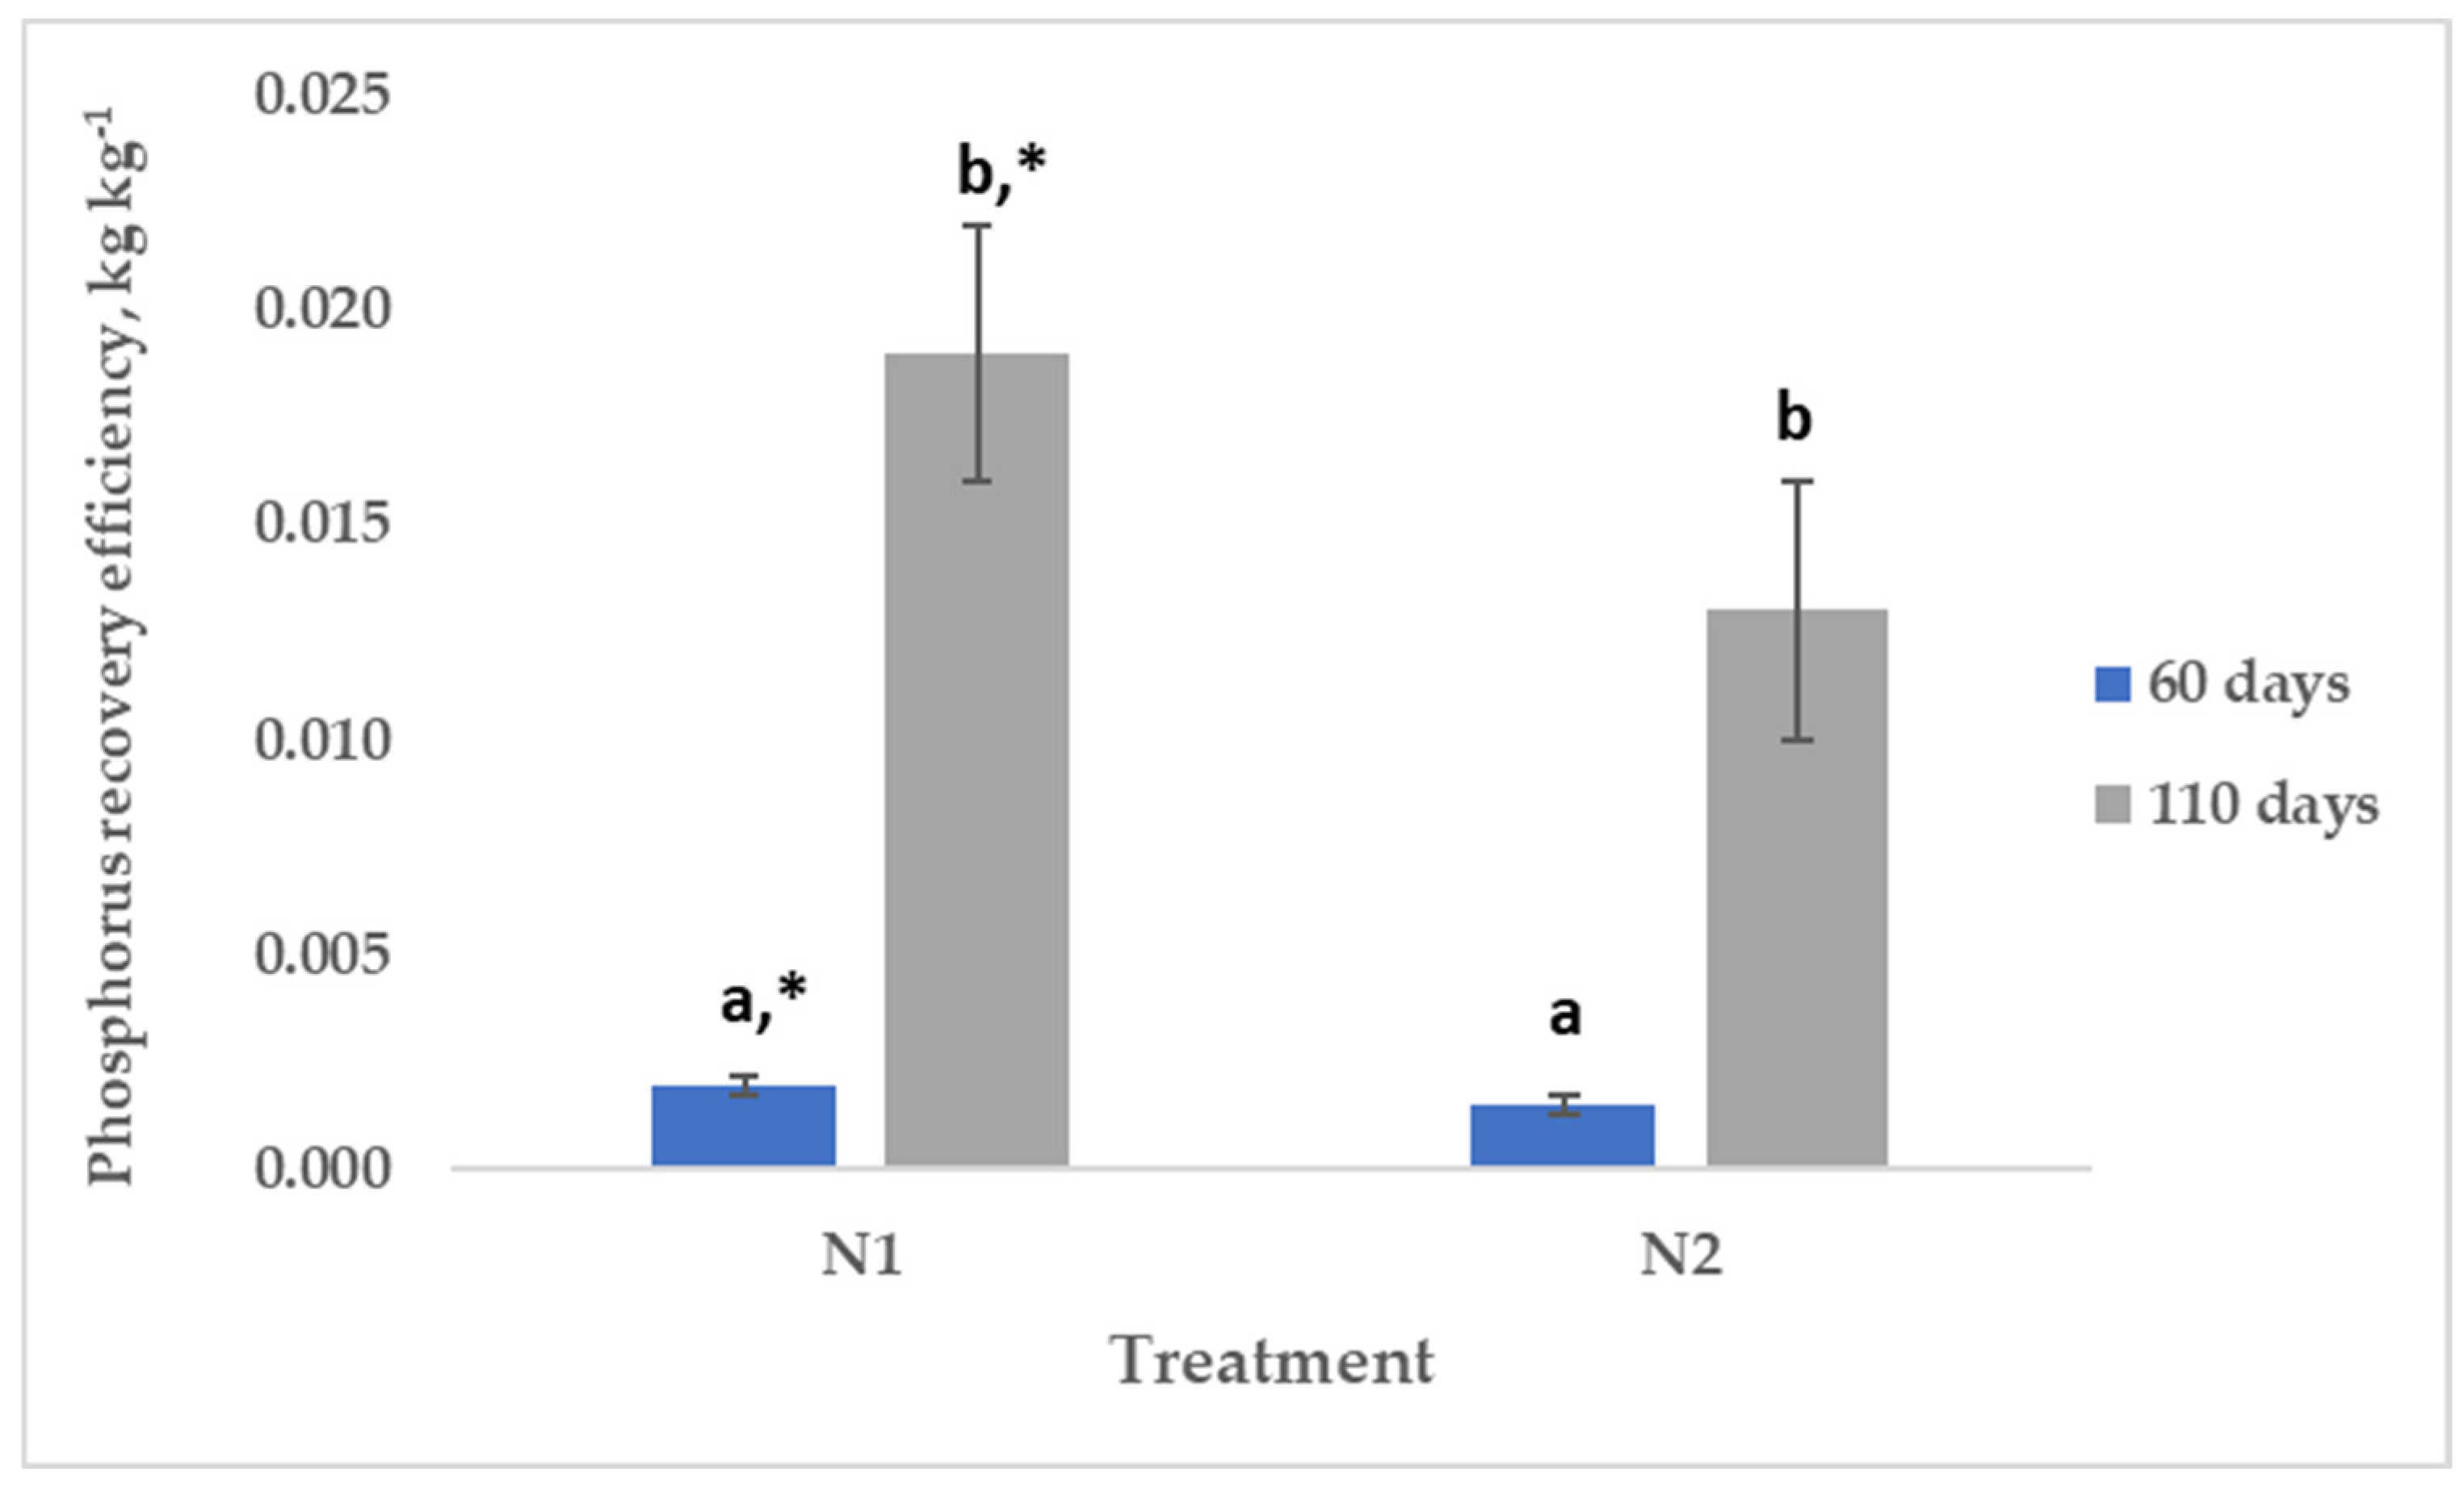
Data related to PFPP and PRE are shown in Figure 6 and Figure 7. The highest values of PFPP (Figure 5) and PRE (Figure 6) were observed in N1 supply at 60 DAT (0.0321 kg/kg−1 and 0.0853 kg/kg−1, respectively), followed by N2 treatment at 110 days. Moreover, in PFPP and PRE indices, statistically significant differences were not only observed between the different fertilization schemes, but also among the different sampling periods for the same fertilized dose.

Figure 6.
P partial factor productivity (PFPP, kg/kg−1) in two different fertilizer schemes. Different letters indicate statistically significant differences between the different days after transplantation in the same fertilization dose. * Indicates statistically significant differences between the different fertilization schemes.

Figure 7.
P recovery efficiency (PRE, kg/kg−1) in two different fertilizer schemes. Different letters indicate statistically significant differences between the different days after transplantation in the same fertilization dose. * Indicates statistically significant differences between the different fertilization schemes.
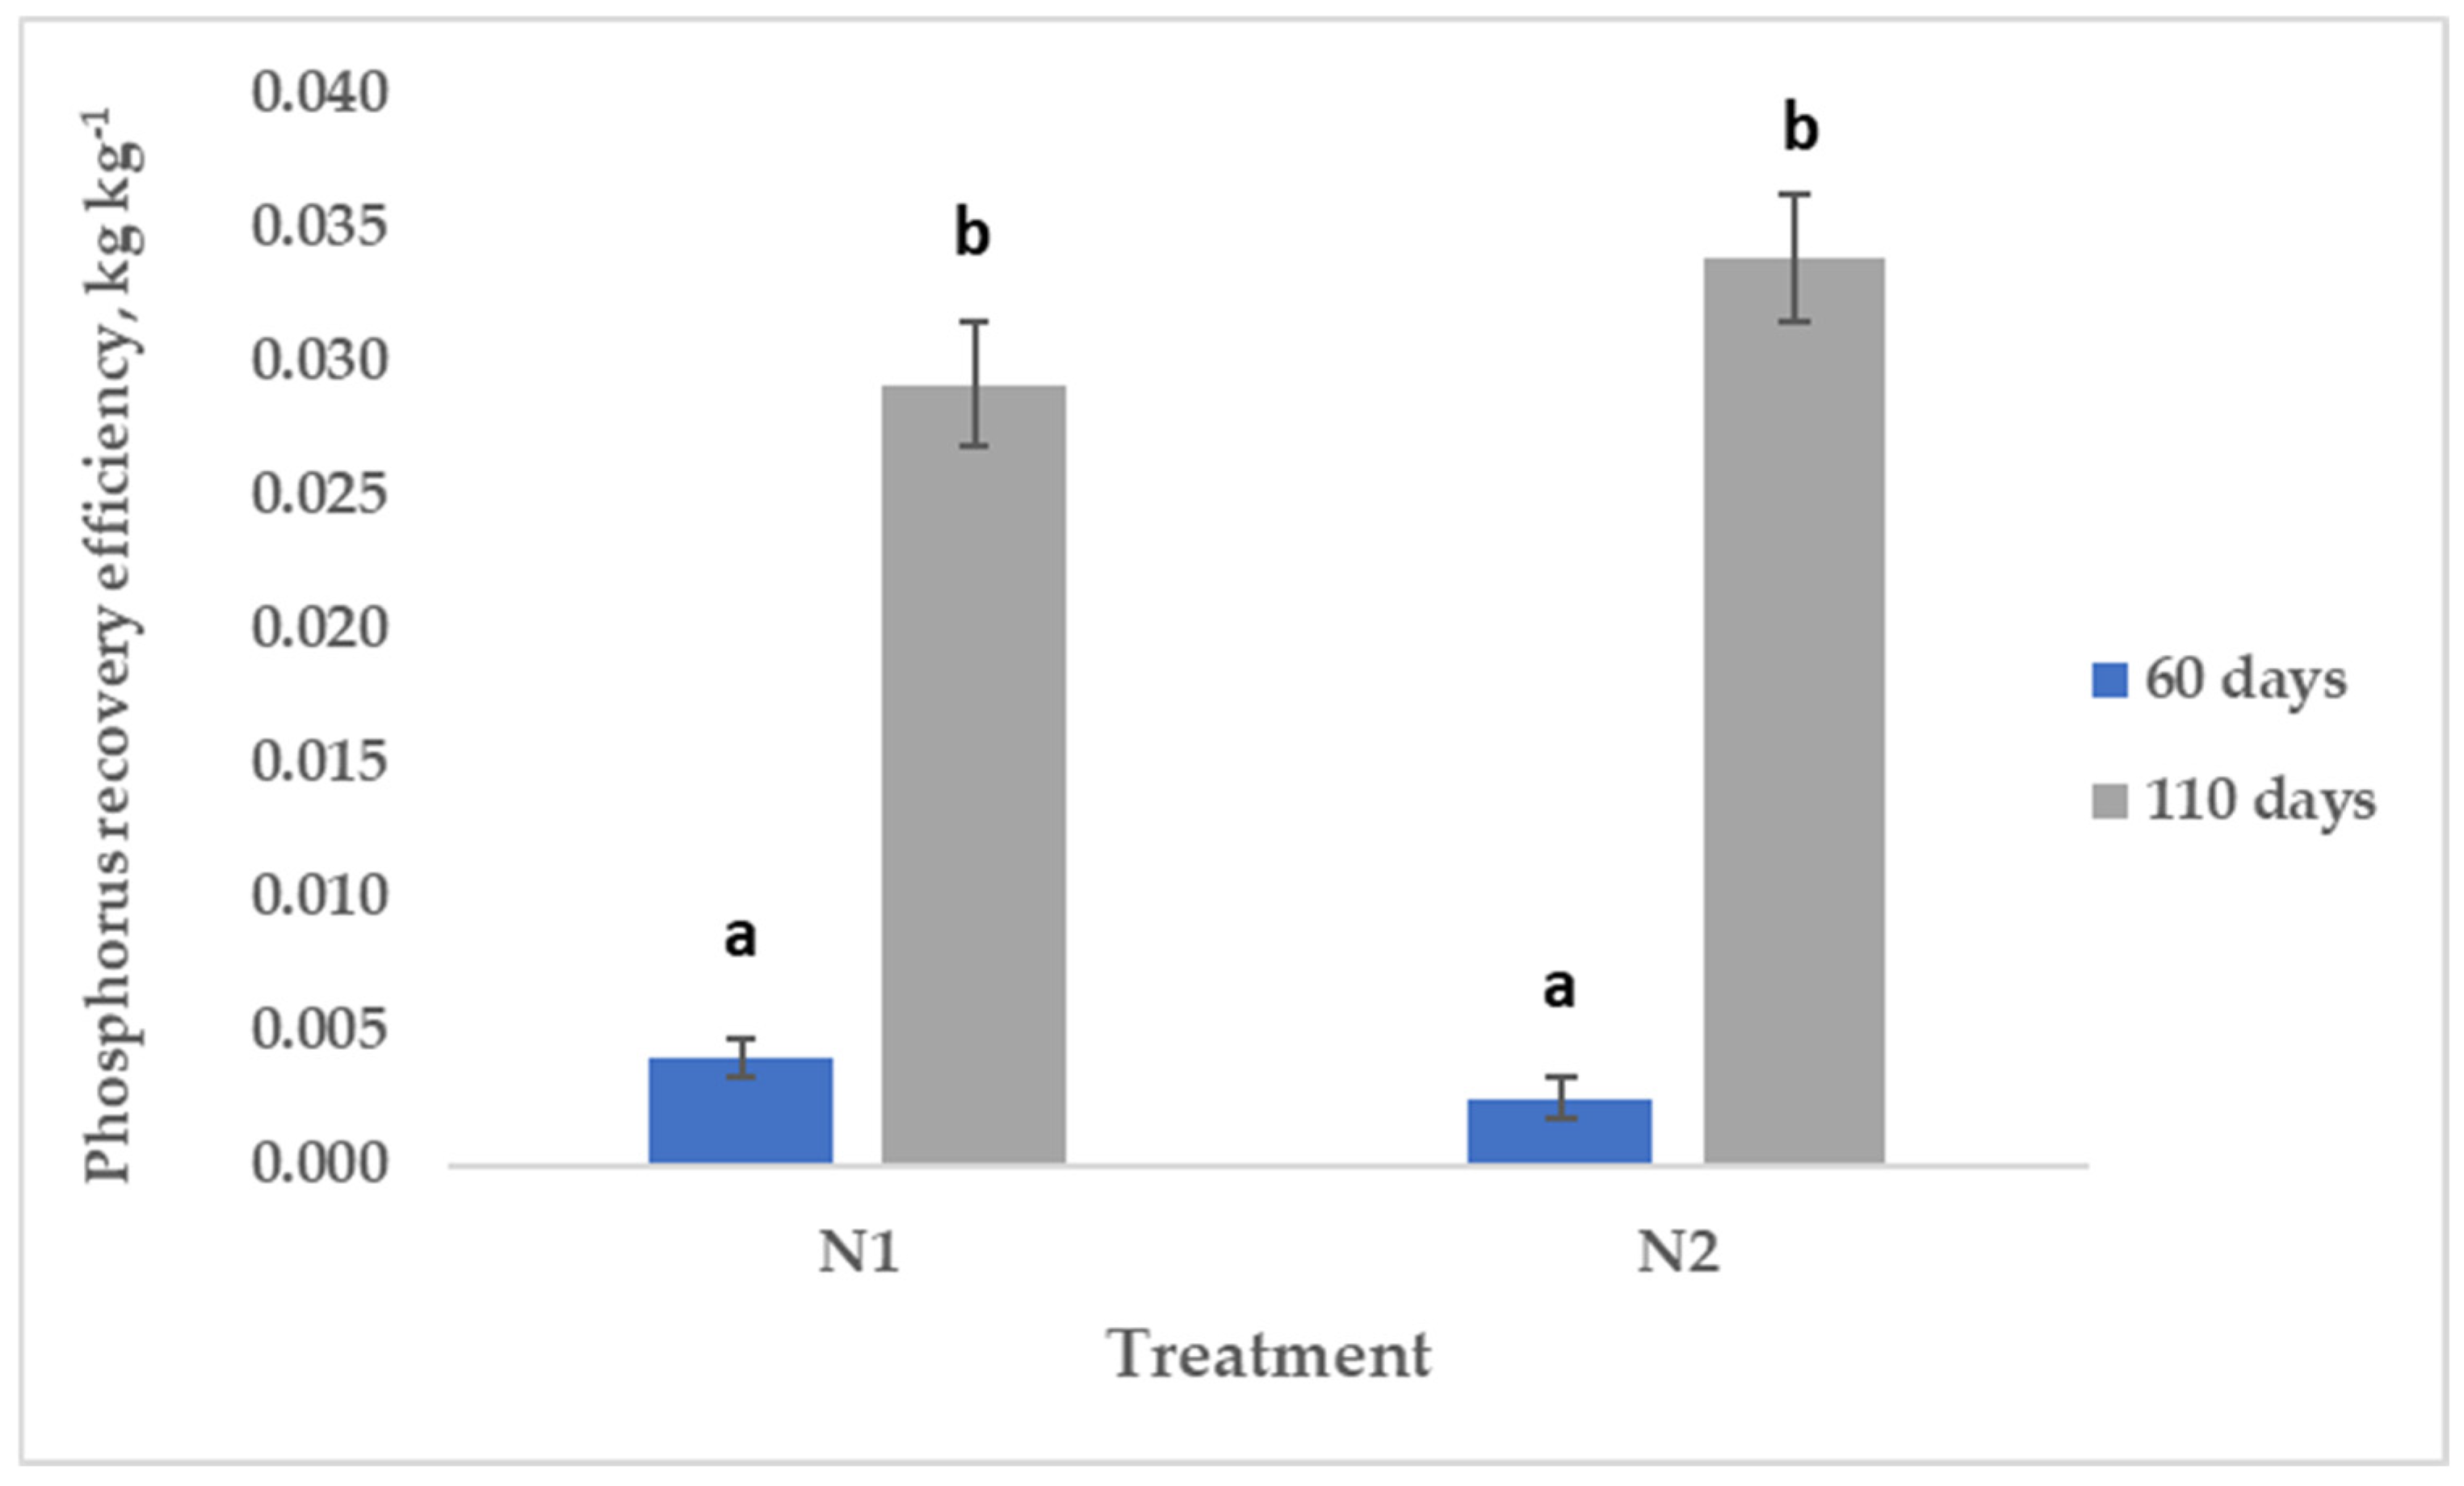
The results concerning PUE are documented in Figure 8. According to the results presented in Figure 7, the phosphorus recovery efficiency was higher in N2 supply (0.0338 kg/kg−1) at 110 DAT than the N1 dose at 60 DAT (0.0291 kg/kg−1). It is remarkable that statistically significant differences were noticed in the different days after transplantation in the same fertilization doses. Comparing the N1 and N2 fertilization schemes, no effects were observed, at both times of sampling (60 and 110 DAT).

Figure 8.
P use efficiency (PUE, kg/kg−1) in two different fertilizer schemes. Different letters indicate statistically significant differences between the different days after transplantation in the same fertilization dose.
4. Discussion
4.1. Total Nitrogen and Phosphorus Content
The study’s findings on the total nitrogen (TN) and phosphorus content of aboveground biomass under varying fertilization schemes offer valuable insights into nutrient dynamics and plant physiological responses over time. In all treatments, the total nitrogen (TN) and phosphorus concentrations were higher 60 days after transplant compared to the content 110 DAT. The reduction in total nitrogen (TN) and phosphorus content at 110 DAT can be explained by the plant’s physiological development. Usually in early growth stages, plants have a rapid vegetative growth, which increases the plants’ demand for nutrients. [38,39,40]. The research which has been conducted on the cultivation of Dittany under organic fertilization schemes is limited. Bilia et al. [41] evaluated five different fertilizer doses (conventional inorganic, semi-organic and a combination of plant extracts as a biostimulant), including two by foliar and three by soil applications. As for the nitrogen content, during the flowering stage, our results are in accordance with their findings in the case of using a conventional inorganic fertilizers and a mixture of plant extracts as a biostimulant by soil application. In harvest time our results were higher, ranging from 49.7 to 73.8%. In the case of phosphorus content, the findings of this study, in the flowering stage, were lower, but higher in the harvest period.
4.2. Nitrogen and Phosphorus Uptake
Nitrogen uptake was significantly influenced by the applied fertilization doses. The N2 scheme consistently showed the highest nitrogen uptake, in both of the two harvest periods. Moreover, a declining trend was observed at 110 DAT in comparison with the values recorded at 60 DAT. That decrease is likely attributed to the reduction in available nitrogen in soil 110 days after transplanting, resulting from prior plant uptake or leaching losses. Moreover, environmental stress factors, such as limited soil moisture or diminishing microbial activity, may have further restricted the plant’s ability to absorb nitrogen [42,43,44].
Regarding the phosphorus uptake, an increase trend was observed 110 days after transplant compared to 60 DAT. That increase was in a range of 89.21% and 88.45% in N1 and N2 treatment, respectively. These findings highlight the crucial role of the applied organic fertilization in promoting phosphorus uptake, likely as a result of enhanced root development and biomass accumulation. During decomposition, the organic fertilizers release organic acids, which play an important role in nutrient dynamics. These acids have the ability to chelate cations that are responsible for binding and limiting phosphorus availability to plants. By binding these cations, the acids prevent phosphorus fixation and through that increase the soluble concentration of phosphorus in the soil and enhance its availability for root uptake, resulting in higher phosphorus absorption by the plants [45,46].
The uptake of nitrogen and phosphorus in Dittany (Origanum dictamnus) cultivation has been explored by Bilia et al. [41], providing a useful point of comparison for the current study. In our investigation, the nitrogen uptake observed across the different fertilization treatments was notably higher than the values reported by Bilias et al. [41], indicating a potential influence of either the fertilization regime used, environmental conditions or agronomic practices applied during our experimental period. On the other hand, phosphorus uptake values results showed a different trend. Specifically, in the case of N1 treatment, our findings closely aligned with those reported by Bilias et al. [41]. This agreement supports the reliability of phosphorus uptake trend in Dittany and highlights the stability of phosphorus dynamics in the crop.
4.3. Nitrogen and Phosphorus Agronomic Indices
Nitrogen and phosphorus indices are essential for assessing how the crops efficiently use these nutrients, enabling more precise fertilizer management. These indices can help productivity improvement, maintain the soil fertility and reduce environmental impacts. Moreover, the use of these indices support balanced fertilization and sustainable farming [47,48]. In this study, the highest NUE was recorded at 110 DAT with a value of 1.279 kg/kg−1, which suggests a prolonged and efficient utilization of nitrogen at higher applications of the used organic fertilizer. Interestingly, a substantial NUE was also observed in N1 treatment at 60 DAT (1.098 kg/kg−1), indicating an early-stage response to moderate nitrogen supply. These results are consistent with previous studies indicating that NUE reaches its highest levels when crops are supplied with optimal nutrient doses [49,50]. The nitrogen agronomic efficiency (NAE) reached its highest levels in the N2 treatment at both 60 and 110 days after transplanting, with respective values of 0.103 and 0.102 kg/kg−1. These consistent results indicate that applying nitrogen in alignment with the crop’s needs for development can effectively support the yield enhancement. Matching nitrogen inputs to periods of high nutrient demand not only improves agronomic efficiency, but also contributes to minimizing nutrient losses to the environment [51,52]. Like the trends observed for NUE and NAE, nitrogen recovery efficiency (NRE) and nitrogen physiological efficiency (NPE) declined with higher nitrogen inputs. The highest values for both these indices were associated with the N1 treatment, and recorded at different stages. NRE peaked at 60 DAT (0.0148 kg/kg−1), while NPE reached its maximum at 110 DAT (50.9 kg/kg−1). These findings indicate that the Ni application dose promotes more efficient uptake and interval utilization of nitrogen by plants. Excess nitrogen input, as seen in N2 treatment, may surpass the assimilation capacity of plants, resulting in losses through mechanisms such as leaching, volatilization or denitrification [52]. The statistically significant differences between N1 and N2 treatments for both NRE and NPE further support this observation. Moreover, the temporal variation in NRE under N1 treatment highlights the influence of crop growth stage on nitrogen recovery, suggesting the need for stage-specific nitrogen management strategies [53]. A study explored how different nitrogen application rates affect maize yield and nitrogen recovery efficiency (NRE) across soils with various fertility. The results showed that NRE increased with nitrogen input up to an optimal point, after which further increases resulted in reduced efficiency. These findings highlight the need to tailor nitrogen application to soil fertility levels in order to maximize nitrogen uptake and minimize losses [54]. Another study investigated how different nitrogen rates influence the physiological responses of wheat. The results showed that moderate nitrogen inputs led to improved NPE, as plants were able to utilize absorbed nitrogen more effectively. However, higher nitrogen doses caused a decline in NPE, potentially due to disruptions in metabolic processes and greater nitrogen loss from the system [55].
Phosphorus (P) is an essential nutrient involved in key plant physiological functions such as energy transfer, signal transmission and the formation of nucleic acids and cellular membranes. Effective phosphorus management is critical for maximizing crop yield while maintaining environmental balance. Phosphorus indices are valuable metrics that can help assess how well crops absorb and utilize the applied fertilizers, guiding more efficient and sustainable fertilization practices [37,56,57]. The assessment of phosphorus indices (PFPP, PRE and PUE) indicated significant differences among fertilizer treatments. The peak values of PFPP and PRE were observed under N2 treatment at 110 DAT, suggesting that the elevated phosphorus supply during this period was efficiently absorbed and used by plants. These findings are consistent with other studies, indicating that providing higher nutrient availability during key developmental stages can significantly improve phosphorus absorption and utilization by crops [58,59].
The assessment of phosphorus efficiency metrics—including partial factor productivity of phosphorus (PFPP), phosphorus recovery efficiency (PRE) and phosphorus use efficiency (PUE)—highlighted significant differences among fertilizer treatments and sampling times. Peak values for both PFPP and PRE were observed under the N2 treatment at 110 days after transplanting (DAT), suggesting that the elevated phosphorus supply during this period was efficiently absorbed and used by the plants. These outcomes align with earlier studies indicating that phosphorus availability during key developmental stages, particularly during reproductive growth, can substantially improve uptake and internal nutrient use efficiency [60]. In the case of PUE, the highest value was observed in N2 treatment at 110 DAT. However, no significant differences were detected in PUE between NI and N2 treatments. This could indicate a threshold effect, in which increasing the phosphorus level beyond a specific rate does not proportionally enhance the utilization of phosphorus by plants. The same findings are in line with the concept that PUE is influenced not just by phosphorus availability, but also by the capacity of plants to assimilate and metabolize the nutrient efficiently [61].
5. Conclusions
This study offers valuable information into uptake and utilization of nitrogen and phosphorus in Dittany cultivation under various fertilization treatments using an organic fertilizer. The results demonstrate that nutrient uptake and efficiency are significantly affected by the amount of fertilization and by the period of harvest. Highest values of total nitrogen and phosphorus were observed 60 days after transplanting. N1 treatment proved the most effective in enhancing nitrogen efficiency indices. On the other hand, phosphorus indices peaked under the higher (N2) treatment dose at 110 DAT.
The findings of this investigation support the notion that surpassing the capacity of plants for nutrient absorption through excessive fertilization may diminish the efficiency and contribute to nutrient losses via leaching or volatilization. This reinforces the importance of a balanced fertilization strategy that considers not only the needs of plants, but also the environmental conditions.
In conclusion, the application of nitrogen and phosphorus indices provides a significant basis for refining nutrient management practices. Such tools can be useful for farmers to regulate fertilization schemes, improve crop performance, ensure soil health and minimize ecological impact. All these can contribute to a sustainable and productive cultivation of medicinal and aromatic plants like Dittany.
While the study presents valuable evidence regarding nutrient efficiency under organic fertilization regimes, the lack of a conventional inorganic fertilizer control group represents a notable limitation, restricting the ability to make comprehensive comparisons. Moreover, the analysis was primarily confirmed to biomass measurements, without an in-depth evaluation of other key vegetative or reproductive parameters. Future investigations should aim to address these gaps by incorporating a broader range of phenological traits, conducting trials across multiple locations and including conventional fertilization as a reference index to enhance the robustness and generalizability of the findings.
Author Contributions
Conceptualization: A.M. and E.S.; methodology: A.M., E.C. and E.S.; validation: A.M., A.F., C.E., E.C. and E.S.; software: A.M., A.F., C.E., E.C. and E.S.; investigation: A.M. and E.S.; data curation: A.M., A.F., C.E., E.C. and E.S.; writing—original draft preparation: A.M., A.F., C.E., E.C. and E.S.; writing—review and editing: A.M., A.F., C.E. and E.S.; supervision: A.M.; project administration: A.M. and E.S. All authors have read and agreed to the published version of the manuscript.
Funding
This research received no external funding.
Data Availability Statement
The original contributions of this study are included in the article. For further inquiries, please contact the corresponding author.
Acknowledgments
We would like to thank Nickolaos Paterakis and Petros Stamatakis for their contribution to the experimental work.
Conflicts of Interest
The authors declare no conflicts of interest.
References
- Liolios, C.C.; Graikou, K.; Skaltsa, E.; Chinou, I. Dittany of Crete: A botanical and ethnopharmacological review. J. Ethnopharmacol. 2010, 131, 229–241. [Google Scholar] [CrossRef]
- Solomou, A.; Fountouli, A.; Molla, A.; Petrakis, M.; Manolikaki, I.; Skoufogianni, E. Ecology, Cultivation, and Utilization of the Dittany of Crete (Origanum dictamnus L.) from Ancient Times to the Present: A Short Review. Agronomy 2024, 14, 1066. [Google Scholar] [CrossRef]
- Assariotakis, A.; Tsimpoukas, K.; Tsoukalas, S.; Oikonomou, G. Prospects of Dittany Cultivation in the Area of Embaros, Heraklion. Techno-Economic Analysis. In Proceedings of the 6th Conference of the Hellenic Society for the Genetics and Breeding of Plants (HSGPB), Florina, Greece, 28–30 September 2016. [Google Scholar]
- Molla, A.; Solomou, A.D.; Fountouli, A.; Chatzikirou, E.; Stamatakis, E.; Stamatakis, P.; Skoufogianni, E. Influence of an Organic Fertilizer on Agronomic Characteristics and Herbaceous Plant Diversity in a Greek Ecosystem: The Case of Cretan Dittany (Origanum dictamnus L.). Nitrogen 2024, 5, 426–438. [Google Scholar] [CrossRef]
- Assariotakis, A. Business Plan for Establishing Vertical Integration Processing Unit for Medicinal and Aromatic Plants in Messara; Herakleion Agricultural University of Athens: Athens, Greece, 2024. [Google Scholar]
- Pigott, C.D.; Taylor, K. The Distribution of Some Woodland Herbs in Relation to the Supply of Nitrogen and Phosphorus in the Soil. J. Anim. Ecol. 1964, 33, 175–185. [Google Scholar] [CrossRef]
- Sharma, T.; Kaur, A.; Saajan, S.; Thakur, R. European Journal of Molecular & Clinical Medicine Effect of nitrogen on growth and yield of medicinal plants: A review paper. Eur. J. Mol. Clin. Med. 2022, 7, 2771–2776. [Google Scholar]
- Zhu, Z.; Liang, Z.; Han, R.; Wang, X. Impact of fertilization on drought response in the medicinal herb Bupleurum chinense DC.: Growth and saikosaponin production. Ind. Crops Prod. 2009, 29, 629–633. [Google Scholar] [CrossRef]
- Chrysargyris, A.; Panayiotou, C.; Tzortzakis, N. Nitrogen and phosphorus levels affected plant growth, essential oil composition and antioxidant status of lavender plant (Lavandula angustifolia Mill.). Ind. Crops Prod. 2016, 83, 577–586. [Google Scholar] [CrossRef]
- Cenk, C.; Dilek, A.; Nevin, E.; Özlem, G. Effect of Potassium and Phosphorus Fertilization on Green Herb Yield and Some Quality Traits of Thymus vulgaris L. Afr. J. Agric. Res. 2012, 7, 6427–6431. [Google Scholar] [CrossRef]
- Basal, M.; Elsherif, H.; Ibrahim, A.; El Hamid, N.A. Environmental studies on different nitrogen fertilizers on growth yield and volatile oil of thyme plant. J. Environ. Sci. 2019, 47, 55–75. [Google Scholar] [CrossRef]
- Norouzi, Y.; Ghobadi, M.; Saeidi, M.; Dogan, H. Effect of Nitrogen and Cytokinin on Quantitative and Qualitative Yield of Thyme (Thymus vulgaris L.). Agrotech. Ind. Crops 2021, 1, 52–60. [Google Scholar] [CrossRef]
- Gandomi, A.; Hazrati, S.; Sharafzadeh, S.; Bazrafshan, F. The response of different fertilizer applications on chamomile production and their quality characteristics. Acta Sci. Pol. Hortorum Cultus 2021, 20, 107–119. [Google Scholar] [CrossRef]
- Ahmed, H.H.; El-Sallami, I.H.; Abdul-Hafeez, E.Y.; Ibrahim, O.H. Response of growth, flowering, nutrient uptake and essential oil of German chamomile to organic nutrition. Assiut J. Agric. Sci. 2022, 53, 78–92. [Google Scholar] [CrossRef]
- Chrysargyris, A.; Tzortzakis, N. Optimizing nitrogen, phosphorus, and potassium requirements to improve Origanum dubium Boiss. growth, nutrient and water use efficiency, essential oil yield and composition. Ind. Crops Prod. 2025, 224, 120291. [Google Scholar] [CrossRef]
- Boveiri Dehsheikh, A.; Mahmoodi Sourestani, M.; Zolfaghari, M.; Enayatizamir, N. Changes in soil microbial activity, essential oil quantity, and quality of Thai basil as response to biofertilizers and humic acid. J. Clean. Prod. 2020, 256, 120439. [Google Scholar] [CrossRef]
- Liu, J.; Liu, M.; Fang, H.; Zhang, Q.; Ruan, J. Accumulation of amino acids and flavonoids in young tea shoots is highly correlated with carbon and nitrogen metabolism in roots and mature leaves. Front. Plant Sci. 2021, 12, 756433. [Google Scholar] [CrossRef]
- Javed, T.; I, I.; Singhal, R.K.; Shabbir, R.; Shah, A.N.; Kumar, P.; Jinger, D.; Dharmappa, P.M.; Shad, M.A.; Saha, D. Recent advances in agronomic and physio-molecular approaches for improving nitrogen use efficiency in crop plants. Front. Plant Sci. 2022, 13, 877544. [Google Scholar] [CrossRef]
- Xia, Z.; Gong, Y.; Yang, Y.; Wu, M.; Bai, J.; Zhang, S.; Lu, H. Effects of root-zone warming, nitrogen supply and their interactions on root-shoot growth, nitrogen uptake and photosynthetic physiological characteristics of maize. Plant Physiol. Biochem. 2024, 214, 108887. [Google Scholar] [CrossRef]
- Aduloju, E.I.; Yahaya, N.; Mohammad Zain, N.; Anuar Kamaruddin, M.; Ariffuddin Abd Hamid, M. An overview on the use of deep eutectic solvents for green extraction of some selected bioactive compounds from natural matrices. Adv. J. Chem. Sect. A 2023, 6, 253–300. [Google Scholar]
- Aslam, M.M.; Karanja, J.K.; Dodd, I.C.; Waseem, M.; Weifeng, X. Rhizosheath: An adaptive root trait to improve plant tolerance to phosphorus and water deficits? Plant Cell Environ. 2022, 45, 2861–2874. [Google Scholar] [CrossRef]
- Khan, F.; Siddique, A.B.; Shabala, S.; Zhou, M.; Zhao, C. Phosphorus plays key roles in regulating plants’ physiological responses to abiotic stresses. Plants 2023, 12, 2861. [Google Scholar] [CrossRef]
- Niu, Y.F.; Chai, R.S.; Jin, G.L.; Wang, H.; Tang, C.X.; Zhang, Y.S. Responses of root architecture development to low phosphorus availability: A review. Ann. Bot. 2012, 112, 391–408. [Google Scholar] [CrossRef]
- Prabhuji, S.K.; Wajih, S.A.; Srivastava, G.K.; Tiwari, R.K. Concept of herbal biofertilizer for cultivation of medicinal plants with high quantity and quality secondary metabolites. Med. Plants-Int. J. Phytomed. Relat. Ind. 2020, 12, 169–172. [Google Scholar]
- Akbari, G.A.; Miri, S.A.; Zeinali, H. Investigating the effects of different cultivation media and biological and mineral fertilizers on the yield and active ingredients of ginger medicinal plant (Zingiber officinale Rosc). J. Med. Plants 2022, 21, 75–86. [Google Scholar] [CrossRef]
- Dasgan, H.Y.; Aldiyab, A.; Elgudayem, F.; Ikiz, B.; Gruda, N.S. Effect of biofertilizers on leaf yield, nitrate amount, mineral content and antioxidants of basil (Ocimum basilicum L.) in a floating culture. Sci. Rep. 2022, 12, 20917. [Google Scholar] [CrossRef] [PubMed]
- Bremner, J.; Sparks, D. Methods of Soil Analysis. Part 3. Chemical Methods; Soil Science Society of America: Madison, WI, USA, 1996; pp. 1085–1121. [Google Scholar]
- Miller, R.O. High-Temperature Oxidation: Dry Ashing. Handbook and Reference Methods for Plant Analysis; Kalra, Y., Ed.; CRC Press: New York, NY, USA, 1998. [Google Scholar]
- Chowdhury, M.A.H.; Sultana, T.; Rahman, M.A.; Chowdhury, T.; Enyoh, C.E.; Saha, B.K.; Qingyue, W. Nitrogen use efficiency and critical leaf N concentration of Aloe vera in urea and diammonium phosphate amended soil. Heliyon 2020, 6, e05718. [Google Scholar] [CrossRef]
- de Oliveira Silva, A.; Ciampitti, I.A.; Slafer, G.A.; Lollato, R.P. Nitrogen utilization efficiency in wheat: A global perspective. Eur. J. Agron. 2020, 114, 126008. [Google Scholar] [CrossRef]
- Vanlauwe, B.; Kihara, J.; Chivenge, P.; Pypers, P.; Coe, R.; Six, J. Agronomic use efficiency of N fertilizer in maize-based systems in sub-Saharan Africa within the context of integrated soil fertility management. Plant Soil 2011, 339, 35–50. [Google Scholar] [CrossRef]
- You, L.; Ros, G.H.; Chen, Y.; Shao, Q.; Young, M.D.; Zhang, F.S.; de Vries, W. Global mean nitrogen recovery efficiency in croplands can be enhanced by optimal nutrient, crop and soil management practices. Nat. Commun. 2023, 14, 5747. [Google Scholar] [CrossRef]
- Jiang, L.; Dai, T.; Jiang, D.; Cao, W.; Gan, X.; Wei, S. Characterizing physiological N-use efficiency as influenced by nitrogen management in three rice cultivars. Field Crops Res. 2004, 88, 239–250. [Google Scholar] [CrossRef]
- Dobermann, A.R. Nitrogen Use Efficiency-State of the Art; Agronomy—Faculty Publications: Lincoln, NE, USA, 2005; p. 316. [Google Scholar]
- Roberts, T.L.; Johnston, A.E. Phosphorus use efficiency and management in agriculture. Resour. Conserv. Recycl. 2015, 105, 275–281. [Google Scholar] [CrossRef]
- MacDonald, G.K.; Bennett, E.M.; Potter, P.A.; Ramankutty, N. Agronomic phosphorus imbalances across the world’s croplands. Proc. Natl. Acad. Sci. USA 2011, 108, 3086–3091. [Google Scholar] [CrossRef]
- Ahmed, W.; Liu, K.; Qaswar, M.; Huang, J.; Huang, Q.; Xu, Y.; Ali, S.; Mehmood, S.; Ammar Asghar, R.M.; Mahmood, M.; et al. Long-Term Mineral Fertilization Improved the Grain Yield and Phosphorus Use Efficiency by Changing Soil P Fractions in Ferralic Cambisol. Agronomy 2019, 9, 784. [Google Scholar] [CrossRef]
- Zhao, Q.; Wang, P.; Smith, G.R.; Hu, L.; Liu, X.; Tao, T.; Ma, M.; Averill, C.; Freschet, G.T.; Crowther, T.W.; et al. Nitrogen redistribution and seasonal trait fluctuation facilitate plant N conservation and ecosystem N retention. J. Ecol. 2024, 112, 501–513. [Google Scholar] [CrossRef]
- Wang, Z.; Gong, H.; Sardans, J.; Zhou, Q.; Deng, J.; Niklas, K.J.; Hu, H.; Li, Y.; Ma, Z.; Mipam, T.D.; et al. Divergent nitrogen and phosphorus allocation strategies in terrestrial plant leaves and fine roots: A global meta-analysis. J. Ecol. 2022, 110, 2745–2758. [Google Scholar] [CrossRef]
- Tang, Z.; Xu, W.; Zhou, G.; Bai, Y.; Li, J.; Tang, X.; Chen, D.; Liu, Q.; Ma, W.; Xiong, G.; et al. Patterns of plant carbon, nitrogen, and phosphorus concentration in relation to productivity in China’s terrestrial ecosystems. Proc. Natl. Acad. Sci. USA 2018, 115, 4033–4038. [Google Scholar] [CrossRef] [PubMed]
- Bilias, F.; Ipsilantis, I.; Samara, E.; Tsoktouridis, G.; Glavakis, E.; Grigoriadou, K.; Krigas, N.; Matsi, T. From the wild to the field: Effect of foliar or soil application of inorganic or semi-organic fertilizers on various parameters of four local endemic plant species of Crete (Greece). Braz. J. Bot. 2023, 46, 319–336. [Google Scholar] [CrossRef]
- Cameron, K.C.; Di, H.J.; Moir, J.L. Nitrogen losses from the soil/plant system: A review. Ann. Appl. Biol. 2013, 162, 145–173. [Google Scholar] [CrossRef]
- Musyoka, M.W.; Adamtey, N.; Muriuki, A.W.; Bautze, D.; Karanja, E.N.; Mucheru-Muna, M.; Fiaboe, K.K.M.; Cadisch, G. Nitrogen leaching losses and balances in conventional and organic farming systems in Kenya. Nutr. Cycl. Agroecosyst. 2019, 114, 237–260. [Google Scholar] [CrossRef]
- Mahmud, K.; Panday, D.; Mergoum, A.; Missaoui, A. Nitrogen Losses and Potential Mitigation Strategies for a Sustainable Agroecosystem. Sustainability 2021, 13, 2400. [Google Scholar] [CrossRef]
- He, W.; Zhang, J.; Gao, W.; Chen, Y.; Wei, Z. Enhancing phosphorus availability and dynamics in acidic soils through Rice straw biochar application: A sustainable alternative to chemical fertilizers. Front. Sustain. Food Syst. 2025, 9, 1506609. [Google Scholar] [CrossRef]
- Jin, J.; Fang, Y.; He, S.; Liu, Y.; Liu, C.; Li, F.; Khan, S.; Eltohamy, K.M.; Liu, B.; Liang, X. Improved phosphorus availability and reduced degree of phosphorus saturation by biochar-blended organic fertilizer addition to agricultural field soils. Chemosphere 2023, 317, 137809. [Google Scholar] [CrossRef]
- Folina, A.; Tataridas, A.; Mavroeidis, A.; Kousta, A.; Katsenios, N.; Efthimiadou, A.; Travlos, I.S.; Roussis, I.; Darawsheh, M.K.; Papastylianou, P.; et al. Evaluation of Various Nitrogen Indices in N-Fertilizers with Inhibitors in Field Crops: A Review. Agronomy 2021, 11, 418. [Google Scholar] [CrossRef]
- Mazur, P.; Gozdowski, D.; Wójcik-Gront, E. Soil Electrical Conductivity and Satellite-Derived Vegetation Indices for Evaluation of Phosphorus, Potassium and Magnesium Content, pH, and Delineation of Within-Field Management Zones. Agriculture 2022, 12, 883. [Google Scholar] [CrossRef]
- Xu, G.; Fan, X.; Miller, A.J. Plant Nitrogen Assimilation and Use Efficiency. Annu. Rev. Plant Biol. 2012, 63, 153–182. [Google Scholar] [CrossRef] [PubMed]
- Vaziritabar, Y.; Frei, M.; Yan, F.; Vaziritabar, Y.; Honermeier, B. Enhancing nitrogen use efficiency and plant productivity in long-term precrop/crop rotation and fertilization management. Field Crops Res. 2024, 306, 109210. [Google Scholar] [CrossRef]
- Montemurro, F.; Diacono, M. Towards a Better Understanding of Agronomic Efficiency of Nitrogen: Assessment and Improvement Strategies. Agronomy 2016, 6, 31. [Google Scholar] [CrossRef]
- Fageria, N.K.; Baligar, V.C. Enhancing Nitrogen Use Efficiency in Crop Plants. In Advances in Agronomy; Academic Press: Cambridge, MA, USA, 2005; Volume 88, pp. 97–185. [Google Scholar]
- Kongchum, M.; Harrell, D.L.; Ahmed, A.; Adotey, N.; Leonards, J.; Fluitt, J. Nitrogen fertilization timing and rate influence N recovery efficiency and rice yield. Agron. J. 2024, 116, 3231–3239. [Google Scholar] [CrossRef]
- Zou, H.; Li, D.; Ren, K.; Liu, L.; Zhang, W.; Duan, Y.; Lu, C. Response of maize yield and nitrogen recovery efficiency to nitrogen fertilizer application in field with various soil fertility. Front. Plant Sci. 2024, 15, 1349180. [Google Scholar] [CrossRef]
- Flores-Saavedra, M.; Villanueva, G.; Gramazio, P.; Vilanova, S.; Mauceri, A.; Abenavoli, M.R.; Sunseri, F.; Prohens, J.; Plazas, M. Nitrogen use efficiency, growth and physiological parameters in different tomato genotypes under high and low N fertilisation conditions. Plant Physiol. Biochem. 2024, 208, 108447. [Google Scholar] [CrossRef]
- Smol, M. The importance of sustainable phosphorus management in the circular economy (CE) model: The Polish case study. J. Mater. Cycles Waste Manag. 2019, 21, 227–238. [Google Scholar] [CrossRef]
- Serna, J.; Bergwitz, C. Importance of Dietary Phosphorus for Bone Metabolism and Healthy Aging. Nutrients 2020, 12, 3001. [Google Scholar] [CrossRef]
- Zhang, D.; Zhang, C.; Tang, X.; Li, H.; Zhang, F.; Rengel, Z.; Whalley, W.R.; Davies, W.J.; Shen, J. Increased soil phosphorus availability induced by faba bean root exudation stimulates root growth and phosphorus uptake in neighbouring maize. New Phytol. 2016, 209, 823–831. [Google Scholar] [CrossRef]
- Heuer, S.; Gaxiola, R.; Schilling, R.; Herrera-Estrella, L.; López-Arredondo, D.; Wissuwa, M.; Delhaize, E.; Rouached, H. Improving phosphorus use efficiency: A complex trait with emerging opportunities. Plant J. 2017, 90, 868–885. [Google Scholar] [CrossRef]
- Richardson, A.E.; Lynch, J.P.; Ryan, P.R.; Delhaize, E.; Smith, F.A.; Smith, S.E.; Harvey, P.R.; Ryan, M.H.; Veneklaas, E.J.; Lambers, H.; et al. Plant and microbial strategies to improve the phosphorus efficiency of agriculture. Plant Soil 2011, 349, 121–156. [Google Scholar] [CrossRef]
- Veneklaas, E.J.; Lambers, H.; Bragg, J.; Finnegan, P.M.; Lovelock, C.E.; Plaxton, W.C.; Price, C.A.; Scheible, W.-R.; Shane, M.W.; White, P.J.; et al. Opportunities for improving phosphorus-use efficiency in crop plants. New Phytol. 2012, 195, 306–320. [Google Scholar] [CrossRef]


Disclaimer/Publisher’s Note: The statements, opinions and data contained in all publications are solely those of the individual author(s) and contributor(s) and not of MDPI and/or the editor(s). MDPI and/or the editor(s) disclaim responsibility for any injury to people or property resulting from any ideas, methods, instructions or products referred to in the content. |
© 2025 by the authors. Licensee MDPI, Basel, Switzerland. This article is an open access article distributed under the terms and conditions of the Creative Commons Attribution (CC BY) license (https://creativecommons.org/licenses/by/4.0/).