Article

Unraveling Carbon and Nitrogen Dynamics in Cattle Manure: New Insights from Litterbag Incubation

1
SAS, INRAE, Institut Agro, F-35000 Rennes, France
2
INRAE, LSE, Université de Lorraine, F-54000 Nancy, France
*
Author to whom correspondence should be addressed.
Nitrogen 2025, 6(3), 56; https://doi.org/10.3390/nitrogen6030056
Submission received: 11 June 2025 / Revised: 6 July 2025 / Accepted: 9 July 2025 / Published: 11 July 2025

Abstract

Management of livestock manure is a major concern due to its environmental impacts; consequently, laboratory-based incubations aim to quantify the C and N mineralization of organic matter (OM) to assess its potential to supply OM to soils. However, they can be limited by methodological constraints, notably the drying process of organic products. While litterbag experiments allow in situ decomposition of OM to be monitored, they often focus only on mass loss on a dry matter basis, which may overestimate biodegradation rates. To address these limitations, we designed an experiment that combined the measurement of material fluxes with the characterization of OM using transmission electron microscopy. Raw and dried farmyard cattle manure were incorporated into the soil and incubated in litterbags (200 µm mesh) for 301 days. The results demonstrated that drying significantly altered the biochemical composition of the cattle manure and influenced its microbial dynamics at the beginning of the incubation. However, this alteration did not influence the C mineralization rate at the end of incubation. Biodegradation alone could not explain C losses from litterbags after day 112 of incubation, which supports the assertion that physical and biological processes transferred large amounts of matter from the litterbags to the soil. These results highlight the importance of conditioning samples before laboratory incubations.

1. Introduction

As one of the leading livestock farming countries in Europe, France contributes greatly to the estimated 1400 million t of livestock manure produced annually in the European Union [1]. More specifically, farmyard cattle manure (FYM) accounts for 87 million of the 109 million t of animal waste spread each year in France [2]. Management of livestock manure is a major concern due to its environmental impacts, particularly related to water pollution, ammonia emissions, and greenhouse gas emissions. The magnitude of these impacts is closely related to cropping systems, as are the composition and fate of the elements supplied to the soil [3,4]. Knowing how they mineralize after they have been added to the soil is of great interest to determine the availability of fertilizing elements, especially N, and their effects on organic matter (OM) dynamics and carbon (C) storage.
In this way, laboratory-based incubation experiments make it possible to trace the dynamics of CO2 released from a substrate, with many variables being tested, including various amendments; inoculation of microorganisms targeted at certain degradation functions; and physical parameters such as temperature, water content, or OM availability. Monitoring these conditions thus makes it possible to assess the turnover of OM [5], as well as its amendment or fertilizer value. Combined with biochemical analyses of OM, mineralization dynamics allows one to predict the behavior of products likely to be incorporated into the soil in a sustainable manner, and thus maintain soil OM stocks, by calculating the IROC indicator for OM stability [6]. Different methods are used based on sequential chemical extraction of OM fractions that differ in their characteristics and thus degradability [7,8]. The results obtained make it possible to classify products according to their suitability for degradation [9,10,11], with the aim of storing C in soils [6] and modeling C and nitrogen (N) dynamics [12].
However, as part of a standard-setting approach, dried products are incubated since doing so simplifies the operating procedure of French standard FD U44-163 [13], even though it is known that drying causes large amounts of ammoniacal N to be lost. The effects of drying on the biochemical composition of OM, on the other hand, are not well documented, but they may be strong and thus bias the assessment of biodegradation. This hypothesis is based on the strong effects of soil drying on soil OM mineralization dynamics. In fact, Kaiser et al. (2015) [14] observed that air drying followed by rewetting can influence the conclusions of OM decomposition experiments since one of the main effects of drying is to kill a large proportion of soil microorganisms [15]. Fungi seem to resist and survive periods of low water content better than bacteria do [16]. The ability of microorganisms to survive fluctuations in water content and maintain their activity influences the rate of OM decomposition, the input of microbial-derived OM to the soil solution, and even the extent to which microbial tissues contribute to different fractions of soil OM [14].
Another limitation of the FD U44-163 method for incubating organic products is that it is based on measuring the mineralization of C-CO2 from the respiration of microorganisms, which is an indirect measure of biodegradation that does not monitor changes in OM composition. Litterbag experiments, on the other hand, can do this and have been employed intensively since they were first used in soil biology by [17] to investigate the decomposition of a wide variety of litter, ecosystems (forests, grasslands, and agricultural fields), and cropping patterns [18]. Litterbags of different mesh sizes, which can exclude or provide access to microfauna, mesofauna, and macrofauna, have been widely used to characterize the effects of certain groups, such as springtails and mites, on biodegradation [18,19,20,21,22]. Litterbag experiments have been widely used because they are simple to implement and inexpensive [18], but their results can be influenced by contamination by soil particles, which has led some scientists to attempt to rectify this bias. In particular, [23] adjusted the results by analyzing the aluminum content, which is assumed to remain constant throughout an experiment.
On the other hand, litterbag experiments often measure only mass loss on a dry matter (DM) basis and implicitly attribute it to biodegradation. This raises some methodological questions since other processes are likely to contribute to changes in the residual amount of product, which explains why studies can obtain contradictory results for DM loss and C loss [21]. The meta-analysis of [24] also concluded that there was decoupling between mass loss, which was higher when macrofauna were present, and C mineralization, which was the same with or without macrofauna. Matter inputs and outputs of mesofauna and macrofauna are reported in large-mesh litterbag studies. The authors of [21] observed an increase in N in litterbags with a 2 mm mesh size, which they explained by mesofauna transporting fecal material with a high N content into litterbags. The authors of [25] explained the increase in N observed during the biodegradation of wheat straw in 1 mm litterbags by fungi translocating N via their hyphal networks [26]. Leaching of soluble elements was also observed in litterbags outdoors, which resulted in the loss of nitrate N [27] and/or soluble organic compounds [28].
Faced with these limitations and the utility of detailing C mineralization, we designed an experiment to address two methodological questions: (i) Are the losses of matter measured in a litterbag experiment performed under conditions that exclude macrofauna and under controlled conditions due entirely to biodegradation, or are other processes involved? (ii) Does drying an organic product influence the transformation of its OM when incorporated into the soil or placed in a litterbag?
The experiment consisted of performing parallel incubation of raw and dried farmyard cattle manure either incorporated into the soil or placed in litterbags. We were thus able to characterize the degradation of OM in FYM by relating its mineralization to the dynamics of either manure OM or microbial activity. To this end, we assessed these processes by (i) tracing CO2 dynamics, (ii) describing dynamics of DM, C, and N in litterbags, and (iii) identifying the characteristics and degradation of OM by specifying its microbial potential using transmission electron microscopy (TEM). We discuss these results to clarify how cattle manure mineralizes in laboratory tests and field applications.

2. Materials and Methods

2.1. Farmyard Cattle Manure Sampling

FYM produced from barley straw bedding was collected from a manure pile that had been stored for several months on an open-air concrete platform. After collection, FYM was immediately frozen at −18 °C, ground frozen in a blender (Blixer® 5 Plus, Robot Coupe, Vincennes, France), and sub-sampled to create (i) a sub-sample dried in the oven at 40 °C for 4 days and (ii) a sub-sample returned to the freezer at −18 °C until the incubation experiment. With this approach, the raw and dried FYM had the same particle size since they differed only in the drying. The dried FYM was stored for a few weeks at 15 °C before the experiment. The DM content of FYM measured after being dried at 103 °C [29] was 305 g kg−1 raw FYM.

2.2. Analysis of the Composition of Farmyard Cattle Manure

The organic C content of the dried FYM was measured by elemental analysis [30]. The organic C content of the raw FYM was also measured by elemental analysis (Thermo Flash 2000 nc analyzer, Thermo Fischer Scientific, Waltham, MA, USA), with three replicates, after pre-treating the sample with Chromosorb® (method developed internally). Total N and ammoniacal N contents of the raw and dried FYM were determined using the Kjeldahl method and direct distillation [31], respectively, with five replicates.
Biochemical composition was determined using dried FYM ground to 1 mm, according to the Van Soest method [7,31]. Soluble (SOL), hemicellulose (HEM), cellulose (CEL), and lignin-like (LIC) fractions were determined using crude-fiber analysis according to standard FD U44-163 [13]. The FYM composition was 265, 193, 347, and 195 g kg−1 OM for the SOL, HEM, CEL, and LIC fractions, respectively. The IROC indicator, which indicates the potential amount of residual C in a soil after application of exogenous OM [6], equaled 45.8.

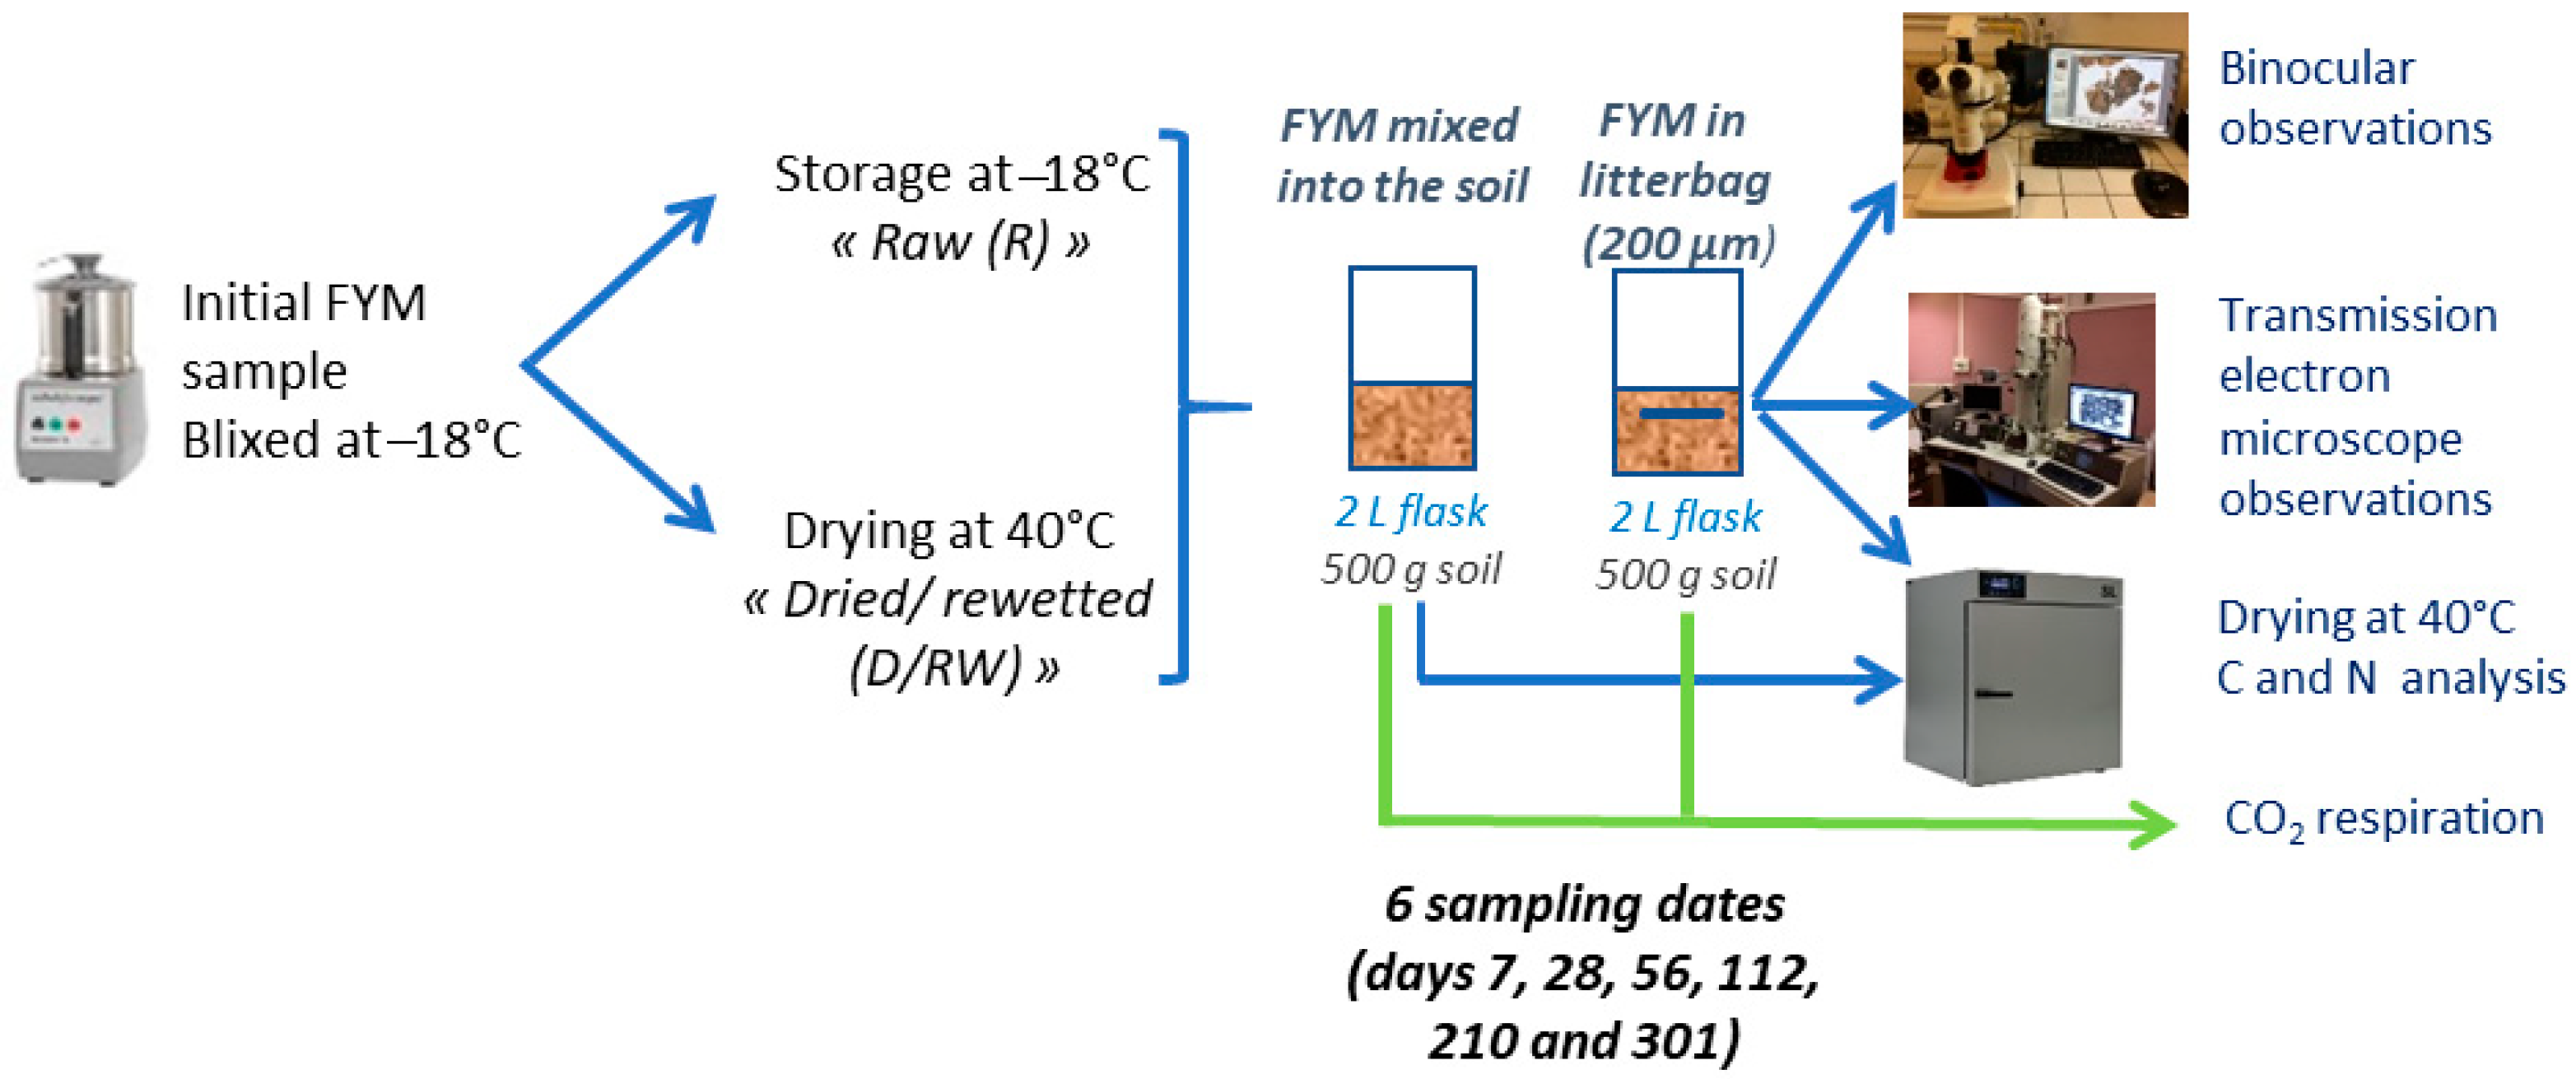
2.3. Design of the Incubation Experiment

The soil used for the incubation was a luvisol (aeolian loam on schist bedrock) [32] and was sampled at the EFELE site, which is one the experimental sites of the SOERE PRO network [33]. It was sampled from the surface layer (0−25 cm), sieved (<5 mm), moistened to a matrix potential of −0.05 MPa, and stored at 15 °C for 2 weeks before incubation. Its main properties were 151 mg clay g−1, 711 mg silt g−1, 138 mg sand g−1, no CaCO3, pH of 6.2, organic C content of 11 mg g−1, and organic N content of 1.2 mg g−1.
Litterbags (7 cm × 7 cm), constructed from 200 µm mesh nylon cloth, were filled with manure a few minutes before incubation began. Raw FYM (R) samples were thawed at 4 °C for several hours before the experiment, while dried FYM (D/RW) samples were rewetted to the water content of the raw FYM immediately before placing them in the litterbags. The amount of R and D/RW placed in each bag (3.66 g on a DM basis) was based on an input equivalent to 30 t ha−1 of raw FYM, which corresponds to an agronomic application rate.
The litterbags were placed in 2 L glass flasks filled with 500 g equivalents of dry soil, with six replicates, and sampled on six dates: 7, 28, 56, 112, 210, and 301 days of incubation. The litterbags were buried in the soil to a depth of ca. 3 cm, and the covering soil was slightly compacted to increase soil contact with the litterbag. On each date, the litterbags were carefully removed and brushed clean before they were opened to avoid contamination by soil. Three replicates were dried at 40 °C and ground to fine homogeneous powder in a planetary ball mill (RS 100, Retsc Gmbh, Haan, Germany) for elemental analysis of C and N contents, while the other three replicates were used for TEM analysis.
C mineralization of the FYM was measured during soil incubation at 15.0 ± 0.5 °C for 301 days. A control soil without FYM was also set up to quantify soil C mineralization. In parallel, conventional soil incubation [11] was performed with three replicates, with FYM (3.66 g on a DM basis) homogeneously mixed with soil samples (500 g equivalents of dry soil in 2 L glass jars) to assess the potential limiting effect of enclosing FYM in a litterbag on biodegradation. See Figure 1 for a flowchart of steps of the experiment.
Soil water content was maintained at a matrix potential of −0.05 MPa by adding deionized water if necessary. The CO2 released by soil was trapped in 20 mL NaOH 1 M in a beaker placed at the bottom of the jar; the jars were aerated regularly and the CO2 traps renewed. The carbonate content of the CO2 traps was then analyzed by back titration with HCl [34].

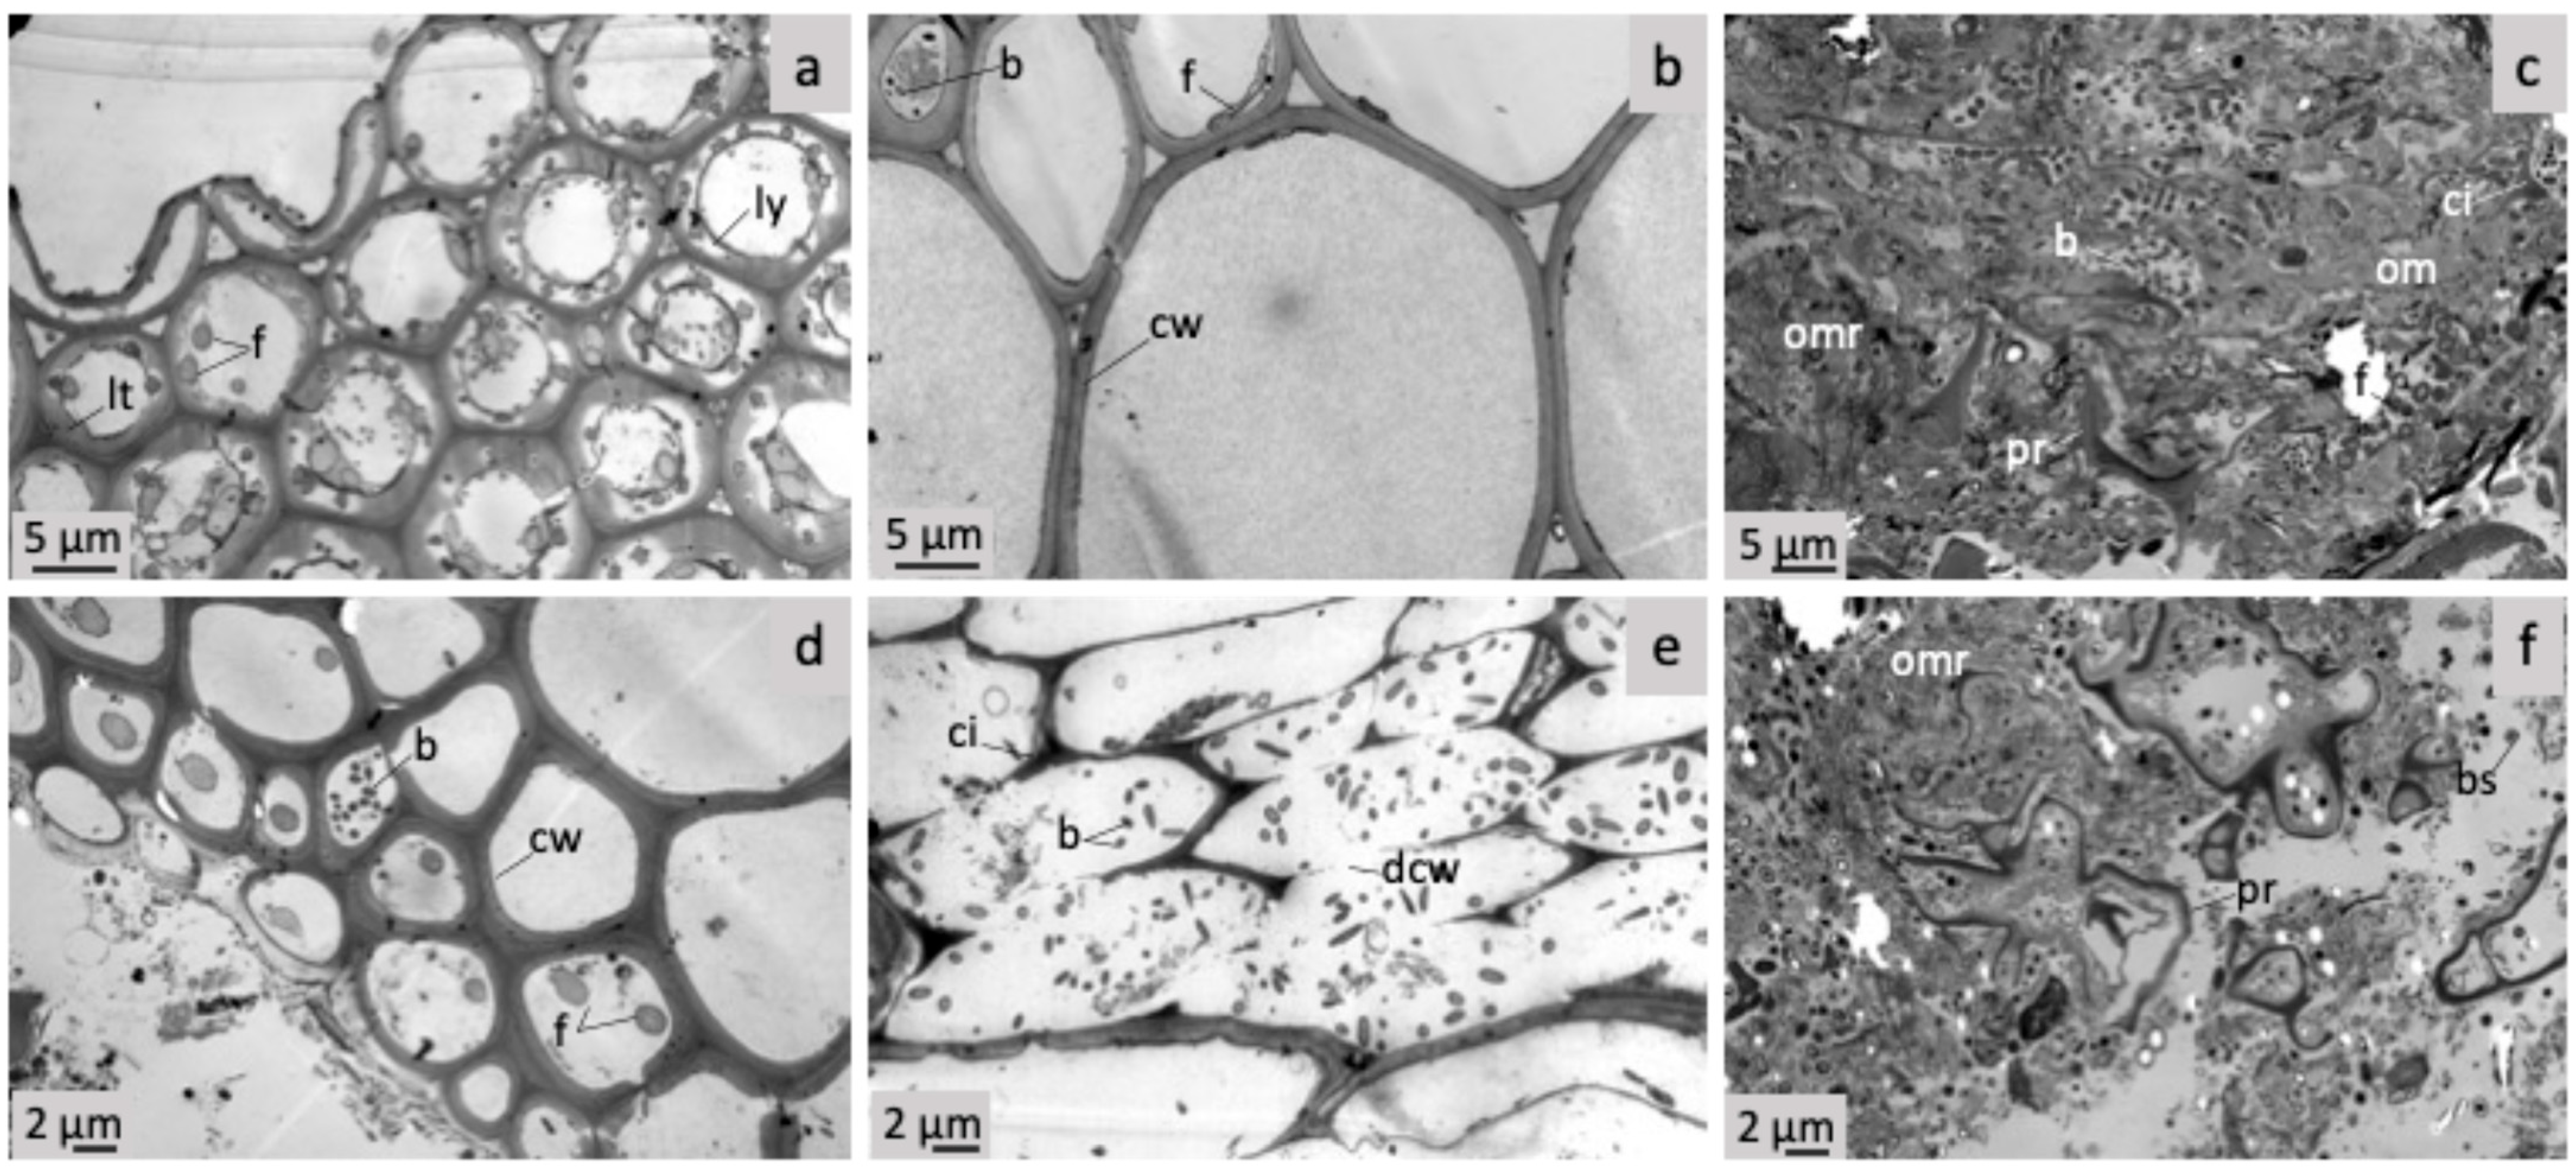
2.4. Transmission Electron Microscopy

Three replicates of initial R or D/RW FYM and FYM incubated for 28, 56, 112, 210, and 301 days were observed using a binocular magnifying glass to assess their heterogeneity. Then, 15–20 sub-samples of each type of FYM, corresponding to plant fragments or the fine fraction, were then prepared for analysis by TEM. Sub-samples of a few mm3 were fixed in 2% (w/v) osmium tetroxide in a cacodylate buffer (pH = 7) for 1 h, dehydrated in graded acetone series, and embedded in epoxy resin (Epon 812, Euromedex, Souffelweyersheim, France) until polymerization was completed. Once polymerized, 10–30 ultra-thin sections (80–100 nm each) were cut with an ultramicrotome (Leica UltracutS®, Leica Biosystems, Paris, France) and set on Cu-grids. Ultra-thin sections were then stained for TEM with uranyl acetate and lead citrate and examined with a transmission electron microscope (1200 EMXII, JEOL- JEOL France, Paris, operated at 80 kV). TEM was used to assess the observation frequency of relevant microstructures of the FYM. To this end, the morphology of FYM components was characterized using TEM for at least 3 replicates of each sub-sample. This approach also identified types of OM, determined their biodegradation rates and assessed their microbial potential by assessing their observation frequency, physiological state (e.g., alive, dead, and spores), and degradation activity by observing areas of plant cell lysis [35].

3. Results

3.1. Farmyard Cattle Manure Organic Matter Composition

Organic C and N amounts and N-NH4 contents of both farmyard cattle manure varied (Table 1).

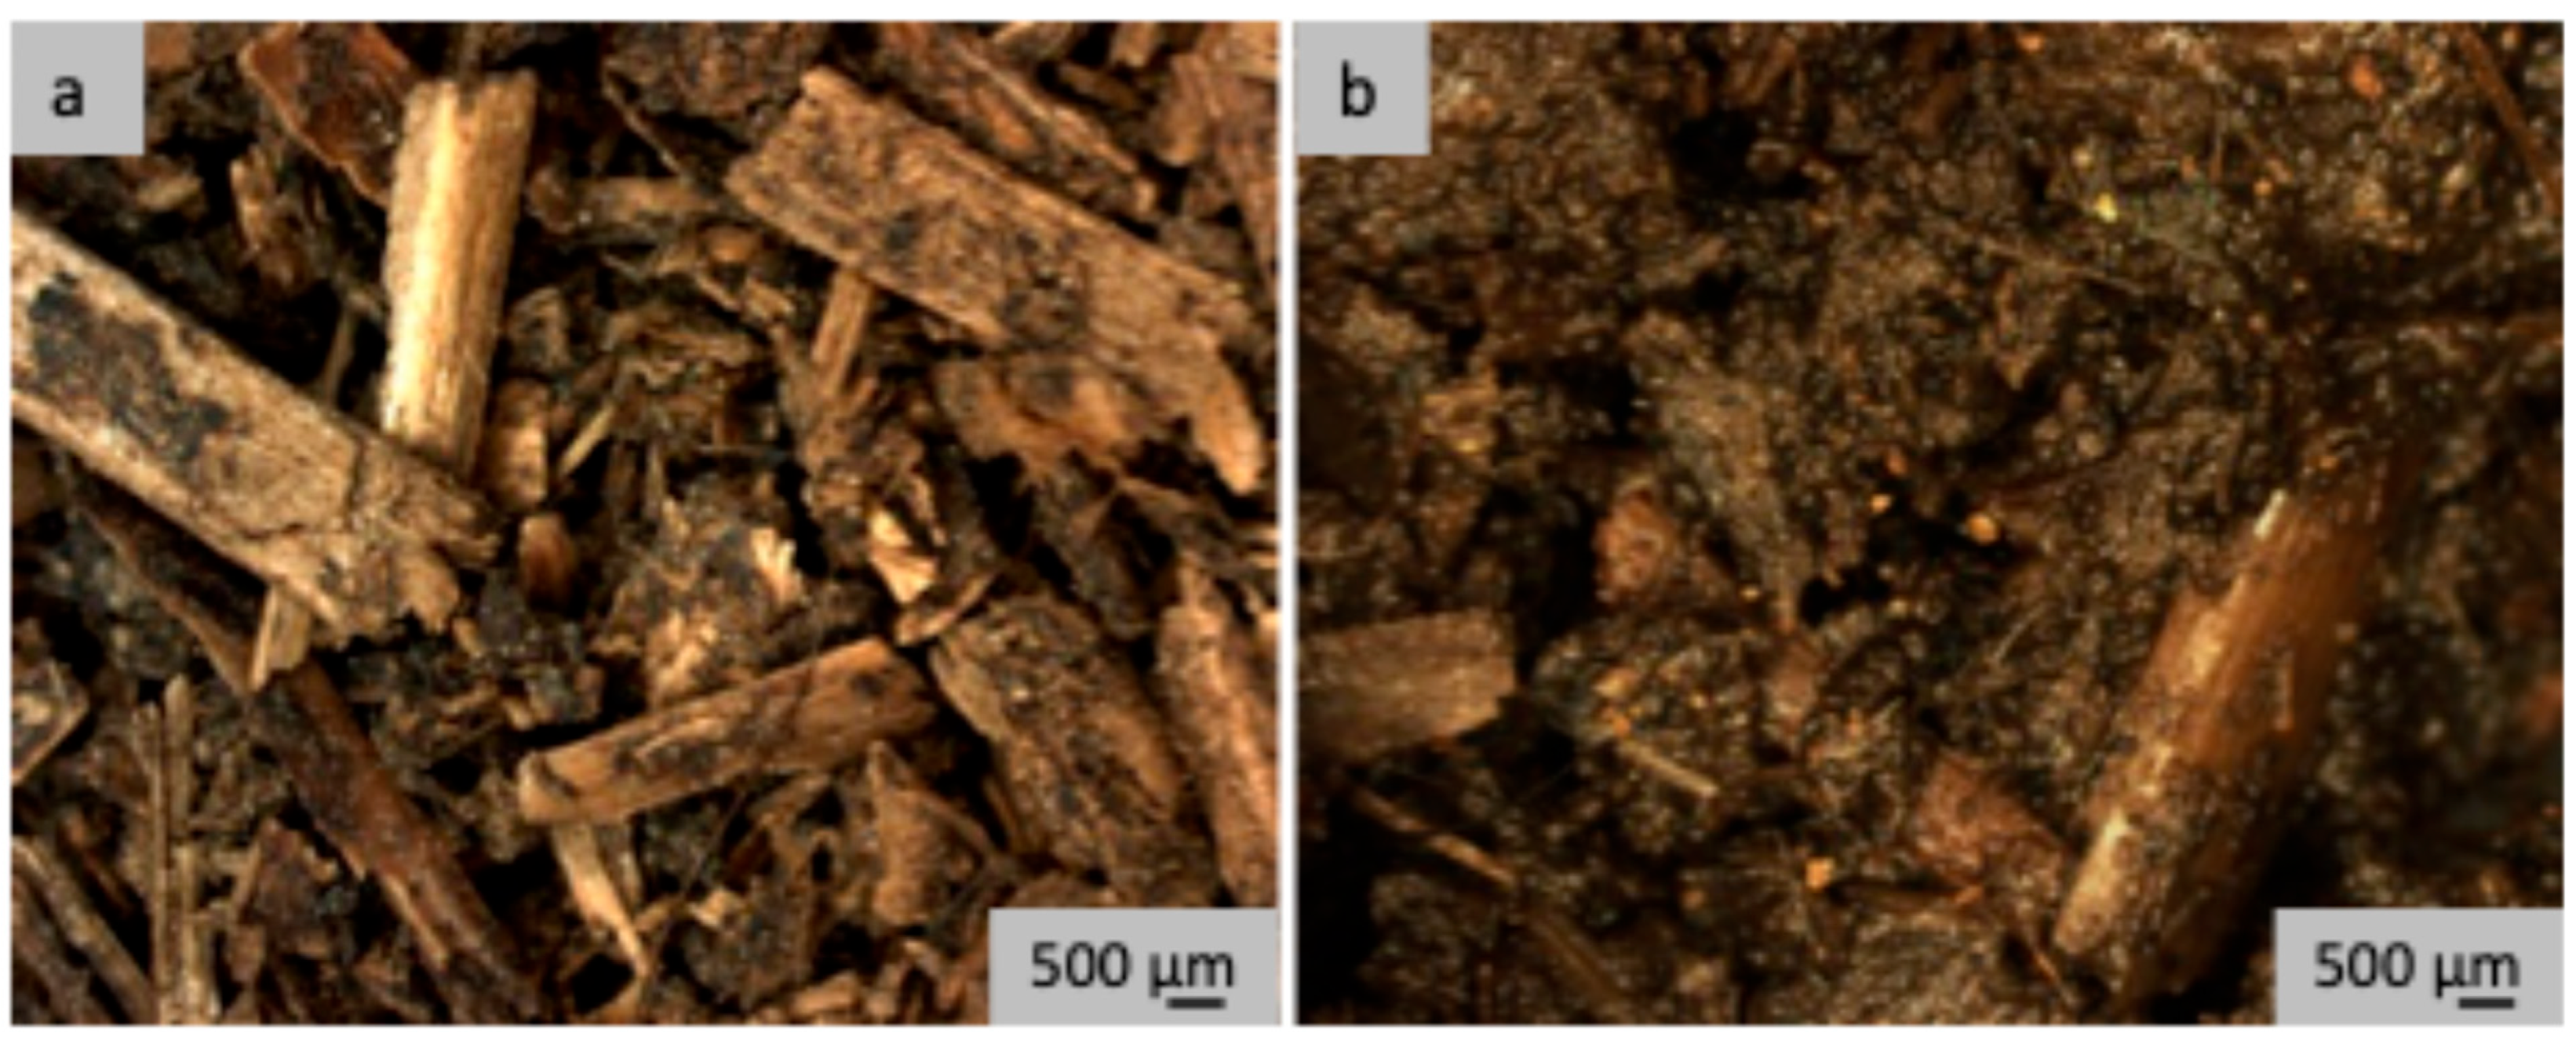
3.2. Microscopic Comparison of Raw and Dried Farmyard Cattle Manure

D/RW and R FYM consisted mainly of coarse straw particles surrounded by varying amounts of fine biodegraded OM (Figure 2a,b). The higher water content of R gave it a dark, sticky appearance. The fine organic fraction adhered to straw fragments in R, whereas it was detached from them in D/RW. Some coarse black organic particles with a humified appearance were observed in D/RW, but they were more difficult to identify in R due to the larger amounts of the fine organic fraction surrounding the particles.
As observed by TEM, straw elements of D/RW were highly colonized by fungi, and ligneous vessels were degraded (Figure 3a). Depending on the degree of plant degradation, fungi were observed as residues, spores, or living organisms. Most pecto-cellulosic plant tissues remained intact (Figure 3b), and the fine organic fraction consisted of cell and parietal residues in which most microbial activity was bacterial (Figure 3c). In contrast, R contained mainly non-degraded ligneous elements, although microbial colonization began to be observed within the vessels (Figure 3d). Many observations of R highlighted degradation of plant cellulosic tissues by bacteria (Figure 3e). Composition of the R fine fraction (Figure 3f) was similar to that of D/RW (Figure 3c).
TEM highlighted differences in microbial potential between the two types of FYM: high past fungal activity in D/RW (Figure 3a and Figure S1a), whereas fungi had just begun to colonize and degrade plant cells in R (Figure 3d and Figure S1b). In contrast, while bacteria had begun to colonize all tissues in D/RW (Figure 3b and Figure S1c), they degraded mainly pecto-cellulosic tissues in R (Figure 3e) since a large amount of residue could be observed in cell lumens (Figure S1d). D/RW contained many fungal and bacterial spores, likely due to drying (Figure 3c and Figure S1e), whereas R contained mainly bacterial spores due to storage before freezing (Figure 3f and Figure S1f). In both types of FYM, microbial colonization of the fine organic fraction was mainly microbial, although some hyphae were observed (Figure 3c,f and Figure S1e,f).

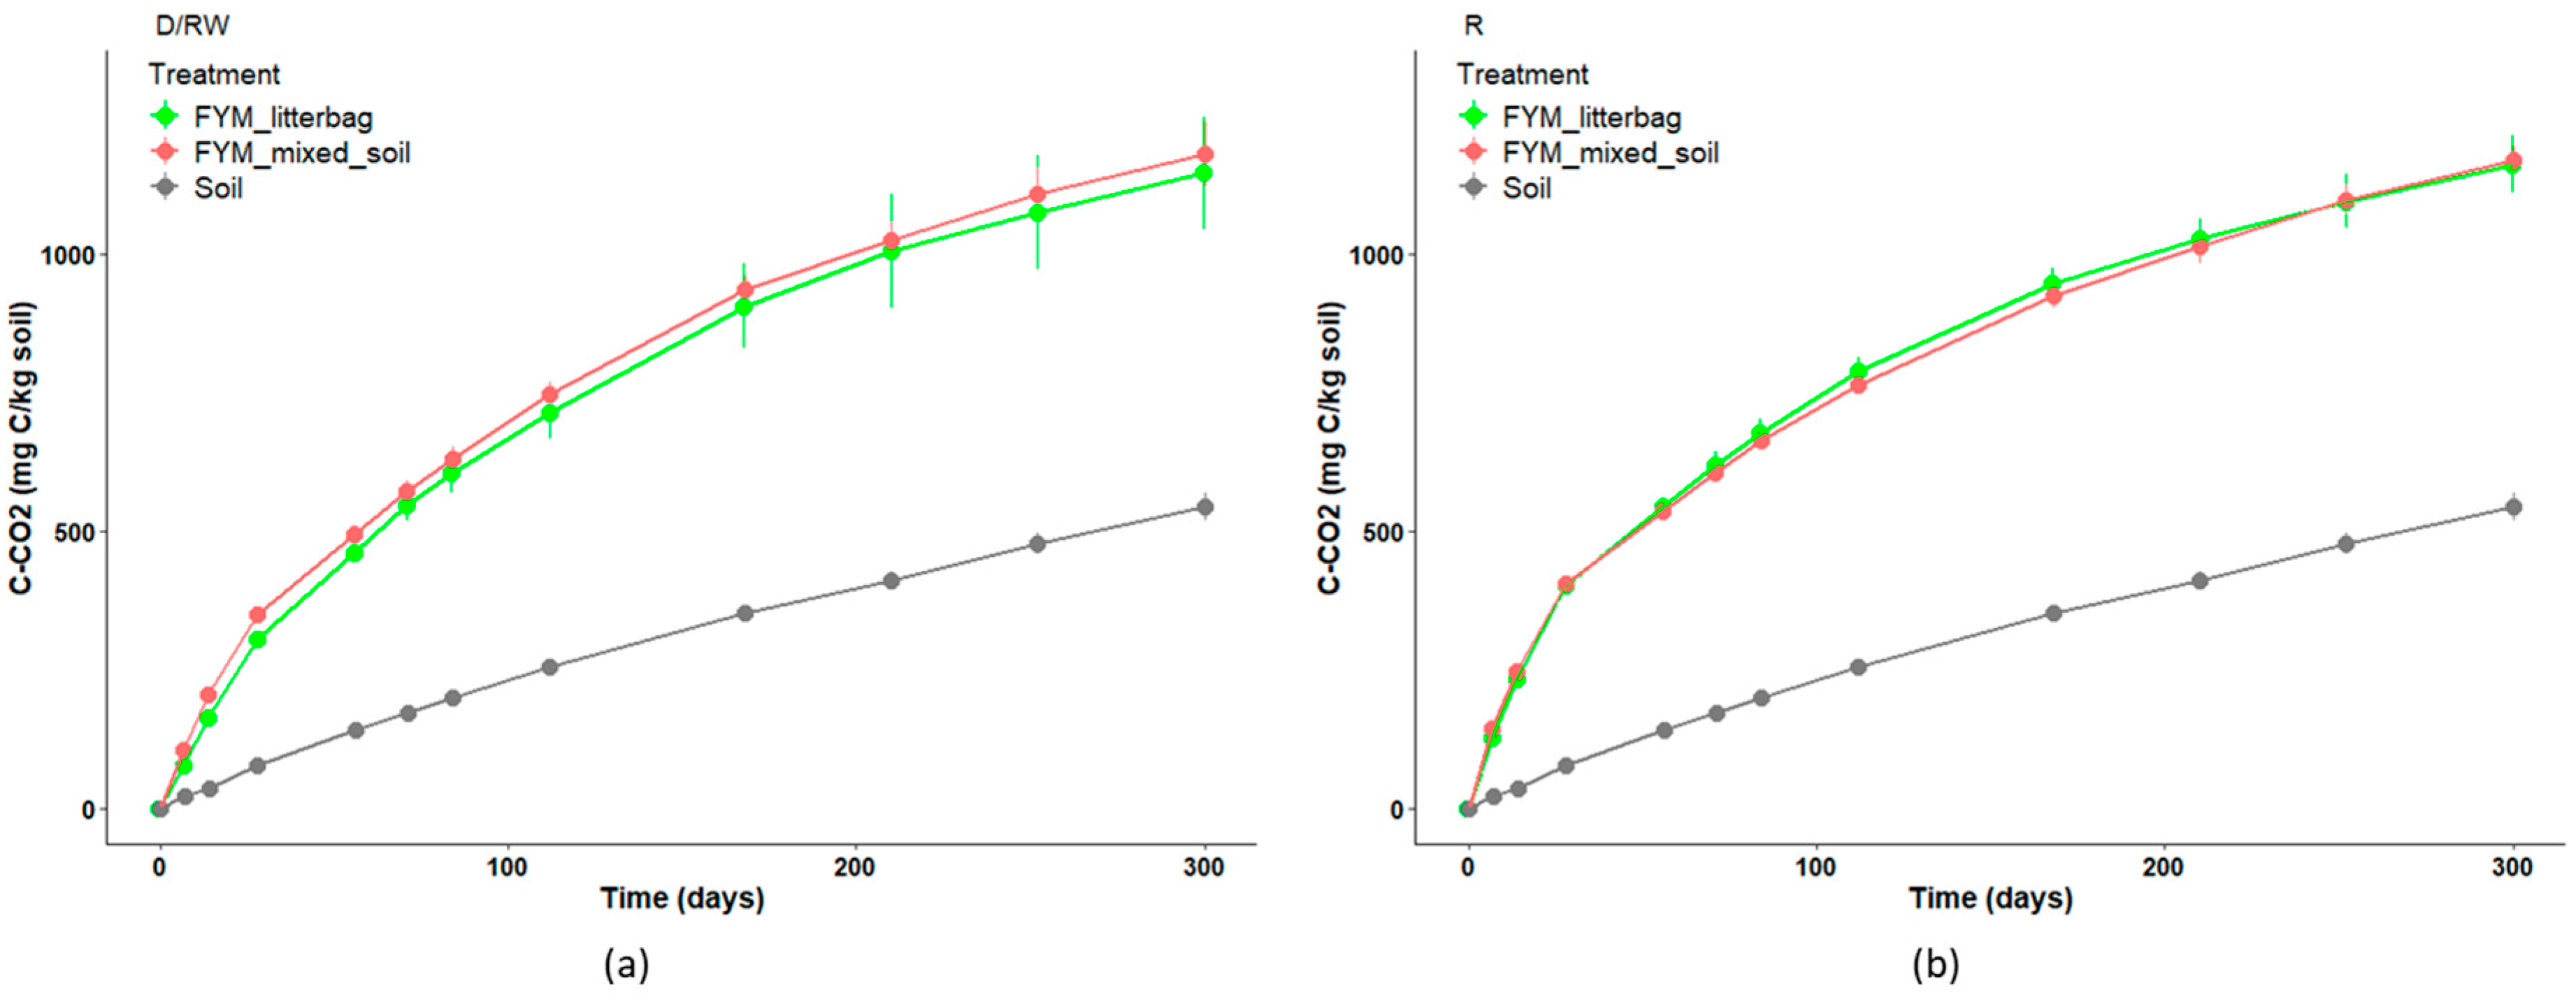
3.3. Carbon Mineralization Dynamics in Soil Versus Litterbags

Cumulative C mineralization was nearly identical for treatment R mixed with soil or in litterbags, with significantly lower mineralization observed in litterbags on days 7 and 14 (p < 0.05) but no significant differences thereafter (Figure 4). C mineralization rates were significantly lower in litterbags for treatment D/RW until day 56, with the difference between the two treatments driven primarily by fluxes measured at the beginning of incubation (27 mg C kg−1 from day 0 to 7 vs. 34 mg C kg−1 from day 0 to 301). The lack of direct contact between the material and the soil mixture, along with the physical barrier of the litterbag, thus resulted in little influence on overall C mineralization dynamics.

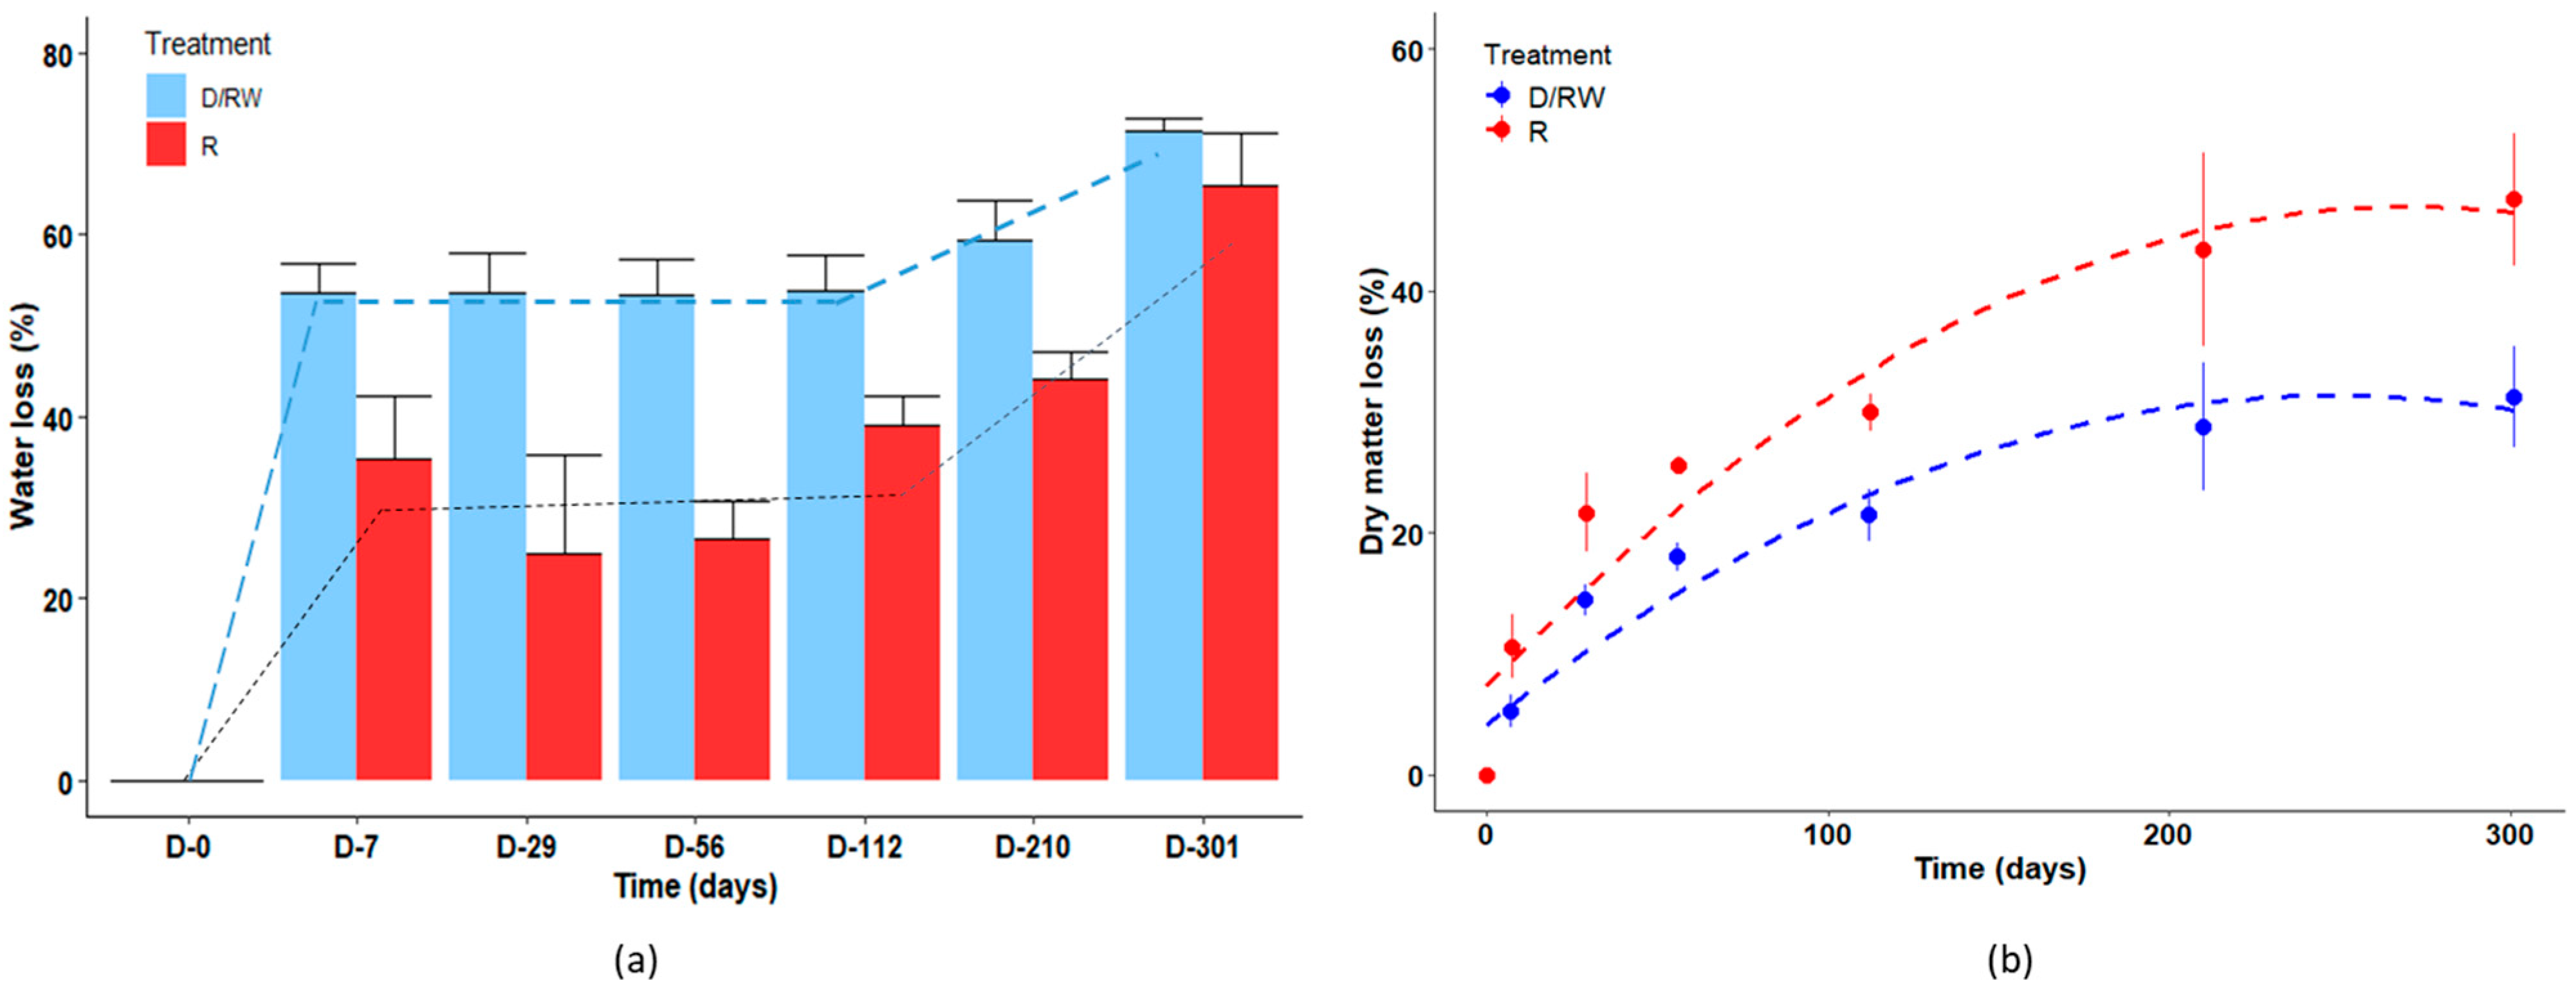
3.4. Water and Dry Matter Dynamics in the Litterbags

The water losses of both treatments followed the same dynamics in three steps. From day 0 to 7, water losses were high for D/RW and R FYM (53.7 ± 3.2% and 35.4 ± 6.9%, respectively) (Figure 5a). The D/RW and R treatments may have differed because, despite the high affinity of D/RW for water, the rewetting remained superficial. Water content stabilized for each treatment from day 7 to 112, followed by a return of water loss until the end of incubation.
DM losses followed a typical asymptotic increase, decreasing in particular after day 112 (Figure 5b). R had lost significantly more DM than D/RW had on each date (p < 0.05) (47.6 ± 5.5% vs. 31.1 ± 4.2% at the end of incubation, respectively (i.e., 53% more).

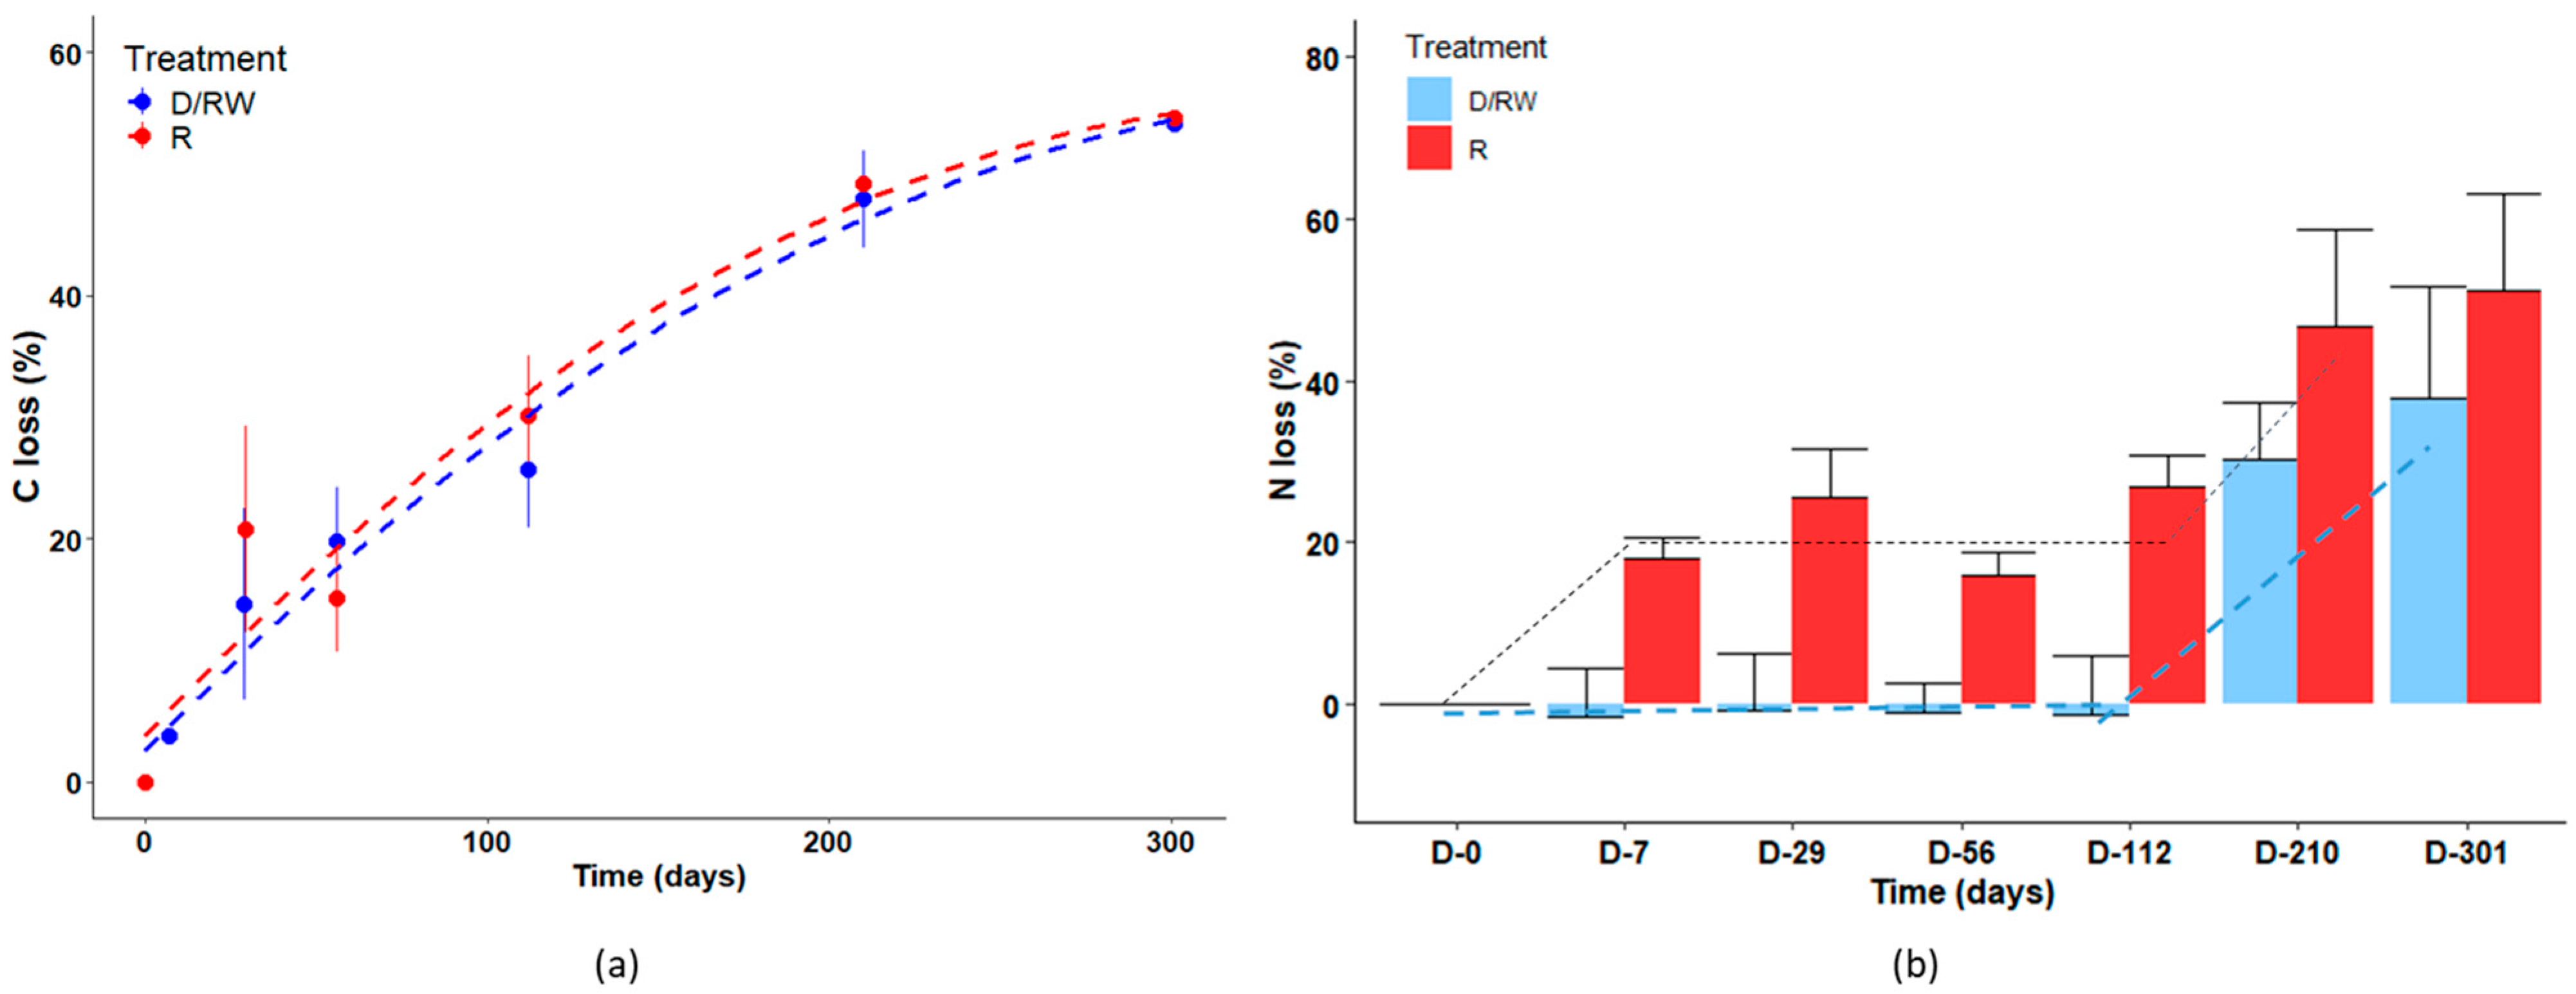
3.5. Carbon and Nitrogen Dynamics

C mineralization rates were significantly lower for treatment D/RW on days 7 (p < 0.001), 28 (p < 0.001), and 56 (p < 0.05) but did not differ significantly thereafter and were slightly higher for D treatment/RW on days 210 and 301 (Table 2).
C losses in the litterbags also followed the asymptotic increase usually observed during incubation of OM [11,36], with a lower inflection than that observed for DM loss (Figure 6a). In contrast to DM loss, the two types of FYM had similar dynamics of C loss throughout incubation, and the total losses on day 301 were similar (54.6 ± 10.4% for R vs. 54.2 ± 8.9% for D/RW).
N loss dynamics, however, differed significantly between the two treatments (Figure 6b). For treatment D/RW, no N was lost from day 0 to 112, but N losses were large thereafter, representing 37.8 ± 13.9% of the initial N at the end of incubation. For treatment R, N losses were large from day 0 to 7; thereafter, N losses generally remained low from day 7 to 112, and then changed in the same way as for treatment D/RW after day 112, representing 51.1 ± 12.0% of the initial N at the end of incubation.
C losses were similar to the amount of C-CO2 mineralized until day 112 for the two treatments, but differed thereafter (Table 2): C losses continued to increase significantly until the end of incubation, while mineralized C-CO2 fluxes increased slightly from day 112 to 210 and then remained stable. Dynamics of the C loss–DM loss ratio were also interesting (Table 2): (i) the ratio was low on day 7, which indicated little contribution of C to the DM loss; (ii) for treatment R, it increased only slightly after day 7; and (iii) for treatment D/RW, it remained relatively stable from day 29 to 112, and similar to that of treatment R, but increased greatly thereafter, becoming significantly (p < 0.05) larger on days 210 and 301.

3.6. Dynamics of D/RW and R FYM Microstructures Throughout Incubation

Consistent differences between treatments were observed for all three replicates, which highlighted treatment-specific effects on selected physical and/or biological parameters. The water content was always higher in the litterbags of treatment R throughout incubation; as a result, the material detached easily from the litterbags during sampling. In contrast, contents of the D/RW bags were drier, with particles occasionally adhering to the mesh. On day 28, samples of both types of FYM remained macroscopically similar to the initial material (Figure 2 and Figure S2a), except for the development of an orange biological crust—likely of bacterial origin—on the mesh in contact with the soil in the R treatment (Figure S2b). This crust was observed again only in a single replicate of treatment R on day 112.
Regarding micro- and mesofauna, only a few individuals—enchytraeids and springtails (Folsomia spp.)—were observed in D/RW up to day 56 (Figure S2e,f). In contrast, on day 112, the abundance of these organisms increased greatly in both treatments R and D/RW, along with the appearance of a new springtail genus (Symphypleona) (Figure S2g,i). By day 210, these organisms remained abundant, but their presence decreased greatly by day 310, with only a few enchytraeids still observed.
In addition to these faunal dynamics, macroscopic fungal development was also noted. From the beginning of incubation, light-colored fungal hyphae were visible on the OM in both treatments (Figure S3a), and black spores appeared on straw fragments in treatment R on day 28 (Figure S2c). Fungal hyphae were observed throughout the incubation of all samples, regardless of the treatment (Figure S2d on day 56 and Figure S2j on day 210). By the end of incubation, both treatments were macroscopically similar (Figure S2j,k), with most straw fragments highly degraded and black fungal spores still present (Figure S2l).
On day 28, biodegradation continued. Plant tissues showed various stages of degradation in a given sample; however, D/RW and R showed differences. In D/RW, the main features were signs of past fungal activity with degraded ligneous thickening, along with bacterial colonization of the cells (Figure S3a). In contrast, in R, fungi colonized the lignified cells and were actively degrading their walls, while bacteria originally present in the FYM continued to lyse OM (Figure S3b). The fine fraction of both types of FYM, composed of cell walls or cellular remnants—particularly those of polyphenolic origin—contained many microorganisms, whether active, sporulated or in the form of residues (Figure S3c).
On day 56, OM degradation continued in both types of FYM, which decreased the differences previously observed, although lignified cells degraded by fungi still appeared more frequently in R than in D/RW. Microorganisms—both bacteria and fungi—remained active and were found in residual tissue fragments (Figure S3d) and in the fine fraction, which was similar to that observed on day 28. The most degraded form of tissue residues was reduced to middle lamellae and cellular intersections (Figure S3e). Under TEM, megaspores observed in R appeared as multiple layers of large, superimposed cells, filled or not with mycelial hyphae (Figure S3f).
On day 112, observations confirmed the OM transformation previously described, which appeared relatively similar in both types of FYM. Many active fungi were still observed in tissues and in the fine fraction (Figure S3h). The fine fraction contained more cell wall residues and more developed residues (showing strong electron contrast) (Figure S3i). It contained numerous spores and bacterial remnants but also some bacteria and fungi in good physiological condition (Figure S3g), which reflected the fungal colonization observed under light microscopy (Figure S1). Observations were similar on day 210.
On day 301, observations still revealed various stages of tissue degradation in both types of FYM, with a higher proportion of highly degraded tissues than before (Figure 7). Living fungi were still degrading some remaining lignified cell walls, while the more biodegraded cells contained fungal and bacterial residues (Figure 7a,d for D/RW and R, respectively). Some active bacteria were still observed (Figure 7a,d for D/RW and R, respectively). The other recognizable tissues were heavily degraded, being reduced mainly to middle lamellae and cellular intersections. Notably, cell wall residues with strong electron contrast were more frequently observed in D/RW than in R (Figure 7b,e respectively), which indicated more advanced biochemical transformation of tissues (humification via N enrichment).
The fine fraction in both types of FYM consisted of cell wall residues, polyphenolic cellular contents, and OM of unidentified origin and microbial remnants (Figure 7c,f for D/RW and R, respectively). It is worth noting that the microbial potential is much lower at this stage of incubation. While active fungi and bacteria were still present in the remaining degradable tissues, microbial spores were the main form in the fine fraction.

4. Discussion

4.1. Drying Influences FYM Biochemical Composition by Inducing Biological Activity

DM content, C content, and the organic C–organic N ratio were in the same ranges as those reported for cattle manure stored in piles [11,37]. The ammoniacal N content of R (2 g N kg−1 on a wet weight basis) was higher than that usually observed for FYM (usually 0.5–1.5 g N kg−1 on a wet weight basis) [37,38]. This suggests that the FYM was not yet mature, as confirmed by the large HEM + CEL fractions and the relatively low IROC value (45.8).
The organic C content of D/RW was 5.7% lower than that of R (p = 0.054; Table 1), suggesting that some of it was lost during drying. The ammoniacal N content of D/RW was 74% lower than that of R, due mainly to ammonia volatilization during drying. However, there was a trend towards D/RW having higher organic N content (p = 0.054). This initially surprising result may have been due to microbial N immobilization of the FYM’s ammoniacal N during drying exceeding the loss of organic N. The relatively long duration of drying 40 °C (4 days) supports the hypothesis of high microbiological activity since these conditions are similar to those of the initial phase of composting, during which there is N immobilization.
Here, TEM observations of R and D/RW clearly showed that drying influenced microbial colonization. D/RW was degraded mainly by fungi, while bacteria developed in R. These microbial dynamics influenced the OM composition of both types of FYM since some ligneous elements of straw were still degraded in D/RW. Fungi can generally survive periods of low water content better than bacteria can because they can produce compounds that protect membranes from desiccation [16]. Fungal spores can withstand desiccation and often survive extended dry periods, maintaining their ability to germinate after rehydration [39]. The high past activity of fungi confirmed the hypothesis of microbial organization of N due to C mineralization and N input by fungal enzymatic activity [40].

4.2. Similar C Mineralization Dynamics for Products Mixed with Soil or Placed in Litterbags

Cumulative C mineralization dynamics followed the asymptotic increase usually observed during incubation of organic products, which is described well by a two-compartment model [11,36,41,42]. C mineralization rates (Table 2) lay within the range observed by [11] for seven cattle manures (from 17 to 57% C supplied, with a median of 29%, at the end of a 224-day incubation at 15 °C) and are consistent with the rates observed by [10].
For D/RW, C mineralization dynamics were the same for FYM mixed with soil or placed in litterbags, with a small delay, which decreased over time (Figure 4). This result indicates that neither the 200 µm mesh size nor the fact that the FYM was locally concentrated rather than mixed with the soil hindered biodegradation. At first glance, this may appear to contradict the widely held view that direct contact between crop residues and surrounding soil increases their accessibility to soil microorganisms and fauna [43,44], particularly since litterbags can act as barriers to the colonization of the substrate by certain detritivores, such as springtails [45]. However, this apparent contradiction is resolved by results [24], who concluded in a meta-analysis that soil fauna significantly influence litter mass loss but not C mineralization. This aligns with results of the present study that C mineralization dynamics and C losses from litterbags are not strictly correlated. Lastly, in the present study, the presence of springtails and enchytraeids inside the litterbags, particularly from day 112, along with the thin structure of the litterbags, suggests that the enclosed material remained readily accessible to both microflora and microfauna.

4.3. Drying Impacts on FYM Biochemical Composition and Microbial Activity During Incubation

C mineralization was lower for D/RW than for R at the beginning of incubation, but it decreased over time. This difference could not be explained by the significant difference in the water contents of the two types of FYM over the entire experiment (Figure 5a). In fact, we observed that water content did not influence biodegradation since the total flux of C mineralized during the experiment differed little between the treatments, regardless of whether the FYM was in a litterbag or mixed with soil (1160 ± 51 vs. 1178 ± 58 mg C kg−1, respectively, for R, and 1145 ± 101 vs. 1167 ± 5 mg C kg−1, respectively, for D/RW). The lower mineralization of C in D/RW at the beginning of incubation can be attributed completely to the difference in biochemical composition and microbial potential revealed by microscopy.
TEM analysis of dried and raw FYM clearly showed that drying impacted microbial colonization as D/RW was first degraded by fungi at the beginning of incubation since they had grown during the drying period, while bacteria were developing in R. These results are consistent with (i) the recognized ability of fungi to resist dry environments [46,47], explained in part by their ability to synthetize glomaline, trehalose, and glycerol [14], and (ii) the selective degradation of organic compounds by fungi or bacteria [48]. They are also consistent with the extensive literature on microbial successions during the biodegradation of OM, which depend on the litter and environmental factors [49,50]. In additions, the observations of R agreed well with the microbial successions described by [19] when decomposing wheat straw in 20 µm litterbags, with an initial phase dominated by bacterivorous nematodes and nematophagous mites, followed by a later phase dominated by fungivorous nematodes, fungivorous and omnivorous mites and Collembola, and predatory mites, which indicates a sequence from bacterial to fungal-dominated decomposition of the OM added.
This sequence did not develop in D/RW due to the partial degradation of the lignocellulosic cell walls, which had two consequences: (i) the emergence of a different microbial enzymatic potential since the biochemical composition of the product was thoroughly modified by drying, and (ii) a shift in degradation dynamics, due to differing access to hemicellulosic walls that had not yet degraded [35]. TEM observations revealed characteristics of OM, as well as the enzymatic lysis and degradation it experienced. The TEM results thus correlated well with the mineralization results and provide strong support for the concept of preferential decomposition of individual organic compound classes due to rewetting [51].
However, we also observed that, despite the significant degradation of the lignocellulosic cell walls of the straw during drying, the biodegradation dynamics of R recovered rapidly due to the colonization of R by a large amount of fungi. On day 28, this colonization may have resulted in the greater fungal polyphenoloxidase activity and lignilolytic activity in R, which coincided with higher C mineralization activity in R on day 28. The initial difference in dynamics decreased after day 28: similar colonization dynamics were observed for Collembola, whose populations were large on days 112 and 210, and by enchytraeids. This convergence of the two treatments was confirmed by the cumulative mineralization of C-CO2 after day 112. The mesh size of 200 µm thus allowed FYM to be colonized by microfauna (mites and protozoa) and microarthropods, which play a significant role in biodegradation [18,19,21].

4.4. Mass Balance: Evidence of Mass Transfer from Litterbags to the Soil

The dynamics observed for water, DM, C, and N can be explained only partly by biodegradation since the contributions of other physical and biological processes are the only way to explain the mass balances observed in the litterbags. The highly significant water transfer observed from day 0 to 7 from litterbags to the surrounding soil (Figure 5a) was a physical process due to (i) the difference in water content between the FYM (initially 2.3 g g−1 FYM) and the soil (0.2 g g−1 dry soil) and (ii) the higher water tension exerted by the soil. This water transfer was likely accompanied by a transfer of soluble elements, as shown by the low C loss–DM loss ratio from day 0 to 7 days (Table 2). It may explain the initial N loss in the R treatment (Figure 6b), which had high initial ammoniacal N content since the absence of N loss in the D/RW treatment may be explained by its lower ammoniacal N content.
The dynamics of C mineralization and DM, C, and N losses also suggest that the significant loss of DM after day 112 can be explained by processes other than biodegradation. C losses continued to increase significantly after day 112, while C mineralization increased slightly (Table 2). Since leaching did not occur, only the hypothesis of the active transfer of OM outside of the litterbag seems to be credible. The N dynamics observed (Figure 6b) support this hypothesis: the N balance of the D/RW treatment was stable (mean recovery of 100%) until day 112 since the mineralized N remained in the litterbag in the absence of leaching, and the N balance of the R treatment was also relatively stable from day 7 to 112. These observations are consistent with those of [19,21] for litterbags of fine mesh size (20 and 48 µm, respectively). To explain C and N losses from litterbags, the hypotheses of C and N transfer by translocation through the fungal hyphal network [52] or by soil fauna [25] both seem plausible. This result also seems original since the experimental design in the present study allowed us to exclude N loss through leaching, which has been observed in litterbags buried in fields [27]. The overall decrease in microbial potential and the persistence of fungi at the end of incubation, as observed by TEM, further support this hypothesis.
The DM balance of a litterbag thus results from multiple processes, and although biodegradation was indeed the main process that influenced C losses over the first 112 days of incubation, the other processes mentioned also influenced the DM balance to the degree that biodegradation explained only 53.1% and 58.4% of C losses at the end of incubation for R and D/RW, respectively. These elements can help explain the decoupling between mineralized C and C los, but also between C loss and DM loss, as shown by the variability in the C loss–DM loss ratio, which was low from day 0 to 7, ca. 0.25–0.30, from day 7 to 112, and higher after day 112 (Table 2). The authors of [21] also obtained contradictory results between C loss and DM loss, with higher DM loss in 48 µm vs. 2 mm litterbags but lower C loss. It, therefore, appears necessary to perform additional experiments to clarify these aspects. For instance, an approach that combines measurements of C and N fluxes and losses, TEM observations and assessment of OM fractions using the Van Soest method on each sampling day during incubation could provide valuable insights.

5. Conclusions

Understanding OM dynamics of animal wastes in soils is essential for effective agronomic management. Several methods can be used to quantify the fate of this OM, each with its own limitations and interpretation bias. The FD U44-163 standard has the advantage of providing a standard approach to measuring dynamics of N and C mineralization that is reproducible and relatively simple to apply. However, the drying performed in this experiment (4 days at 40 °C) changed the composition of the FYM significantly; thus, we recommend shortening the drying period as much as possible by placing the FYM in the oven in layers no thicker than ca. 2 cm. Litterbag experiments provide the advantage of being able to assess dynamics of a product directly, but they also have limitations: the selection of the mesofauna as a function of the mesh size; possible contamination by the soil and transfer of matter from the litterbag to the soil. This study highlights the contribution of physical, chemical, and biological factors to explaining the decoupling observed between mineralization and C loss in these experiments. Thus, analytical biases still need to be addressed, particularly the transfer of water and matter from litterbags to the surrounding environment, to better characterize the processes that influence these dynamics. These aspects could be clarified through additional experimental approaches. Nonetheless, these results can be used to help optimize the standardized protocols used to assess the fertilizing potential of organic amendments.

Supplementary Materials

The following supporting information can be downloaded at: https://www.mdpi.com/article/10.3390/nitrogen6030056/s1. Figure S1: Microbial potential of (a, c and e) dried (D/RW) and (b, d and f) raw (R) farmyard cattle manure before incubation; Figure S2: Dynamics of dried (D/RW) and raw (R) farmyard cattle manure during incubation steps (a–c on day 28, d–f on day 56, g–i on day 112, j–l on day 210); Figure S3: Microstructures of dried (D/RW) and raw (R) during incubation steps (a–c on day 28, d–f on day 56, g–i on day 112).

Author Contributions

Conceptualization, T.M.; methodology, T.M. and F.W.; formal analysis, T.M., F.W. and P.R.; validation, T.M., F.W. and P.R.; resources, T.M., F.W. and P.R.; writing, T.M. and F.W. All authors have read and agreed to the published version of the manuscript.

Funding

This research was funded by ADEME (French Environment and Energy Management Agency), Angers, France, grant number 1606C0023.

Data Availability Statement

The data presented in this study are available on request from the corresponding author.

Acknowledgments

The EFELE field trial forms part of the SOERE PRO (network of long-term experiments to study impacts of recycling organic waste products) certified by ALLENVI (Alliance Nationale de Recherche pour l’Environnement) and integrated as a service of the ‘‘Investment for future’’ infrastructure AnaEE-France, overseen by the French National Research Agency (ANR-11-INBS-0001). We thank M. Corson for proofreading the manuscript’s English and J. Chassain for helping with the bibliographic research.

Conflicts of Interest

The authors declare no conflicts of interest.

References

  1. Loyon, L. Overview of Animal Manure Management for Beef, Pig, and Poultry Farms in France. Front. Sustain. Food Syst. 2018, 2, 1–10. [Google Scholar] [CrossRef]
  2. Houot, S.; Pons, M.-N.; Pradel, M.; Savini, I.; Tibi, A. Valorisation Des Matières Fertilisantes d’origine Résiduaire Sur Les Sols à Usage Agricole Ou Forestier. 2014. Available online: https://www.inrae.fr/sites/default/files/pdf/mafor-synthese-vf-oct2014.pdf (accessed on 15 October 2014).
  3. Menzi, H.; Oenema, O.; Burton, C.H.; Shipin, O.; Gerber, P. Impacts of Intensive Livestock Production and Manure Management on the Environment (Chapter 9). In Livestock in a Changing Landscape: Drivers, Consequences and Responses; Island Press: Washington, DC, USA, 2010. [Google Scholar]
  4. Chadwick, D.; Sommer, S.; Thorman, R.; Fangueiro, D.; Cardenas, L.; Amon, B.; Misselbrook, T. Manure Management: Implications for Greenhouse Gas Emissions. Anim. Feed Sci. Technol. 2011, 166–167, 514–531. [Google Scholar] [CrossRef]
  5. Heitkamp, F.; Raupp, J.; Ludwig, B. Impact of Fertilizer Type and Rate on Carbon and Nitrogen Pools in a Sandy Cambisol. Plant Soil 2009, 319, 259–275. [Google Scholar] [CrossRef]
  6. Lashermes, G.; Nicolardot, B.; Parnaudeau, V.; Thuriès, L.; Chaussod, R.; Guillotin, M.L.; Linères, M.; Mary, B.; Metzger, L.; Morvan, T.; et al. Indicator of Potential Residual Carbon in Soils after Exogenous Organic Matter Application. Eur. J. Soil Sci. 2009, 60, 297–310. [Google Scholar] [CrossRef]
  7. Van Soest, P.J. Use of Detergents in the Analysis of Fibrous Feeds. II. A Rapid Method for the Determination of Fiber and Lignin. J. Assoc. Off. Anal. Chem. 1990, 73, 491–497. [Google Scholar]
  8. Jimenez, J.; Lei, H.; Steyer, J.-P.; Houot, S.; Patureau, D. Methane Production and Fertilizing Value of Organic Waste: Organic Matter Characterization for a Better Prediction of Valorization Pathways. Bioresour. Technol. 2017, 241, 1012–1021. [Google Scholar] [CrossRef]
  9. Parnaudeau, V.; Nicolardot, B.; Pagès, J. Relevance of Organic Matter Fractions as Predictors of Wastewater Sludge Mineralization in Soil. J. Environ. Qual. 2004, 33, 1885–1894. [Google Scholar] [CrossRef]
  10. Lashermes, G.; Nicolardot, B.; Parnaudeau, V.; Thuries, L.; Chaussod, R.; Guillotin, M.L.; Lineres, M.; Mary, B.; Metzger, L.; Morvan, T.; et al. Typology of Exogenous Organic Matters Based on Chemical and Biochemical Composition to Predict Potential Nitrogen Mineralization. Bioresour. Technol. 2010, 101, 157–164. [Google Scholar] [CrossRef]
  11. Morvan, T.; Nicolardot, B.; Pean, L. Biochemical Composition and Kinetics of C and N Mineralization of Animal Wastes: A Typological Approach. Biol. Fertil. Soils 2006, 42, 513–522. [Google Scholar] [CrossRef]
  12. Peltre, C.; Christensen, B.T.; Dragon, S.; Icard, C.; Katterer, T.; Houot, S. RothC Simulation of Carbon Accumulation in Soil after Repeated Application of Widely Different Organic Amendments. Soil Biol. Biochem. 2012, 52, 49–60. [Google Scholar] [CrossRef]
  13. FD U44-163; Amendements Organiques et Supports de Culture-Caractérisation de La Matière Organique Par La Minéralisation Potentielle Du Carbone et de l’azote. Qualité du sol. AFNOR: Paris, France, 2018.
  14. Kaiser, M.; Kleber, M.; Berhe, A.A. How Air-Drying and Rewetting Modify Soil Organic Matter Characteristics: An Assessment to Improve Data Interpretation and Inference. Soil Biol. Biochem. 2015, 80, 324–340. [Google Scholar] [CrossRef]
  15. Sparling, G.P.; Ross, D.J. Microbial Contributions to the Increased Nitrogen Mineralization after Air-Drying of Soils. Plant Soil 1988, 105, 163–167. [Google Scholar] [CrossRef]
  16. Schimel, J.; Balser, T.C.; Wallenstein, M. Microbial Stress-Response Physiology and Its Implications for Ecosystem Function. Ecology 2007, 88, 1386–1394. [Google Scholar] [CrossRef] [PubMed]
  17. Bocock, K.L.; Gilbert, O.J.W. The Disappearance of Leaf Litter under Different Woodland Conditions. Plant Soil 1957, 9, 179–185. [Google Scholar] [CrossRef]
  18. Kampichler, C.; Bruckner, A. The Role of Microarthropods in Terrestrial Decomposition: A Meta-Analysis of 40 Years of Litterbag Studies. Biol. Rev. 2009, 84, 375–389. [Google Scholar] [CrossRef]
  19. Vreeken-Buijs, M.J.; Brussaard, L. Soil Mesofauna Dynamics, Wheat Residue Decomposition and Nitrogen Mineralization in Buried Litterbags. Biol. Fertil. Soils 1996, 23, 374–381. [Google Scholar] [CrossRef]
  20. Bokhorst, S.; Wardle, D.A. Microclimate within Litter Bags of Different Mesh Size: Implications for the `arthropod Effect’ on Litter Decomposition. Soil Biol. Biochem. 2013, 58, 147–152. [Google Scholar] [CrossRef]
  21. Hanisch, J.; Engell, I.; Linsler, D.; Scheu, S.; Potthoff, M. The Role of Collembola for Litter Decomposition under Minimum and Conventional Tillage. J. Plant Nutr. Soil Sci. 2022, 185, 529–538. [Google Scholar] [CrossRef]
  22. Chassain, J.; Gonod, L.V.; Chenu, C.; Joimel, S. Role of Different Size Classes of Organisms in Cropped Soils: What Do Litterbag Experiments Tell Us? A Meta-Analysis. Soil Biol. Biochem. 2021, 162, 108394. [Google Scholar] [CrossRef]
  23. Potthoff, M.; Loftfield, N. How to Quantify Contamination of Organic Litter Bag Material with Soil? Pedobiologia 1998, 42, 147–153. [Google Scholar] [CrossRef]
  24. Frouz, J.; Roubíčková, A.; Heděnec, P.; Tajovský, K. Do Soil Fauna Really Hasten Litter Decomposition? A Meta-Analysis of Enclosure Studies. Eur. J. Soil Biol. 2015, 68, 18–24. [Google Scholar] [CrossRef]
  25. Jacobs, A.; Ludwig, B.; Schmidt, J.H.; Bergstermann, A.; Rauber, R.; Joergensen, R.G. Influence of Tillage on Degradation Kinetics Using the Litterbag Method. Eur. J. Soil Biol. 2011, 47, 198–204. [Google Scholar] [CrossRef]
  26. Lindahl, B.D.; Olsson, S. Fungal Translocation-Creating and Responding to Environmental Heterogeneity. Mycologist 2004, 18, 79–88. [Google Scholar] [CrossRef]
  27. Peña-Peña, K.; Irmler, U. Nitrogen and Carbon Losses from Decomposing Litter in Natural and Agroecosystems of Two Different Climate Regions of Brazil. Eur. J. Soil Biol. 2018, 86, 26–33. [Google Scholar] [CrossRef]
  28. Taylor, B.R.; Bärlocher, F. Variable Effects of Air-Drying on Leaching Losses from Tree Leaf Litter. Hydrobiologia 1996, 325, 173–182. [Google Scholar] [CrossRef]
  29. NF ISO 11465; Qualité du sol-Détermination de La Teneur Pondérale En Matière Sèche et En Eau-Méthode Gravimétrique. AFNOR: Paris, France, 1994.
  30. NF ISO 10694; Qualité du sol-Dosage Du Carbone Organique et Du Carbone Total Après Combustion Sèche. Normes nationales et documents normatifs nationaux. AFNOR: Paris, France, 1995.
  31. Soest, P.J.V.; Wine, R.H. Use of Detergents in the Analysis of Fibrous Feeds. IV. Determination of Plant Cell-Wall Constituents. J. Assoc. Off. Anal. Chem. 1967, 50, 50–55. [Google Scholar] [CrossRef]
  32. FAO. Soils of the World; Food and Agriculture Organization and United Nations Educational, Scientific and Cultural Organization; Elsevier Science: New York, NY, USA, 1987. [Google Scholar]
  33. SOERE PRO Network. Available online: https://Valor-pro.Hub.Inrae.Fr/ (accessed on 26 February 2019).
  34. Zibilske, L.M. Carbon Mineralization. In Methods of Soil Analysis; John Wiley & Sons, Ltd.: Hoboken, NJ, USA, 1994; pp. 835–863. ISBN 978-0-89118-865-0. [Google Scholar]
  35. Motte, J.-C.; Watteau, F.; Escudié, R.; Steyer, J.-P.; Bernet, N.; Delgenes, J.-P.; Dumas, C. Dynamic Observation of the Biodegradation of Lignocellulosic Tissue under Solid-State Anaerobic Conditions. Bioresour. Technol. 2015, 191, 322–326. [Google Scholar] [CrossRef]
  36. Thuriès, L.; Pansu, M.; Feller, C.; Herrmann, P.; Rémy, J. Kinetics of Added Organic Matter Decomposition in a Mediterranean Sandy Soil. SOIL Biol. Biochem. 2001, 33, 997–1010. [Google Scholar] [CrossRef]
  37. Morvan, T.; Gogé, F.; Oboyet, T.; Carel, O.; Fouad, Y. A Dataset of the Chemical Composition and Near-Infrared Spectroscopy Measurements of Raw Cattle, Poultry and Pig Manure. Data Brief 2021, 39, 107475. [Google Scholar] [CrossRef]
  38. Gogé, F.; Thuriès, L.; Fouad, Y.; Damay, N.; Davrieux, F.; Moussard, G.; Roux, C.L.; Trupin-Maudemain, S.; Valé, M.; Morvan, T. Dataset of Chemical and Near-Infrared Spectroscopy Measurements of Fresh and Dried Poultry and Cattle Manure. Data Brief 2021, 34, 106647. [Google Scholar] [CrossRef]
  39. Bewley, J.D. Physiological Aspects of Desiccation Tolerance. Annu. Rev. Plant Biol. 1979, 30, 195–238. [Google Scholar] [CrossRef]
  40. Watteau, F.; Villemin, G.; Mansot, J.L.; Ghanbaja, J.; Toutain, F. Localization and Characterization by Electron Energy Loss Spectroscopy (EELS) of the Brown Cellular Substances of Beech Roots. Soil Biol. Biochem. 1996, 28, 1327–1332. [Google Scholar] [CrossRef]
  41. Castellanos, J.Z.; Pratt, P.F. Mineralization of Manure Nitrogen—Correlation with Laboratory Indexes. Soil Sci. Soc. Am. J. 1981, 45, 354–357. [Google Scholar] [CrossRef]
  42. Pansu, M.; Thuriès, L. Kinetics of C and N Mineralization, N Immobilization and N Volatilization of Organic Inputs in Soil. Soil Biol. Biochem. 2003, 35, 37–48. [Google Scholar] [CrossRef]
  43. Faust, S.; Koch, H.-J.; Dyckmans, J.; Joergensen, R.G. Response of Maize Leaf Decomposition in Litterbags and Soil Bags to Different Tillage Intensities in a Long-Term Field Trial. Appl. Soil Ecol. 2019, 141, 38–44. [Google Scholar] [CrossRef]
  44. Potthoff, M.; Dyckmans, J.; Flessa, H.; Beese, F.; Joergensen, R.G. Decomposition of Maize Residues after Manipulation of Colonization and Its Contribution to the Soil Microbial Biomass. Biol. Fertil. Soils 2008, 44, 891–895. [Google Scholar] [CrossRef]
  45. Dittmer, S.; Schrader, S. Longterm Effects of Soil Compaction and Tillage on Collembola and Straw Decomposition in Arable Soil. Pedobiologia 2000, 44, 527–538. [Google Scholar] [CrossRef]
  46. Yuste, J.C.; Peñuelas, J.; Estiarte, M.; Garcia-Mas, J.; Mattana, S.; Ogaya, R.; Pujol, M.; Sardans, J. Drought-Resistant Fungi Control Soil Organic Matter Decomposition and Its Response to Temperature. Glob. Change Biol. 2011, 17, 1475–1486. [Google Scholar] [CrossRef]
  47. Treseder, K.K.; Berlemont, R.; Allison, S.D.; Martiny, A.C. Drought Increases the Frequencies of Fungal Functional Genes Related to Carbon and Nitrogen Acquisition. PLoS ONE 2018, 13, e0206441. [Google Scholar] [CrossRef]
  48. Herzog, C.; Hartmann, M.; Frey, B.; Stierli, B.; Rumpel, C.; Buchmann, N.; Brunner, I. Microbial Succession on Decomposing Root Litter in a Drought-Prone Scots Pine Forest. ISME J. 2019, 13, 2346–2362. [Google Scholar] [CrossRef]
  49. Buresova, A.; Kopecky, J.; Hrdinkova, V.; Kamenik, Z.; Omelka, M.; Sagova-Mareckova, M. Succession of Microbial Decomposers Is Determined by Litter Type, but Site Conditions Drive Decomposition Rates. Appl. Environ. Microbiol. 2019, 85, e01760-19. [Google Scholar] [CrossRef] [PubMed]
  50. Purahong, W.; Wubet, T.; Lentendu, G.; Schloter, M.; Pecyna, M.J.; Kapturska, D.; Hofrichter, M.; Krüger, D.; Buscot, F. Life in Leaf Litter: Novel Insights into Community Dynamics of Bacteria and Fungi during Litter Decomposition. Mol. Ecol. 2016, 25, 4059–4074. [Google Scholar] [CrossRef] [PubMed]
  51. Zhang, W.; Yuan, S.; Hu, N.; Lou, Y.; Wang, S. Predicting Soil Fauna Effect on Plant Litter Decomposition by Using Boosted Regression Trees. SOIL Biol. Biochem. 2015, 82, 81–86. [Google Scholar] [CrossRef]
  52. Lummer, D.; Scheu, S.; Butenschoen, O. Connecting Litter Quality, Microbial Community and Nitrogen Transfer Mechanisms in Decomposing Litter Mixtures. Oikos 2012, 121, 1649–1655. [Google Scholar] [CrossRef]
Figure 1. Flowchart of steps of the experiment. FYM: farmyard manure.
Nitrogen 06 00056 g001
Figure 2. Macroscopic views of (a) dried and (b) raw farmyard cattle manure, showing straw particles surrounded by varying amounts of the fine organic fraction.
Nitrogen 06 00056 g002
Figure 3. Microstructures of (ac) dried and (df) raw farmyard cattle manure before incubation. (a) Ligneous vessels biodegraded by fungi; (b) intact cellulosic tissue; (c) fine organic matter surrounding straw with associated microorganisms; (d) intact ligneous tissue; (e) cellulosic tissue colonized by bacteria; (f) fine organic matter surrounding straw with associated microorganisms. Captions: b: bacteria; bs: bacterial spore; cw: cell wall; dcw: degraded cell wall; f: fungus; lt: ligneous thickening; ly: lysis area; omr: organic matter residues; pr: parietal residue.
Nitrogen 06 00056 g003
Figure 4. Cumulative carbon mineralization fluxes (mg C kg−1 soil) of (a) dried (D/RW) and (b) raw (R) farmyard cattle manure (FYM) mixed with soil or in litterbags, compared to that of the soil.
Nitrogen 06 00056 g004
Figure 5. Dynamics of (a) water losses and (b) dry matter losses for dried (D/RW) and raw (R) farmyard cattle manure in litterbags. Dry matter losses differed significantly (p < 0.05) between treatments on all dates.
Nitrogen 06 00056 g005
Figure 6. Dynamics of (a) carbon losses and (b) nitrogen losses of dried (D/RW) and raw (R) farmyard cattle manure in litterbags.
Nitrogen 06 00056 g006
Figure 7. Microstructures of (ac) dried (D/RW) and (df) raw (R) farmyard cattle manure on day 301. (a) D/RW biodegraded ligneous tissues by fungi and microbial residues; (b) electron-dense middle lamella of D/RW degraded tissues; (c) D/RW fine fraction containing organic residues; (d) R biodegraded ligneous tissues; (e) R parietal residues; (f) R fine fraction containing organic residues. Caption—b: bacteria; bs: bacterial spore; ci: cell intersection; dcw: degraded cell wall; f: fungi; f: fungal residue; omr: organic matter residues; pr: parietal residue; ps: polyphenolic substance.
Nitrogen 06 00056 g007
Table 1. Mean ± 1 standard deviation of organic carbon (C) (g C kg−1 dried matter), organic nitrogen (N), and ammonia (N-NH4) contents (g N kg−1 dried matter) of raw (R) and dried (D/RW) farmyard cattle manure.
ContentRD/RW
Organic C282.2 ± 7.3266 ± 7.4
Organic N 13.6 ± 1.115.0 ± 0.7
N-NH46.56 ± 0.21.70 ± 0.05
The organic C–organic N ratio of treatment D/RW (17.7) was lower than that of treatment R (20.8).
Table 2. Mean carbon (C) loss (C loss, as a% of initial C), amount of cumulative C mineralized (as a% of initial C), and the C loss–dry matter (DM) loss for raw (R) and dried (D/RW) farmyard cattle manure on six sampling dates. Values in parentheses are 1 standard deviation.
RD/RW
DayC_lossC-CO2C loss–DM lossC_lossC-CO2C loss–DM loss
7−0.03 (7.3)4.9 (0.5)−3.7 (22.1)3.8 (10.4)3.0 (0.1)12.0 (44.9)
2820.7 (8.5)15.4 (1.3)26.3 (7.6)14.6 (7.9)12.4 (0.8)28.0 (17.8)
5615.0 (4.4)19.1 (2.0)16.7 (4.6)19.8 (4.4)17.0 (1.1)29.7 (8.0)
11230.1 (4.91)25.0 (3.1)28.3 (3.1)25.7 (4.9)24.5 (1.9)32.0 (4.0)
21049.2 (11.3)29.0 (3.9)32.0 (1.7)47.9 (4.0)31.3 (3.6)45.0 (5.6)
30154.6 (10.5)29.0 (4.3)32.3 (3.5)54.1 (9.0)31.6 (3.5)46.0 (1.7)
Disclaimer/Publisher’s Note: The statements, opinions and data contained in all publications are solely those of the individual author(s) and contributor(s) and not of MDPI and/or the editor(s). MDPI and/or the editor(s) disclaim responsibility for any injury to people or property resulting from any ideas, methods, instructions or products referred to in the content.

