
Leucaena-Based Alley Cropping System: An Approach for Reclaiming Degraded Land, Reducing the Use of Inorganic Nitrogen Fertilizer, and Improving Crop Productivity

 , , and
Abstract
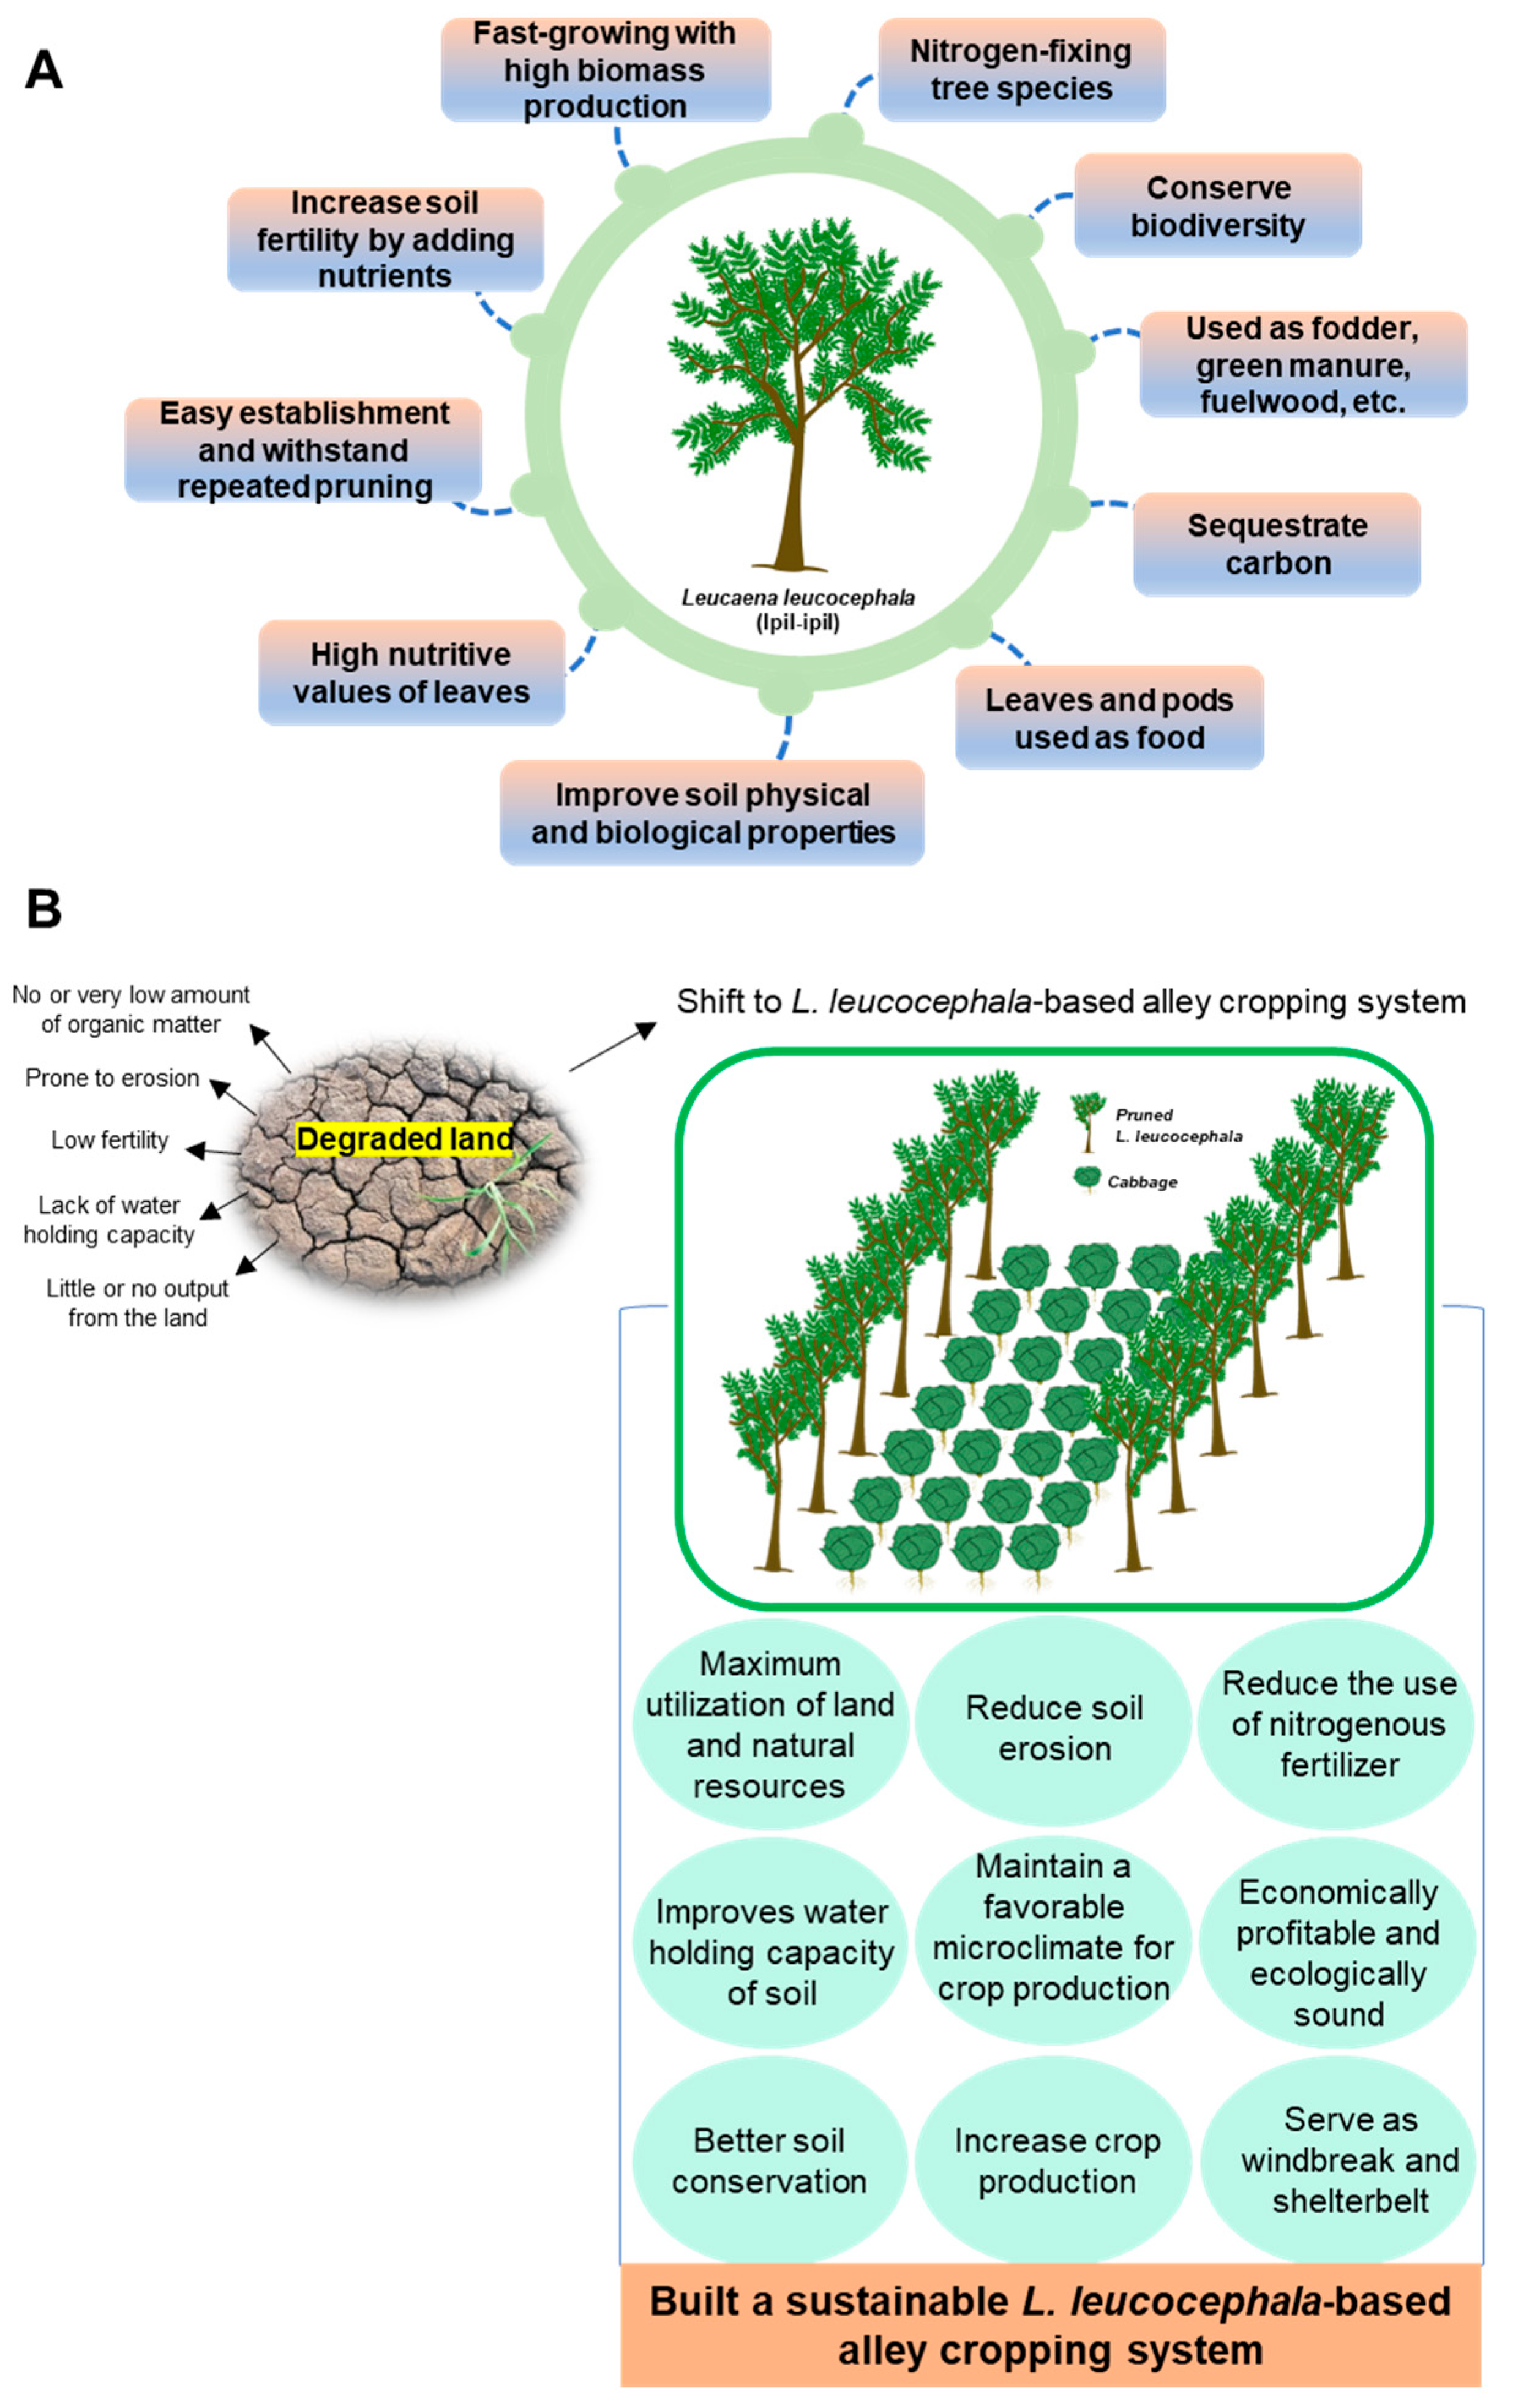
1. Introduction
2. Materials and Methods
2.1. Description of the Experimental Site
2.2. Incorporation of L. Leucocephala Biomass into Soil
2.3. Experimental Design and Treatments
2.4. Field Preparation, Transplanting, Fertilizer Application and Intercultural Operations
2.5. Soil Sampling, Preparation and Analyses
2.5.1. Soil pH
2.5.2. Organic C
2.5.3. Total N
2.5.4. Available P
2.5.5. Exchangeable K
2.5.6. Fumigation of Soil Samples for the Measurement of Biomass C and Biomass N
2.5.7. Measurement of Biomass C
2.5.8. Measurement of Biomass N
2.6. Yield-Contributing Characteristics of Cabbage
2.7. Statistical Analysis
3. Results
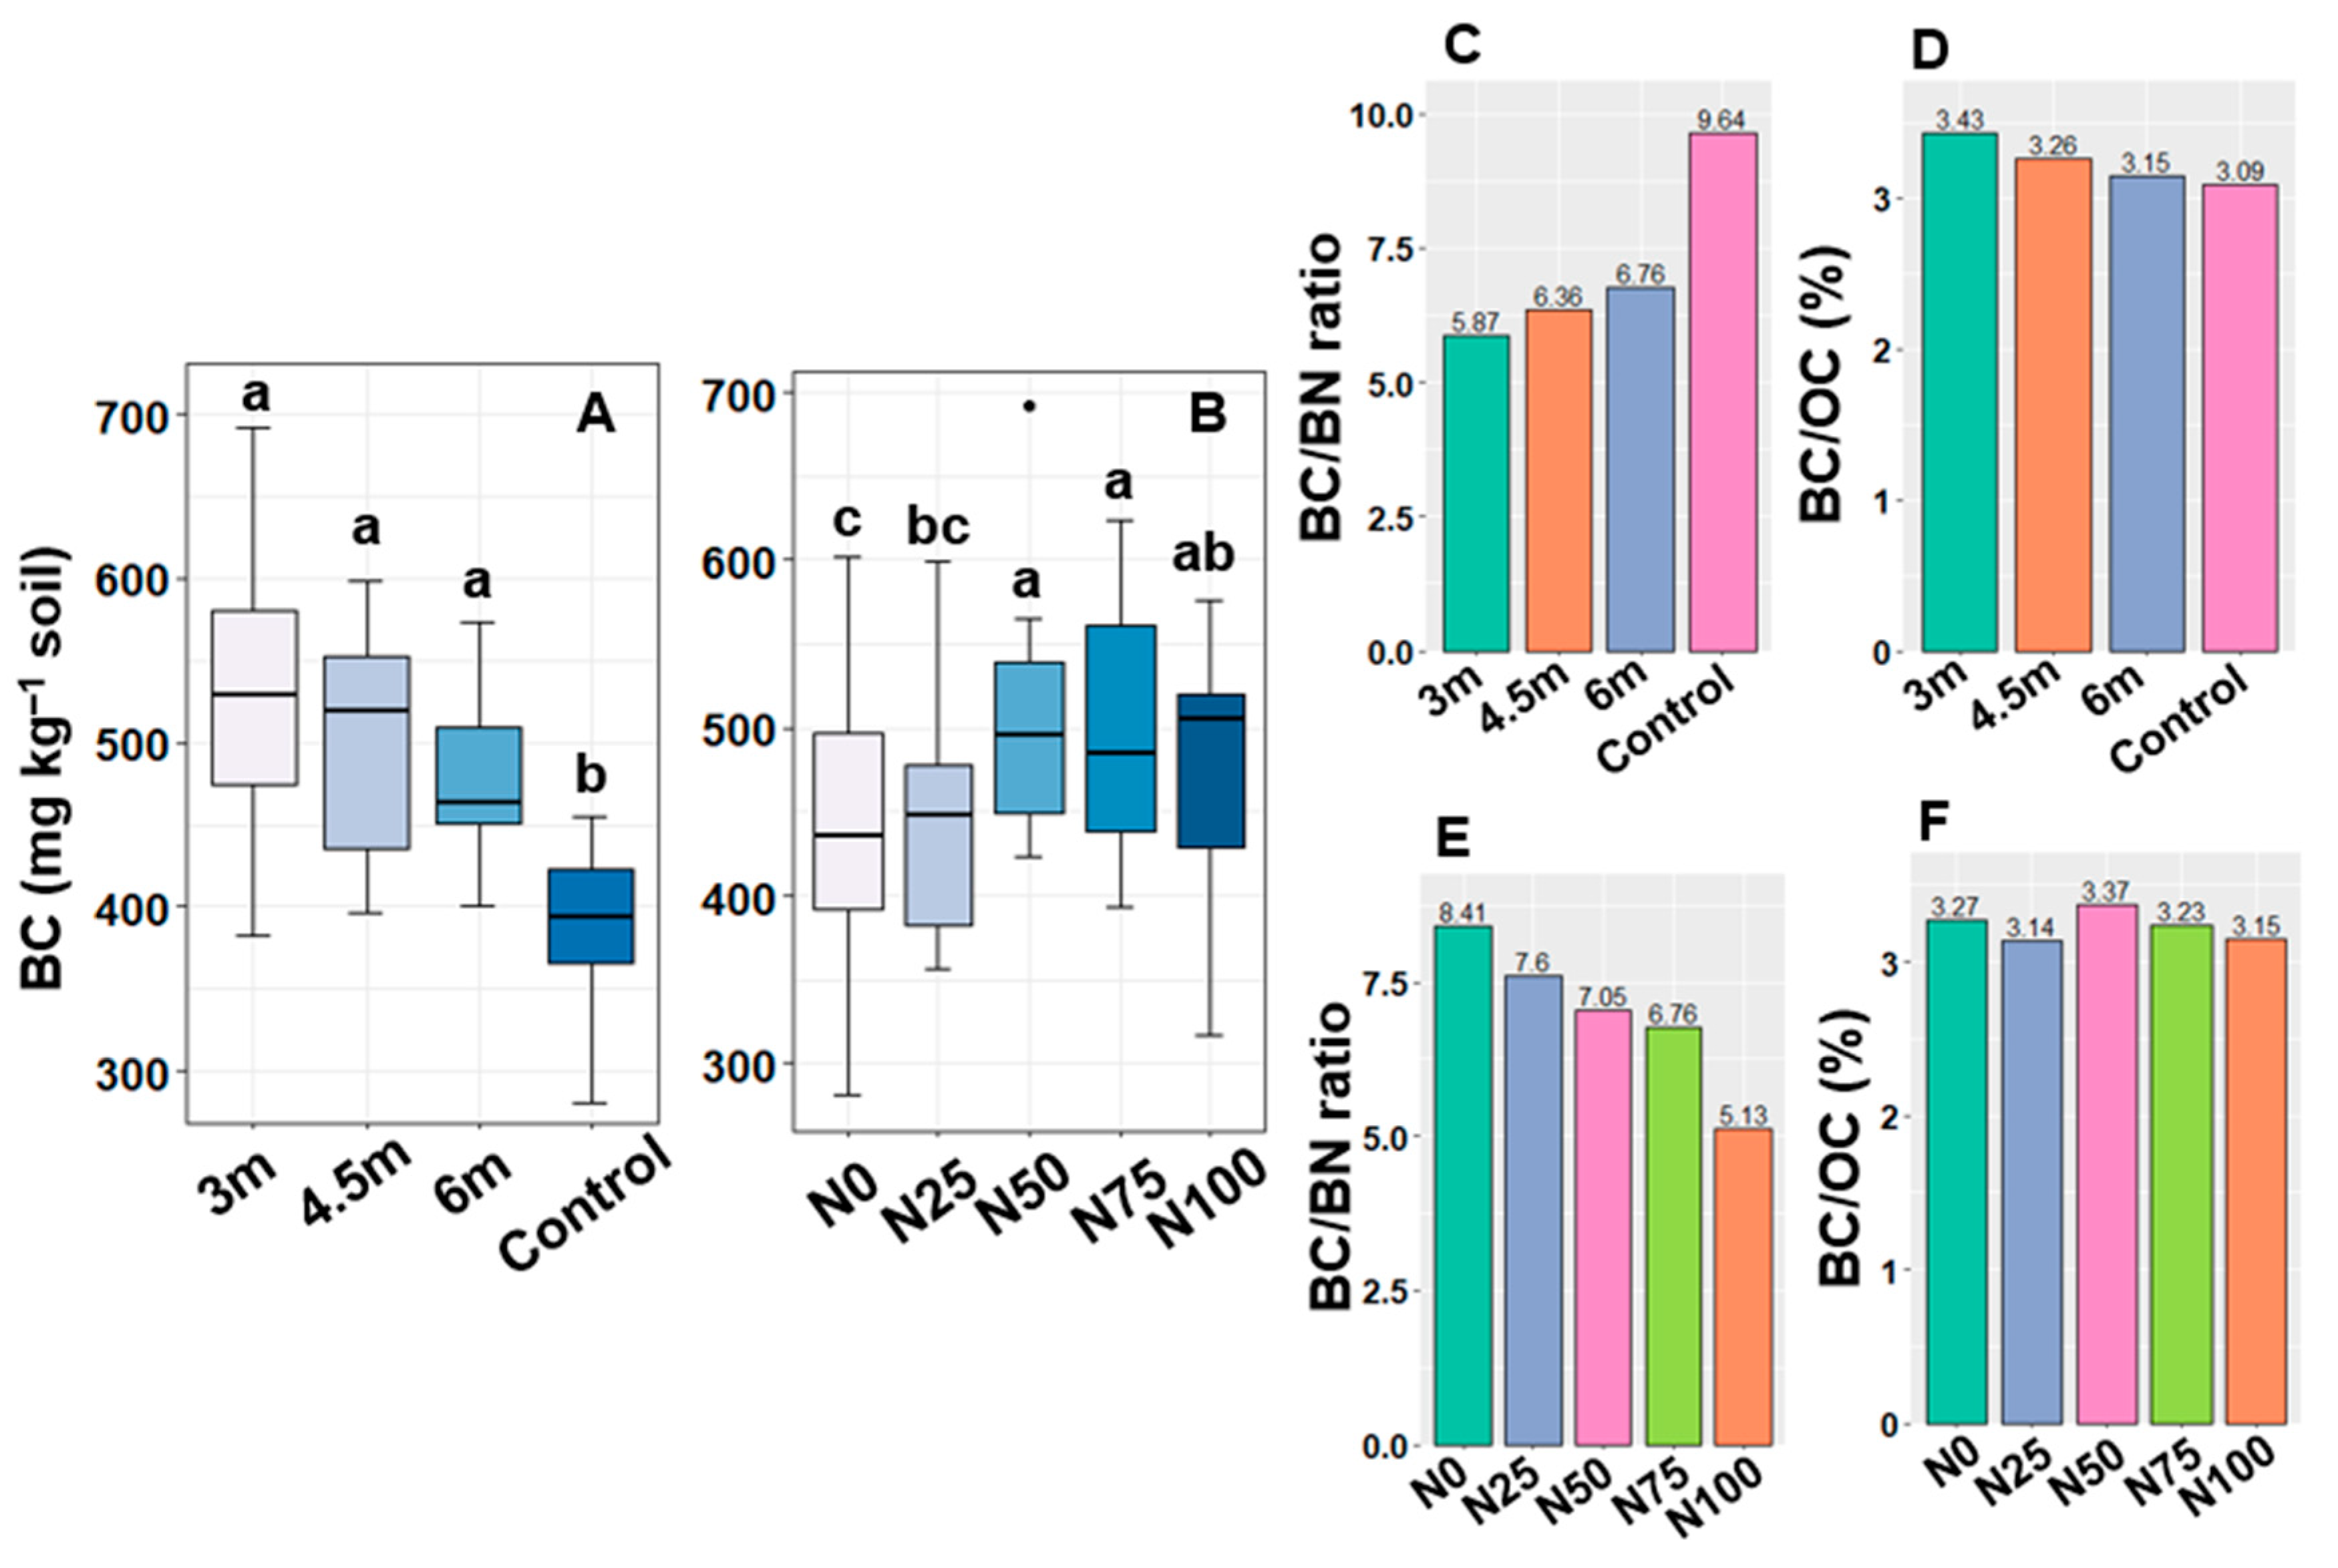
3.1. Impacts of Alley Cropping on Soil Properties
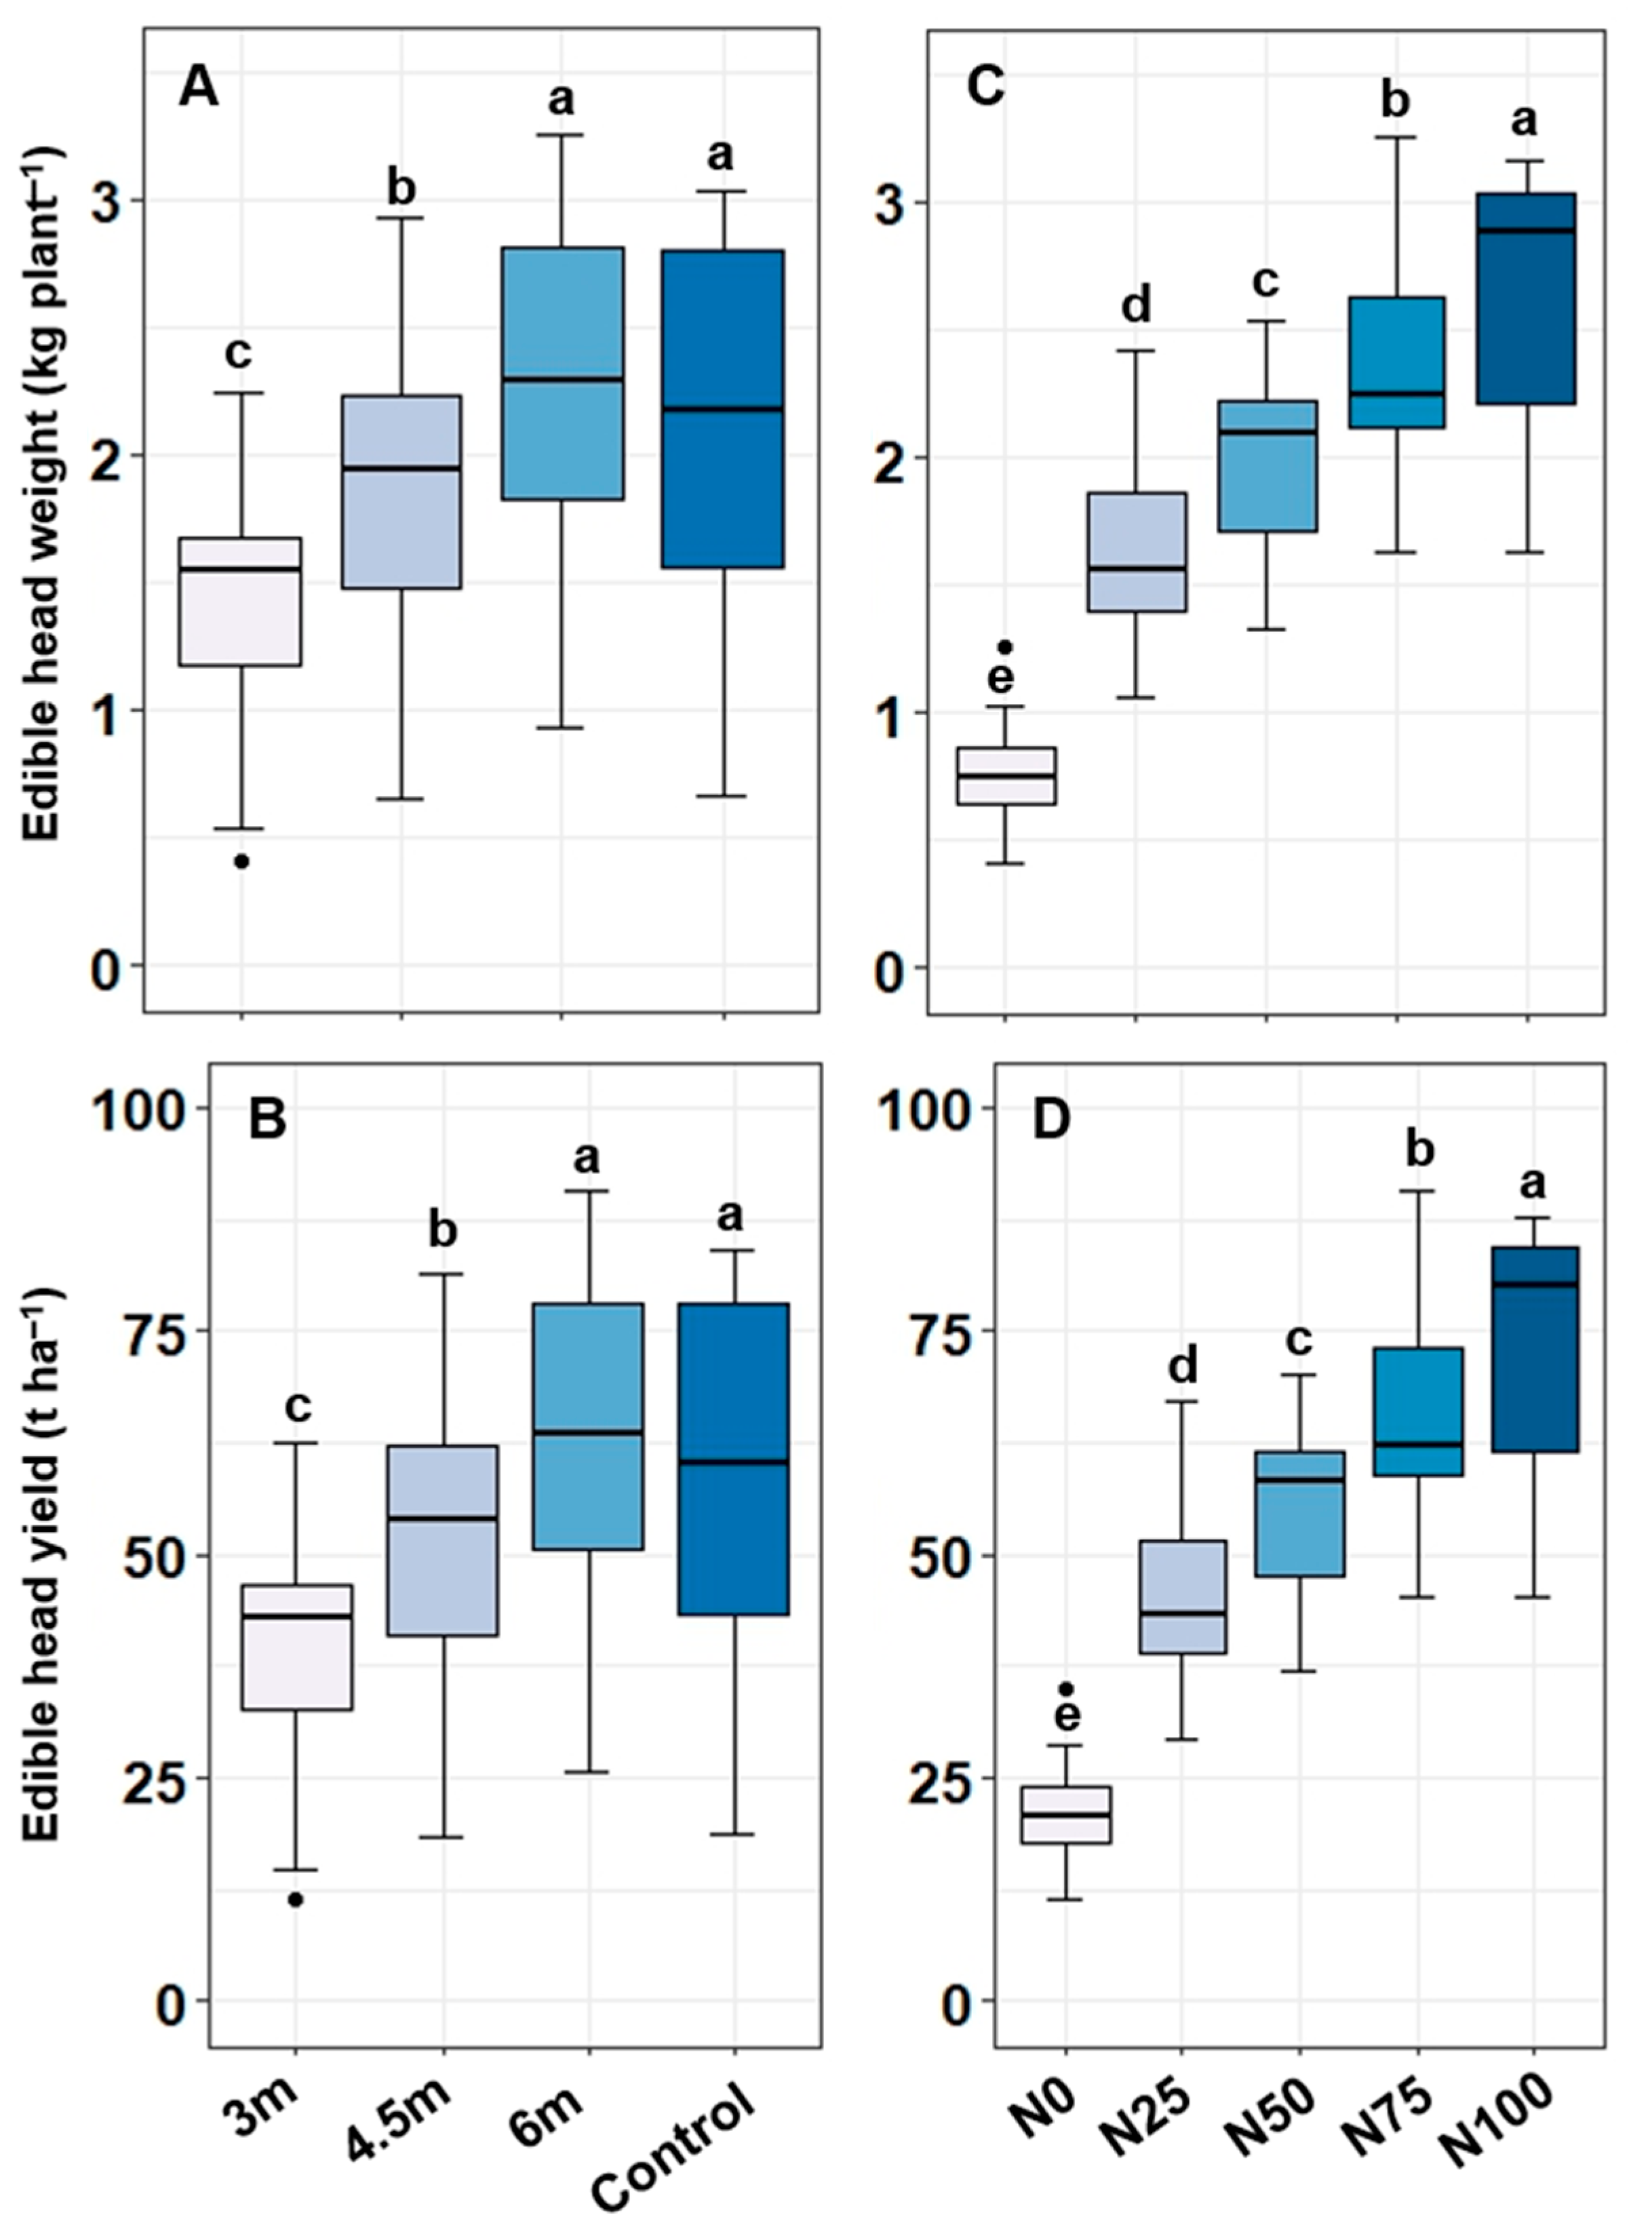
3.2. Productivity of Cabbage
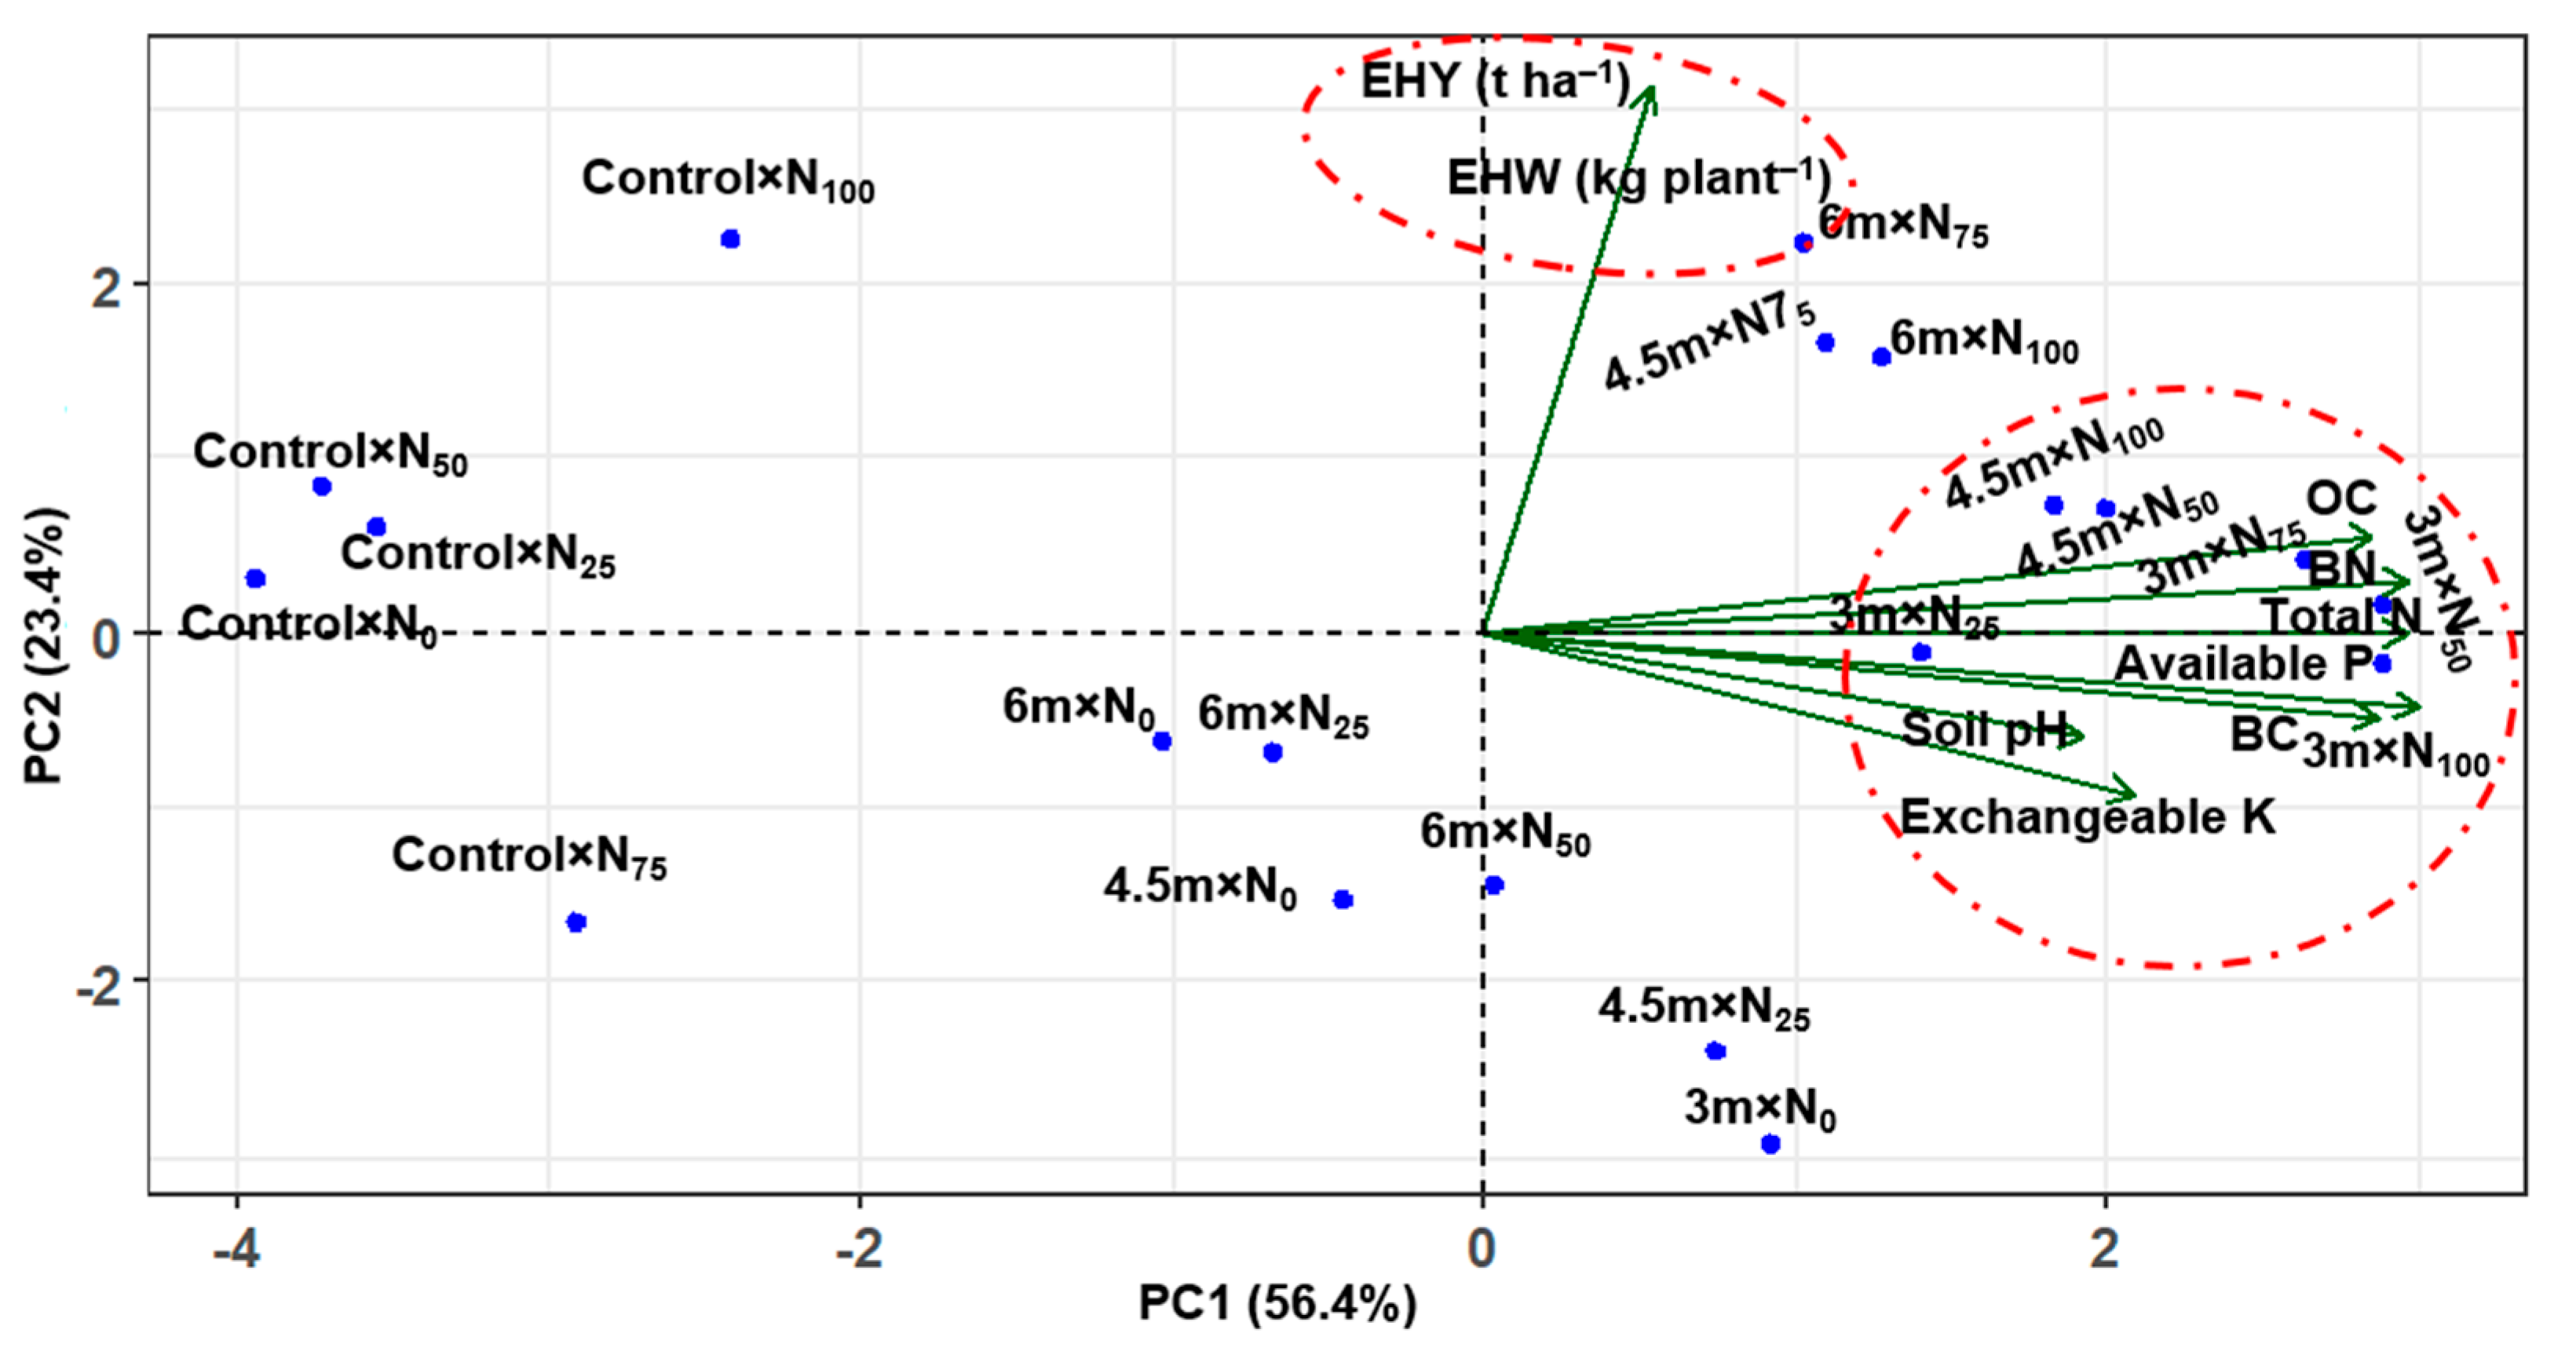
3.3. Correlation of Treatments (Main-Plot × Sub-Plot) with Soil Biochemical Properties and Cabbage Yield Using Principal Component Analysis (PCA)
4. Discussion
5. Conclusions
Author Contributions
Funding
Data Availability Statement
Acknowledgments
Conflicts of Interest
References
- BBS. Area, population and household characteristics. In Statistical Year Book Bangladesh 2022, 42nd ed.; Bose, P.C., Miah, M.A.K., Azad, A.A., Alam, M.M., Ahmed, K.U., Ahmed, Z., Hossain, M.D., Hossain, M.A., Ahmed, M., Haque, M.E., Eds.; Bangladesh Bureau of Statistics—Ministry of Planning, Govt. of Peoples Republic of Bangladesh: Dhaka, Bangladesh, 2023; pp. 49–86. [Google Scholar]
- BBS. Land use statistics. In Yearbook of Agricultural Statistics 2022, 34th ed.; Halim, M.A., Islam, M.S., Khan, M.A.H., Islam, W., Zohara, F., Faria, T., Chowdhury, D.K., Nuri, M.A.M., Hossain, M.I., Hossain, S., Eds.; Bangladesh Bureau of Statistics—Ministry of Planning, Govt. of Peoples Republic of Bangladesh: Dhaka, Bangladesh, 2023; pp. 421–429. [Google Scholar]
- Ferdush, J.; Karim, M.M.; Noor, I.J.; Jui, S.A.; Ahamed, T.; Saha, S.R. Impact of alley cropping system on soil fertility. Int. J. Adv. Geosci. 2019, 7, 173–178. [Google Scholar] [CrossRef]
- Al Riyadh, Z.; Rahman, M.A.; Miah, M.G.; Saha, S.R.; Hoque, M.A.; Rahman, M.M. Performance of spices as lower–storey crop in jackfruit–papaya multistorey agroforestry system in Bangladesh. J. Fac. Agric Kyushu Univ. 2020, 65, 223–231. [Google Scholar] [CrossRef]
- Ahmmed, S.; Jahiruddin, M.; Razia, M.S.; Begum, R.A.; Biswas, J.C.; Rahman, A.S.M.M.; Ali, M.M.; Islam, K.M.S.; Hossain, M.M.; Gani, M.N.; et al. Soil organic matter management. In Fertilizer Recommendation Guide—2018; Ahmmed, S., Jahiruddin, M., Eds.; Bangladesh Agricultural Research Council: Dhaka, Bangladesh, 2018; pp. 53–58. [Google Scholar]
- Rahman, M.M.; Rahman, M.M.; Tanu, T.A.; Rahman, M.M. Spatial environmental impact on land degradation in Bangladesh. Asian J. Appl. Sci. Eng. 2012, 1, 84–90. [Google Scholar]
- Das, A.K.; Rahman, M.A.; Rahman, M.M.; Saha, S.R.; Keya, S.S.; Suvoni, S.S.; Rizvi, J. Scaling up of jujube-based agroforestry practice and management innovations for improving efficiency and profitability of land uses in Bangladesh. Agrofor. Syst. 2022, 96, 249–263. [Google Scholar] [CrossRef]
- Das, A.K.; Rahman, M.A.; Mitra, P.; Sukhwani, V.; Shaw, R.; Mitra, B.K.; Morey, B. Up-scaling organic agriculture to enhance food and water security in South Asia. Org. Agric. 2022, 12, 475–494. [Google Scholar] [CrossRef]
- Ferdush, J.; Karim, M.M.; Himel, R.; Saha, S.; Ahamed, T. Impact of alley cropping on wheat productivity. IOSR J. Agric. Vet. Sci. 2018, 11, 17–25. [Google Scholar]
- Tuan, V.D.; Hilger, T.; MacDonald, L.; Clemens, G.; Shiraishi, E.; Vien, T.D.; Stahr, K.; Cadisch, G. Mitigation potential of soil conservation in maize cropping on steep slopes. Field Crops Res. 2014, 156, 91–102. [Google Scholar] [CrossRef]
- Hussain, K.; Wongleecharoen, C.; Hilger, T.; Ahmad, A.; Kongkaew, T.; Cadisch, G. Modelling resource competition and its mitigation at the crop-soil-hedge interface using WaNuLCAS. Agrofor. Syst. 2016, 90, 1025–1044. [Google Scholar] [CrossRef]
- Hombegowda, H.C.; Adhikary, P.P.; Jakhar, P.; Madhu, M. Alley cropping agroforestry system for improvement of soil health. In Soil Health and Environmental Sustainability; Shit, P.K., Adhikary, P.P., Bhunia, G.S., Sengupta, D., Eds.; Springer International Publishing: Cham, Switzerland, 2022; pp. 529–549. [Google Scholar]
- Rahman, M.A.; Miah, M.G.; Yahata, H. Maize production and soil properties change in alley cropping system at different nitrogen levels. Agriculturists 2009, 7, 41–49. [Google Scholar] [CrossRef]
- Ahmed, S.; Hasan, S.; Chowdhury, A.H.M.R.H.; Chowdhury, A.K.M.M.A.; Hossain, M.A. Performance of growth and soil properties change by four multipurpose tree species in alley cropping system. Int. J. Sustain. Crop. Prod. 2010, 5, 21–27. [Google Scholar]
- Barreto, A.C.; Chaer, G.M.; Fernandes, M.F. Hedgerow pruning frequency effects on soil quality and maize productivity in alley cropping with Gliricidia sepium in Northeastern Brazil. Soil Tillage Res. 2012, 120, 112–120. [Google Scholar] [CrossRef]
- Swieter, A.; Langhof, M.; Lamerre, J.; Greef, J.M. Long-term yields of oilseed rape and winter wheat in a short rotation alley cropping agroforestry system. Agrofor. Syst. 2019, 93, 1853–1864. [Google Scholar] [CrossRef]
- Sirohi, C.; Dhillon, R.S.; Chavan, S.B.; Handa, A.K.; Balyan, P.; Bhardwaj, K.K.; Ahlawat, K.S. Development of poplar-based alley crop system for fodder production and soil improvements in semi-arid tropics. Agrofor. Syst. 2022, 96, 731–745. [Google Scholar] [CrossRef]
- Koyejo, A.O.; Okpara, D.A.; Agugo, B.A.C. Effect of alley cropping on soil, maize and mungbean grown under different maize spatial arrangements and mungbean spacing’s in south east Nigeria. Agrofor. Syst. 2023, 97, 1337–1346. [Google Scholar] [CrossRef]
- Firoz, Z.A.; Rashid, M.H.; Huda, M.S. Effect of alley size and hedgerow pruning interval on phenology and yield of okra (Abelmoschus esculentus L. Moench) in hill slope. Bangladesh J. Agric. Res. 2011, 36, 143–150. [Google Scholar] [CrossRef]
- Conrad, K.A.; Dalal, R.C.; Dalzell, S.A.; Allen, D.E.; Fujinuma, R.; Menzies, N.W. Soil nitrogen status and turnover in subtropical Leucaena-grass pastures as quantified by δ15N natural abundance. Geoderma 2018, 313, 126–134. [Google Scholar] [CrossRef]
- Peng, S.; Chen, A.; Fang, H.; Wu, J.; Liu, G. Effects of vegetation restoration types on soil quality in Yuanmou dry-hot valley, China. Soil Sci. Plant Nutr. 2013, 59, 347–360. [Google Scholar] [CrossRef]
- Adhikary, P.P.; Hombegowda, H.C.; Barman, D.; Jakhar, P.; Madhu, M. Soil erosion control and carbon sequestration in shifting cultivated degraded highlands of eastern India: Performance of two contour hedgerow systems. Agrofor. Syst. 2017, 91, 757–771. [Google Scholar] [CrossRef]
- Gusha, J.; Chiuta, T.; Katsande, S.; Zvinorova, P.I.; Kagande, S.M. Performance of cattle reared on rangelands supplemented with farm-formulated diets during the dry season in Zimbabwe. Anim. Prod. Sci. 2016, 57, 1163–1169. [Google Scholar] [CrossRef]
- Leketa, K.; Donkin, E.F.; Hassen, A.; Akanmu, A.M. Effect of Leucaena leucocephala, as a protein source in a total mixed ration, on milk yield and composition of Saanen milk goats. S. Afr. J. Anim. Sci. 2019, 49, 301–309. [Google Scholar] [CrossRef]
- Santana, A.A.; Cheng, L.; Verdecia, D.M.; Ramírez, J.L.; López, S.; Cisneros, M.V.; Al-Marashdeh, O. Effect of a mixed silage of king grass (Cenchrus purpureus) and forage legumes (Leucaena leucocephala or Gliricidia sepium) on sheep intake, digestibility and nitrogen balance. Anim. Prod. Sci. 2019, 59, 2259–2264. [Google Scholar] [CrossRef]
- Lin, Y.; Chen, A.; Yan, S.; Rafay, L.; Du, K.; Wang, D.; Ge, Y.; Li, J. Available soil nutrients and water content affect leaf nutrient concentrations and stoichiometry at different ages of Leucaena leucocephala forests in dry-hot valley. J. Soils Sediments 2019, 19, 511–521. [Google Scholar] [CrossRef]
- De Angelis, A.; Gasco, L.; Parisi, G.; Danieli, P.P. A multipurpose leguminous plant for the mediterranean countries: Leucaena leucocephala as an alternative protein source: A review. Animals 2021, 11, 2230. [Google Scholar] [CrossRef] [PubMed]
- Atta-Krah, A.N. Alley farming with Leucaena: Effect of short grazed fallows on soil fertility and crop yields. Exp. Agric. 1990, 26, 1–10. [Google Scholar] [CrossRef]
- Kang, B.T.; Mulongoy, K. Nitrogen contribution of woody legumes in alley cropping systems. In Biological Nitrogen Fixation and Sustainability of Tropical Agriculture; Mulonogy, K., Gueye, M., Spencer, D.S.C., Eds.; Willey: Hoboken, NJ, USA, 1992; pp. 367–375. [Google Scholar]
- Ahmed, S.; Chowdhury, A.H.M.R.H.; Ghosh, S.C.; Islam, S.M.A.S.; Parven, A. Performance of tomato, brinjal and cabbage in alley cropping system as affected by four tree species and levels of nitrogen in upland ecosystem. J. Soil Nat. 2010, 4, 17–24. [Google Scholar]
- Rahman, M.M.; Islam, M.A.; Rahman, H.M.S.; Wadud, M.A. Performance of three winter vegetables in alley cropping system. J. Agrofor. Environ. 2013, 7, 55–58. [Google Scholar]
- Hasan, M.M.; Islam, M.M.; Rahman, H.M.S. Performance of kangkong and indian spinach in ipil-ipil based alley cropping system. J. Agrofor. Environ. 2014, 8, 99–103. [Google Scholar]
- Saha, T.R.; Rahman, M.M.; Rahman, R.; Wadud, M.A.; Rahman, G.M.M. Performance of spinach under ipil-ipil based alley cropping system. J. Agrofor. Environ. 2015, 9, 7–10. [Google Scholar]
- Imogie, A.E.; Udosen, C.V.; Ugbah, M.M.; Utulu, S.N. Long term effect of Leucaena leucocephala on soil physico-chemical properties and fresh fruit bunch (FFB) production of oil palm. Afr. J. Plant Sci. 2008, 2, 129–132. [Google Scholar]
- Fernández, M.; Alaejos, J.; Andivia, E.; Madejón, P.; Díaz, M.J.; Tapias, R. Short rotation coppice of leguminous tree Leucaena spp. improves soil fertility while producing high biomass yields in Mediterranean environment. Ind. Crops Prod. 2020, 157, 112911. [Google Scholar] [CrossRef]
- Soreng, M.K.; Kerketta, N.S. Effect of organic manures on different plant varieties of chilli (Capsicum annum) under subabul (Leucaena leucocephala) based Horti-silviculture system. J. Med. Plant Stud. 2017, 5, 273–276. [Google Scholar]
- Bageel, A.; Honda, M.D.; Carrillo, J.T.; Borthakur, D. Giant Leucaena (Leucaena leucocephala subsp. glabrata): A versatile tree-legume for sustainable agroforestry. Agrofor. Syst. 2020, 94, 251–268. [Google Scholar]
- Srinivasarao, C.; Lal, R.; Kundu, S.; Babu, M.P.; Venkateswarlu, B.; Singh, A.K. Soil carbon sequestration in rainfed production systems in the semiarid tropics of India. Sci. Total Environ. 2014, 487, 587–603. [Google Scholar] [CrossRef] [PubMed]
- Conrad, K.A.; Dalal, R.C.; Dalzell, S.A.; Allen, D.E.; Menzies, N.W. The sequestration and turnover of soil organic carbon in subtropical Leucaena-grass pastures. Agric. Ecosyst. Environ. 2017, 248, 38–47. [Google Scholar] [CrossRef]
- Akter, A.; Hoque, F.; Mukul, A.Z.A.; Kamal, M.R.; Rasha, R.K. Financial analysis of winter vegetables production in a selected area of Brahmanbaria district in Bangladesh. Int. Res. J. Agric. Food Sci. 2016, 1, 120–127. [Google Scholar]
- Chatterjee, R.; Jana, J.C.; Paul, P.K. Enhancement of head yield and quality of cabbage (Brassica oleracea) by combining different sources of nutrients. Indian J. Agric. Sci. 2012, 82, 324–327. [Google Scholar] [CrossRef]
- Reza, M.S.; Islam, A.K.M.S.; Rahman, M.A.; Miah, M.Y.; Akhter, S.; Rahman, M.M. Impact of organic fertilizers on yield and nutrient uptake of cabbage (Brassica oleracea var. capitata). J. Sci. Technol. Environ. Inform. 2016, 3, 231–244. [Google Scholar] [CrossRef]
- Sajib, K.; Dash, P.K.; Adhikary, B.; Mannan, M.A. Yield performance of cabbage under different combinations of manures and fertilizers. World J. Agric. Sci. 2015, 11, 411–422. [Google Scholar]
- Brammer, H. The Geography of the Soils of Bangladesh, 1st ed.; University Press Limited: Dhaka, Bangladesh, 1996; p. 287. [Google Scholar]
- Azad, A.K.; Goshwami, B.K.; Rahman, M.L.; Malakar, P.K.; Hasan, M.S.; Rahman, M.H.H. Handbook on Agro-Technology, 7th ed.; Bangladesh Agricultural Research Institute: Gazipur, Bangladesh, 2017; p. 171. [Google Scholar]
- Rayment, G.E.; Higginson, F.R. Australian Laboratory Handbook of Soil and Water Chemical Methods; Inkata Press Pty Ltd.: Melbourne, Australia, 1992; p. 330. [Google Scholar]
- FAO. Standard Operating Procedure for Soil Organic Carbon, Walkley-Black Method: Titration and Colorimetric Method, 1st ed.; Global Soil Partnership: Rome, Italy, 2019; pp. 1–25. [Google Scholar]
- Helrich, K. Official Methods of Analysis, 15th ed.; Association of Official Analytical Chemists: Arlington, VA, USA, 1990; pp. 1–771. [Google Scholar]
- Bray, R.H.; Kurtz, L.T. Determination of total, organic, and available forms of phosphorus in soils. Soil Sci. 1945, 59, 39–46. [Google Scholar] [CrossRef]
- Black, C.A. Methods of Soil Analysis: Part I; American Society of Agronomy: Madison, WI, USA, 1965. [Google Scholar]
- Vance, E.D.; Brookes, P.C.; Jenkinson, D.S. An extraction method for measuring soil microbial biomass carbon. Soil Biol. Biochem. 1987, 19, 703–707. [Google Scholar] [CrossRef]
- Brookes, P.C.; Landman, A.; Pruden, G.; Jenkinson, D.S. Chloroform fumigation and the release of soil nitrogen: A rapid direct extraction method to measure microbial biomass nitrogen in soil. Soil Biol. Biochem. 1985, 17, 837–842. [Google Scholar] [CrossRef]
- Lê, S.; Josse, J.; Husson, F. FactoMineR: An R package for multivariate analysis. J. Stat. Softw. 2008, 25, 1–18. [Google Scholar] [CrossRef]
- Wickham, H. Data Analysis, 1st ed.; Springer International Publishing: Cham, Switzerland, 2016; pp. 189–201. [Google Scholar]
- Miah, M.G.; Islam, M.M.; Rahman, M.A.; Ahamed, T.; Islam, M.R.; Jose, S. Transformation of jackfruit (Artocarpus heterophyllus Lam.) orchard into multistory agroforestry increases system productivity. Agrofor. Syst. 2018, 92, 1687–1697. [Google Scholar] [CrossRef]
- Dollinger, J.; Jose, S. Correction to: Agroforestry for soil health. Agrofor. Syst. 2019, 93, 1205. [Google Scholar] [CrossRef]
- Rizvi, R.H.; Handa, A.K.; Sridhar, K.B.; Singh, R.K.; Dhyani, S.K.; Rizvi, J.; Dongre, G. Spatial analysis of area and carbon stocks under Populus deltoides based agroforestry systems in Punjab and Haryana states of Indo-Gangetic Plains. Agrofor. Syst. 2020, 94, 2185–2197. [Google Scholar] [CrossRef]
- Nair, P.R.; Kumar, B.M.; Nair, V.D. An Introduction to Agroforestry: Four Decades of Scientific Developments; Springer: Cham, Switzerland, 2021; pp. 1–382. [Google Scholar]
- Rahman, M.M.; Alam, M.S.; Islam, M.M.; Kamal, M.Z.U.; Rahman, G.M.; Haque, M.M.; Biswas, J.C. Potential of legume-based cropping systems for climate change adaptation and mitigation. In Advances in Legumes for Sustainable Intensification; Academic Press: Cambridge, MA, USA, 2022; pp. 381–402. [Google Scholar]
- Alam, A.S.M.J.; Saha, S.R.; Suhag, M.; Miah, M.G.; Rahman, M.M.; Islam, M.R.; Riyadh, Z.A.; Mahmud, A. Supplementary Biomass Addition Enhances the Crop Productivity: Evidence from a Gliricidia sepium—Based Alley Cropping Practices in Gazipur District of Bangladesh. Am. J. Agric. For. 2025, 13, 38–48. [Google Scholar] [CrossRef]
- Wang, H.; Xu, J.; Liu, X.; Zhang, D.; Li, L.; Li, W.; Sheng, L. Effects of long-term application of organic fertilizer on improving organic matter content and retarding acidity in red soil from China. Soil Tillage Res. 2019, 195, 104382. [Google Scholar] [CrossRef]
- Macedo, R.S.; Moro, L.; Sousa, C.S.; Carneiro, K.A.A.; Campos, M.C.C.; de Bakker, A.P.; Beirigo, R.M. Agroforestry can improve soil fertility and aggregate-associated carbon in highland soils in the Brazilian northeast. Agrofor. Syst. 2023, 98, 1167–1179. [Google Scholar] [CrossRef]
- Wang, N.; Li, J.Y.; Xu, R.K. Use of agricultural by-products to study the pH effects in an acid tea garden soil. Soil Use Manag. 2009, 25, 128–132. [Google Scholar] [CrossRef]
- Mondal, S.; Miah, M.G.; Saleque, M.A.; Rahman, A.; Hossain, T.A.M. Effect of alley widths of Gliricidia sepium and nitrogen levels on soil properties after harvesting of rice. J. Eco-Friendly Agric. 2012, 5, 01–05. [Google Scholar]
- Jia, X.; Zhong, Y.; Liu, J.; Zhu, G.; Shangguan, Z.; Yan, W. Effects of nitrogen enrichment on soil microbial characteristics: From biomass to enzyme activities. Geoderma 2020, 366, 114256. [Google Scholar] [CrossRef]
- Yadav, R.S.; Yadav, B.L.; Chhipa, B.R.; Dhyani, S.K.; Ram, M. Soil biological properties under different tree based traditional agroforestry systems in a semi-arid region of Rajasthan, India. Agrofor. Syst. 2011, 81, 195–202. [Google Scholar] [CrossRef]
- Tian, Y.; Cao, F.; Wang, G. Soil microbiological properties and enzyme activity in Ginkgo-tea agroforestry compared with monoculture. Agrofor. Syst. 2013, 87, 1201–1210. [Google Scholar] [CrossRef]
- Toosi, E.R.; Doane, T.A.; Horwath, W.R. Abiotic solubilization of soil organic matter, a less-seen aspect of dissolved organic matter production. Soil Biol. Biochem. 2012, 50, 12–21. [Google Scholar] [CrossRef]
- Qiu, Q.; Wu, L.; Ouyang, Z.; Li, B.; Xu, Y. Different effects of plant-derived dissolved organic matter (DOM) and urea on the priming of soil organic carbon. Environ. Sci. Process. Impacts 2016, 18, 330–341. [Google Scholar] [CrossRef]
- Muhammad, I.; Lv, J.Z.; Wang, J.; Ahmad, S.; Farooq, S.; Ali, S.; Zhou, X.B. Regulation of soil microbial community structure and biomass to mitigate soil greenhouse gas emission. Front. Microbiol. 2022, 13, 868862. [Google Scholar] [CrossRef]
- Gaudel, G.; Xing, L.; Raseduzzaman, M.; Poudel, M.; Dong, W.; Hu, C. Soil microbes, carbon, nitrogen, and the carbon to nitrogen ratio indicate priming effects across terrestrial ecosystems. J. Soils Sediments 2024, 24, 307–322. [Google Scholar] [CrossRef]
- Černý, J.; Balík, J.; Kulhánek, M.; Nedvěd, V. The changes in microbial biomass C and N in long-term field experiments. Plant Soil Environ. 2008, 54, 212–218. [Google Scholar] [CrossRef]
- Rahman, G.M.; Rahman, M.M.; Alam, M.S.; Kamal, M.Z.; Mashuk, H.A.; Datta, R.; Meena, R.S. Biochar and organic amendments for sustainable soil carbon and soil health. In Carbon and Nitrogen Cycling in Soil; Springer: Singapore, 2020; pp. 45–85. [Google Scholar]
- Mahboob, W.; Yang, G.; Irfan, M. Crop nitrogen (N) utilization mechanism and strategies to improve N use efficiency. Acta Physiol. Plant. 2023, 45, 52. [Google Scholar] [CrossRef]
- Alam, M.S.; Khanam, M.; Rahman, M.M. Environment-friendly nitrogen management practices in wetland paddy cultivation. Front. Sustain. Food Syst. 2023, 7, 1020570. [Google Scholar] [CrossRef]
- Chintu, R.; Mafongoya, P.L.; Chirwa, T.S.; Kuntashula, E.; Phiri, D.; Matibini, J. Propagation and management of Gliricidia sepium planted fallows in sub-humid eastern Zambia. Exp. Agric. 2004, 40, 341–352. [Google Scholar] [CrossRef]
- Akinnifesi, F.K.; Makumba, W.; Kwesiga, F.R. Sustainable maize production using gliricidia/maize intercropping in southern Malawi. Exp. Agric. 2006, 42, 441–457. [Google Scholar] [CrossRef]
- Friday, J.B.; Fownes, J.H. Competition for light between hedgerows and maize in an alley cropping system in Hawaii, USA. Agrofor. Syst. 2002, 55, 125–137. [Google Scholar] [CrossRef]
- Wanvestraut, R.H.; Jose, S.; Nair, P.R.; Brecke, B.J. Competition for water in a pecan (Carya illinoensis K. Koch)-cotton (Gossypium hirsutum L.) alley cropping system in the southern United States. Agrofor. Syst. 2004, 60, 167–179. [Google Scholar]
- Mondal, S.; Miah, M.G.; Elahi, N.E.; Saleque, M.A.; Rahman, A. Effect of nitrogen levels and Gliricidia sepium alley widths on rice based agroforestry systems. Bangladesh Rice J. 2013, 17, 26–32. [Google Scholar] [CrossRef]
- Balakrishna, A.N.; Lakshmipathy, R.; Bagyaraj, D.J.; Ashwin, R. Influence of alley copping system on AM fungi, microbial biomass C and yield of finger millet, peanut and pigeon pea. Agrofor. Syst. 2017, 91, 487–493. [Google Scholar] [CrossRef]


| Month | Air Temperature (°C) | Relative Humidity (%) | Total Rainfall (mm) | Actual Evaporation (mm) | ||
|---|---|---|---|---|---|---|
| Maximum | Minimum | Average | ||||
| October 2018 | 31.31 | 22.31 | 26.81 | 86.84 | 92.21 | 109.15 |
| November 2018 | 29.22 | 17.22 | 23.22 | 86.73 | 21.10 | 67.68 |
| December 2018 | 25.50 | 13.10 | 19.30 | 86.65 | 11.69 | 52.87 |
| January 2019 | 26.61 | 11.61 | 19.11 | 85.42 | 0.00 | 57.84 |
| February 2019 | 27.82 | 14.34 | 21.08 | 85.36 | 46.10 | 145.32 |
| Alley Width (m) | Fresh Pruned Materials Produced and Added to the Soil (t ha−1) | Nutrients Supplied (kg ha−1) | ||||
|---|---|---|---|---|---|---|
| Leaf | Branch | Total | N | P | K | |
| 3.0 | 4.79 | 5.4 | 10.19 | 235.39 | 12.23 | 174.25 |
| 4.5 | 3.11 | 3.5 | 6.61 | 152.69 | 7.93 | 113.03 |
| 6.0 | 2.35 | 2.64 | 4.99 | 115.27 | 5.99 | 85.33 |
| Treatment Combinations | Soil pH | Organic C (g kg−1) | Total N (g kg−1) | Available P (mg kg−1) | Exchangeable K (c-mol (+) kg−1) |
|---|---|---|---|---|---|
| 3.0 m × N0 | 5.87 ± 0.03 a | 13.73 ± 0.56 fgh | 1.19 ± 0.07 | 13.15 ± 0.59 | 0.30 ± 0.02 d–h |
| 3.0 m × N25 | 5.80 ± 0.01 b | 14.90 ± 0.41 de | 1.22 ± 0.08 | 12.66 ± 0.19 | 0.35 ± 0.01 bc |
| 3.0 m × N50 | 5.79 ± 0.02 b | 17.00 ± 0.35 a | 1.20 ± 0.09 | 13.61 ± 0.45 | 0.35 ± 0.02 bc |
| 3.0 m × N75 | 5.77 ± 0.01 bc | 16.37 ± 0.30 abc | 1.25 ± 0.06 | 12.76 ± 0.51 | 0.35 ± 0.01 bc |
| 3.0 m × N100 | 5.72 ± 0.04 cd | 15.53 ± 0.36 bcde | 1.30 ± 0.04 | 14.18 ± 0.29 | 0.32 ± 0.01 b–f |
| 4.5 m × N0 | 5.78 ± 0.04 b | 13.47 ± 0.32 ghi | 1.11 ± 0.06 | 11.35 ± 0.72 | 0.35 ± 0.03 b |
| 4.5 m × N25 | 5.70 ± 0.02 de | 15.23 ± 0.36 cde | 1.14 ± 0.08 | 13.31 ± 0.33 | 0.35 ± 0.02 b |
| 4.5 m × N50 | 5.66 ± 0.02 ef | 15.37 ± 0.30 cde | 1.14 ± 0.09 | 13.63 ± 0.47 | 0.41 ± 0.02 a |
| 4.5 m × N75 | 5.67 ± 0.01 de | 16.07 ± 0.72 abcd | 1.15 ± 0.13 | 12.58 ± 0.33 | 0.29 ± 0.02 d–h |
| 4.5 m × N100 | 5.69 ± 0.00 de | 16.57 ± 0.44 ab | 1.25 ± 0.06 | 12.76 ± 0.10 | 0.31 ± 0.01 c–h |
| 6.0 m × N0 | 5.67 ± 0.01 e | 14.67 ± 0.36 ef | 1.05 ± 0.08 | 11.34 ± 0.45 | 0.33 ± 0.02 b–e |
| 6.0 m × N25 | 5.66 ± 0.02 e | 14.40 ± 0.20 efg | 1.06 ± 0.04 | 12.51 ± 0.96 | 0.32 ± 0.02 b–f |
| 6.0 m × N50 | 5.55 ± 0.01 g | 14.90 ± 0.18 def | 1.09 ± 0.10 | 12.57 ± 0.31 | 0.34 ± 0.02 bcd |
| 6.0 m × N75 | 5.76 ± 0.02 bc | 16.10 ± 0.18 abcd | 1.16 ± 0.05 | 12.49 ± 0.43 | 0.31 ± 0.02 b–g |
| 6.0 m × N100 | 5.67 ± 0.04 e | 16.03 ± 0.15 abcd | 1.16 ± 0.05 | 13.03 ± 0.45 | 0.29 ± 0.01 e–h |
| Control × N0 | 5.61 ± 0.01 f | 12.53 ± 0.20 ij | 0.96 ± 0.05 | 10.35 ± 0.41 | 0.28 ± 0.01 e–h |
| Control × N25 | 5.65 ± 0.02 ef | 12.53 ± 0.19 ij | 0.97 ± 0.07 | 10.03 ± 0.43 | 0.27 ± 0.01 fgh |
| Control × N50 | 5.48 ± 0.01 h | 12.73 ± 0.43 hij | 0.98 ± 0.06 | 9.97 ± 0.41 | 0.26 ± 0.02 h |
| Control × N75 | 5.61 ± 0.02 f | 12.73 ± 0.24 hij | 1.05 ± 0.05 | 10.13 ± 0.17 | 0.28 ± 0.01 fgh |
| Control × N100 | 5.68 ± 0.03 de | 12.10 ± 0.12 j | 1.07 ± 0.07 | 10.23 ± 0.49 | 0.27 ± 0.02 gh |
| p−value | <0.001 | <0.001 | 1.00 | 0.21 | <0.001 |
| Parameters | Initial Soil Properties | Final Soil Properties | ||||||
|---|---|---|---|---|---|---|---|---|
| 3.0 m | 4.5 m | 6.0 m | Control | 3.0 m | 4.5 m | 6.0 m | Control | |
| Soil pH | 5.67 ± 0.01 | 5.59 ± 0.04 | 5.56 ± 0.03 | 5.48 ± 0.03 | 5.79 ± 0.02 (2.12) | 5.70 ± 0.01 (1.97) | 5.66 ± 0.02 (1.80) | 5.61 ± 0.02 (2.37) |
| Organic C (g kg−1) | 14.4 ± 0.32 | 14.2 ± 0.31 | 14.0 ± 0.26 | 12.7 ± 0.15 | 15.5 ± 0.35 (7.64) | 15.3 ± 0.31 (7.75) | 15.2 ± 0.22 (8.57) | 12.5 ± 0.11 (−1.57) |
| Total N (g kg−1) | 1.11 ± 0.03 | 1.09 ± 0.03 | 1.05 ± 0.03 | 1.04 ± 0.02 | 1.23 ± 0.03 (10.81) | 1.16 ± 0.03 (6.42) | 1.10 ± 0.03 (4.76) | 1.01 ± 0.03 (−2.88) |
| Available P (mg kg−1) | 11.99 ± 0.21 | 11.07 ± 0.25 | 10.70 ± 0.26 | 9.66 ± 0.16 | 13.27 ± 0.22 (10.68) | 12.72 ± 0.27 (14.91) | 12.39 ± 0.26 (15.79) | 10.14 ± 0.15 (4.97) |
| Exchangeable K (c-mol (+) kg−1) | 0.28 ± 0.01 | 0.30 ± 0.01 | 0.30 ± 0.01 | 0.26 ± 0.00 | 0.33 ± 0.01 (17.86) | 0.34 ± 0.01 (13.33) | 0.32 ± 0.01 (6.67) | 0.27 ± 0.01 (3.85) |
| Biomass C (mg kg−1 soil) | 493.11 ± 20.79 | 475.95 ± 15.72 | 458.31 ± 15.04 | 398.05 ± 4.39 | 530.82 ± 21.07 (7.65) | 499.18 ± 17.07 (4.88) | 478.79 ± 11.89 (4.47) | 386.77 ± 13.39 (−2.83) |
| Biomass N (mg kg−1 soil) | 86.20 ± 4.24 | 75.90 ± 4.35 | 69.11 ± 4.67 | 41.29 ± 3.15 | 90.43 ± 4.30 (4.90) | 78.49 ± 4.35 (3.42) | 70.66 ± 4.67 (2.24) | 40.0 ± 3.22 (−3.12) |
| Treatment Combinations | BC (mg kg−1 Soil) | BN (mg kg−1 Soil) | BC/BN Ratio | BC/OC (%) | BN/TN (%) |
|---|---|---|---|---|---|
| 3.0 m × N0 | 533.7 ± 58.71 | 41.4 ± 3.59 fg | 12.89 | 3.89 | 3.48 |
| 3.0 m × N25 | 477.97 ± 56.64 | 78.47 ± 5.78 def | 6.09 | 3.21 | 6.43 |
| 3.0 m × N50 | 561.1 ± 68.03 | 89.0 ± 2.98 cd | 6.30 | 3.30 | 7.42 |
| 3.0 m × N75 | 544.17 ± 43.19 | 99.23 ± 2.73 bc | 5.48 | 3.32 | 7.94 |
| 3.0 m × N100 | 537.17 ± 20.46 | 114.03 ± 3.76 a | 4.71 | 3.47 | 8.77 |
| 4.5 m × N0 | 460.5 ± 44.47 | 59.2 ± 4.95 hij | 7.79 | 3.41 | 5.33 |
| 4.5 m × N25 | 497.97 ± 56.64 | 66.8 ± 5.52 ghi | 7.45 | 3.28 | 5.86 |
| 4.5 m × N50 | 511.37 ± 39.79 | 86.83 ± 2.00 de | 5.88 | 3.32 | 7.62 |
| 4.5 m × N75 | 539.43 ± 22.15 | 76.8 ± 2.12 efg | 7.02 | 3.35 | 6.68 |
| 4.5 m × N100 | 486.63 ± 34.96 | 102.83 ± 3.34 b | 4.73 | 2.93 | 8.23 |
| 6.0 m × N0 | 459.93 ± 13.99 | 50.83 ± 5.18 jk | 9.04 | 3.13 | 4.84 |
| 6.0 m × N25 | 451.3 ± 4.11 | 58.07 ± 5.26 h–k | 7.77 | 3.13 | 5.48 |
| 6.0 m × N50 | 512.78 ± 25.13 | 78.33 ± 2.06 def | 6.55 | 3.44 | 7.19 |
| 6.0 m × N75 | 478.57 ± 50.29 | 68.27 ± 2.86 fgh | 7.01 | 2.97 | 5.88 |
| 6.0 m × N100 | 491.43 ± 18.97 | 97.8 ± 4.63 bc | 5.02 | 3.07 | 8.43 |
| Control × N0 | 323.17 ± 27.96 | 29.97 ± 5.09 l | 10.78 | 2.58 | 3.12 |
| Control × N25 | 370.7 ± 7.50 | 33.13 ± 5.47 l | 11.19 | 2.96 | 3.41 |
| Control × N50 | 434.07 ± 10.57 | 32.27 ± 2.83 l | 13.45 | 3.42 | 3.29 |
| Control × N75 | 415.77 ± 16.76 | 48.07 ± 2.08 k | 8.65 | 3.27 | 4.58 |
| Control × N100 | 390.17 ± 36.74 | 56.57 ± 4.55 ijk | 6.90 | 3.22 | 5.29 |
| p−value | 0.36 | 0.04 |
| Treatment Combinations | Edible Head Weight (kg plant−1) | Edible Head Yield (t ha−1) |
|---|---|---|
| 3.0 m × N0 | 0.51 ± 0.05 | 14.21 ± 1.43 |
| 3.0 m × N25 | 1.24 ± 0.10 | 34.53 ± 2.65 |
| 3.0 m × N50 | 1.53 ± 0.11 | 42.40 ± 3.01 |
| 3.0 m × N75 | 1.82 ± 0.19 | 50.56 ± 5.14 |
| 3.0 m × N100 | 2.00 ± 0.19 | 55.46 ± 5.22 |
| 4.5 m × N0 | 0.72 ± 0.05 | 20.03 ± 1.39 |
| 4.5 m × N25 | 1.51 ± 0.05 | 41.96 ± 1.44 |
| 4.5 m × N50 | 2.01 ± 0.16 | 55.93 ± 4.39 |
| 4.5 m × N75 | 2.14 ± 0.10 | 59.44 ± 2.79 |
| 4.5 m × N100 | 2.54 ± 0.24 | 70.46 ± 6.60 |
| 6.0 m × N0 | 1.07 ± 0.10 | 29.81 ± 2.72 |
| 6.0 m × N25 | 2.01 ± 0.12 | 55.93 ± 3.29 |
| 6.0 m × N50 | 2.22 ± 0.20 | 61.67 ± 5.62 |
| 6.0 m × N75 | 2.71 ± 0.29 | 75.28 ± 7.99 |
| 6.0 m × N100 | 3.08 ± 0.04 | 85.65 ± 1.07 |
| Control × N0 | 0.77 ± 0.05 | 21.46 ± 1.46 |
| Control × N25 | 1.85 ± 0.29 | 51.30 ± 8.13 |
| Control × N50 | 2.14 ± 0.04 | 59.44 ± 0.98 |
| Control × N75 | 2.59 ± 0.21 | 72.04 ± 5.89 |
| Control × N100 | 2.93 ± 0.05 | 81.48 ± 1.40 |
| p−value | 0.80 | 0.81 |
Disclaimer/Publisher’s Note: The statements, opinions and data contained in all publications are solely those of the individual author(s) and contributor(s) and not of MDPI and/or the editor(s). MDPI and/or the editor(s) disclaim responsibility for any injury to people or property resulting from any ideas, methods, instructions or products referred to in the content. |
© 2025 by the authors. Licensee MDPI, Basel, Switzerland. This article is an open access article distributed under the terms and conditions of the Creative Commons Attribution (CC BY) license (https://creativecommons.org/licenses/by/4.0/).
Share and Cite
Suhag, M.; Ahamed, T.; Das, A.K.; Rahman, M.A.; Rahman, M.M.; Miah, M.G. Leucaena-Based Alley Cropping System: An Approach for Reclaiming Degraded Land, Reducing the Use of Inorganic Nitrogen Fertilizer, and Improving Crop Productivity. Nitrogen 2025, 6, 25. https://doi.org/10.3390/nitrogen6020025
Suhag M, Ahamed T, Das AK, Rahman MA, Rahman MM, Miah MG. Leucaena-Based Alley Cropping System: An Approach for Reclaiming Degraded Land, Reducing the Use of Inorganic Nitrogen Fertilizer, and Improving Crop Productivity. Nitrogen. 2025; 6(2):25. https://doi.org/10.3390/nitrogen6020025
Chicago/Turabian StyleSuhag, Md., Tofayel Ahamed, Ashim Kumar Das, Md. Abiar Rahman, Md. Mizanur Rahman, and Md. Giashuddin Miah. 2025. "Leucaena-Based Alley Cropping System: An Approach for Reclaiming Degraded Land, Reducing the Use of Inorganic Nitrogen Fertilizer, and Improving Crop Productivity" Nitrogen 6, no. 2: 25. https://doi.org/10.3390/nitrogen6020025
APA StyleSuhag, M., Ahamed, T., Das, A. K., Rahman, M. A., Rahman, M. M., & Miah, M. G. (2025). Leucaena-Based Alley Cropping System: An Approach for Reclaiming Degraded Land, Reducing the Use of Inorganic Nitrogen Fertilizer, and Improving Crop Productivity. Nitrogen, 6(2), 25. https://doi.org/10.3390/nitrogen6020025