Article

Co-Inoculation of Soybean Seeds with Azospirillum and/or Rhizophagus Mitigates the Deleterious Effects of Waterlogging in Plants under Enhanced CO2 Concentrations

by
Eduardo Pereira Shimoia
1,*,
Douglas Antônio Posso
1,*,
Cristiane Jovelina da-Silva
2,
Adriano Udich Bester
1,
Nathalia Dalla Corte Bernardi
1,
Ivan Ricardo Carvalho
3,
Ana Cláudia Barneche de Oliveira
4,
Luis Antonio de Avila
5 and
Luciano do Amarante
1
1
Botanic Department, Federal University of Pelotas, Capão do Leão 96010-610, RS, Brazil
2
Department of Horticultural Science, North Carolina State University, Raleigh, NC 27695, USA
3
Department of Agricultural Studies, Regional University of Northwestern Rio Grande do Sul, Ijuí 98700-000, RS, Brazil
4
Embrapa Temperate Agriculture, Brazilian Agricultural Research Corporation, Pelotas 96010-971, RS, Brazil
5
Department of Plant Soil Sciences, Mississippi State University, Starkville, MS 39762, USA
*
Authors to whom correspondence should be addressed.
Nitrogen 2024, 5(4), 941-976; https://doi.org/10.3390/nitrogen5040061
Submission received: 30 August 2024 / Revised: 27 September 2024 / Accepted: 3 October 2024 / Published: 15 October 2024

Abstract

:
Rising CO2 levels, as predicted by global climate models, are altering environmental factors such as the water cycle, leading to soil waterlogging and reduced oxygen availability for plant roots. These conditions result in decreased energy production, increased fermentative metabolism, impaired nutrient uptake, reduced nitrogen fixation, and altered leaf gas exchanges, ultimately reducing crop productivity. Co-inoculation techniques involving multiple plant growth-promoting bacteria or arbuscular mycorrhizal fungi have shown promise in enhancing plant resilience to stress by improving nutrient uptake, biomass production, and nitrogen fixation. This study aimed to investigate carbon and nitrogen metabolism adaptations in soybean plants co-inoculated with Bradyrhizobium elkanii, Azospirillum brasilense, and Rhizophagus intraradices under waterlogged conditions in CO2-enriched environments. Plants were grown in pots in open-top chambers at ambient CO2 concentration (a[CO2]) and elevated CO2 concentration (e[CO2]). After reaching the V5 growth stage, the plants were subjected to waterlogging for seven days, followed by a four-day reoxygenation period. The results showed that plants’ co-inoculation under e[CO2] mitigated the adverse effects of waterlogging. Notably, plants inoculated solely with B. elkanii under e[CO2] displayed results similar to co-inoculated plants under a[CO2], suggesting that co-inoculation effectively mitigates the waterlogging stress, with plant physiological traits comparable to those observed under elevated CO2 conditions.

1. Introduction

Global climate change, driven by anthropogenic and natural factors, is a widely studied topic due to its direct and indirect impacts on terrestrial ecosystems. Among the most examined aspects are temperature fluctuations and the increasing emission of greenhouse gases, particularly carbon dioxide (CO2). Since the Industrial Revolution, atmospheric CO2 levels have risen exponentially, with the most severe global carbon emission scenarios observed in recent years [1]. As of July 2023, the atmospheric CO2 concentration was recorded at 417.1 µmol mol−1 at the Mauna Loa Observatory in the USA. In 2005, a study projected that CO2 levels could double by 2100, from 400 to 800 µmol mol−1 [2].
Plants use atmospheric CO2 for carbon fixation during photosynthesis. While a significant amount of atmospheric carbon is sequestered by algae and plankton in oceans, carbon cycling in terrestrial plants plays a crucial role, regardless of the type of carbon fixation pathway (C3, C4, or CAM). However, elevated CO2 levels can lead to plant morphological and physiological changes [3,4]. C3 plants are more responsive to higher atmospheric CO2, showing greater biomass accumulation than C4 plants [2,5,6]. This biomass increase in C3 plants often translates into enhanced productivity, though this response tends to plateau at CO2 concentrations of around 1000 µmol mol−1 [3,7].
Despite the direct relationship between atmospheric CO2 and biomass increase in C3 plants, growth is often limited by other factors such as water and nutrient availability, particularly nitrogen, which plays a key role in many physiological processes [8,9,10]. Many C3 plants—especially those in the Fabaceae family, like soybeans—form symbiotic relationships with diazotrophic bacteria to enhance nitrogen absorption and assimilation. This symbiosis helps minimize nitrogen deficiency and optimize the benefits of elevated CO2 [11,12]. At higher CO2 concentrations, plants provide more sugars to bacteria in the nodules, thereby boosting nitrogen fixation and increasing nitrogen supply to the plant [13,14,15]. However, even plants that form symbiotic relationships with N2-fixing bacteria may experience limitations in productivity due to the availability of other essential nutrients, such as phosphorus, potassium, magnesium, and molybdenum in the soil [12,16,17,18]. To address this, co-inoculation practices using multiple diazotrophic bacteria, such as Bradyrhizobium and Azospirillum, have been shown to enhance nutrient uptake in plants. These bacteria increase root surface area and N2 fixation, thereby improving plant nutrient absorption and growth, known as plant growth-promoting bacteria (PGPB) [19].
Additionally, arbuscular mycorrhizal fungi (AMF), such as Rhizophagus intraradices, also contribute to improved plant growth by enhancing nutrient uptake, particularly phosphorus and nitrogen, and promoting better root development [20,21]. AMF also plays a key role in soil carbon mobilization. Under elevated CO2 conditions, the diversity and abundance of soil microbial communities, including AMF, tend to increase [22]. As a result, co-inoculation strategies could be even more effective for improving soybean growth under elevated CO2.
Due to climate change and increasing atmospheric CO2, approximately 17 million km2 of land globally are now subject to waterlogging events. Under waterlogged conditions, plants experience metabolic changes due to reduced oxygen availability in the roots [23]. Hypoxia leads to decreased biological nitrogen fixation and photosynthesis, resulting in lower carbohydrate and sugar production, ultimately reducing plant biomass [24,25].
Under normoxic conditions, plants exposed to elevated CO2 or co-inoculated with multiple PGPB often show increases in nodule number, nodule weight, N2 fixation per unit weight, and earlier nodulation [12,16,20,26,27,28]. However, the effects of elevated CO2 and co-inoculation with diazotrophic bacteria and AMF under root hypoxia caused by waterlogging remain unclear. Therefore, this study aims to elucidate the adaptations in carbon and nitrogen metabolism in soybean plants co-inoculated with Bradyrhizobium elkanii, Bradyrhizobium japonicum, Azospirillum brasilense, and/or Rhizophagus intraradices under waterlogged conditions in a CO2-enriched environment.

2. Materials and Methods

2.1. Plant Material, Growth Conditions, and Treatments

Soybean seeds of the PEL BR 157060 cultivar, which is sensitive to waterlogging, were provided by the EMBRAPA (Brazilian Agricultural Research Corporation, Pelotas, RS, Brazil) breeding program. The seeds were sterilized with 80% ethanol for two minutes, followed by 10% (w/v) sodium hypochlorite for two minutes, then rinsed with five minutes of sterilized water. After sterilization, the seeds were inoculated or co-inoculated with microorganisms, as in Table 1.
Sixty minutes after the inoculation or co-inoculation process, five seeds were planted per pot and placed in two open-top chambers (OTCs). One chamber maintained ambient CO2 levels (a[CO2], 400 µmol mol−1) without a gas injection system, while the other chamber was regulated to maintain a CO2 level of 700 µmol mol−1 (e[CO2]), as shown in Figure S1. One-liter pots, filled with soil typical of lowland regions (soil collection site: 31°48′26.21″ S; 52°28′48.20″ W), were sterilized in an autoclave (127 °C; 1.5 ATM; 1 h 30 min) and amended to meet the nutritional demands for high soybean productivity, following the Fertilization and Liming Manual. The soil’s chemical characteristics are described in Table S1.
After the unifoliolate leaf pair emerged and developed, thinning was performed to leave only three plants per pot. When the plants reached the V4 phenological stage (five nodes and four trefoils), they were subjected to waterlogging for seven days, followed by four-day reoxygenation. During the waterlogging treatment, the four replicates of each treatment were placed in a larger container with a water layer approximately seven centimeters above the soil. For reoxygenation, the pots were removed from the containers and allowed to drain naturally (Figure 1). Data collection occurred twice: once at the end of the waterlogging period and again at the end of the reoxygenation period. Biometric analyses were conducted on each sampling day, and the material for biochemical analyses was stored in an ultra-freezer at −80 °C.
Temperature, humidity, and CO2 levels within the OTCs (Figure S1) were monitored throughout the experiment at three-minute intervals. Daily averages between 6:30 and 19:30 generated the graphs shown in Figure S1, excluding periods when the plants were not photosynthetically active (night).

2.2. Gas Exchange, Plant Growth, Biomass Accumulation, and Total Chlorophyll Content

Gas exchange was measured in intact young leaves (the first fully expanded trefoil) using a portable infrared CO2 analyzer (model LI-6400XT, LI-COR, Inc., Lincoln, NE, USA) at the end of both the waterlogging and reoxygenation periods. Measurements were taken between 8 and 10 a.m., with the CO2 concentration in the chamber set at either 400 μmol mol−1 or 700 μmol mol−1, and a photon flux density of 1250 μmol photons m−2 s−1, using the LI-COR 6400-02B (LI-COR, Inc., Lincoln, NE, USA) light source attached to the measurement chamber (2 × 3 cm) with block temperature control set at 25 °C.
At the end of the waterlogging and subsequent reoxygenation periods, the following biometric parameters were evaluated: (I) leaf area (LA), measured using the formula LA = 2.0185 × (L × W), where L is the maximum leaf length and W is the maximum leaf width [29]; (II) stem diameter (SD), measured with a digital caliper at the stem base just above the substrate; (III) root fresh weight (RFW); (IV) root volume (RV), measured by water displacement in a graduated cylinder; and (V) shoot dry weight (SDW), determined after drying in an oven at 65 °C until a constant weight was achieved.
To extract chlorophyll a, b, and carotenoid levels, 0.020 g of the youngest fully expanded trefoil was combined with 5 mL of dimethyl sulfoxide. The sample and reagent were incubated in a water bath at 65 °C for one hour, after which absorbance readings at 480, 649, and 665 nm were taken using a spectrophotometer to calculate and express the results in μg g−1 [30].

2.3. Hydrogen Peroxide Levels, Lipid Peroxidation, and Antioxidant Enzyme Activity

Leaves and roots (0.250 g) were ground in liquid nitrogen, homogenized with 0.1% (w/v) trichloroacetic acid, and then centrifuged at 13,000× g at 4 °C for 20 min. The H2O2 content was determined following the methodology of Velikova et al. [31]. The extent of lipid peroxidation in the samples was assessed by determining malondialdehyde (MDA) content using thiobarbituric acid-reactive substances (TBARS), following the method of Cakmak and Horst [32], utilizing the same extract obtained previously for H2O2 analysis.
The activities of antioxidant enzymes were determined in leaves and roots from 0.250 g samples. The samples were ground with liquid nitrogen and homogenized with 2 mL of 100 mM phosphate buffer (pH 7.8) containing 100 μM EDTA, 10 mM ascorbic acid, and 25% (w/w) polyvinylpolypyrrolidone (PVPP). The extracts were centrifuged at 12,000× g for 20 min at 4 °C, and the supernatants were used as crude enzyme extracts. Superoxide dismutase (SOD; EC 1.15.1.1) activity was assessed using the methodology described by Giannopolitis and Ries [33]. Catalase (CAT; EC 1.11.1.6) activity was assessed according to Azevedo et al. [34]. Ascorbate peroxidase (APX; EC 1.11.1.11) activity was evaluated in a reaction mixture as detailed by Nakano and Asada [35].

2.4. Fermentative Enzymes and Ala-AT

Root samples (0.300 g) were ground with liquid nitrogen and homogenized in 2 mL of 50 mM Tris-HCl buffer (pH 7.5) containing 1 mM dithiothreitol (DTT) and 25% (w/w) PVPP. The homogenate was centrifuged at 12,000× g for 20 min at 4 °C, and the supernatant was desalted using a PD-10 column (GE Healthcare, Buckinghamshire, UK). After protein elution, aliquots were used to determine the activities of pyruvate decarboxylase (PDC; EC 4.1.1.17), lactate dehydrogenase (LDH; EC 1.1.1.17), alcohol dehydrogenase (ADH; EC 1.1.1.1), and alanine aminotransferase (Ala-AT; EC 2.6.1.2). Enzyme activities were measured by monitoring NADH oxidation at 340 nm. The activities of ADH and PDC were assessed following the method proposed by Hanson et al. [36]. LDH activity was measured according to the method described by Hanson and Jacobsen [37]. The Ala-AT assay was conducted as described by Good and Muench [38].

2.5. Total Soluble Sugar Content

The extraction of total soluble sugars (TSS) from 0.5 g of root samples followed the method of Bieleski and Turner [39], using an extraction solution composed of methanol, chloroform, and water in a 12:5:3 ratio. The TSS content was determined using the method of Graham and Smydzuk [40], where 0.15% (w/v) anthrone in sulfuric acid was used, and absorbance readings were taken at 620 nm. TSS levels were determined based on a glucose calibration curve with concentrations ranging from 0 to 150 µmol mL−1.

2.6. Experimental Design and Statistical Analyses

The pots were arranged in two growth chambers (OTCs) in a completely randomized experiment. Each pot contained three plants, which together formed an experimental unit, and each treatment consisted of four replications. A control group was established for both waterlogged and reoxygenated plants. The experiment was analyzed using a three-factor design: Factor 1 represented CO2 levels (ambient CO2 [a(CO2)] or enriched CO2 [e(CO2)]); Factor 2 represented water treatments (control or waterlogging/reoxygenation); and Factor 3 represented co-inoculation treatments (IB, CA, CR, and CAR).
Statistical analysis was performed using Rbio software version 191. The data were checked for normality and homogeneity before performing a three-way analysis of variance (ANOVA). When significant differences were detected via the F-test in ANOVA, the data were compared using Tukey’s test (p ≤ 0.05). Graphs were created using SigmaPlot 12 software. Principal component analysis (PCA) and hierarchical clustering analysis (HCA) graphs were constructed using the Metaboanalyst tool (https://metaboanalyst.ca/; Quebec, Canada)

3. Results

3.1. Effect of e[CO2] and Co-Inoculation on Gas Exchange and Photosynthetic Pigments

Regarding CO2 assimilation (A; Figure 2A), all plants subjected to waterlogging for seven days exhibited a reduction in A, regardless of the environment (ambient CO2 (a[CO2]) or enriched CO2 (e[CO2]). However, plants grown under e[CO2] displayed higher A rates. On average, in a[CO2] conditions, waterlogged plants reduced their A by 11% compared to control plants, while this difference decreased to 2.5% for plants grown under e[CO2]. The results also indicated differences among microbiological treatments; plants co-inoculated with CA, CR, and CAR exhibited less reduction in A compared to plants solely inoculated with Bradyrhizobium (IB treatment).
In the IB treatment under hydric control conditions in a[CO2], plants showed 1.2 times less A than those in CA, CR, and CAR treatments. When comparing waterlogged plants, this difference increased to 34%, with CA, CR, and CAR plants demonstrating higher A rates. Plants grown under e[CO2] from CA, CR, and CAR hydric control conditions exhibited 17% more A than IB plants. The difference between IB and CA, CR, and CAR plants increased to 57% for waterlogged plants. During reoxygenation, plants grown under a[CO2] showed smaller differences between their respective treatments under control conditions, with a 29% lower A in reoxygenated plants. Among microbiological treatments, control plants in the IB treatment had, on average, 37% less A than those in CA, CR, and CAR treatments, with 30% higher results observed during reoxygenation in co-inoculated plants. Under e[CO2] conditions, reoxygenated plants exhibited improved results, with an average reduction in A of 24% compared to their respective control plants, and the differences among microbiological treatments were also smaller. Reoxygenated IB plants had 15% lower A than control plants in the CA, CR, and CAR treatments, while reoxygenated CA, CR, and CAR plants had 29% higher A than IB plants under e[CO2].
Stomatal conductance (gs; Figure 2B) mirrored the results for A, as waterlogged plants exhibited reduced gs, regardless of the environment (a[CO2] or e[CO2]) or microbiological treatment. Notably, control plants grown under e[CO2] had, on average, 27% lower gs compared to those grown under a[CO2] and 33% lower in waterlogged plants. Regarding microbiological treatments, CA, CR, and CAR plants grown under a[CO2] and subjected to waterlogging exhibited 90% higher gs than IB plants. In the e[CO2] environment, the difference in gs between waterlogged IB and CA, CR, and CAR plants was 41%, with a 14% difference among their respective control plants. During the reoxygenation period, gs of plants grown in a[CO2] remained below their respective controls, with an average difference of 33%. Microbiological treatments CA, CR, and CAR had 76% higher gs than IB plants, while control plants showed a smaller difference of 19%. Under e[CO2] conditions, no differences were found between control or reoxygenated plants or among microbiological treatments, indicating that under e[CO2], plants possess a better recovery capacity due to their metabolic condition before and during waterlogging stress.
Regardless of CO2 level, plants reduced transpiration rate (E) during waterlogging (Figure 2C). Plants grown in a[CO2] and subjected to waterlogging for seven days exhibited an average reduction in E of 52% compared to control plants. Under e[CO2] conditions, waterlogged plants showed a reduction of 45% in E compared to their controls. The difference in E between IB and CA, CR, and CAR plants was smaller in a[CO2] (6%) compared to the 9% difference found in e[CO2] plants. During reoxygenation, the difference in E between reoxygenated and control plants was 20% for a[CO2] conditions, while for e[CO2] plants, the difference was 11%. Differences between IB and CA, CR, and CAR plants during reoxygenation varied, with a greater difference observed in a[CO2] (64%) compared to only 6% in e[CO2] plants.
As expected, soybean plants grown under e[CO2] conditions exhibited an average increase in internal CO2 concentration (Ci) of 90% compared to those grown under a[CO2] (Figure 2D). Waterlogged plants grown in a[CO2] conditions showed a reduction in Ci of 4%, with statistical differences between waterlogged and control plants observed only in the IB and CAR treatments. Under e[CO2], this reduction increased to 6%, with Ci decreasing for all microbiological treatments during waterlogging. During the reoxygenation period, only the difference between a[CO2] and e[CO2] remained, with no significant differences observed between reoxygenated and control plants or among microbiological treatments. All treatments under reoxygenation conditions reached Ci values similar to their respective controls, indicating that plants under e[CO2] exhibit enhanced photosynthetic capacity to cope with stress.
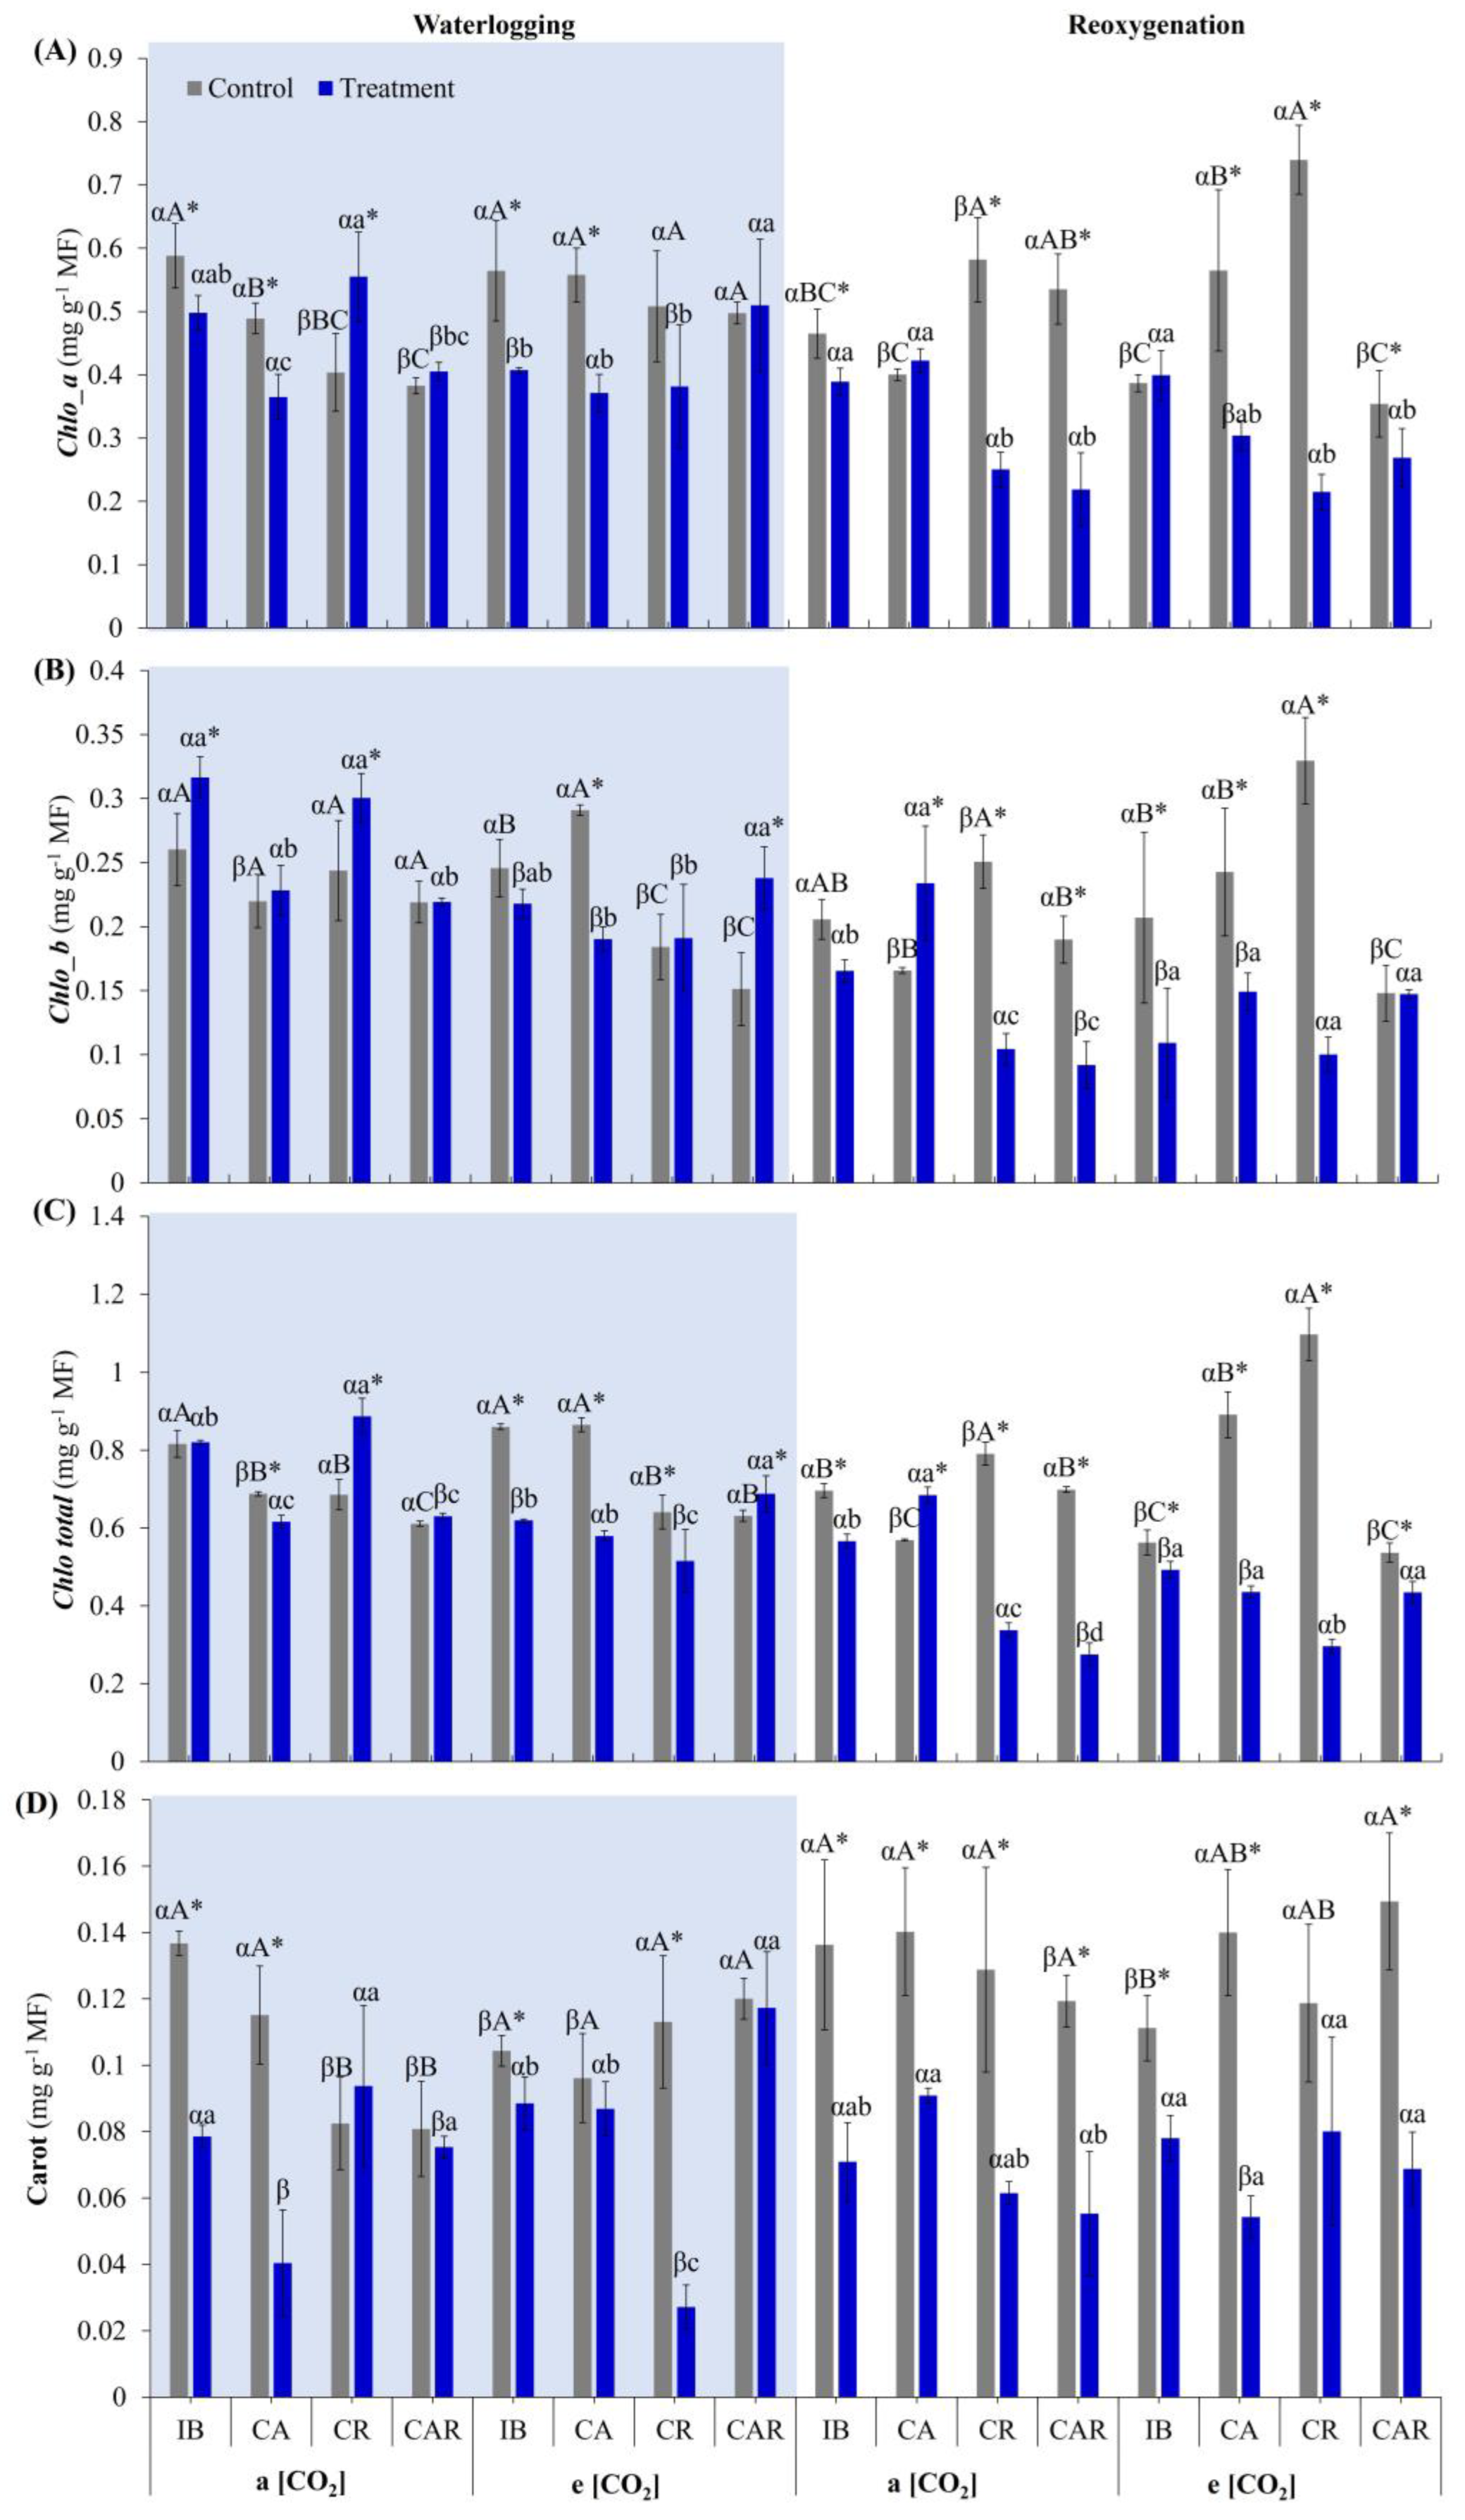
Photosynthetic pigments are presented in Figure 3A–D. Although there was no clear response pattern to waterlogging or CO2 levels, the main results are highlighted. Control co-inoculated plants grown under a[CO2] had lower chlorophyll a (Chlo_a) content compared to IB plants in the same environment (Figure 3A). Additionally, under a[CO2], waterlogged IB and CA treatments exhibited reduced Chlo_a content, while CR and CAR treatments maintained similar pigment levels to their respective controls. In e[CO2] conditions, the Chlo_a content among control treatments did not differ between IB and co-inoculated plants (CA, CR, and CAR). Both IB and CA plants reduced Chlo_a during waterlogging in this environment, while CR and CAR maintained Chlo_a levels like those of their control plants. During the reoxygenation period in a[CO2], IB and CA treatments did not differ from their control plants; however, CR and CAR treatments reduced Chlo_a content to half of that presented by their control plants. Under e[CO2], IB and CAR treatments maintained Chlo_a levels similar to their control plants during reoxygenation, while CA and CR plants reduced their Chlo_a content by 50%.
Chlorophyll b (Chlo_b) levels (Figure 3B) in plants grown under a[CO2] did not decrease during waterlogging. Under e[CO2], only the CA treatment exhibited reduced Chlo_b during waterlogging, while IB, CR, and CAR plants showed reduced Chlo_b. During reoxygenation in a[CO2], only CA plants maintained their Chlo_b levels, while other microbiological treatments exhibited reductions. Under e[CO2] during reoxygenation, only CAR plants maintained their Chlo_b levels. Additionally, among control treatments, CAR had the lowest Chlo_b content.
Total chlorophyll content (Figure 3C) was lower in control co-inoculated plants grown under a[CO2]. Among waterlogged plants in this environment, only CA exhibited a slight reduction compared to its control. Under e[CO2] conditions, unlike other treatments, only CAR plants did not show a reduction when waterlogged. During the reoxygenation process in a[CO2], only the CA treatment did not reduce total chlorophyll content compared to its control plants. However, under e[CO2], total chlorophyll content drastically decreased in CA and CR treatments, approximately 50% less than their controls, while IB and CAR treatments were less affected, with only about a 2% reduction compared to their controls.
Carotenoid content (carot) (Figure 3D) in CR and CAR plants did not decrease during waterlogging under a[CO2], whereas IB and CA treatments exhibited reductions of 40% and 70%, respectively, compared to their controls. Under e[CO2], only the CR treatment showed a 70% reduction in carot during waterlogging. During reoxygenation, carot content decreased in all treatments, regardless of a[CO2] or e[CO2] conditions.

3.2. Effect of e[CO2] and Co-Inoculation on H2O2 Production and Lipid Peroxidation

3.2.1. H2O2 Content and Lipid Peroxidation in Leaves

The production of H2O2 in leaves increased in plants subjected to a seven-day waterlogging period, regardless of CO2 level or microbiological treatment (Figure 4A). Plants grown under a[CO2] produced more H2O2 than those grown under e[CO2], irrespective of hydric condition. The increase in H2O2 production in waterlogged plants compared to control plants was 43% higher under a[CO2], while the increase in the e[CO2] environment was 31% higher. Co-inoculated control plants from CA, CR, and CAR treatments produced 15% less H2O2 than solely inoculated IB plants, which decreased to a 9% reduction under waterlogging in a[CO2] conditions. Under e[CO2], the difference in H2O2 production between co-inoculated control plants from CA, CR, and CAR treatments and solely inoculated IB plants was 6%, and the difference in waterlogged plants was 9%. During the reoxygenation period, H2O2 levels in leaves tended to equalize with control plants; however, the difference between plants grown under a[CO2] and e[CO2] persisted. The difference between control and reoxygenated plants under a[CO2] was 23%, while for plants grown under e(CO2), it was 27%. Differences were also noted between solely inoculated IB plants and co-inoculated CA, CR, and CAR plants, with a 10% difference in control and reoxygenated plants under a[CO2]. This difference also occurred in the e[CO2] environment, with a 5% difference among control plants and a 23% difference during reoxygenation.
Accompanying the increased H2O2 production during waterlogging, leaves also had greater lipid peroxidation, irrespective of CO2 level or microbiological treatment (Figure 4B). In plants grown under a[CO2], waterlogging increased malondialdehyde (MDA) content by 19%, while in e[CO2] conditions, MDA levels increased by 13% compared to their respective control plants. Regardless of CO2 level, differences were observed between solely inoculated IB plants and co-inoculated plants from CA, CR, and CAR treatments. The difference among control plants in the a[CO2] environment was 11%, while in the e[CO2] environment, it was 5%. When calculating the same ratio among waterlogged plants, co-inoculated plants exhibited lower MDA levels, with 20% and 11% reductions, respectively. During the reoxygenation process, MDA levels remained consistent between control and reoxygenated plants, regardless of CO2 level or microbiological treatment. However, a small difference persisted between solely inoculated IB plants and co-inoculated CA, CR, and CAR plants in the a[CO2] environment, with a 12% difference for both control and reoxygenated plants. In the e[CO2] environment, this difference was reduced to 5% for control and reoxygenated plants.

3.2.2. H2O2 Content and Lipid Peroxidation in Roots

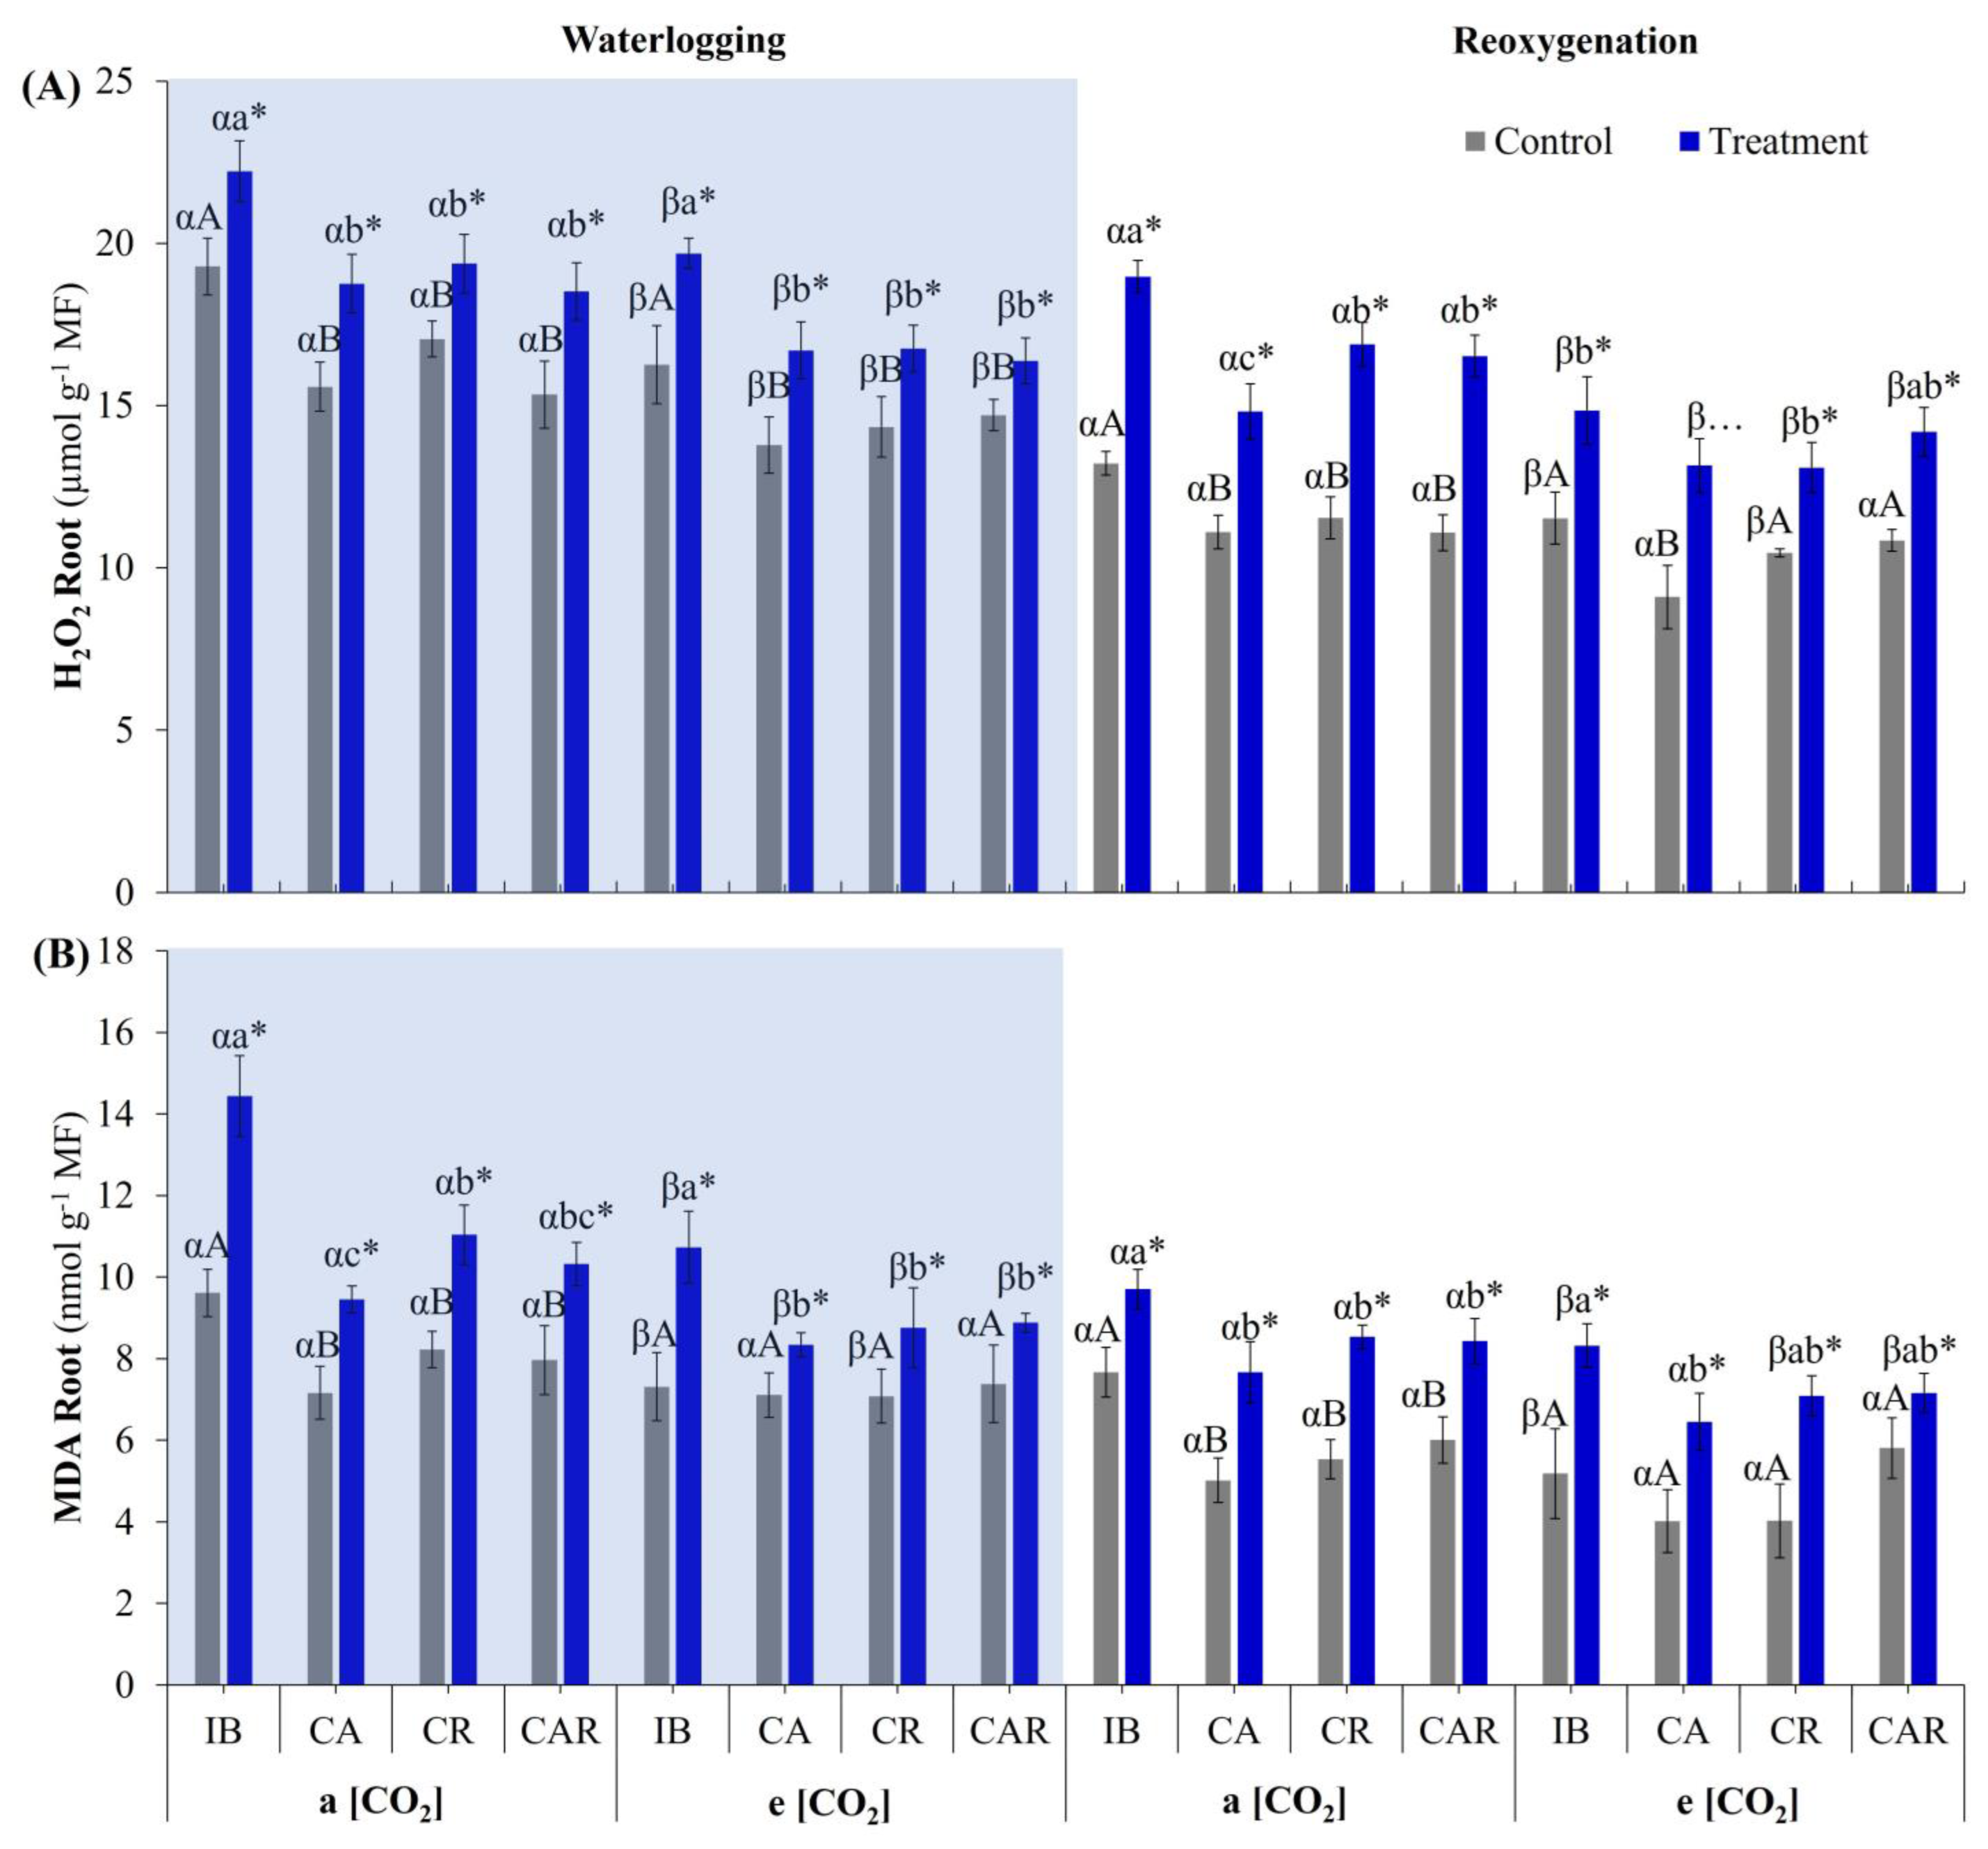
During the waterlogging period, regardless of CO2 level or microbiological treatment, roots exhibited increased levels of H2O2 (Figure 5A). On average, plants grown under a[CO2] during waterlogging showed a 17% increase in H2O2 production; a similar increase was observed in plants grown under e[CO2]. Control IB plants grown under a[CO2] produced 17% more H2O2 than those from CA, CR, and CAR treatments. This difference decreased to 15% when these plants were subjected to waterlogging. Control IB plants grown under e[CO2] had 12% more H2O2 than control plants from CA, CR, and CAR treatments, and this difference increased to 15% during waterlogging. During the reoxygenation period, the difference between reoxygenated and control plants in the a[CO2] environment was 43%, while under e[CO2], it was 31%. Regardless of CO2 level, the difference between IB and CA, CR, and CAR plants was 15% among those maintained under control conditions, whereas the difference during reoxygenation was 12% and 10% for a[CO2] and e[CO2] environments, respectively. In addition to the increases observed during the seven days of waterlogging, the highest H2O2 levels in roots were recorded in reoxygenated plants.
Lipid peroxidation in roots also increased during the waterlogging period, regardless of CO2 level or microbiological treatment, but was intensified during the reoxygenation period (Figure 5B). Waterlogged plants grown under a[CO2] exhibited a 37% increase in MDA concentration, while plants grown under e[CO2] showed a 27% increase. The average difference in MDA concentration between IB and CA, CR, and CAR plants grown under a[CO2] was 20%, whereas this difference decreased to only 2% under e[CO2]. During waterlogging, the average difference between IB plants and those from CA, CR, and CAR treatments was 28% in the a[CO2] environment and 11% in the e[CO2] environment. During the reoxygenation period, MDA levels increased by 42% for plants grown under a[CO2] and 53% for those grown under e[CO2] compared to their respective control plants. Control IB plants under a[CO2] during the reoxygenation period had 28% more MDA than CA, CR, and CAR treatment plants; this difference was 11% for plants grown under e[CO2]. IB plants undergoing reoxygenation under a[CO2] exhibited 15% more MDA than CA, CR, and CAR reoxygenated plants and a 17% increase when evaluated among plants grown under e[CO2].

3.3. Effect of e[CO2] and Co-Inoculation on Antioxidant Enzyme Activity

3.3.1. Antioxidant Enzyme System in Leaves

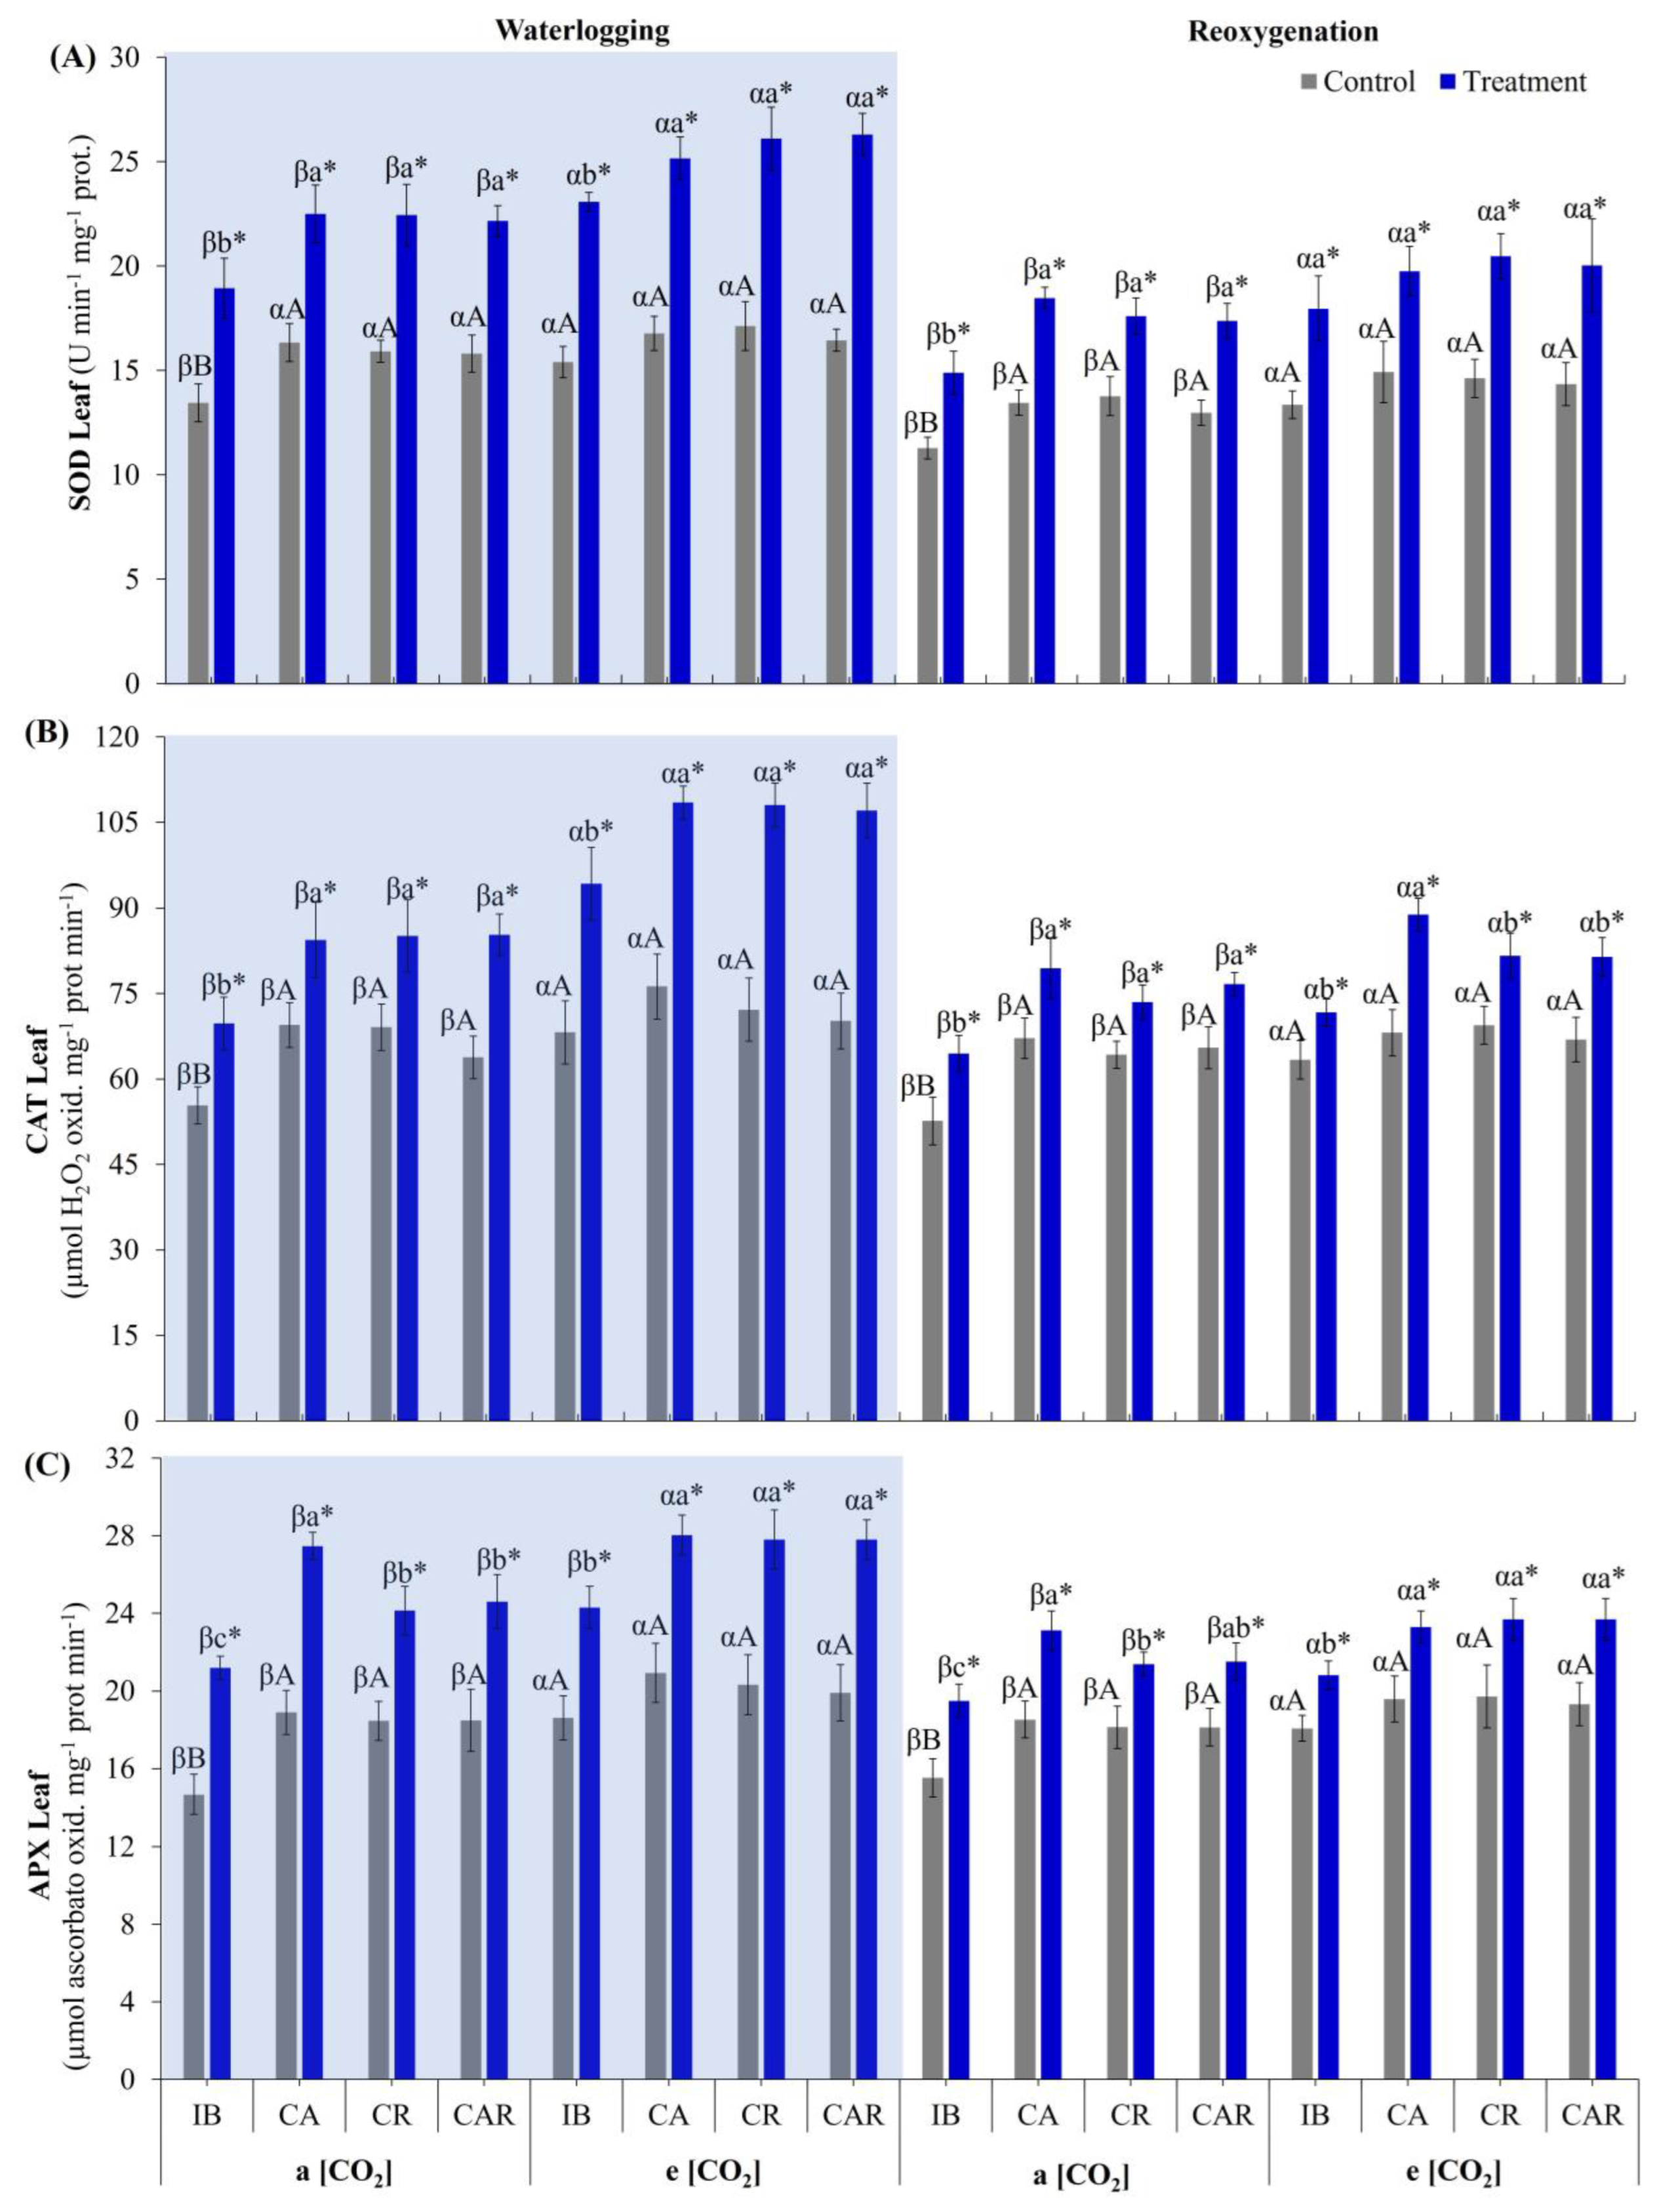
The antioxidant enzymatic system exhibited increased activity in leaves during the waterlogging period, regardless of CO2 level or microbiological treatment, with greater activity observed in plants under e[CO2] conditions (Figure 6). The activity of the SOD enzyme in leaves (Figure 6A) increased by 40% in waterlogged plants grown under a[CO2]. In contrast, the increase was 53% for those grown under e[CO2] compared to their respective control plants. Differences in SOD activity were also noted among microbiological treatments, with solely inoculated IB plants exhibiting lower SOD activity than co-inoculated CA, CR, and CAR plants, both in the a[CO2] environment (19%) and the e[CO2] environment (14%). During waterlogging, the difference between IB and CA, CR, and CAR plants was 18% for plants grown under a[CO2] and 12% for those under e[CO2]. The reoxygenation period was insufficient for SOD activity in reoxygenated plants to reach control levels, with reoxygenated plants grown under a[CO2] showing 41% higher activity compared to control plants. Under e[CO2], reoxygenated plants exhibited 38% higher SOD activity than their respective controls. Differences among microbiological treatments persisted during reoxygenation, with control IB plants showing 18% lower SOD activity compared to co-inoculated CA, CR, and CAR plants in the a[CO2] environment and a 19% difference for reoxygenated plants. In the e[CO2] environment, the difference between solely inoculated IB plants and co-inoculated CA, CR, and CAR plants was 9% for control plants and 11% for reoxygenated plants.
The activity of the CAT enzyme in leaves also increased, showing a 26% rise in waterlogged plants under a[CO2] and a 45% increase under e[CO2] compared to their respective controls (Figure 6B). The difference between control IB plants and co-inoculated CA, CR, and CAR plants was 21% under a[CO2] and 6% under e[CO2]. After seven days of waterlogging, these differences increased to 22% for plants under a[CO2] and 14% for those under e[CO2]. During reoxygenation, the differences between control and reoxygenated plants were 17% for those grown under a[CO2] and 21% for those under e[CO2]. Control IB plants under a[CO2] exhibited 25% lower CAT activity compared to co-inoculated CA, CR, and CAR plants, while the difference was 19% during reoxygenation. In the e[CO2] environment, the difference between control IB plants and CA, CR, and CAR plants during waterlogging was 7%, increasing to 17% during reoxygenation.
APX enzyme activity increased by 38% in waterlogged plants grown under a[CO2] compared to their respective controls (Figure 6C). In plants grown under e[CO2], this increase due to waterlogging stress was 35%. Differences between microbiological treatments were also noted, with solely inoculated IB plants under a[CO2] exhibiting 27% lower APX activity than co-inoculated CA, CR, and CAR plants; this difference reduced to 10% for plants grown under e[CO2]. During the reoxygenation period, differences decreased but remained significant, with APX activity in plants grown under a[CO2] being 21% higher than control plants and 19% higher in those grown under e[CO2]. The difference between IB plants in control conditions grown under a[CO2] was 17% lower than co-inoculated CA, CR, and CAR plants, reducing this difference to 13% during reoxygenation. Evaluating control IB plants compared to control CA, CR, and CAR plants in the e[CO2] environment revealed an average difference of 8%, increasing to 13% during reoxygenation.
Notably, IB plants subjected to waterlogging under a[CO2] exhibited lower antioxidant activity than IB plants subjected to waterlogging under e[CO2]. However, co-inoculated CA, CR, and CAR plants grown under a[CO2] showed antioxidant activity equivalent to that of IB treatment plants grown under e[CO2], indicating that co-inoculation enhances the antioxidant system in relation to increased CO2 levels. This suggests these plants have a superior capacity to cope with stressful conditions.

3.3.2. Antioxidant Enzyme System in Roots

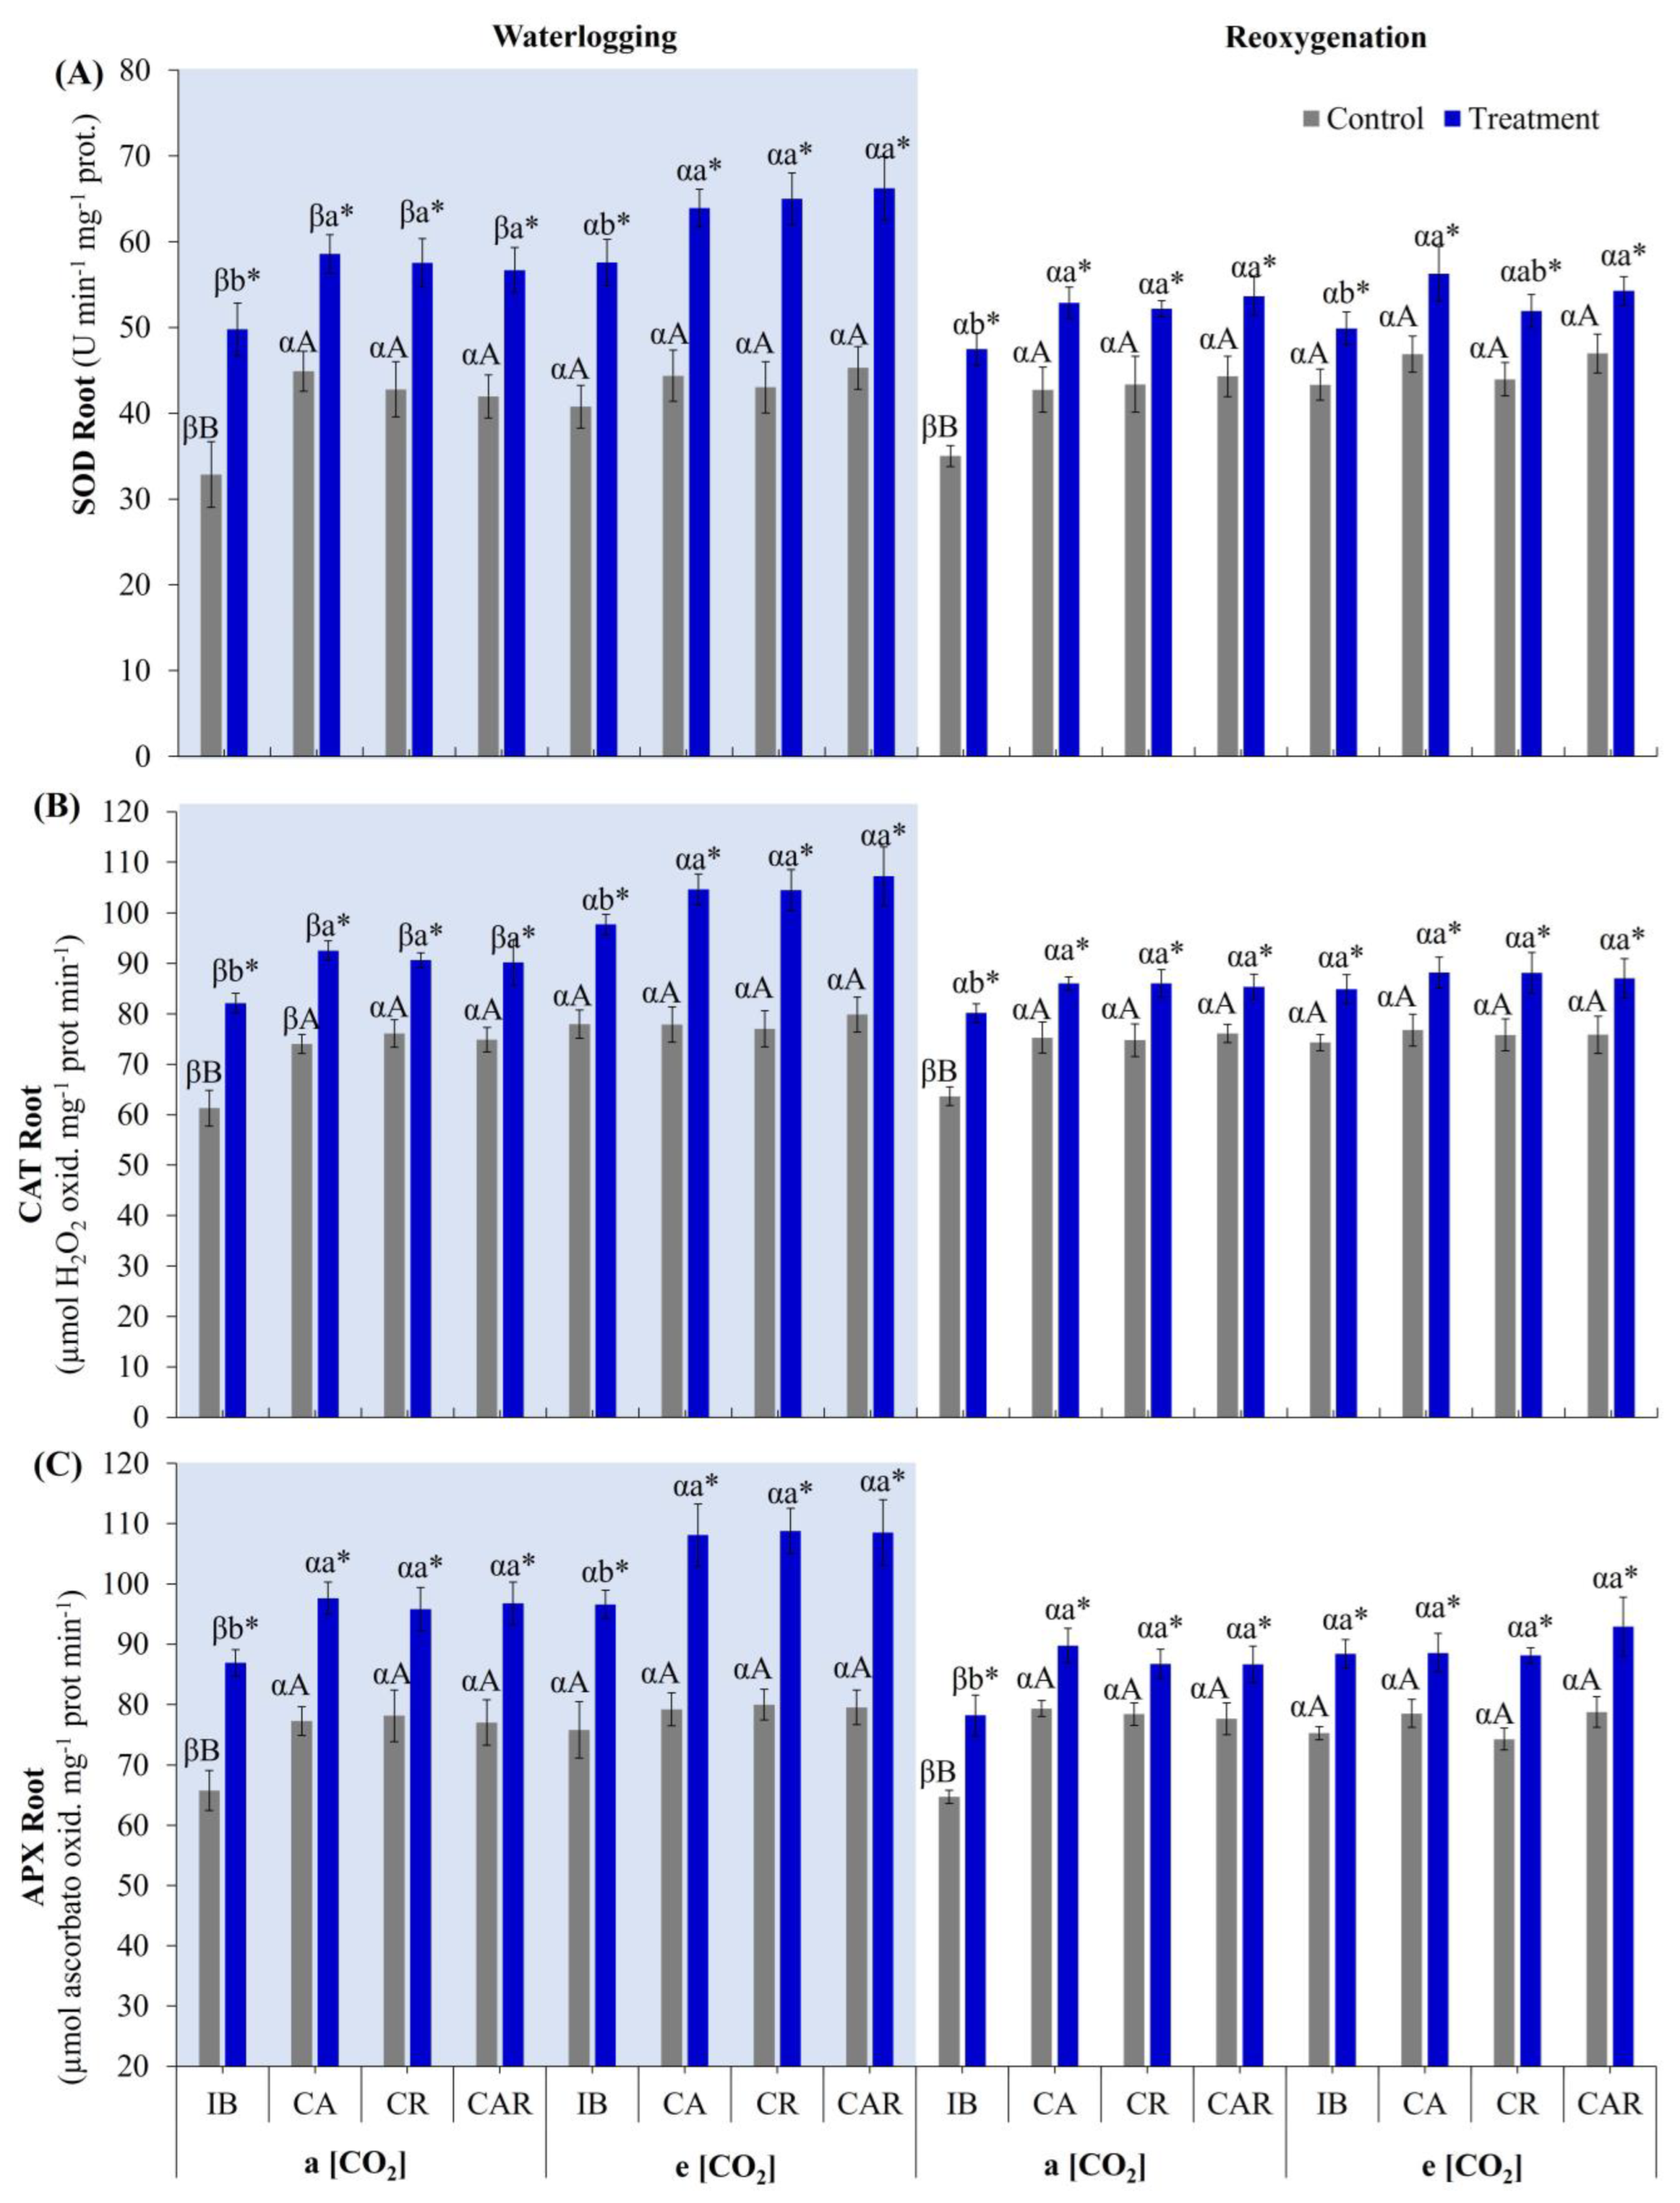
The antioxidant enzymatic system, including SOD, CAT, and APX, exhibited increased activity in roots during waterlogging, irrespective of microbiological treatment or CO2 level (Figure 7). SOD activity in roots increased by 37% in waterlogged plants grown under a[CO2] and by 46% in those grown under e[CO2], compared to control plants (Figure 7A). The average difference in SOD activity between solely inoculated IB plants and co-inoculated CA, CR, and CAR plants was 32% for control plants in the a[CO2] environment but decreased to only 8% for plants grown under e[CO2]. Under waterlogging conditions, the difference between IB and co-inoculated plants was 16% for a[CO2] and 13% for e[CO2]. During the reoxygenation process, differences in SOD activity compared to control plants were 25% for a[CO2] and 17% for e[CO2]. Notably, IB plants maintained higher SOD activity than co-inoculated plants, with a difference of 24% under a[CO2] and 6% under e[CO2] during reoxygenation. For reoxygenated plants, IB plants showed an 11% difference from CA, CR, and CAR plants under a[CO2] and a 9% difference under e[CO2].
CAT activity increased by 24% in waterlogged plants grown under a[CO2] and by 32% in those under e[CO2] compared to control plants (Figure 7B). Solely inoculated IB plants exhibited a 22% lower CAT activity than co-inoculated CA, CR, and CAR plants under control conditions in the a[CO2] environment, with no significant difference in the e[CO2] environment. During waterlogging, the difference in CAT activity between IB and co-inoculated plants was 11% under a[CO2] and 55% under e[CO2]. During reoxygenation, CAT activity was 16% higher for plants under a[CO2] and 15% higher for those under e[CO2] than their respective controls. Differences persisted between control IB and co-inoculated plants, 18% for a[CO2] and 2% for e[CO2]. Reoxygenated IB plants showed 7% lower CAT activity than co-inoculated plants in a[CO2] and 3% lower in e[CO2].
APX activity increased by 26% in waterlogged plants grown under a[CO2] and by 91% in those under e[CO2] compared to control plants (Figure 7C). Differences in APX activity were noted between control IB and co-inoculated plants, with a difference of 18% under a[CO2] and 5% under e[CO2]. Under waterlogging conditions, the difference between solely inoculated IB and co-inoculated plants decreased to 11% for a[CO2] and increased to 12% for e[CO2]. APX activity was higher in reoxygenated plants during reoxygenation than in control plants, showing a 14% difference for a[CO2] and 17% for e[CO2]. Co-inoculated CA, CR, and CAR plants in control conditions had 21% higher APX activity than solely inoculated IB plants under a[CO2], with this difference decreasing to 2% in the e[CO2] environment. Reoxygenated IB plants had APX activity 12% lower than co-inoculated plants under a[CO2], while for e[CO2], the average difference between IB and co-inoculated plants was 2% higher for co-inoculated plants.
Overall, the differences between control and waterlogged plants were greater during waterlogging than those observed when comparing control and reoxygenated plants. These differences varied according to CO2 level and the specific enzyme (SOD, CAT, and APX) assessed, while the differences tended to be smaller during the reoxygenation period.

3.4. Effect of e[CO2] and Co-Inoculation on Fermentative Metabolism

Waterlogged plants exhibited increased fermentative metabolism in their roots, regardless of CO2 level or microbiological treatment. The activities of lactate dehydrogenase (LDH), pyruvate decarboxylase (PDC), alcohol dehydrogenase (ADH), and alanine aminotransferase (Ala-AT) were assessed, with activities found in control plants being negligible and primarily attributed to the experimental oxidation of NADH (Figure 8).
LDH activity was significantly lower in co-inoculated plants than solely inoculated IB plants, with reductions of 34% in CA and 68% in CAR plants under a[CO2], while CR plants showed no difference from IB plants (Figure 8A). In plants grown under e[CO2], LDH activity was more pronounced in ambient CO2 conditions; however, CA and CAR plants displayed similar reductions in LDH activity (83% and 67%, respectively) compared to IB plants, with CR plants again showing no significant difference. During the reoxygenation period, a[CO2] plants still exhibited reduced LDH activity, except for CAR plants, which showed no detectable LDH activity. IB, CA, and CR plants exhibited LDH activity that did not differ significantly from each other.
PDC activity significantly increased due to waterlogging, irrespective of CO2 levels (Figure 8B). Under a[CO2], co-inoculated treatments CA and CAR reduced PDC activity by 34% and 80%, respectively, compared to IB plants, while CR treatment did not differ from IB. In plants grown under e[CO2], PDC activity was markedly lower (by an average of 80%) than in those grown under a[CO2]. Interestingly, CAR plants grown under e[CO2] exhibited a 120% increase in PDC activity compared to IB plants, while CA and CR plants showed no significant differences from IB. During reoxygenation, a[CO2] plants retained significant PDC activity, with CA, CR, and CAR treatments exhibiting 30%, 11%, and 74% lower activity, respectively, compared to IB plants with the highest activity. In e[CO2], PDC activity during reoxygenation was equivalent to control levels for all treatments except CR and IB.
ADH activity increased significantly in plants grown under a[CO2] during waterlogging; however, co-inoculated CA, CR, and CAR plants showed reduced ADH activity compared to IB plants, with reductions of 43%, 20%, and 29%, respectively (Figure 8C). Under e[CO2], the responses varied; CA plants had 26% lower ADH activity than IB, while CR plants exhibited a 100% increase, and CAR plants had a 20% increase in ADH activity compared to IB. During the reoxygenation period under a[CO2], IB plants maintained the highest ADH activity, with CA and CR treatments showing reductions of 50% and 56%, respectively, while CAR plants had no detectable ADH activity. In contrast, reoxygenated plants grown under e[CO2] revealed CR treatment exhibiting the highest ADH activity, approximately three times (206%) that of IB plants, with CA and CAR treatments showing no significant differences from IB or their respective controls.
Ala-AT activity increased dramatically in waterlogged IB plants under a[CO2], with a 523% increase compared to control plants (Figure 8D). IB plants consistently showed the highest Ala-AT activities, while co-inoculated CA, CR, and CAR plants had 37%, 54%, and 46% lower Ala-AT activity, respectively, compared to waterlogged IB plants. In the e[CO2] environment, waterlogged CR plants displayed the highest Ala-AT activity, 61% higher than that of IB plants, while CAR plants showed no significant difference from IB and CA plants exhibited 69% lower Ala-AT activity. During the reoxygenation period, Ala-AT activity was detectable; under a[CO2], only IB and CR plants had higher Ala-AT activity than their respective controls, while IB plants in control conditions showed lower Ala-AT activity compared to co-inoculated CA, CR, and CAR plants. In e[CO2], only the CR treatment demonstrated higher Ala-AT activity than its respective control during reoxygenation. Additionally, control plants from co-inoculated CA, CR, and CAR treatments in the e[CO2] environment had higher Ala-AT activity than solely inoculated IB control plants.
Overall, the results indicate that waterlogging induces significant changes in fermentative enzyme activities in roots, with varying effects influenced by CO2 levels and microbiological treatments.

3.5. Effect of e[CO2] and Co-Inoculation on Biometric Parameters and Total Soluble Sugars

3.5.1. Biometric Parameters

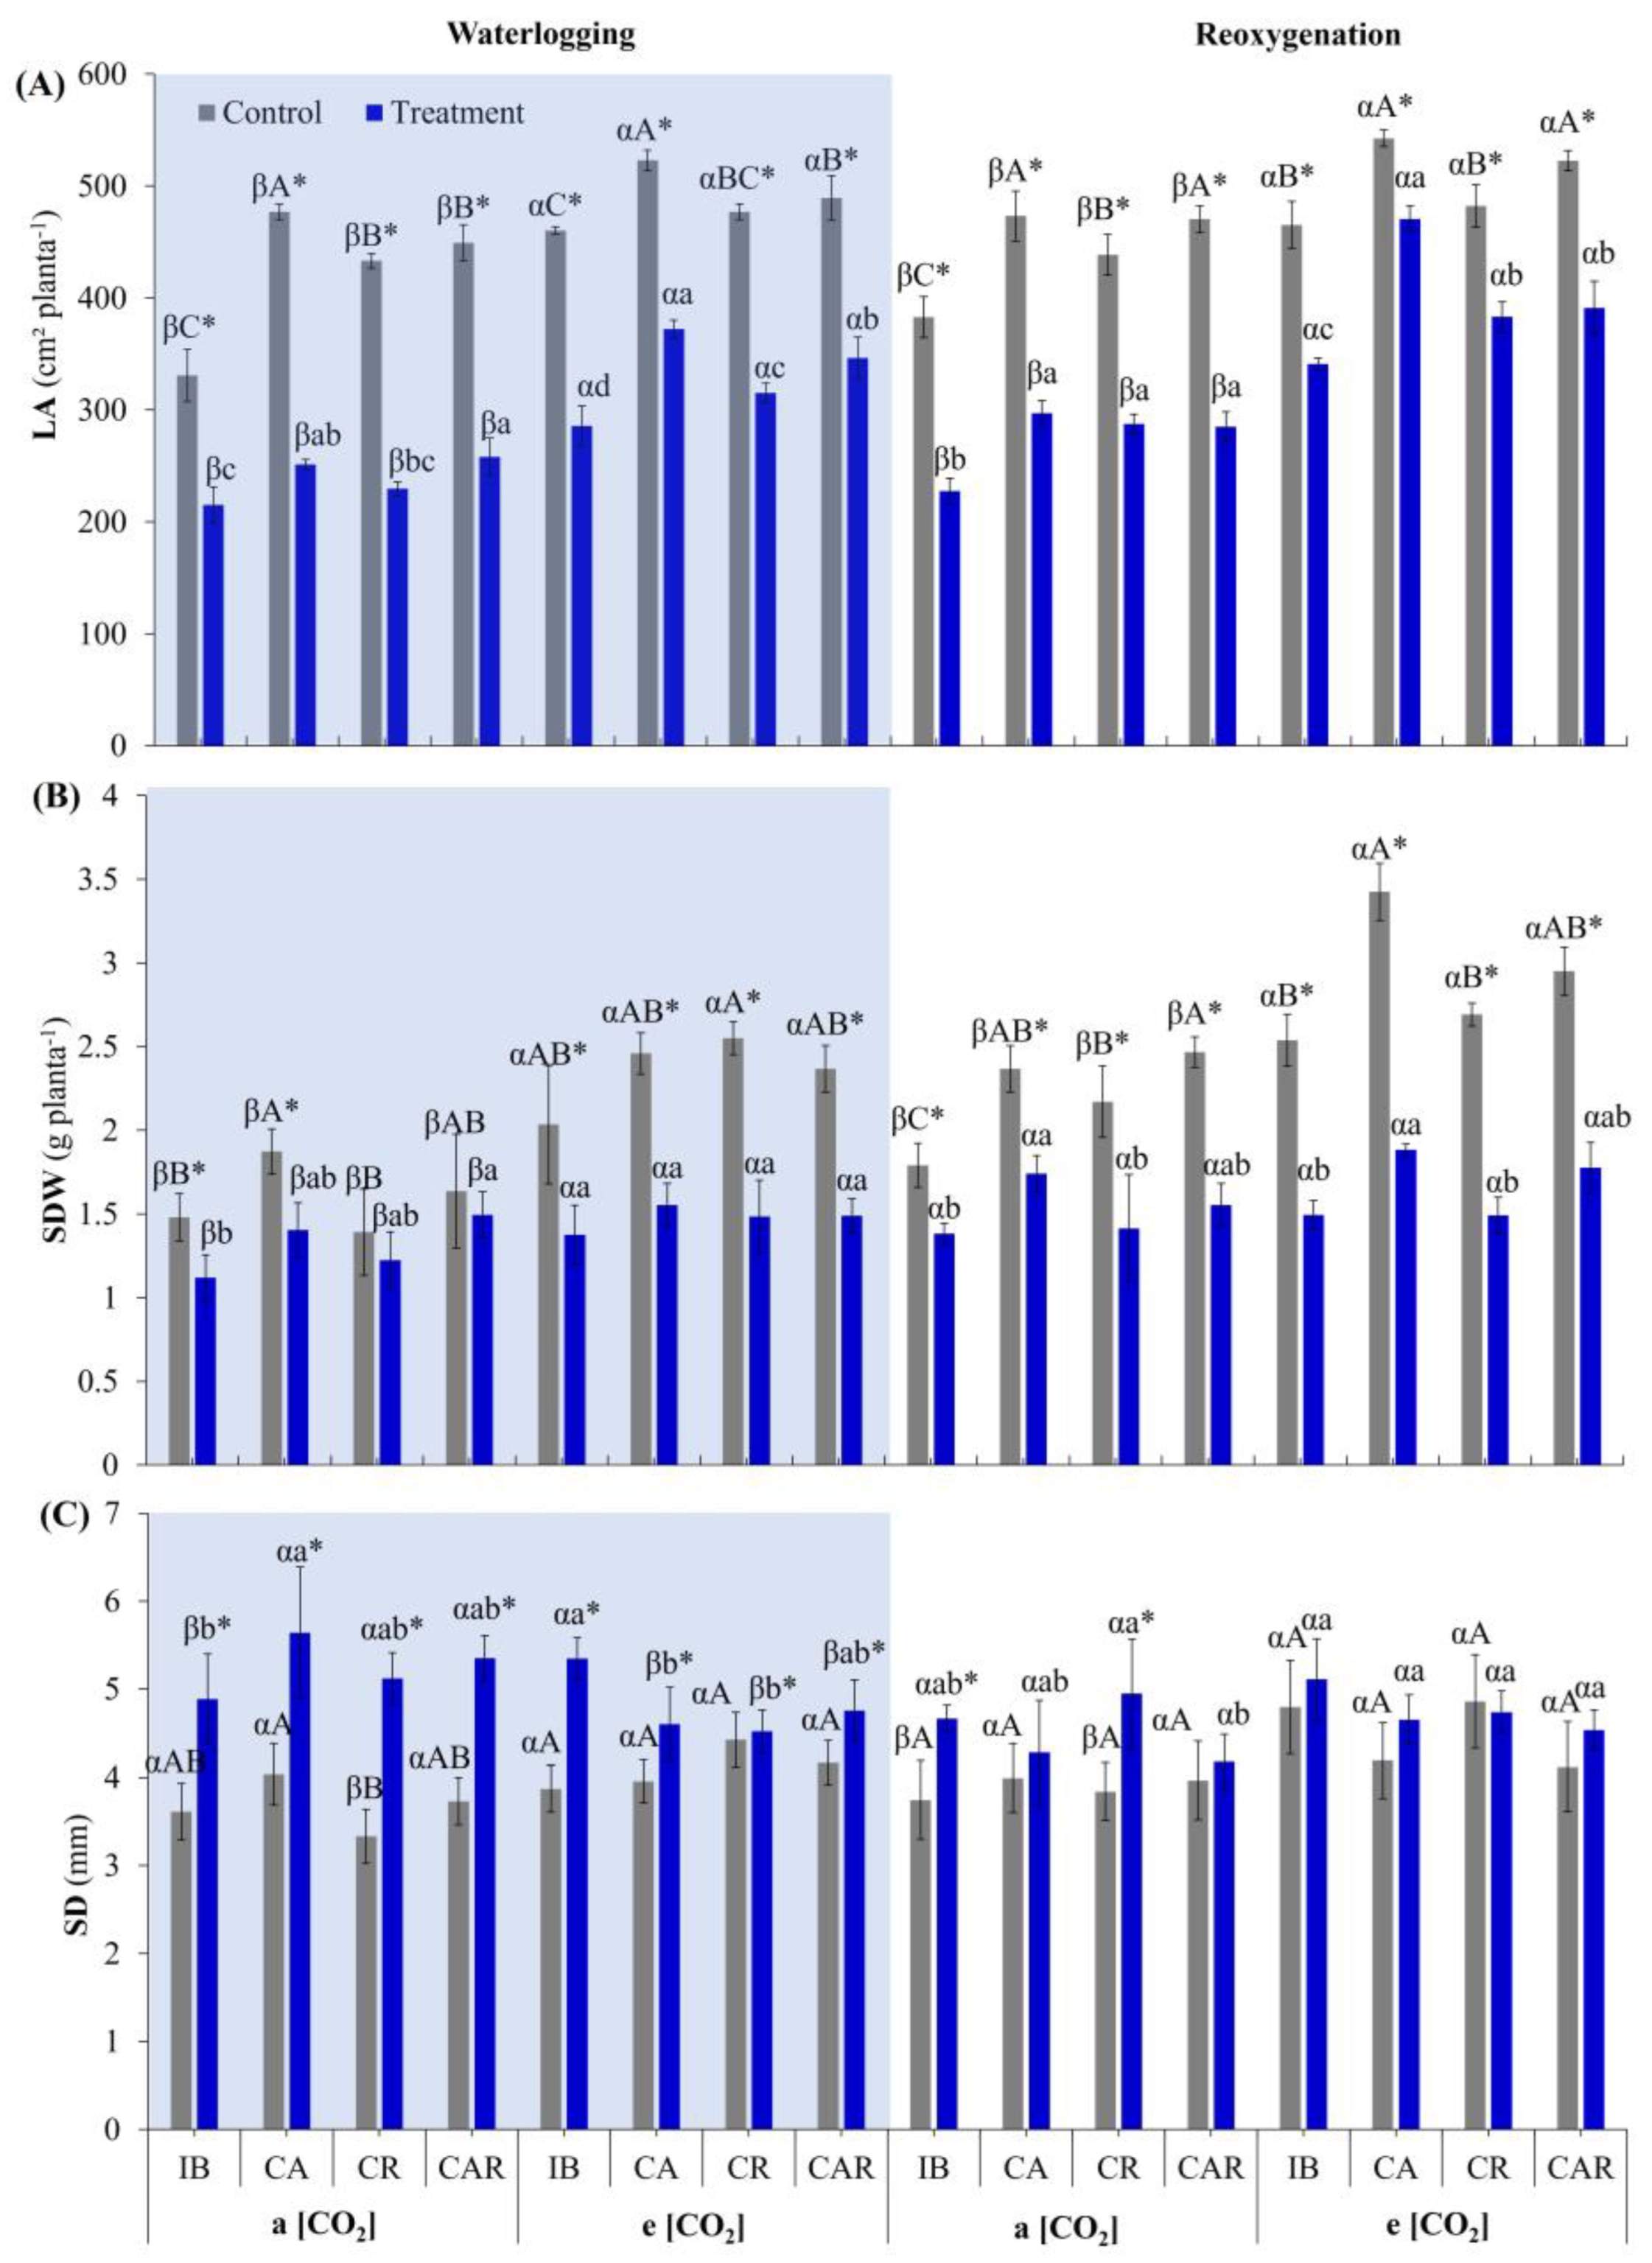
Waterlogging drastically reduced leaf area (LA) regardless of CO2 level or microbiological treatment (Figure 9A). Plants grown under a[CO2] reduced LA 44% when subjected to waterlogging, while plants grown under e[CO2] reduced LA 33% compared to their respective control plants. Differences between microbiological treatments were also observed, with solely inoculated IB plants in control conditions having 36% smaller LA than co-inoculated CA, CR, and CAR plants under a[CO2]. The difference was reduced to 14% when these plants were waterlogged, but co-inoculated plants still showed larger LA. Plants grown under e[CO2] also differed between IB treatment and co-inoculation CA, CR, and CAR plants, as co-inoculated plants in control conditions had 8% larger LA than IB plants. This difference increased to 20% when waterlogged, maintaining higher values in co-inoculated plants. During reoxygenation, plants grown under a[CO2] maintained 37% smaller LA compared to control plants, while plants grown under e[CO2] maintained 22% smaller LA compared to their respective control plants. The difference between solely inoculated IB plants and co-inoculated CA, CR, and CAR plants in control conditions was 20% smaller under a[CO2], reducing to 14% during reoxygenation. The ratio between control IB plants versus CA, CR, and CAR plants LA was 11% smaller for IB plants under e[CO2], increasing to 22% during reoxygenation.
The shoot dry mass (SDM) decreased during waterlogging in plants grown under a[CO2]; however, plants from CR and CAR treatments did not differ from their respective control plants, contrary to what was observed in IB and CA plants, which significantly reduced their SDM during waterlogging (Figure 9B). Plants grown under elevated CO2 reduced their SDM by 38% during waterlogging, regardless of microbiological treatment. Differences between solely inoculated IB plants and co-inoculated CA, CR, and CAR plants in control conditions were 10%, increasing to 23% when plants were subjected to waterlogging in a[CO2] environment. When growing plants under e[CO2], the differences between IB and CA, CR, and CAR plants were 20% in control conditions and 9% when plants were waterlogged. During the reoxygenation period, differences between reoxygenated and control plants were even greater when comparing waterlogged versus control plants. Under a[CO2], reoxygenated plants had 31% lower SDM than control plants, and this difference was even greater under e[CO2], at 43%. During the reoxygenation period, regardless of microbiological treatment, all plants had lower SDM when compared to their respective control plants, with a difference between solely inoculated IB plants and co-inoculated CA, CR, and CAR plants being 30% in control plants and 23% in reoxygenated plants when grown under a[CO2]. Plants grown under elevated CO2 during reoxygenation also reduced SDM regardless of microbiological treatment, with the SDM in solely inoculated IB control plants being 19% lower than in co-inoculation treatments CA, CR, and CAR. This difference was slightly smaller when evaluating these treatments under reoxygenation conditions, but reoxygenated IB plants still had 15% less SDM than CA, CR, and CAR plants.
Regardless of microbiological treatment or CO2 level, waterlogged plants increased their stem diameter (SD) (Figure 9C). When plants were grown under a[CO2], the increase in SD due to waterlogging was 42%, whereas for plants grown under e[CO2], the increase in SD due to waterlogging was 17%. The increase in SD due to co-inoculation (i.e., IB plants vs. CA, CR, and CAR plants) was 2% to 8% between control plants when grown under a[CO2] and e[CO2], respectively. When comparing waterlogging plants under a[CO2] environment, the average difference between IB plants and CA, CR, and CAR plants was 10%, increasing to 14% when comparing this group of treatments under e[CO2]. During the reoxygenation period, reoxygenated plants grown under a[CO2] still had a 16% larger SD when compared to control plants, and reoxygenated plants grown under e[CO2] also had a 5% larger SD when compared to their respective control plants. Co-inoculated CA, CR, and CAR plants under a[CO2] and control conditions had a 5% larger SD than solely inoculated IB plants, and this value was consistent for plants during the reoxygenation. Control plants from co-inoculation treatments grown under e[CO2] had a 9% larger SD than solely inoculated IB plants, increasing to 13% when these groups of plants were reoxygenated.

3.5.2. Total Soluble Sugars and Root Fresh Weight

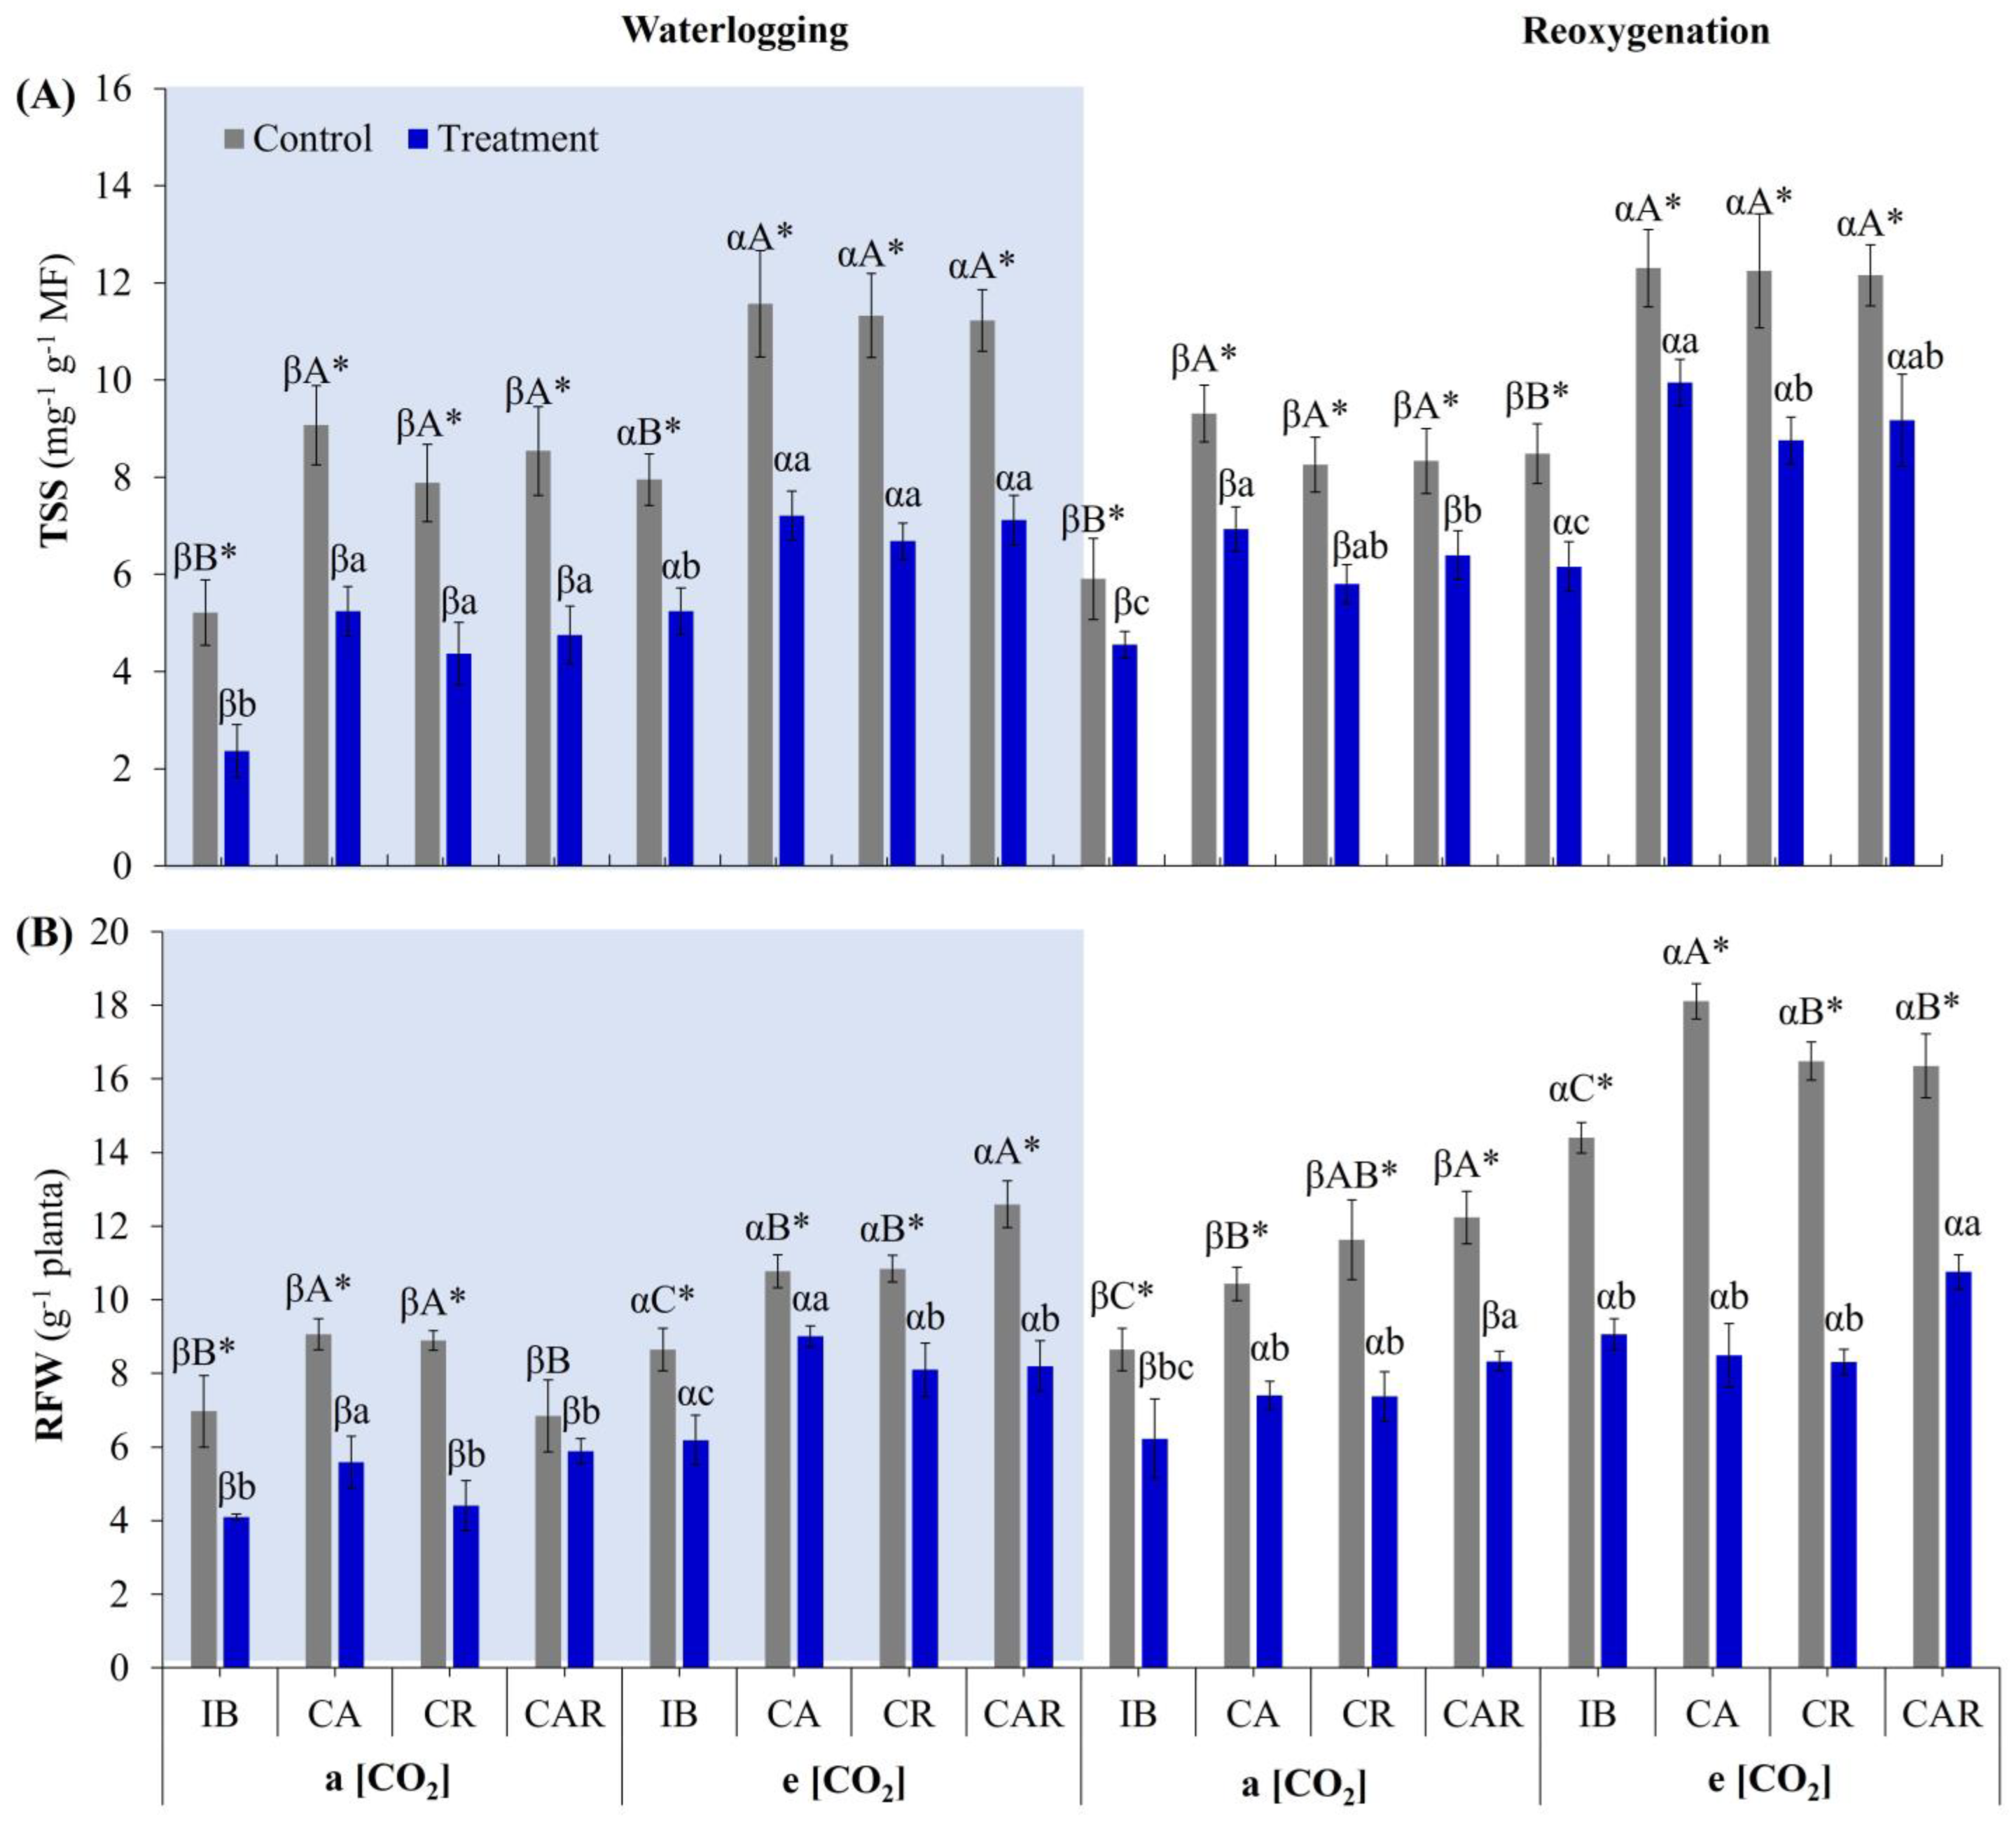
The total soluble sugar (TSS) content in roots decreased with waterlogging time, regardless of microbiological treatment or the CO2 level at which the plants were grown (Figure 10A). The amount of TSS in control plants grown under e[CO2] was 37% higher than in control plants grown under a[CO2]; when the plants were waterlogged, this difference was 57%. Plants grown under a[CO2] reduced their TSS content by 46% when waterlogged, while plants grown under e[CO2] reduced their TSS content by 37% compared to their respective control plants. TSS content in solely inoculated IB plants was lower than in co-inoculated CA, CR, and CAR plants, with a difference of 63% in plants grown under a[CO2] and 43% in plants grown under e[CO2]. When plants were waterlogged, differences between solely inoculated IB and co-inoculated CA, CR, and CAR were 12% for a[CO2] and 33% for e[CO2]. During the reoxygenation period, the difference between reoxygenated plants and their respective control plants was smaller than the difference between waterlogged plants and their control plants, being 25% regardless of CO2 level. During reoxygenation, differences persisted between solely inoculated IB and co-inoculated CA, CR, and CAR plants, with co-inoculated plants showing higher TSS content than solely inoculated IB plants, whether in control conditions of a[CO2] by 46% or under e[CO2] by 44%, or in reoxygenated conditions by 40% for plants grown under a[CO2] and 50% for plants under e[CO2]. An important result is that co-inoculated plants accumulate more TSS than solely inoculated plants, and plants grown under e[CO2] accumulate even more TSS than plants grown under a[CO2]. However, IB plants grown under e[CO2] are equivalent to co-inoculated plants grown under a[CO2], showing that co-inoculation and increased CO2 levels have similar effects concerning the TSS levels.
Fresh root mass (FRM) decreased during waterlogging time, regardless of CO2 level; however, for CAR plants grown under a[CO2], this reduction was not significant (Figure 10B). Plants grown under a[CO2] reduced their FRM by 37% during waterlogging, which was less when compared to waterlogged plants under e[CO2] and their respective control plants, being only 27% lower. Solely inoculated IB plants also differed from co-inoculated CA, CR, and CAR plants, showing lower FRM, with a difference of 19% for control plants grown under a[CO2] and 32% for control plants grown under e[CO2]. However, the difference between solely inoculated IB plants and co-inoculated CA, CR, and CAR plants when exposed to waterlogging was 30% for plants grown under a[CO2] and 36% for plants grown under e[CO2], with FRM always higher in co-inoculated plants. During the reoxygenation period, differences persisted between reoxygenated and control plants, with reoxygenated plants showing lower FRM when compared to control plants, 32% lower for a[CO2] and 44% lower for e[CO2]. The difference between solely inoculated IB plants and co-inoculated CA, CR, and CAR plants in control conditions during this period was 32% higher for co-inoculated plants grown under a[CO2] and 18% higher for co-inoculated plants grown under e[CO2]. Among reoxygenated plants, co-inoculated CA, CR, and CAR plants also had higher FRM when compared to solely inoculated IB plants, being 24% higher when plants were grown under a[CO2] and only 2% higher when grown under e[CO2].

3.5.3. Principal Component Analysis and Hierarchical Clustering Analysis

The results for most variables showed clear differentiation between control plants and those subjected to waterlogging and/or reoxygenation conditions. Plants were grown under two CO2 concentrations: ambient (400 µmol mol−1, a[CO2]) and elevated (750 µmol mol−1, e[CO2]). Additionally, plants were either inoculated with Bradyrhizobium (IB) or co-inoculated with Azospirillum (CA), Rhizophagus (CR), or both (CAR). Given the range of variables analyzed and the treatments applied, the results were consistently presented by comparing these six main groups, with specific emphasis on microbiological treatments when necessary.
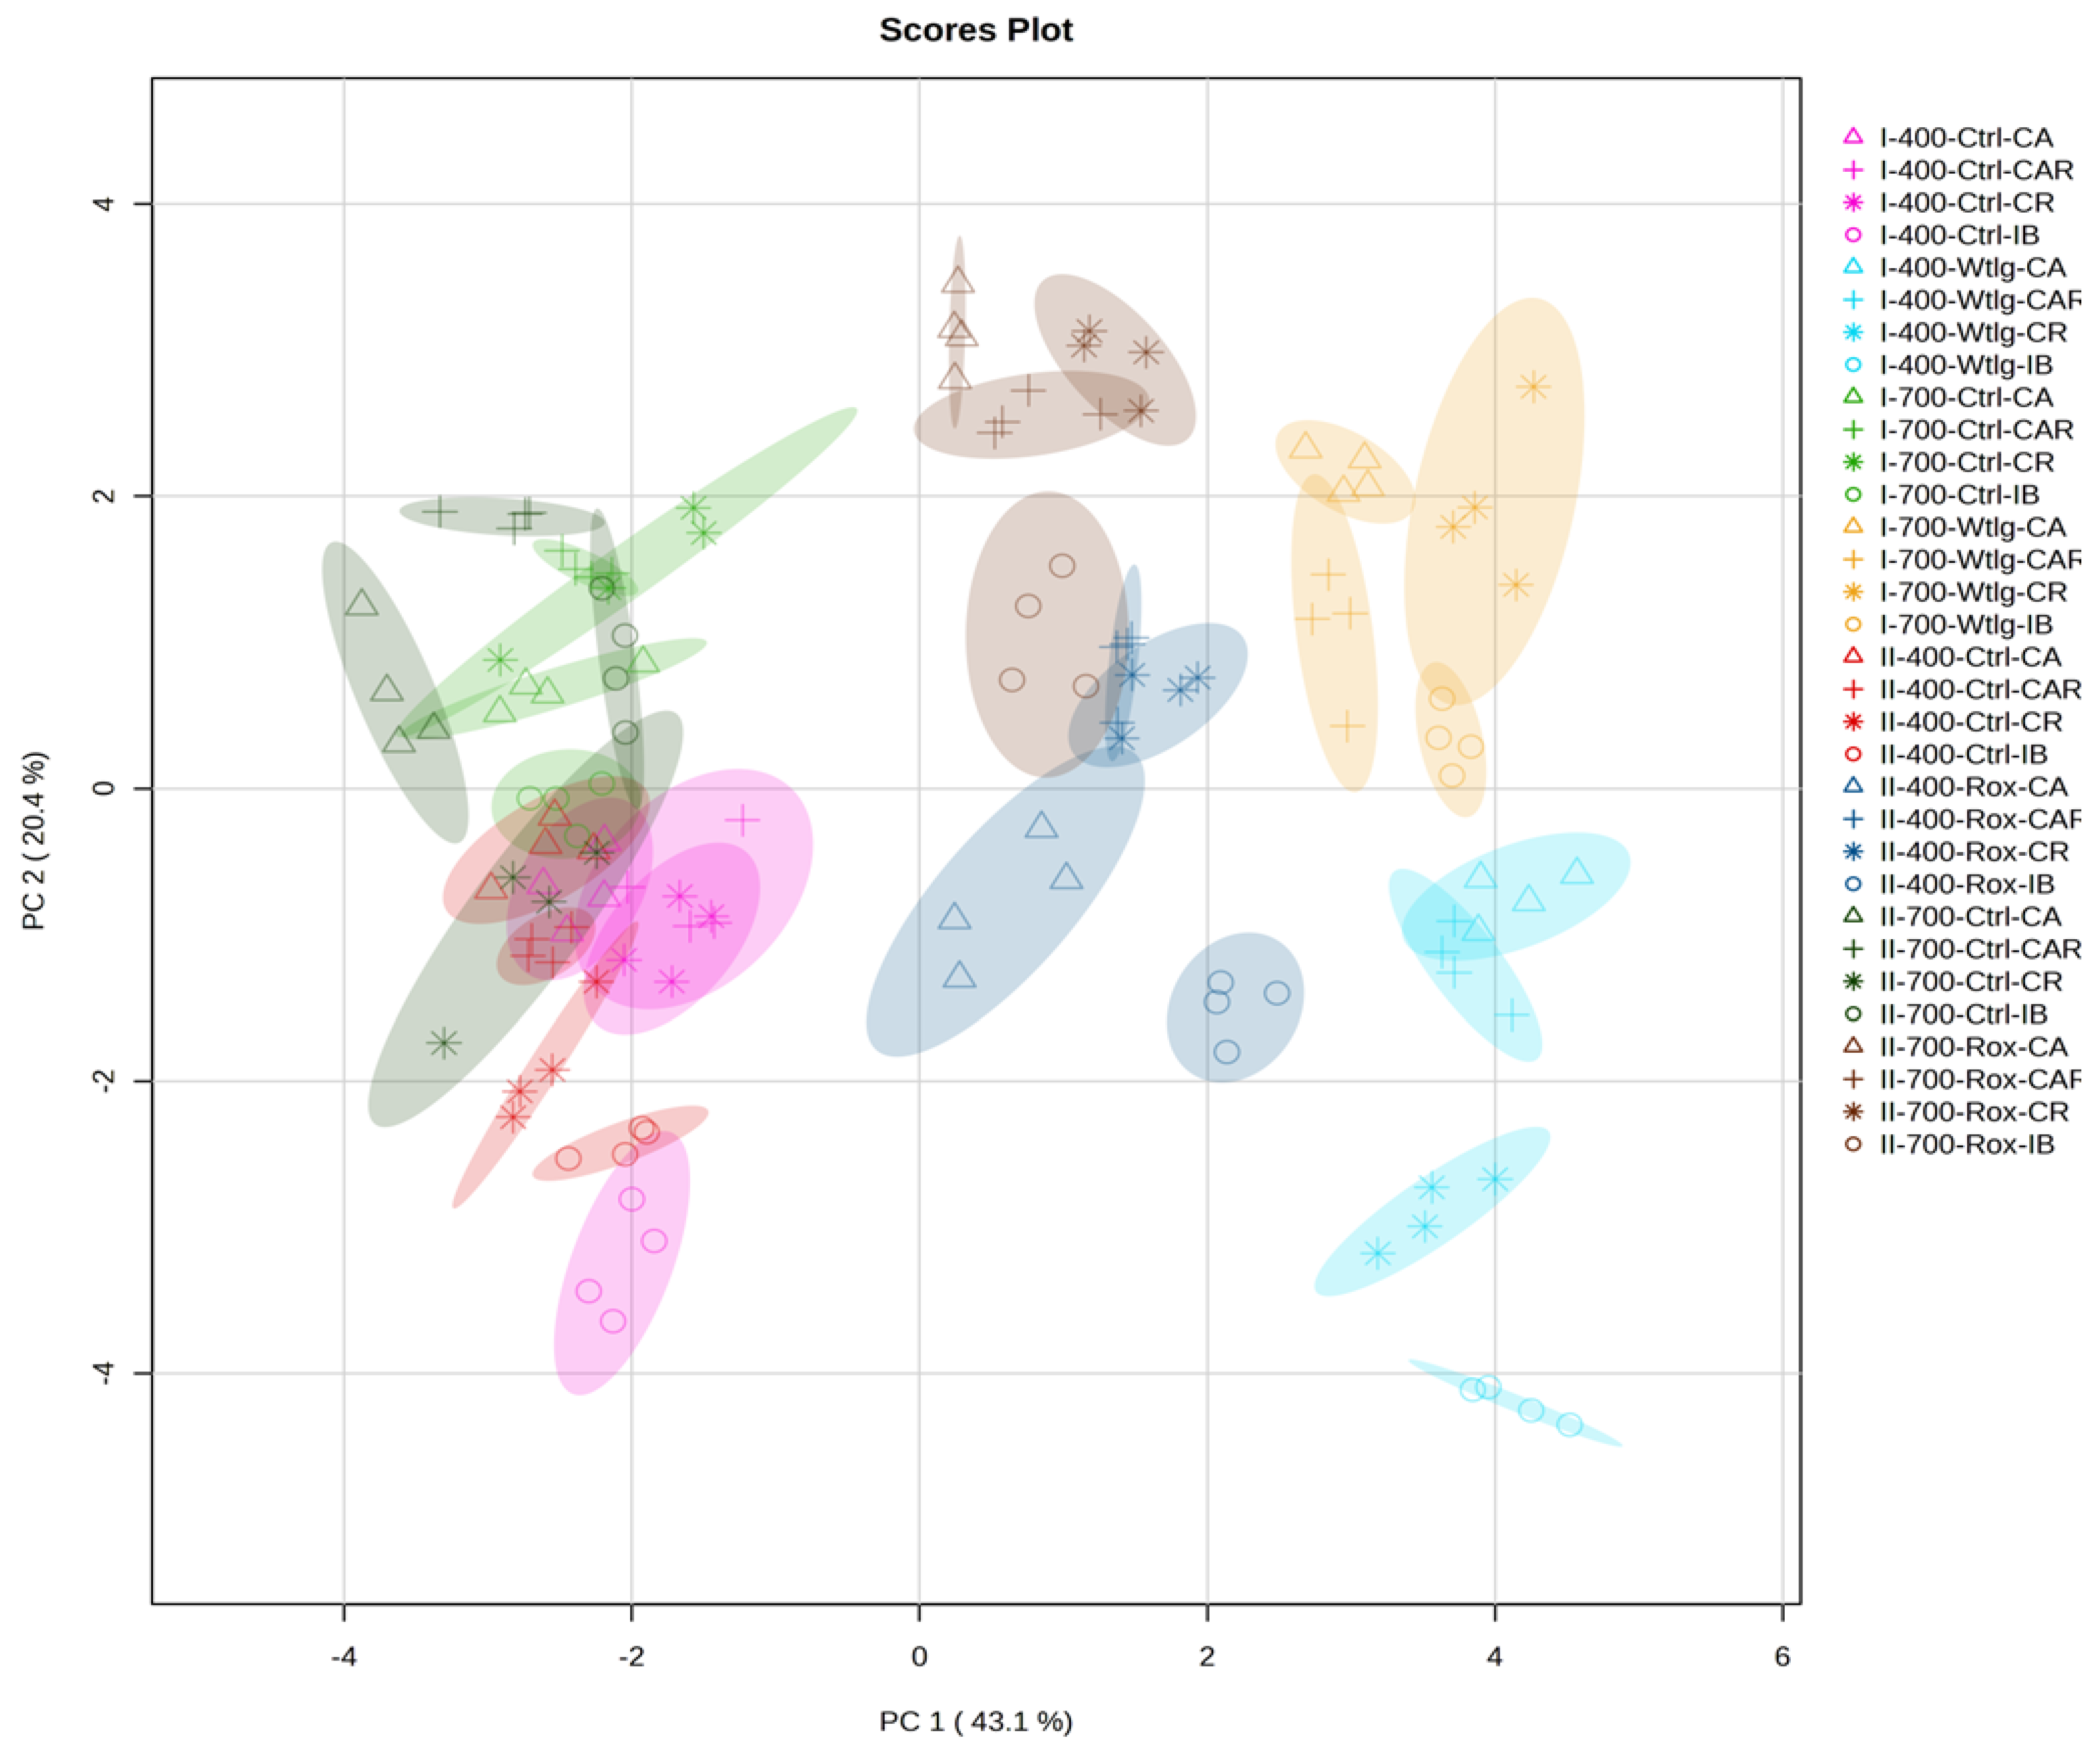
Principal component analysis (PCA) of leaf data (Figure 11) involved 16 variables and used two principal components that explained 63.5% of the variation in plant shoot responses. PC1 accounted for 43.1%, while PC2 explained 20.4%. The variables SOD, H2O2, APX, CAT, SD, and MDA positively influenced PC1 in decreasing order of importance, followed by Chlo_a, Ci, Chlo_Total, A, Carot, SDW, gs, E, and LA, which negatively influenced PC1 in decreasing order. For PC2, the variables Ci, A, CAT, APX, LA, SOD, SDW, and SD positively influenced the component, while E, gs, Carot, H2O2, Chlo_a, Chlo_Total, Chlo_b, and MDA exerted a negative influence. The 95% confidence intervals, as shown in Figure 11, revealed an intricate relationship among the plant groups studied, with greater dispersion observed on the right side of the PCA plot, while the left side primarily included groups that were more closely clustered and less dispersed.
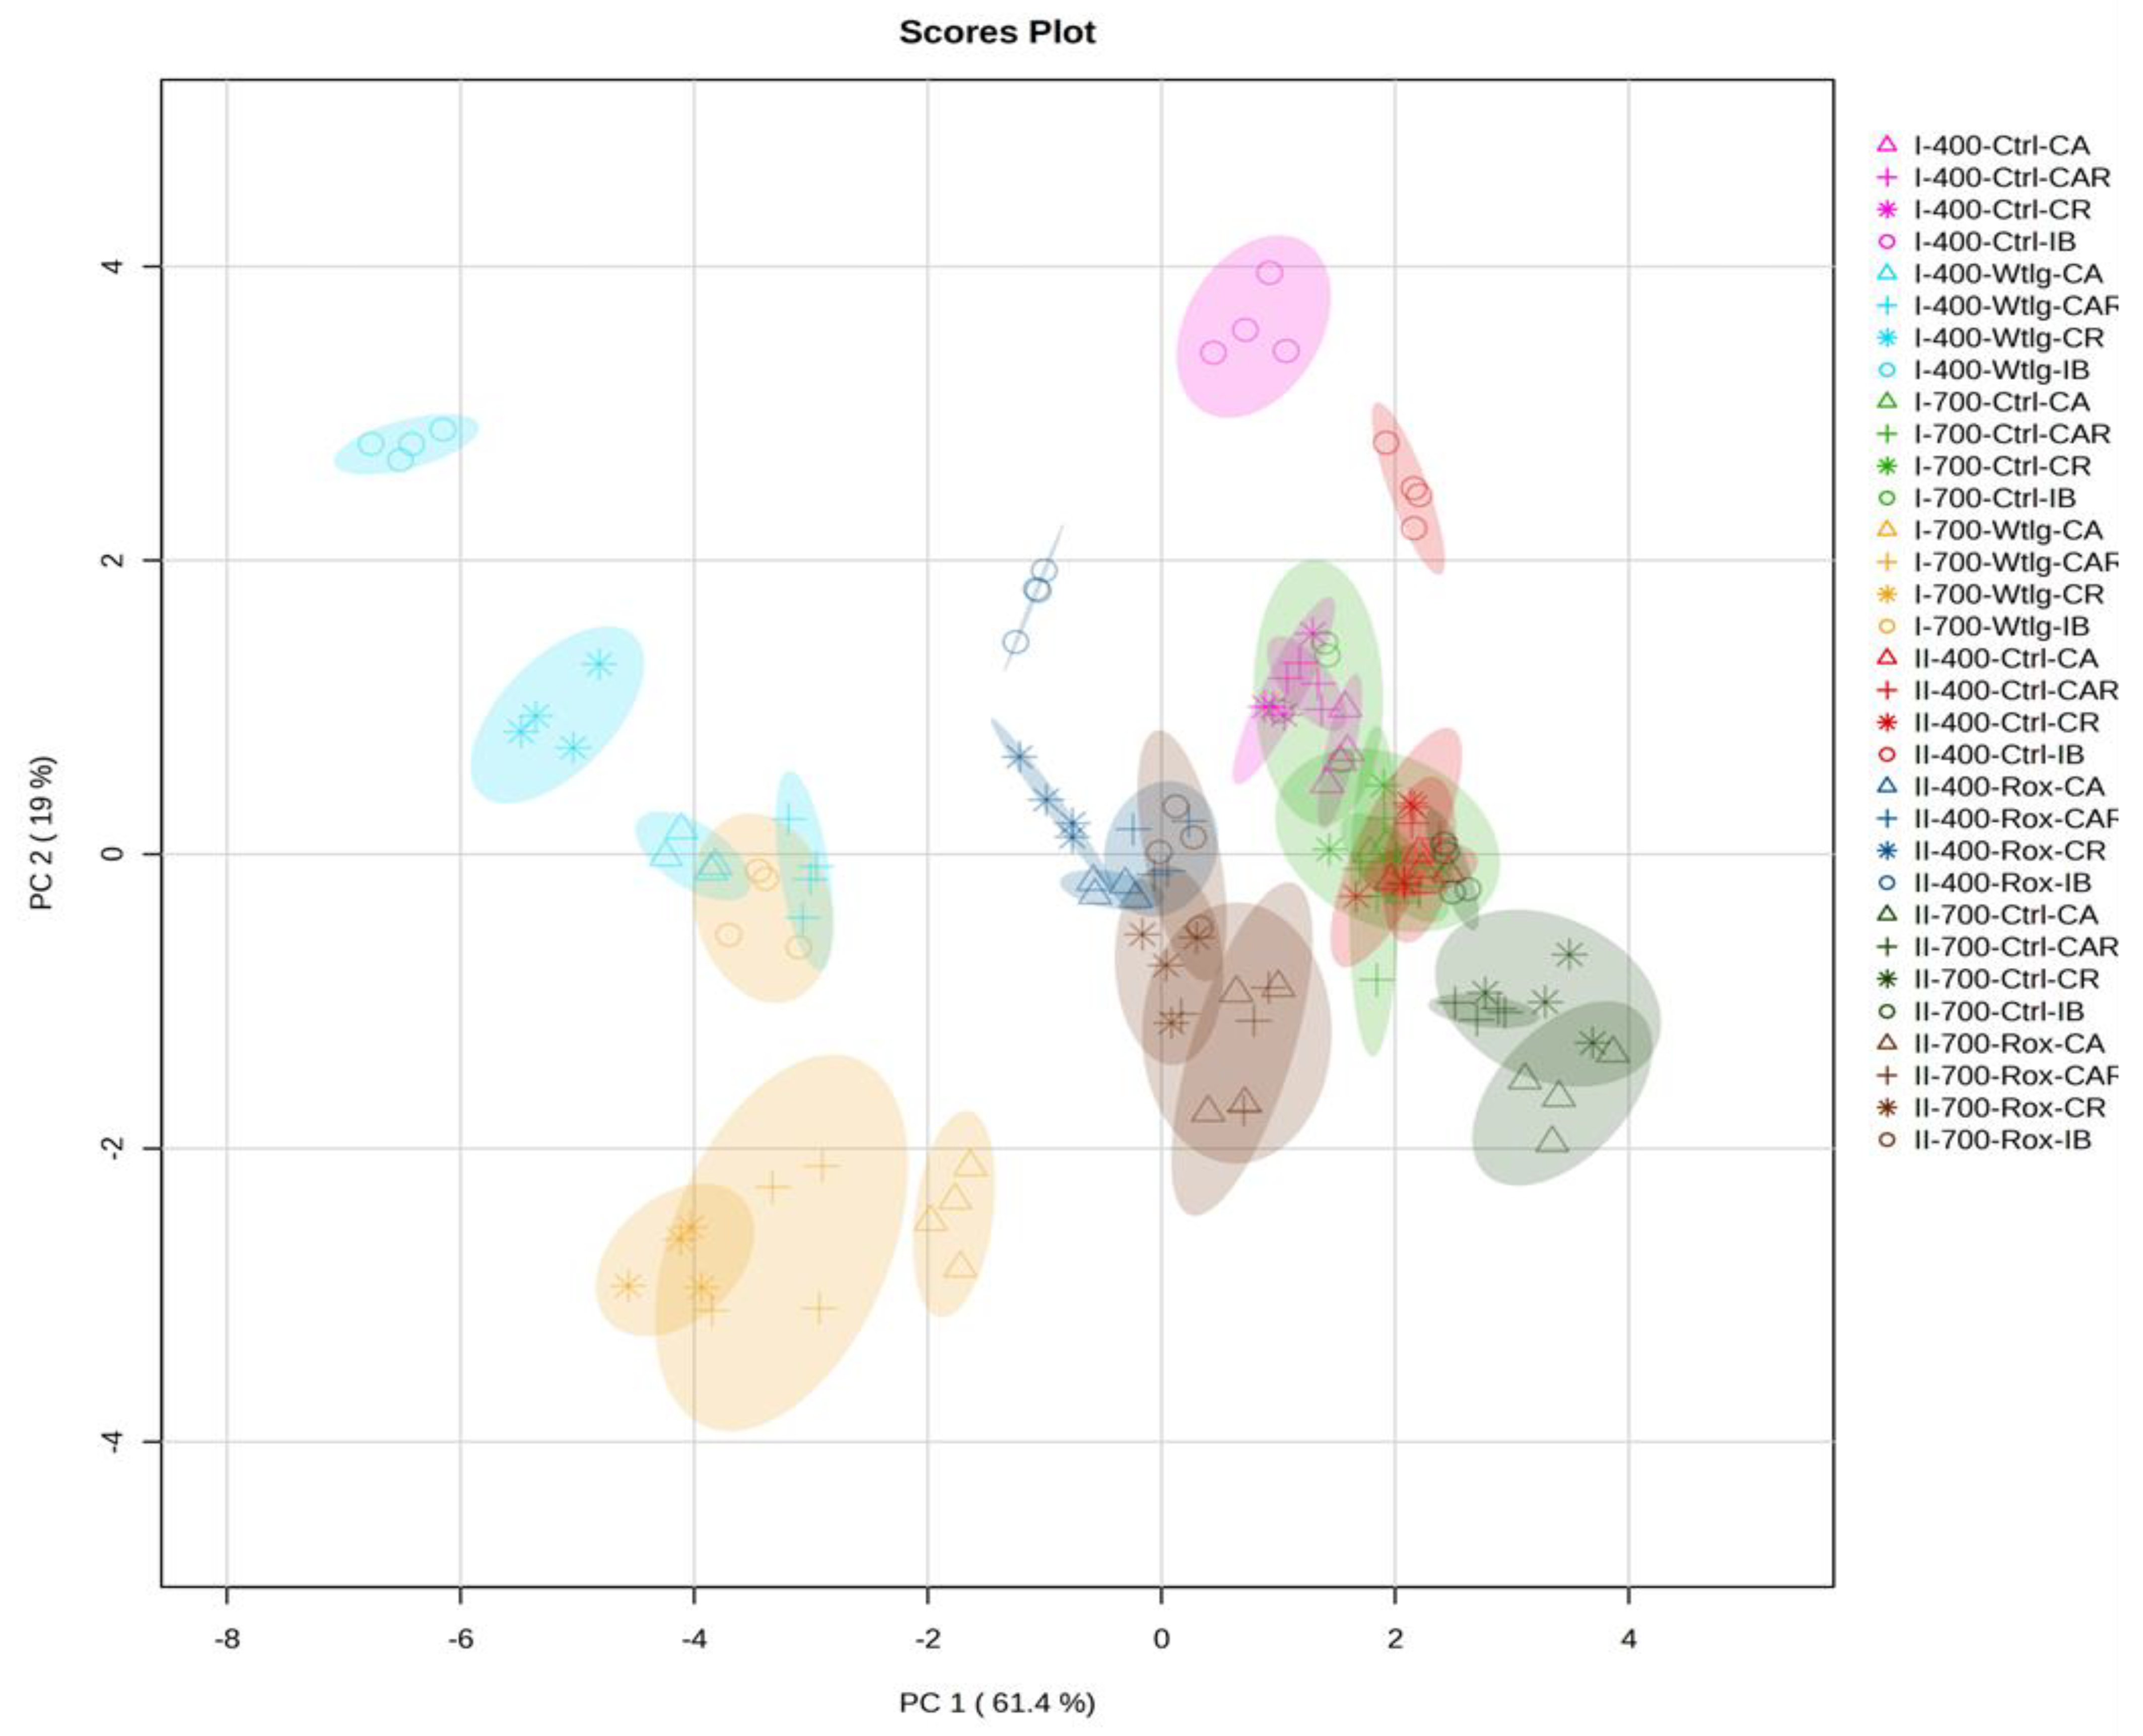
In contrast, PCA of root system data (Figure 12) explained 80.4% of the variance, with PC1 accounting for 61.4% and PC2 representing 19%. For PC1, the variables with the most positive impact were RFW and TSS, whereas CAT, SOD, APX, PDC, H2O2, Ala-AT, MDA, and LDH had a negative influence, in decreasing order. For PC2, H2O2, MDA, PDC, and LDH positively influenced the component, while Ala-AT, ADH, RFW, TSS, APX, SOD, and CAT negatively influenced PC2. Similar to the shoot, an intricate relationship between plant groups was observed in the roots, with more distinction on the left side of the PCA plot while groups on the right were more clustered.
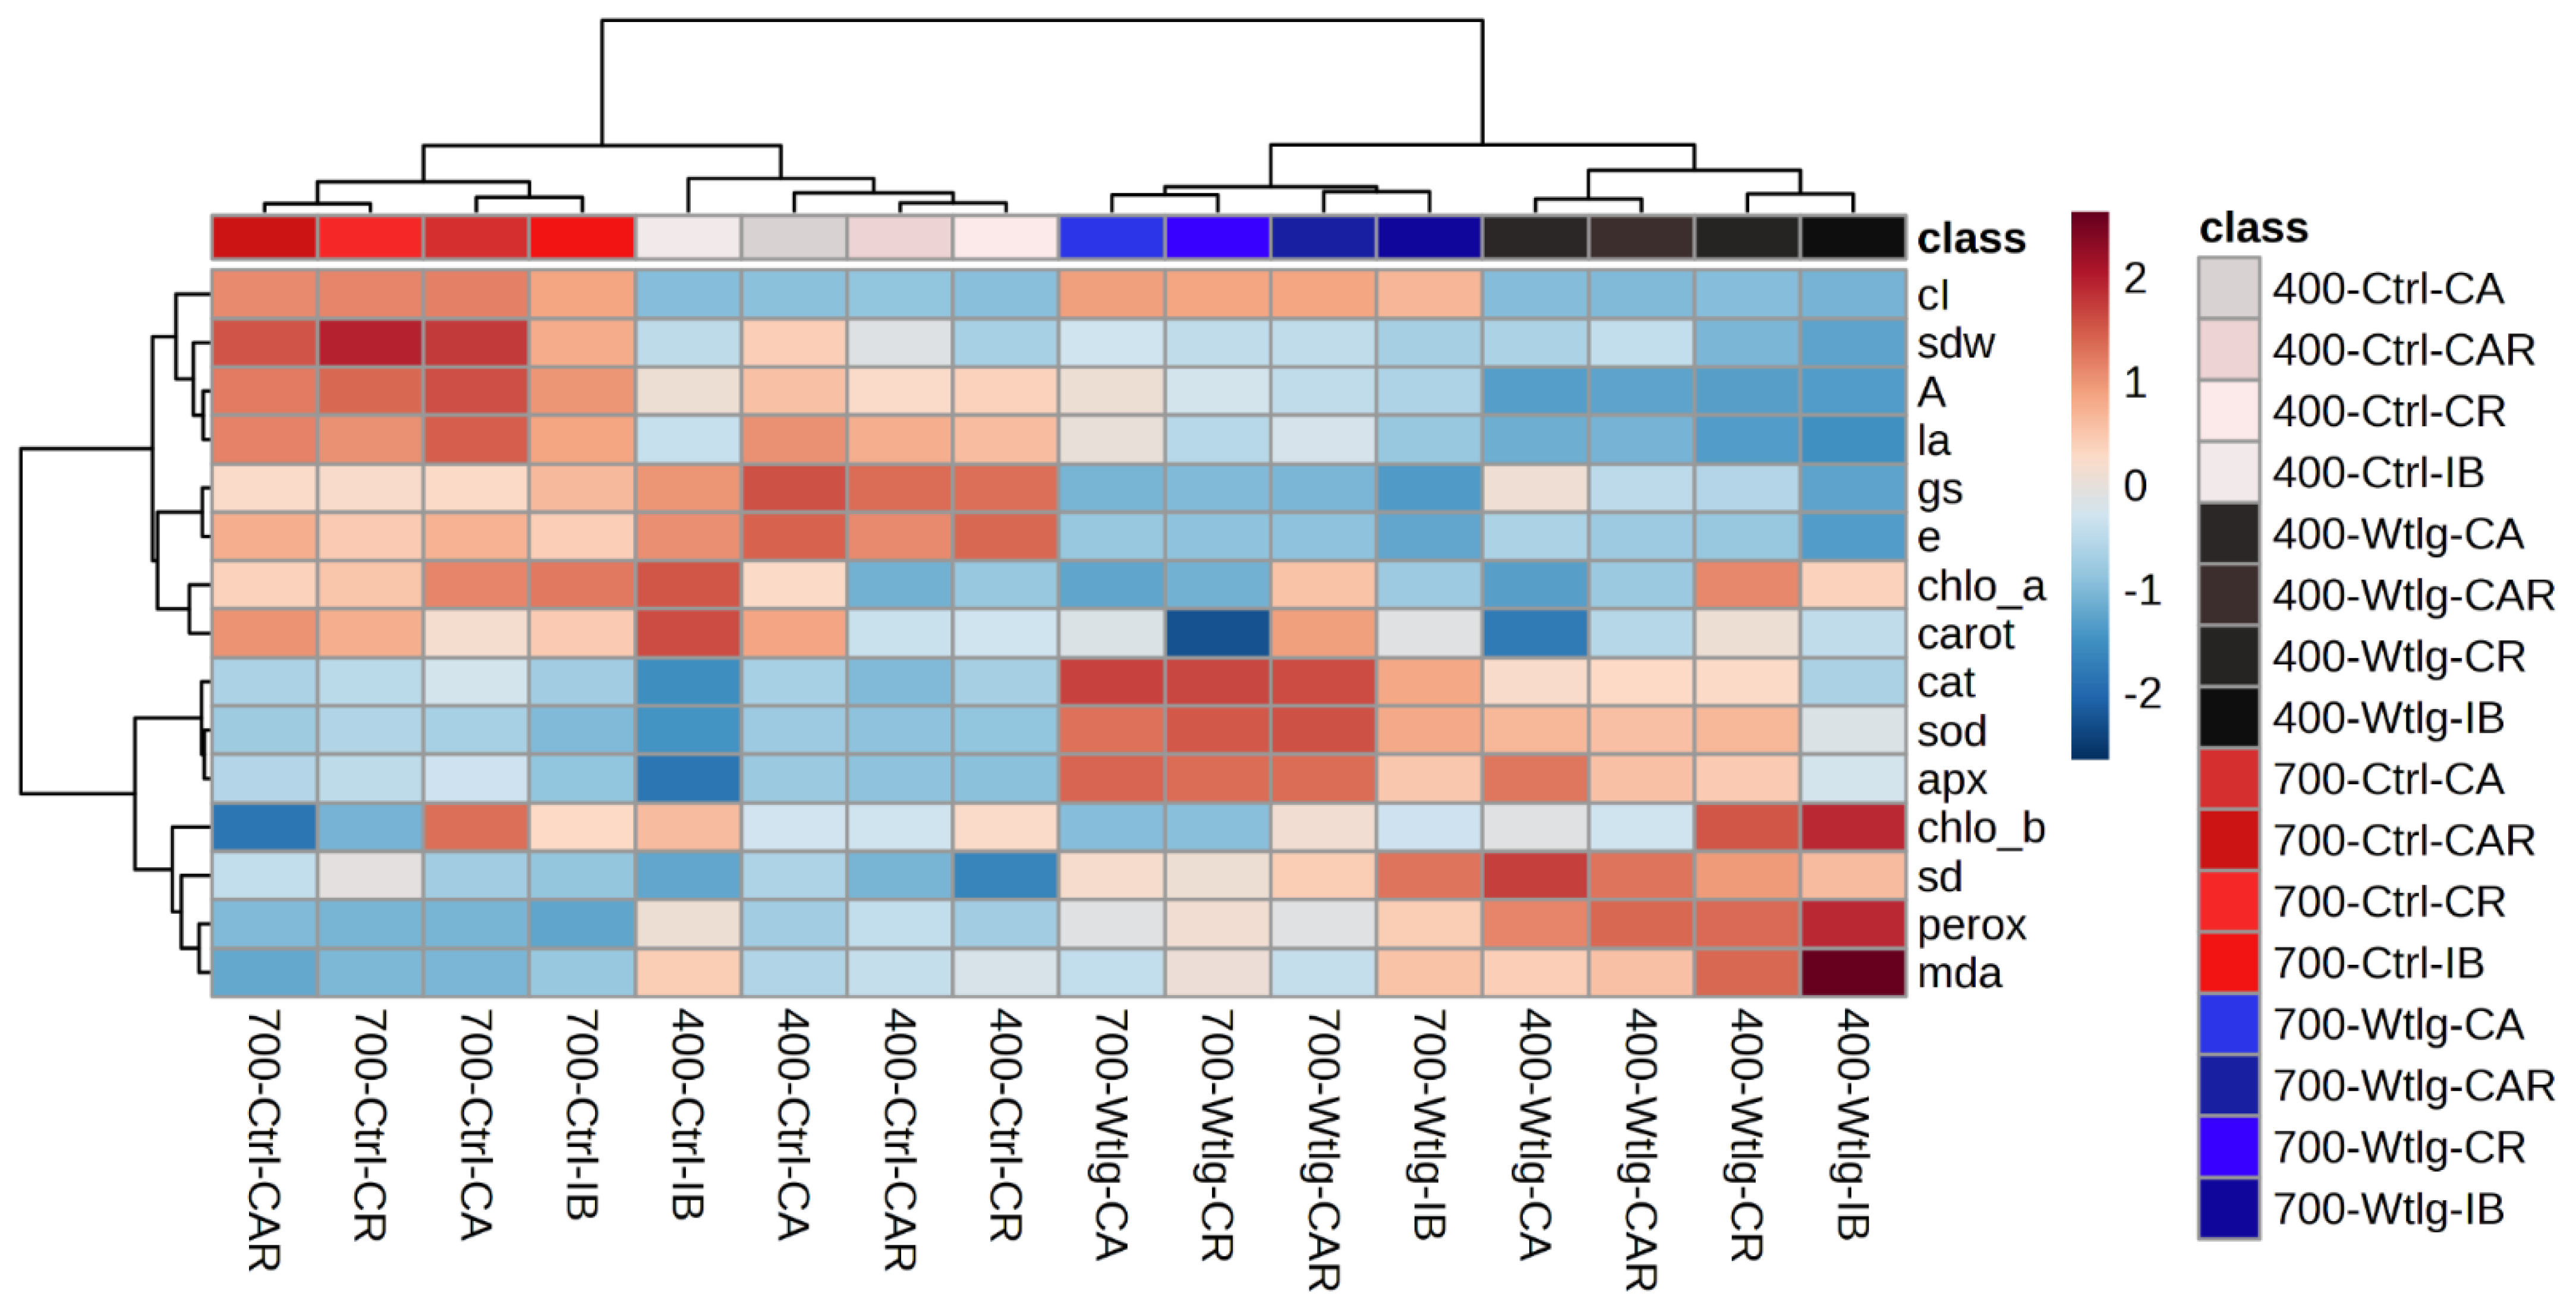
Hierarchical clustering analysis (HCA) was employed to better visualize these differences, enhancing the multivariate data interpretation. Similar to the PCA results, the HCA analysis for the shoot (Figure 13) revealed four distinct groups. The first group was characterized by high lipid peroxidation (increased MDA levels), with waterlogged plants exhibiting the highest levels. Among the waterlogged plants, those grown under e[CO2] showed lower lipid peroxidation. Regardless of CO2 concentration, plants inoculated only with Bradyrhizobium (IB) exhibited the highest MDA levels compared to other microbial treatments (CA, CR, and CAR). A similar pattern was observed for H2O2 production. The second group was primarily influenced by enzymatic antioxidant activity, with increased activity in waterlogged plants across both CO2 levels. Notably, plants grown under e[CO2] exhibited higher enzymatic activity than those grown under a[CO2]. Significant differences were observed between the IB and co-inoculation treatments (CA, CR, and CAR), irrespective of CO2 levels. Higher CAT activity was observed compared to APX under e[CO2], while APX activity dominated under a[CO2].
The third group was influenced by gs, E, Chlo_a, Carot, and LA, which all decreased during waterlogging, regardless of CO2 concentration. However, plants grown under a[CO2] exhibited higher averages, except for LA, which was greater in control plants co-inoculated with CA, CR, and CAR under e[CO2]. Regarding microbial treatments, control plants inoculated with IB and grown under a[CO2] had the highest carotenoid and Chlo_a levels, while higher gs and E values characterized co-inoculated plants (CA, CR, and CAR). The final group was influenced by Ci, SDW, and A, more representative of control plants grown under e[CO2]. Waterlogging negatively affected these variables, reducing them across both CO2 levels. Although not significantly different among microbial treatments, Ci remained elevated during waterlogging. SDW and A were significantly higher in co-inoculated plants, with greater responsiveness under e[CO2]. Interestingly, under control conditions at e[CO2], CR-treated plants had higher SDW, while CA or CAR treatments had higher averages for A and LA. Notably, CA-treated plants did not group with IB-treated plants.
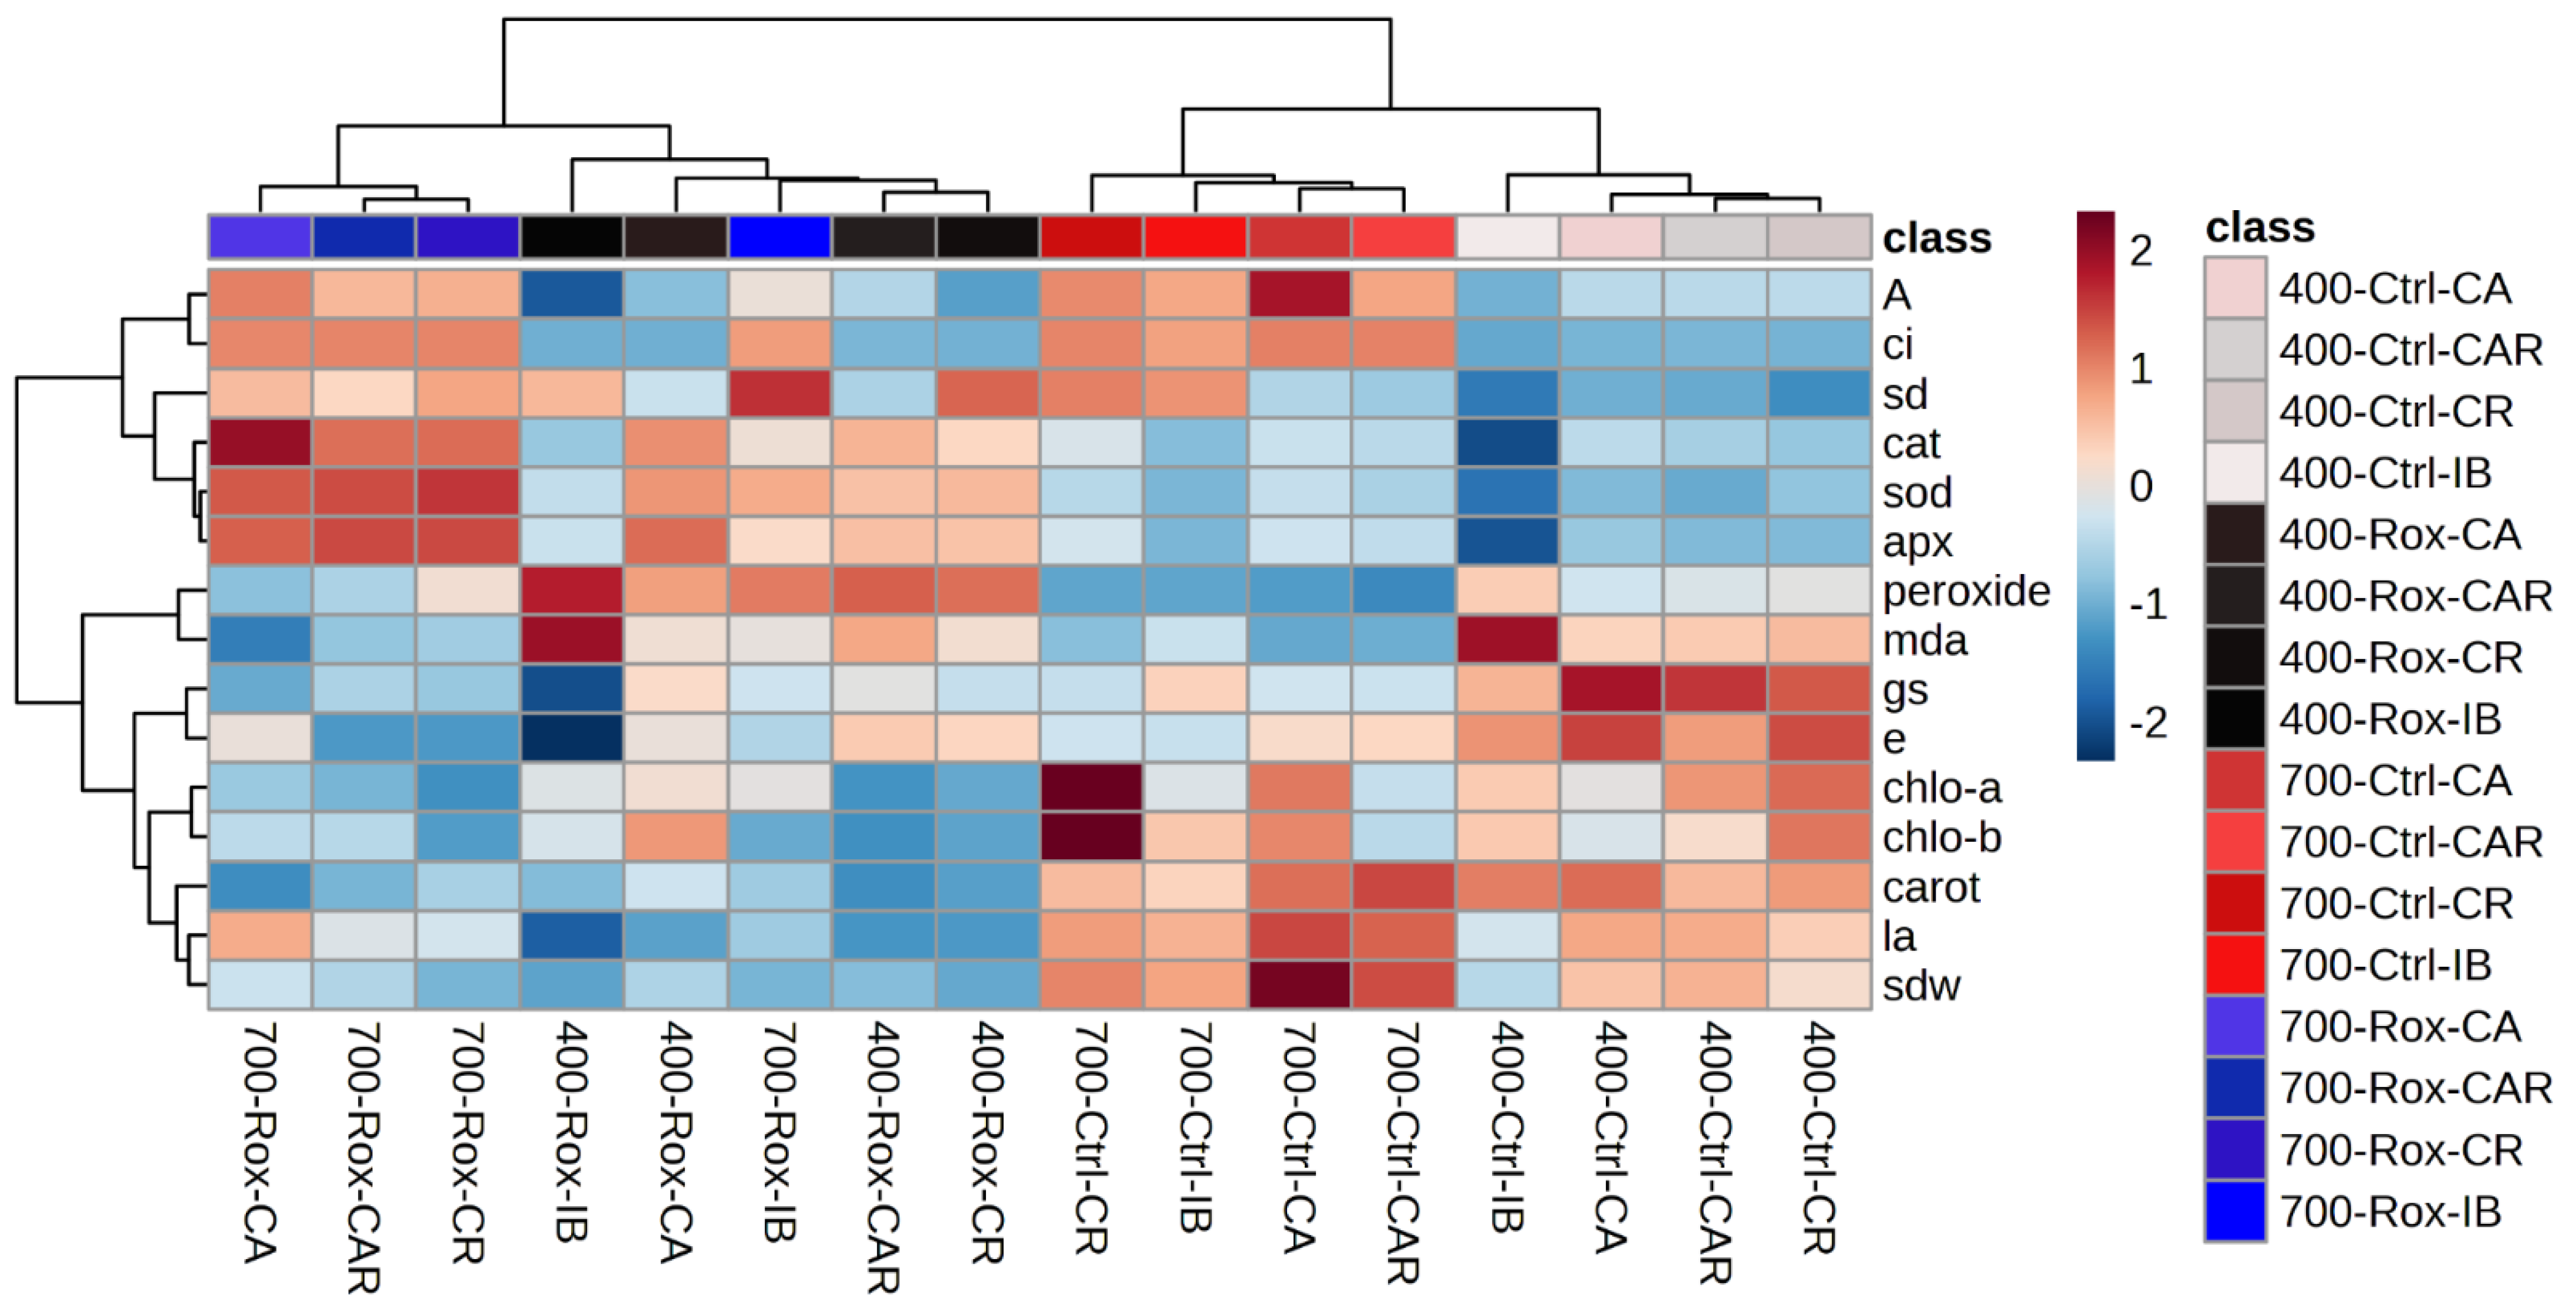
During reoxygenation, the shoot results for HCA (Figure 14) began to resemble those of control conditions, reducing the number of treatment groups to three: control plants under e[CO2], control plants under a[CO2], and plants undergoing reoxygenation. This contrasts with the four groups observed during waterlogging.
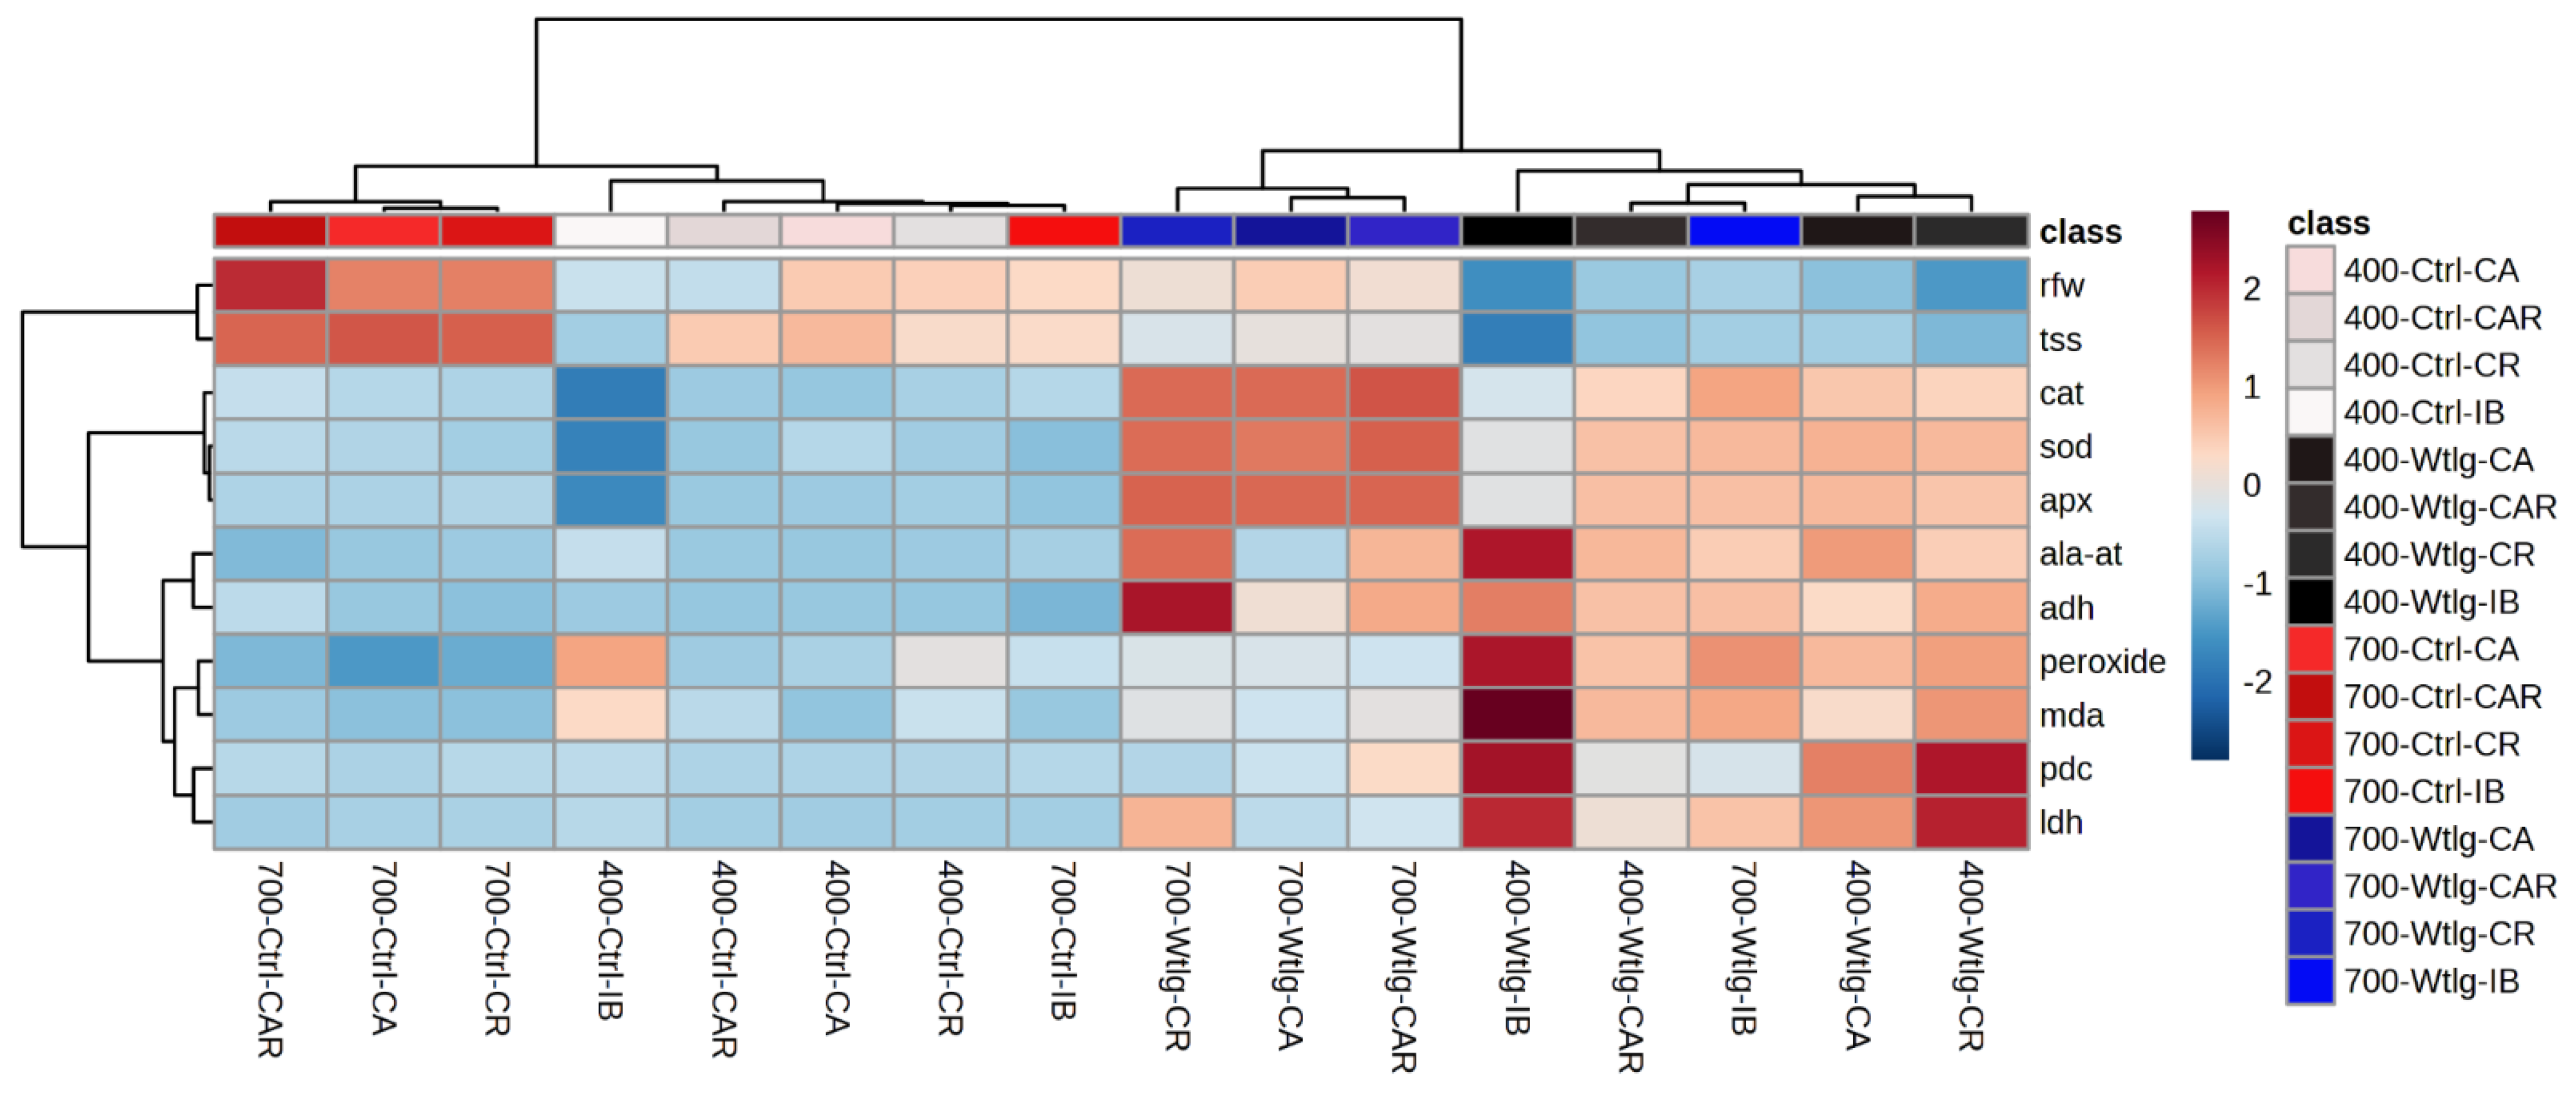
HCA analysis of the root system (Figure 15) did not yield the same four groups seen in the shoot. Plants grown under e[CO2] had higher TSS concentrations and RFW than those grown under a[CO2]. Under waterlogging, both TSS and RFW decreased, with co-inoculated plants showing higher TSS and RFW levels regardless of CO2 concentration. The antioxidant system (CAT, SOD, and APX) was more strongly induced in plants grown under e[CO2] compared to a[CO2], with its activity increasing during waterlogging at both CO2 levels. Although H2O2 and MDA were not influenced by CO2 concentration, their levels significantly increased during waterlogging, with higher values observed in plants grown under a[CO2]. Fermentative metabolism was also induced by waterlogging, with enzymes ADH, PDC, and Ala-AT showing lower activity in plants grown under e[CO2] compared to a[CO2].
Interestingly, fermentative enzyme activity was higher in IB-treated plants, while co-inoculated plants (CA, CR, and CAR) showed reduced fermentative activity. Lactic fermentation was more prevalent than alcoholic fermentation under a[CO2], especially in IB and CR treatments. Under e[CO2], both LDH and ADH activities were highest in IB and CR treatments, while alcoholic fermentation dominated in CA and CAR treatments.
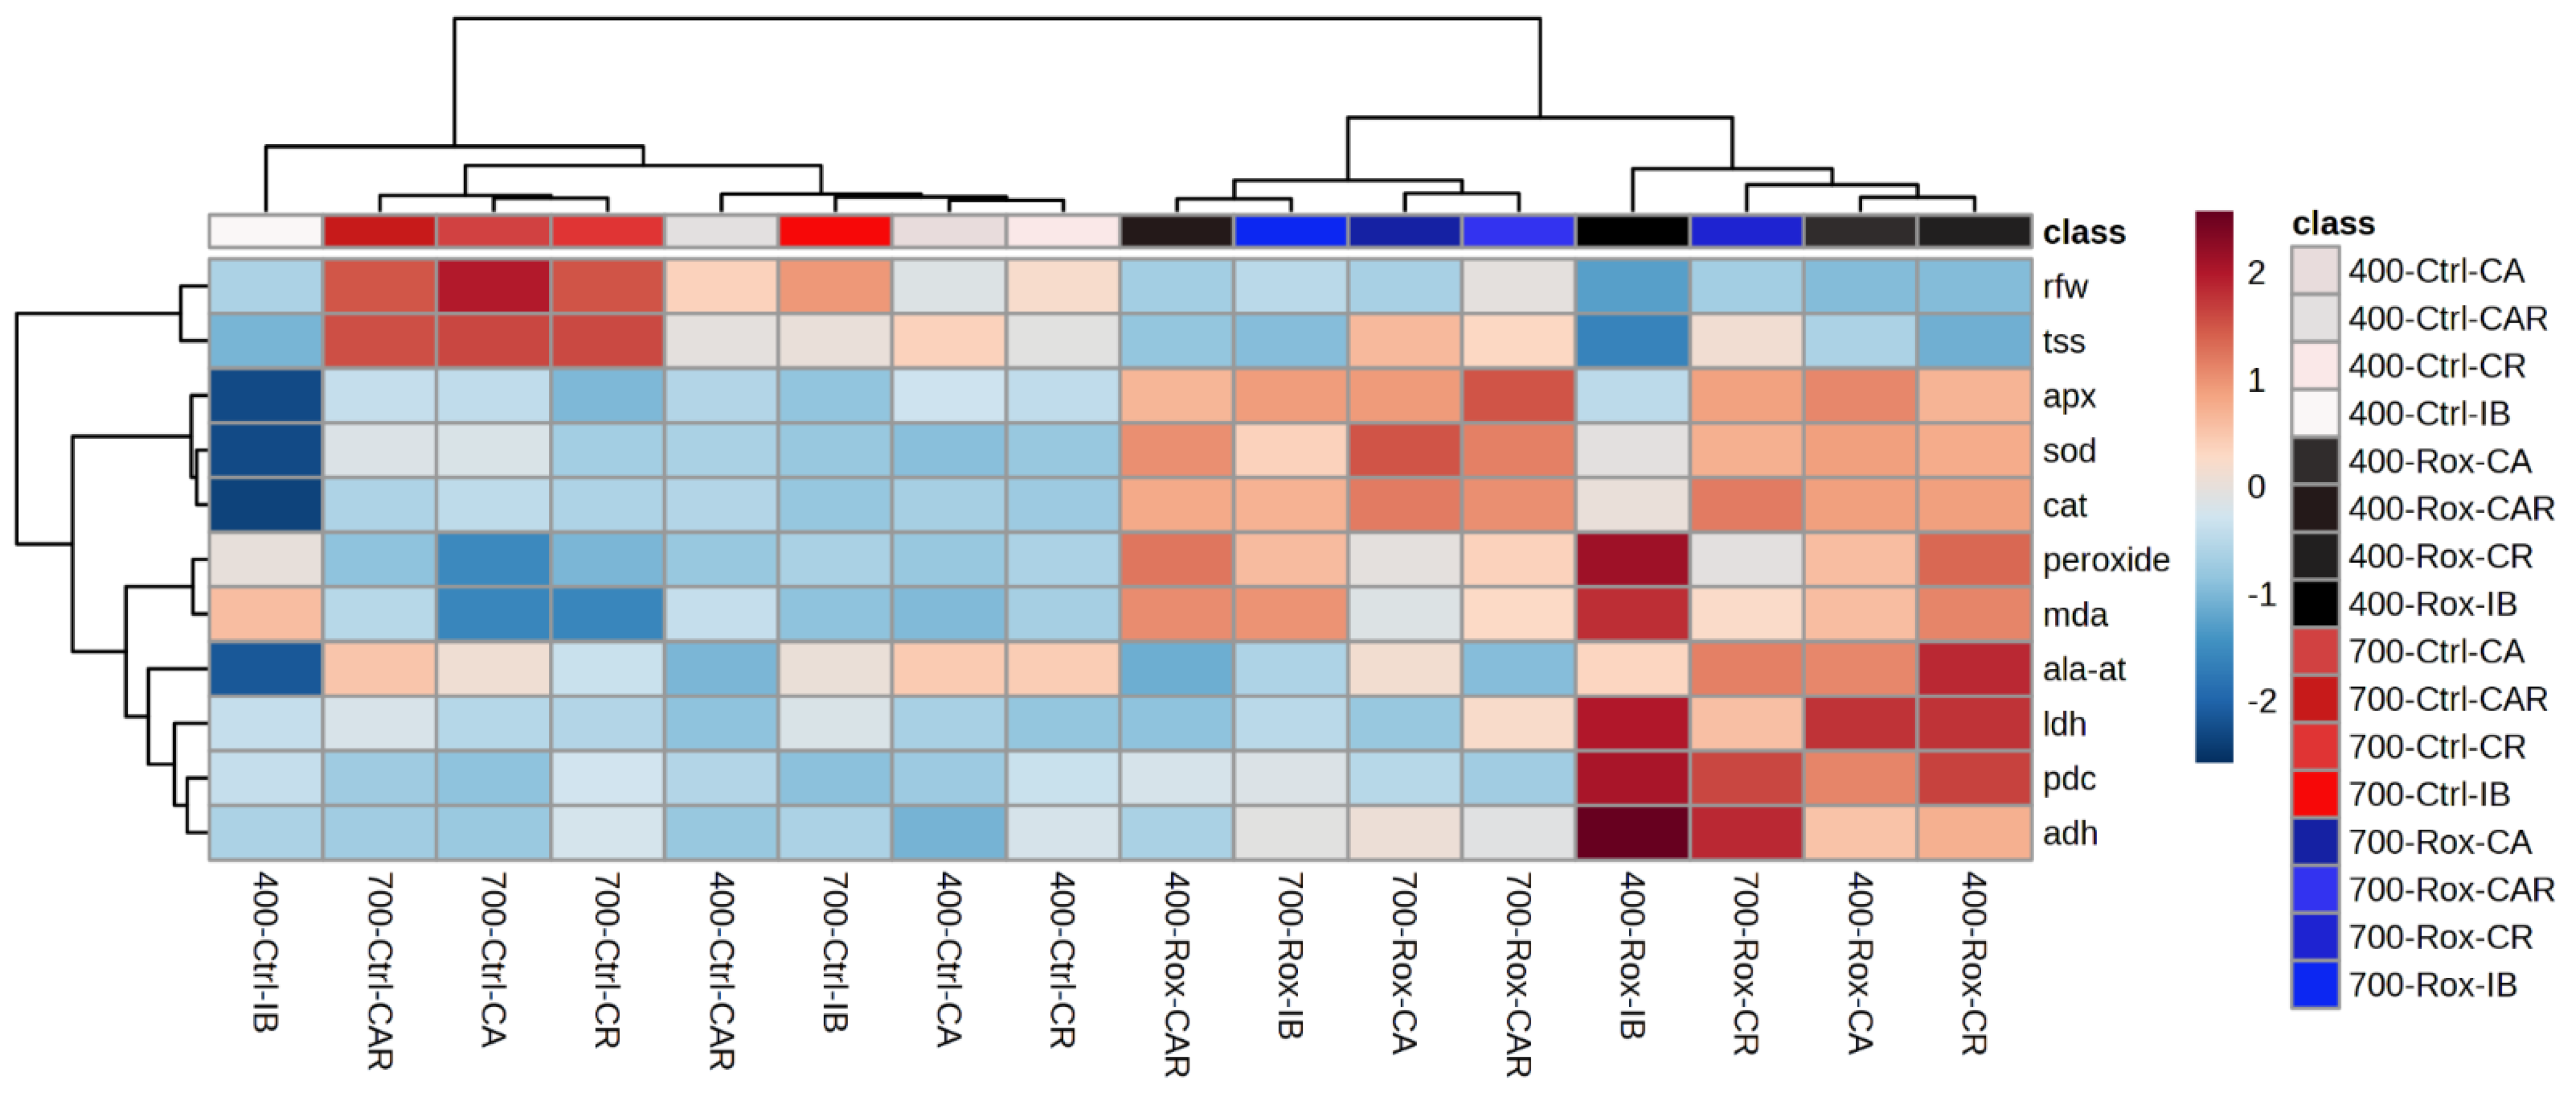
During reoxygenation, the root system did not separate into four groups (Figure 16), with only control and reoxygenation groups being distinguishable. Co-inoculated plants showed higher TSS and RFW levels, with both variables significantly higher under e[CO2]. Although RFW did not increase significantly during reoxygenation, TSS accumulation was restored, particularly in co-inoculated plants under e[CO2], with IB plants having the lowest TSS content. The antioxidant system (CAT, SOD, and APX) remained active during reoxygenation, with co-inoculated plants showing significantly higher activity compared to IB-only plants under a[CO2]. Under e[CO2], the difference between co-inoculated and IB-only plants was smaller, likely due to the effect of e[CO2] on increasing enzymatic activity. Similar patterns were observed for H2O2 and MDA, with lower levels of peroxide and lipid peroxidation levels in plants grown under e[CO2]. Fermentative metabolism remained active under a[CO2], while co-inoculated plants and those grown under e[CO2] showed reduced fermentative enzyme activity after reoxygenation.

4. Discussion

During waterlogging, the reduction observed in A, gs, E, and Ci was already expected, as described by [29,41]. Waterlogging reduces water absorption through aquaporins, which automatically limit the gas exchanges in plant leaves [42]. Lower rates of A in waterlogged plants are also related to a possible decrease in carbon at the active site of Rubisco caused by the reduction in gs, which limits the diffusion of CO2 [43]. We observed that the Ci of IB plants grown in a[CO2] was the lowest value found. In contrast, e[CO2] improved the performance of gs, E, and Ci and enhanced A across all treatments. In plants with C3 photosynthetic metabolism, this improved performance in gas exchanges under e[CO2] can be attributed to reduced photorespiration and greater water use and efficiency [43]. The reduced waste of energy, water, and carbon due to decreased photorespiration in plants grown in e[CO2] likely counteracts the harmful effects of waterlogging on soybean gas exchanges.
Furthermore, plants grown in e[CO2] show better nodulation and N2 fixation, a metabolism severely affected by waterlogging [14,44,45]. Thus, e[CO2] also supports nitrogen metabolism, as plants with improved nitrogen metabolism perform better under waterlogging conditions [46,47]. This improved performance is primarily due to signaling and detoxification by nitric oxide (NO) and nitrogen recycling between the aerial part, under normoxia, and the root system (under hypoxia) [45,48].
It was also found that co-inoculated plants CA, CR, and CAR, regardless of the cultivation environment, a[CO2] or e[CO2], showed better responses in the gas exchange parameters A, gs, E, and Ci under waterlogging conditions. When plants are co-inoculated, they exhibit improvements in P and N metabolism, which greatly enhances their response to waterlogging [49,50]. Co-inoculated plants CA, CR, and CAR also have higher expression of genes related to aquaporin activity, so it is possible that changes in aquaporin activity help during stress, improving overall plant responses to waterlogging [51,52].
During the reoxygenation period, it was noticed that just four days were insufficient for plants to reach the A values of control plants in the a[CO2] environment. However, under the e[CO2] environment, reoxygenated plants managed to reach the levels of their respective control plants, indicating that the issue is indeed directly related to the lack of carbon, even during reoxygenation. The recovery of A during reoxygenation is not a common occurrence in soybean plants [29]. However, in CA and CAR plants, A levels reached those of control plants even under the a[CO2] environment. Among the co-inoculation treatments, the most efficient response with Azospirillum might be related to the resumption of nitrogen fixation and phytohormone synthesis [49,50,53]. This recovery is likely related to increased activity of the enzyme nitrogenase, considering that the main N source in plants associated with PGPB is the atmospheric N2 [54]. In plants co-inoculated with Rhizophagus, the best responses might be related to increased phosphorus absorption and assimilation [55,56].
It is known that plants associated with mycorrhizas exhibit better nutrient absorption rates, and when co-inoculated with diazotrophs, N2 fixation is improved [53,56,57]. Both P and N metabolisms can influence A rates. Phosphorus metabolism is directly linked to energy production cellular structures as components of phosphoric esters, phospholipids, nucleotides, such as ATP, and nucleic acids (DNA, RNA) [58]. Nitrogen metabolism is associated with the production of amino acids, proteins, enzymes, coenzymes, nucleic acids, vitamins, lipoproteins, and chlorophylls. Thus, co-inoculated plants can better respond in the post-stress period [59]. It is also possible that increased demand for carbohydrates due to the presence of more microorganisms serves as a stimulus for the plant to rapidly increase its photosynthesis during reoxygenation to sustain microbiological interactions.
Photosynthetic pigments are typically reduced during waterlogging, either due to ROS action on chloroplast membranes or to nitrogen deficiency from reduced fixation, which may lead the plant to nitrogen remobilization [29,47,60]. The IB treatment reduced the Chl_a content but increased Chl_b, showing no difference in total Chl content during waterlogging. Changes in chlorophyll ratios are related to the plant’s attempts to overcome stress. Kim et al. [61] showed that after nine days of waterlogging, it was possible to separate tolerant from sensitive plants by evaluating chlorophyll content in the first fully expanded leaf, though the author found no differences before six days of treatment. In this study, the most significant reductions were observed during the reoxygenation period. These reductions likely occurred for the same reasons: ROS and nitrogen deficiency, as during reoxygenation, plants still exhibited higher levels of H2O2, and fixation likely had not yet been fully restored.
The pigment vs. waterlogging dynamics are altered by co-inoculation [62,63]. Photosynthetic pigments (Chl_a, Chl_b, Car) protect the plant against oxidative damage caused by radiation excess, which should occur due to reduced photosynthetic efficiency during waterlogging. Studies with priming indicate better pigment accumulation responses under waterlogging conditions, providing aspects of waterlogging tolerance [64,65]. Pigments and the photorespiratory cycle’s carbon oxidation in C3 plants provide a baseline level of protection against excess light energy, quickly quenching the excited state of chlorophyll, dissipating excess adenosine triphosphate (ATP), and reducing the light reactions of photosynthesis, respectively [66]. In cases of leaf senescence and pigment degradation, these can be used as a nutrient source for young leaves, particularly N, considering that fixation is limited by waterlogging [67]. This nutrient remobilization during or after stress may be an alternative for the plant to overcome the stressful situation, especially if co-inoculation CA, CR, and CAR enhance this nitrogen remobilization.
Co-inoculated plants can increase pigment levels even under water deficit, maintaining better photosynthetic responses [68]. For other authors [69,70], the higher concentration of pigments in plants co-inoculated with plant PGPB is attributed to hormonal modulation by microorganisms in the plant, primarily auxin. Meanwhile, ethylene promotes Chlorophyllase genes and induces accelerated chlorophyll destruction [71]. Auxin and cytokinins inhibit chlorophyll loss during wheat chloroplast aging in vivo and in vitro [71]. The modulation of phytohormones by microorganisms results in reduced losses of photosynthetic pigments under stress conditions.
The accumulation of ROS during waterlogging is a common answer, as it happens with other stresses [72]. In the early hours of waterlogging, the increase in H2O2 levels is seen as a signaling response [60]. The problem arises as H2O2 levels increase over time to the point of causing cellular damage, such as lipid peroxidation (MDA). In leaves, during waterlogging, two major sources of H2O2 are enhanced: the first is the electron transport chain of photosynthesis. With reduced photosynthetic efficiency, electrons are released into the intermembrane space, which reacts with oxygen to form a superoxide anion, harming the cells. The second source is photorespiration, which is also increased with reduced photosynthetic efficiency, driven by reduced gs, E, and Ci, resulting in higher oxygenase activity of Rubisco.
In the roots, there is also an increase in H2O2 levels, mainly in the initial period of waterlogging [60]. Over time, the trend is for H2O2 levels in roots to decrease, possibly due to a lack of oxygen. Nevertheless, MDA levels remain high in hypoxic roots, likely due to the lack of an efficient antioxidant system. In roots, the main source of H2O2 production is the mitochondrial electron transport chain at the end of respiration. What was observed in this study is that regardless of the tissue, leaf, or root, in e[CO2] environments, there is a reduction in H2O2 production and lower MDA, indicating that e[CO2] may mitigate the deleterious effects of waterlogging.
In leaves, the beneficial effect of e[CO2] is likely related to lower rates of photorespiration [43]. Nevertheless, it was found that in roots, approximately half of the MDA content was found in leaves. In roots, it is believed that this effect is indirect; e[CO2] improved the performance of the antioxidant system (CAT, SOD, and APX antioxidant enzymes), which in turn detoxifies the stress-related ROS, as seen in other cases [73,74,75]. Mitigating effects on oxidative stress were also observed in co-inoculated plants from CA, CR, and CAR treatments, proving that co-inoculation can contribute to improving plants’ responses to stress-related elevated levels of H2O2 and MDA, both in roots and leaves.
During the reoxygenation period, oxidative stress tends to increase, especially in sensitive species, regardless of whether the treatments have mitigating effects, though comparable results are described in the literature [46,60,64,76]. This increase in H2O2 during the reoxygenation period is linked to the reoxygenation of the root system. The rapid increase in O2 in previously hypoxic roots results in oxidative damage to membranes during reoxygenation. Even though antioxidant activity is elevated, it is not sufficient to mitigate the effect of high H2O2 levels. What was observed in the study is that in co-inoculated plants from CA, CR, and CAR treatments, lower levels of MDA are related to the higher antioxidant activity of the SOD, CAT, and APX enzymes.
It is believed that the mitigation of oxidative stress by microorganisms is due to the activation of the antioxidant system (CAT, SOD, and APX enzymes) because of systemic acquired resistance and systemic induced resistance, SAR, and SIR, respectively [24,77,78]. When the plant first encounters one microorganism, it is perceived as a pathogen, activating its defense mechanisms and assisting in future stresses. Since microorganisms are also subjected to waterlogging stress, it is believed that the plant’s and microorganisms’ antioxidant activities converge in combating ROS. In CA, CAR, and CAR co-inoculated plants, the activity of antioxidant enzymes may be mediated by more rapid and effective signaling. Other studies show that more robust plants, with greater biomass, higher nutrient absorption, particularly P and N, higher sugar concentrations, supported by increased A, and better water use and efficiency, among other characteristics, exhibit better performance when dealing with stressful situations [54,79,80,81,82]. Literature data on co-inoculation with Azospirillum describe the direct influence of the microorganism on the expression of antioxidant system-related genes, as well as the action of phytohormones modulating the activity of SOD, CAT, and APX enzymes [57,78,83].
Supposedly, the mechanisms of waterlogging tolerance resulting from co-inoculation are the same as those involved in tolerance to other stresses, including biotic stresses. Indeed, co-inoculation promoted an increase in the antioxidant system in soybean plants infected by Macrophomina phaseolina [63] and in sunflower plants subjected to saline stress [84]. Co-inoculation with Rhizophagus under waterlogging conditions is certainly an alternative for promoting stress tolerance and mitigating oxidative damage. Similarly, co-inoculation with Azospirillum is directly related to the promotion of plant growth and improvements in responses to oxidative stress [85,86].
The plant perceives the reduction in oxygen levels in the plant root system imposed by waterlogging through a family of ethylene-responsive sensors (VII (ERF-VII)) [87]. The perception of these sensors triggers a series of signals in the plants, activating genes that promote physiological and anatomical adaptations in response to stress. Among these responses are the activation of fermentative metabolism, formation of aerenchyma, and adventitious roots [86,87]. At the same time, as the plant perceives the reduction in O2 levels, there is also a reduction in energy production in the form of ATP generated by the electron transport chain [47]. With the lack of O2 to receive electrons in the mitochondria, the electron flow is reduced, which not only decreases energy production but also causes alterations and accumulation of Krebs cycle intermediates, especially pyruvate, that consequently are consumed by fermentative enzyme activity, making it possible for plants to keep at least a minimum ATP production at substrate level and regenerating the NAD+ needed to maintain the glycolysis [87,88,89].
Three points stand out regarding the results of fermentative enzymes in the study. The first is the lower activity of the enzymes in co-inoculated plants (CA, CR, and CAR), suggesting that fermentative metabolism is less induced. The second point addresses the shift between alcoholic and lactic fermentation between the a[CO2] and e[CO2] environments. The third point refers to the lower fermentative activity in plants grown in e[CO2]. The alteration between alcoholic and lactic fermentation is common in soybean plants that are either sensitive or tolerant to waterlogging, with tolerant plants exhibiting higher lactic fermentation [41]. In this study, we observed higher alcoholic fermentation in plants grown in e[CO2], which may be directly related to the higher availability of carbon, as carbon is not a metabolic limiting factor under this condition.
Furthermore, plants grown in e[CO2] showed better responses in the fermentative enzymes during this study. Thus, it is believed that lower activities of the enzymes LDH, PDC, ADH, and Ala-At complement the other obtained results, even though fermentative metabolism regulation is a mechanism related to the waterlogging tolerance, as plants may have adopted other mechanisms to overcome stress. This may also be related to the improvements in biometric parameters found in the roots of plants grown under e[CO2]. For instance, these plants exhibited a larger stem diameter, which suggests the possible formation of aerenchyma, providing O2 to the root cells, thus allowing minimal activity of the respiratory electron transport chain on roots, helping plants obtain better results on other analyzed variables.
Plants grown under e[CO2] exhibited higher A, which may have resulted in greater accumulation of TSS in the roots; this result was also observed in co-inoculated plants. Co-inoculation (CA, CR, and CAR) generates a higher demand for TSS in the roots due to requiring greater exchanges between plants and microorganisms. This accumulation of TSS in the roots probably occurred before waterlogging, as evidenced by the control plants’ results, as observed in the results from gas exchange under e[CO2] and co-inoculations in both environments, which showed higher TSS levels. Even so, during waterlogging, TSS was reduced across all treatments. Other authors have reported related results [8,64]. During waterlogging, reductions in TSS are normal due to reductions in A and the use of TSS to sustain glycolytic reactions induced by the hypoxic roots’ environments during waterlogging, consuming the cell’s carbon stock to cope with the lack of oxygen.
It was observed that both plants grown in e[CO2] and co-inoculated plants had a higher RFW. This is related to a higher accumulation of TSS in the roots, regardless of waterlogging. Nevertheless, during waterlogging, there is a reduction in RFW, as described by other researchers [29,41,64,76]. The promotion of root growth by microorganisms, whether by Azospirillum or Rhizophagus, is extensively reported in the literature and is usually explained by hormonal action and increased nutrient absorption [56,62].
The results show that a four-day reoxygenation period was insufficient to complete plant recovery, regardless of CO2 levels in the environment, and this may be related as we have used a sensitive soybean genotype as a way to better explore possible induced tolerance by studied factors, more specifically the influence of the co-inoculation of the plants in the climate change context. However, it is possible to notice that reoxygenated plants had higher concentrations of TSS and RFW compared to the waterlogged plants. This may have occurred because control plants continued to develop, making it impossible for stressed plants to recover to the same level. Still, it is noted that plants grown in e[CO2] had a faster recovery during reoxygenation when compared to plants grown in a[CO2]. This can be an advantage that C3 plants may have when carbon and nitrogen metabolism present better maintenance due to the increasing of atmospheric CO2 and the use of co-inoculation practices in the future.
Plants co-inoculated under normal conditions exhibit higher photosynthetic rates, efficient water use, nutrient assimilation, antioxidant capacity, and better growth rates, among other important characteristics also found in plants grown in e[CO2] with or without stress influence. Thus, due to co-inoculation with the PGPB and mycorrhizae, CA, CR, and CAR and/or cultivated under e[CO2], more robust plants can better withstand waterlogging stress. The same applies during the reoxygenation period for roots, where microorganisms’ co-inoculation also makes a significant difference. Thus, co-inoculating plants, especially considering an increasingly CO2-rich environment, may help enhance plant tolerance to stress and ensure productivity under adverse conditions, especially waterlogging, as we have found.

5. Conclusions

The best responses to waterlogging were observed in co-inoculated plants grown under e[CO2]. However, equivalent results were obtained with co-inoculated plants under a[CO2]. Co-inoculation in soybeans improves plant performance under waterlogging conditions in a way comparable to the increase in atmospheric CO2. However, while the increase in CO2 has negative environmental impacts, co-inoculation is a sustainable and environmentally friendly practice. Plant growth-promoting microorganisms, in conjunction with nitrogen fixers, can mitigate the deleterious effects of waterlogging, offering benefits comparable to those promoted by elevated CO2. Considering the challenges posed by climate change, co-inoculation emerges as a promising and sustainable alternative to mitigate the negative effects of waterlogging on plants. More studies on this topic are on course to try elucidating other aspects of co-inoculation on soybean plants facing waterlogging stress.

Supplementary Materials

The following supporting information can be downloaded at: https://www.mdpi.com/article/10.3390/nitrogen5040061/s1, Table S1. Soil characteristics. Figure S1. Atmospheric conditions of CO2 concentrations (ambient a[CO2] or elevated e[CO2]) (A), temperature (°C), and humidity during the experiment on each open-top chamber (B).

Author Contributions

Conceptualization, E.P.S., D.A.P., C.J.d.-S. and L.d.A.; methodology, E.P.S.; validation, E.P.S.; formal analysis, E.P.S., D.A.P., A.U.B., N.D.C.B. and I.R.C.; investigation, E.P.S., D.A.P. and N.D.C.B.; resources, A.C.B.d.O., L.A.d.A. and L.d.A.; data curation, E.P.S. and I.R.C.; writing—original draft preparation, E.P.S.; writing—review and editing, E.P.S. and D.A.P.; visualization, E.P.S.; supervision, D.A.P., C.J.d.-S. and L.d.A.; project administration, L.d.A.; funding acquisition, L.d.A. All authors have read and agreed to the published version of the manuscript.

Funding

This study was financed in part by the Coordenação de Aperfeiçoamento de Pessoal de Nível Superior—Brazil (CAPES)—Finance Code 001, Conselho Nacional de Desenvolvimento Científico e Tecnológico (CNPq) and the Fundação de Amparo à Pesquisa do Estado do Rio Grande do Sul (FAPERGS). The APC was funded by Nitrogen—MDPI.

Data Availability Statement

The data that support the findings of this study are available upon request.

Acknowledgments

We thank the NOVATERO Company for kindly providing us the Rhizophagus intraradices.

Conflicts of Interest

The authors declare no conflicts of interest.

References

  1. Jackson, R.B.; Le, Q.C.; Andrew, R.M.; Canadell, J.G.; Peters, G.P.; Roy, J.; Wu, L. Warning signs for stabilizing global CO2 emissions. Environ. Res. Lett. 2017, 12, 110202. [Google Scholar] [CrossRef]
  2. Ainsworth, E.A.; Long, S.P. What have we learned from 15 years of free-air CO2 enrichment (FACE)? A meta-analytic review of the responses of photosynthesis, canopy properties and plant production to rising CO2. New Phytol. 2005, 165, 351–371. [Google Scholar] [CrossRef] [PubMed]
  3. Canadell, J.G.; Le, Q.C.; Raupach, M.R.; Field, C.B.; Buitenhuis, E.T.; Ciais, P.; Thomas, J.C.; Nathan, P.G.; Houghton, R.A.; Gregg, M. Contributions to accelerate the growth of atmospheric CO2 in economic activity, carbon intensity and efficiency of natural sinks. Proc. Natl. Acad. Sci. USA 2007, 104, 18866–18870. [Google Scholar] [CrossRef] [PubMed]
  4. Tans, P.; Keeling, R. Trends in Atmospheric Carbon Dioxide. NOAA. 2016. Available online: http://www.esrl.noaa.gov/gmd/ccgg/trends (accessed on 10 March 2024).
  5. Bernacchi, C.J.; Leakey, A.D.B.; Heady, L.E.; Morgan, P.B.; Dohleman, F.G.; Mcgrath, J.M.; Gillespie, K.M.; Wittig, V.E.; Rogers, A.; Long, S.P.; et al. Hourly and seasonal variation in photosynthesis and stomatal conductance of soybean grown at future CO2 and ozone concentrations for 3 years under fully open-air field conditions. Plant Cell Environ. 2006, 29, 2077–2090. [Google Scholar] [CrossRef] [PubMed]
  6. Kimball, B.A. Crop responses to elevated CO2 and interactions with H2O, N, and temperature. Plant Biol. 2016, 31, 36–43. [Google Scholar] [CrossRef]
  7. Drag, D.W.; Slattery, R.; Siebers, M.; DeLucia, E.H.; Ort, D.R.; Bernacchi, C.J. Soybean photosynthetic and biomass responses to carbon dioxide concentrations ranging from pre-industrial to the distant future. J. Exp. Bot. 2020, 71, 3690–3700. [Google Scholar] [CrossRef]
  8. Ma, H.; Zhu, J.; Xie, Z.; Liu, G.; Zeng, Q.; Han, Y. Responses of rice and winter wheat to free-air CO2 enrichment (China FACE) at rice/wheat rotation system. Plant Soil 2007, 294, 137–146. [Google Scholar] [CrossRef]
  9. Wang, D.; Heckathorn, S.A.; Wang, X.; Philpott, S.M. A metaanalysis of plant physiological and growth responses to temperature and elevated CO2. Oecologia 2012, 169, 1–13. [Google Scholar] [CrossRef]
  10. Parvin, S.; Uddin, S.; Bourgault, M.; Roessner, U.; Tausz-Posch, S.; Armstrong, R.; O’Leary, G.; Fitzgerald, G.; Tausz, M. Water availability moderates N2 fixation benefit from elevated [CO2]: A 2-year free-air CO2 enrichment study on lentil (Lens culinaris Medik.) in a water limited agroecosystem. Plant Cell Environ. 2018, 41, 2418–2434. [Google Scholar] [CrossRef]
  11. Rogers, A.; Ainsworth, E.A.; Leakey, A.D. Will elevated carbon dioxide concentration amplify the benefits of nitrogen fixation in legumes? Plant Physiol. 2009, 151, 1009–1016. [Google Scholar] [CrossRef]
  12. Kant, S.; Seneweera, S.; Rodin, J.; Materne, M.; Burch, D.; Rothstein, S.J.; Spanenberg, G. Improving yield potential in crops under elevated CO2: Integrating the photosynthetic and nitrogen utilization efficiencies. Front. Plant Sci. 2012, 3, 162. [Google Scholar] [CrossRef] [PubMed]
  13. Aranjuelo, I.; Arrese-Igor, C.; Molero, G. Nodule performance within a changing environmental context. J. Plant Physiol. 2014, 171, 1076–1090. [Google Scholar] [CrossRef] [PubMed]
  14. Lam, S.K.; Chen, D.; Norton, R.; Armstrong, R. Does phosphorus stimulate the effect of elevated [CO2] on growth and symbiotic nitrogen fixation of grain and pasture legumes? Crop Pasture Sci. 2012, 63, 53–62. [Google Scholar] [CrossRef]
  15. Li, Y.; Yu, Z.; Liu, X.; Mathesius, U.; Wang, G.; Tang, C.; Jin, J. Elevated CO2 increases nitrogen fixation at the reproductive phase contributing to various yield responses of soybean cultivars. Front. Plant Sci. 2017, 8, 1546. [Google Scholar] [CrossRef] [PubMed]
  16. Hungate, B.A.; Stiling, P.D.; Dijkstra, P.; Johnson, D.W.; Ketterer, M.E.; Hymus, G.J.; Hinkle, R.C.; Drake, B.G. CO2 elicits long-term decline in nitrogen fixation. Science 2004, 304, 1291. [Google Scholar] [CrossRef]
  17. Reich, P.B.; Hobbie, S.E.; Lee, T.; Ellsworth, D.S.; West, J.B.D.; Tilman, J.M.H.; Knops, S.; Naeem, J. TrostNitrogen limitation constrains sustainability of ecosystem response to CO2. Nature 2006, 440, 922–925. [Google Scholar] [CrossRef]
  18. van Groenigen, K.J.; Six, J.; Hungate, B.A.; de Graaff, M.A.; Van Breemen, N.; Van Kessel, C. Element interactions limit soil carbon storage. Proc. Natl. Acad. Sci. USA 2006, 103, 6571–6574. [Google Scholar] [CrossRef]
  19. Moretti, L.G.; Crusciol, C.A.C.; Bossolani, J.W.; Momesso, L.; Garcia, A.; Kuramae, E.E.; Hungria, M. Bacterial Consortium and Microbial Metabolites Increase Grain Quality and Soybean Yield. J. Soil Sci. Plant Nutr. 2020, 20, 1923–1934. [Google Scholar] [CrossRef]
  20. Musyoka, D.M.; Njeru, E.M.; Nyamwange, M.M.; Maingi, J.M. Arbuscular mycorrhizal fungi and coinoculation of Bradyrhizobium increase nitrogen fixation and the growth of green grasses (Vigna radiata L.) under water stress. J. Plant Nutr. 2020, 43, 1036–1047. [Google Scholar] [CrossRef]
  21. Vergara, C.; Araujo, K.E.C.; Souza, S.R.D.; Schultz, N.; Saggin Júnior, O.J.; Sperandio, M.V.L.; Zilli, J.É. Interação da planta com fungo micorrízico e sua resposta à inoculação com diferentes fungos promotores de crescimento. Pesqui. Agropecu. Bras. 2018, 54, e25140. [Google Scholar] [CrossRef]
  22. Jilkova, V.; Sim, A.; Thornton, B.; Jandová, K.; Cajthaml, T.; Paterson, E. Impact of plant species and atmospheric CO2 concentration on rhizodeposition and soil microbial activity and community composition. J. Soil Sci. Plant Nutr. 2020, 183, 327–337. [Google Scholar] [CrossRef]
  23. Voesenek, L.A.C.J.; Sasidharan, R. Ethylene–and oxygen signalling–drive plant survival during waterlogging. Plant Biol. 2013, 15, 426–435. [Google Scholar] [CrossRef] [PubMed]
  24. Van Dongen, J.T.; Licausi, F. Oxygen sensing and signaling. Annu. Rev. Plant Biol. 2015, 66, 345–367. [Google Scholar] [CrossRef] [PubMed]
  25. Garcia, N.; da-Silva, C.J.; Cocco, K.L.T.; Pomagualli, D.; de Oliveira, F.K.; da Silva, J.V.L.; de Oliveira, A.C.B.; do Amarante, L. Waterlogging tolerance of five soybean genotypes through different physiological and biochemical mechanisms. Environ. Exp. Bot. 2020, 172, 103975. [Google Scholar] [CrossRef]
  26. Fukami, J.; de la Osa, C.; Ollero, F.J.; Megías, M.; Hungria, M. Co-inoculation of maize with Azospirillum brasilense and Rhizobium tropici as a strategy to mitigate salinity stress. Funct. Plant Biol. 2018, 45, 328–339. [Google Scholar] [CrossRef]
  27. Palit, P.; Kudapa, H.; Zougmore, R.; Kholova, J.; Whitbread, A.; Sharma, M.; Varshney, R.K. An integrated research framework combining genomics, systems biology, physiology, modelling and breeding for legume improvement in response to elevated CO2 under climate change scenario. Curr. Plant Biol. 2020, 22, 100149. [Google Scholar] [CrossRef]
  28. Rondina, A.B.L.; dos Santos Sanzovo, A.W.; Guimarães, G.S.; Wendling, J.R.; Nogueira, M.A.; Hungria, M. Changes in root morphological traits in soybean co-inoculated with Bradyrhizobium spp. and Azospirillum brasilense or treated with A. brasilense exudates. Biol. Fertil. Soils 2020, 56, 537–549. [Google Scholar] [CrossRef]
  29. Richter, G.L.; Zanon, A.; Streck, N.A.; Guedes, J.V.C.; Kräulich, B.; da Rocha, T.S.M.; Winck, J.E.M.; Cera, J.C. Estimating leaf area of modern soybean cultivars by a non-destructive method. Bragantia 2014, 73, 416–425. [Google Scholar] [CrossRef]
  30. Wellburn, A.R. The spectral determination of chlorophylls a and b, as well as total Carotenoids, using various solvents with spectrophotometers of diferente resolution. J. Plant Physiol. 1994, 144, 307–313. [Google Scholar] [CrossRef]
  31. Velikova, V.; Yordanov, I.; Edreva, A. Oxidative stress and some antioxidant systems in acid rain-treated bean plants: Protective role of exogenous polyamines. Plant Sci. 2000, 151, 59–66. [Google Scholar] [CrossRef]
  32. Cakmak, I.; Horst, W.J. Effect of aluminium on lipid peroxidation, superoxide dismutase, catalase, and peroxidase activities in root tips of soybean (Glycine max). Physiol. Plant. 1991, 83, 463–468. [Google Scholar] [CrossRef]
  33. Giannopolitis, C.N.; Ries, S.K. Superoxide dismutases: I. Occurrence in higher plants. Plant Physiol. 1977, 59, 309–314. [Google Scholar] [CrossRef] [PubMed]
  34. Azevedo, R.A.; Alas, R.M.; Smith, R.J.; Lea, P.J. Response of antioxidante enzymes to transfer from elevated carbon dioxide to air and ozone fumigation, in the leaves and roots of wild-type and a catalase-deficient mutant of barley. Physiol. Plant. 1998, 66, 280–292. [Google Scholar] [CrossRef]
  35. Nakano, Y.; Asada, K.H. Peroxide is Scavenged by Ascorbatespecific Peroxidase in Spinach Chloroplasts. Plant Cell Physiol. 1981, 22, 867–880. [Google Scholar] [CrossRef]
  36. Hanson, A.D.; Jacobsen, J.V.; Zwar, J.A. Regulated Expression of Three Alcohol Dehydrogenase Genes in Barley Aleurone Layers. Plant Physiol. 1984, 75, 573–581. [Google Scholar] [CrossRef]
  37. Hanson, A.D.; Jacobsen, J.V. Control of Lactate Dehydrogenase, Lactate Glycolysis, and α-Amylase by O2 Deficit in Barley Aleurone Layers. Plant Physiol. 1984, 75, 566–572. [Google Scholar] [CrossRef]
  38. Good, A.G.; Muench, D.G. Purification and Characterization of an Anaerobically Induced Alanine Aminotransferase from Barley Roots. Plant Physiol. 1992, 99, 1520–1525. [Google Scholar] [CrossRef]
  39. Bieleski, R.L.; Turner, N.A. Separation and estimation of amino acids in crude plant extracts by thin-layer electrophoresis and chromatography. Anal. Biochem. 1966, 17, 278–293. [Google Scholar] [CrossRef]
  40. Graham, D.; Smydzuk, J. Use of anthrone in the quantitative determination of hexose phosphates. Anal. Biochem. 1965, 11, 246–255. [Google Scholar] [CrossRef]
  41. Posso, D.A.; da-Silva, C.J.; Shimoia, E.P.; da Silva Martins, T.; Reissig, G.N.; de Oliveira, A.C.B.; Borela, J.; van Dogen, T.J.; do Amarante, L. Root-hypoxia tolerance in soybean sister-lines plants indicates a better balance in energy use/dissipation and oxidative stress control. Plant Stress 2023, 10, 100225. [Google Scholar] [CrossRef]
  42. Maurel, C.; Boursiac, Y.; Luu, D.T.; Santoni, V.; Shahzad, Z.; Verdoucq, L. Aquaporins in plants. Physiol. Rev. 2015, 95, 1321–1358. [Google Scholar] [CrossRef] [PubMed]
  43. Thomas, D.S. The end game(s) of photosynthetic carbon metabolism. Plant Physiol. 2024, 195, 67–78. [Google Scholar] [CrossRef]
  44. do Amarante, L.; Lima, J.D.; Sodek, L. Alterations of xylem transport of key metabolic products of assimilatory activity in soybean: Do similar alterations occur in roots and nodules? Acta Physiol. Plant 2022, 44, 11. [Google Scholar] [CrossRef]
  45. Vitor, S.C.; Sodek, L. Products of anaerobic metabolism in waterlogged roots 978 of soybean are exported in the xylem. Plant Sci. 2019, 284, 82–90. [Google Scholar] [CrossRef] [PubMed]
  46. da Silva Martins, T.; Da-Silva, C.J.; Shimoia, E.P.; Posso, D.A.; Carvalho, I.R.; de Oliveira, A.C.B.; do Amarante, L. Nitrate supply decreases fermentation and alleviates oxidative and ionic stress in nitrogen-fixing soybean exposed to saline waterlogging. Funct. Plant Biol. 2023, 50, 416–433. [Google Scholar] [CrossRef]
  47. Da-Silva, C.J.; Shimoia, E.P.; Posso, D.A.; Cardoso, A.A.; Batz, T.A.; Oliveira, A.C.B.; do Amarante, L. Nitrate nutrition increases foliar levels of nitric oxide and waterlogging tolerance in soybean. Acta Physiol. Plant. 2021, 43, 116. [Google Scholar] [CrossRef]
  48. da-Silva, C.J.; do Amarante, L. Short-term nitrate supply decreases fermentation and oxidative stress caused by waterlogging in soybean plants. Environ. Exp. Bot. 2020, 176, 104078. [Google Scholar] [CrossRef]
  49. Tewari, S.; Arora, N.K. Soybean production under waterlogging stress and its mitigation using plant growth-promoting microbes. In Environmental Stresses in Soybean Production; Miransari, M., Ed.; Academic Press: Oxford, UK, 2016; Volume 2, pp. 23–40. [Google Scholar] [CrossRef]
  50. Shimoia, E.P.; Da-Silva, C.J.; Posso, D.A.; da Silva Martins, T.; Agualongo, D.A.P.; de Oliveira, A.C.B.; do Amarante, L. Co-inoculation of Seeds with Bradyrhizobium, Azospirillum, and Rhizophagus Improves Nitrogen Assimilation and Growth in Soybean Plants Subjected to Waterlogging. Russ. J. Plant Physiol. 2023, 70, 146. [Google Scholar] [CrossRef]
  51. Ruiz-Lozano, J.M. Arbuscular mycorrhizal symbiosis and alleviation of osmotic stress. New perspectives for molecular studies. Mycorrhiza 2003, 13, 309–317. [Google Scholar] [CrossRef]
  52. Zawoznik, M.S.; Ameneiros, M.; Benavides, M.P.; Vázquez, S.; Groppa, M.D. Response to saline stress and aquaporin expression in Azospirillum-inoculated barley seedlings. Appl. Microbiol. Biotechnol. 2011, 90, 1389–1397. [Google Scholar] [CrossRef]
  53. Chibeba, A.M.; de Fátima Guimarães, M.; Brito, O.R.; Nogueira, M.A.; Araujo, R.S.; Hungria, M. Co-Inoculation of Soybean with Bradyrhizobium and Azospirillum Promotes Early Nodulation. Am. J. Plant Sci. 2015, 6, 1641–1649. [Google Scholar] [CrossRef]
  54. Younesi, O.; Moradi, A.; Namdari, A. Influence of arbuscular mycorrhiza on osmotic adjustment compounds and antioxidant enzyme activity in nodules of salt-stressed soybean (Glycine max). Acta Agric. Slov. 2013, 101, 219. [Google Scholar] [CrossRef]
  55. Birhane, E.; Sterck, F.J.; Fetene, M.; Bongers, F.; Kuyper, T.W. Arbuscular mycorrhizal fungi enhance photosynthesis, water use efficiency, and growth of frankincense seedlings under pulsed water availability conditions. Oecologia 2012, 169, 895–904. [Google Scholar] [CrossRef]
  56. Stoffel, S.C.G.; Meyer, E.; Lovato, P.E. Yield increase of soybean inoculated with a commercial arbuscular mycorrhizal inoculant in Brazil. Afr. J. Agric. Res. 2020, 16, 702–713. [Google Scholar]
  57. Fukami, J.; Ollero, F.J.; de la Osa, C.; Valderrama-Fernández, R.; Nogueira, M.A.; Megías, M.; Hungria, M. Antioxidant activity and induction of mechanisms of resistance to stresses related to the inoculation with Azospirillum brasilense. Arch. Microbiol. 2018, 200, 1191–1203. [Google Scholar] [CrossRef]
  58. Sardans, J.; Rivas-Ubach, A.; Peñuelas, J. The C: N: P stoichiometry of organisms and ecosystems in a changing world: A review and perspectives. Perspect. Plant Ecol. Evol. Syst. 2012, 14, 33–47. [Google Scholar] [CrossRef]
  59. Yang, Y.; Liu, B.R.; An, S.S. Ecological stoichiometry in leaves, roots, litters and soil among different plant communities in a desertified region of Northern China. Catena 2018, 166, 328–338. [Google Scholar] [CrossRef]
  60. Da-Silva, C.J.; do Amarante, L. Time-course biochemical analyses of soybean plants during waterlogging and reoxygenation. Environ. Exp. Bot. 2020, 180, 104242. [Google Scholar] [CrossRef]
  61. Kim, K.H.; Cho, M.J.; Kim, J.M.; Lee, T.; Heo, J.H.; Jeong, J.Y.; Lee, J.; Moon, J.K.; Kang, S. Growth response and developing simple test method for waterlogging stress tolerance in soybean. J. Crop Sci. Biotechnol. 2019, 22, 371–378. [Google Scholar] [CrossRef]
  62. Juge, C.; Prévost, D.; Bertrand, A.; Bipfubusa, M.; Chalifour, F.P. Growth and biochemical responses of soybean to double and triple microbial associations with Bradyrhizobium, Azospirillum and arbuscular mycorrhizae. Appl. Soil Ecol. 2012, 61, 147–157. [Google Scholar] [CrossRef]
  63. Spagnoletti, F.N.; Cornero, M.; Chiocchio, V.; Lavado, R.S.; Roberts, I.N. Arbuscular mycorrhiza protects soybean plants against Macrophomina phaseolina even under nitrogen fertilization. Eur. J. Plant Pathol. 2020, 156, 839–849. [Google Scholar] [CrossRef]
  64. Agualongo, D.A.P.; Da-Silva, C.J.; Garcia, N.; de Oliveira, F.K.; Shimoia, E.P.; Posso, D.A.; de Oliveira, A.C.B.; Colares, D.S.O.; do Amarante, L. Waterlogging priming alleviates the oxidative damage, carbohydrate consumption, and yield loss in soybean (Glycine max) plants exposed to waterlogging. Funct. Plant Biol. 2022, 49, 1029–1042. [Google Scholar] [CrossRef] [PubMed]
  65. Wang, X.; Huang, M.; Zhou, Q.; Cai, J.; Dai, T.; Cao, W.; Jiang, D. Physiological and proteomic mechanisms of waterlogging priming improves tolerance to waterlogging stress in wheat (Triticum aestivum L.). Environ. Exp. Bot. 2016, 132, 175–182. [Google Scholar] [CrossRef]
  66. Rhodes, D.; Nadolska-Orczyk, A. Plant stress physiology. In Encyclopaedia of Life Sciences; Nature Publishing Group: New York, NY, USA, 2001. [Google Scholar] [CrossRef]
  67. Liu, Y.; Gao, S.; Hu, Y.; Zhang, T.; Guo, J.; Shi, L.; Li, M. Comparative study of leaf nutrient reabsorption by two different ecotypes of wild soybean under low-nitrogen stress. PeerJ 2023, 11, e15486. [Google Scholar] [CrossRef]
  68. Chieb, M.; Gachomo, E.W. The role of plant growth promoting rhizobacteria in plant drought stress responses. BMC Plant Biol. 2023, 23, 407. [Google Scholar] [CrossRef]
  69. Tsavkelova, E.A.; Klimova, S.Y.; Cherdyntseva, T.A.; Netrusov, A.I. Produtores microbianos de estimuladores de crescimento de plantas e seu uso prático: Uma revisão. Appl. Biochem. Microbiol. 2006, 42, 117–126. [Google Scholar] [CrossRef]
  70. Glick, B.R. Plant growth-promoting bacteria: Mechanisms and applications. Scientifica 2012, 2012, 963401. [Google Scholar] [CrossRef]
  71. Syvash, O.O.; Zolotareva, O.K. Regulation of chlorophyll degradation in plant tissues. Biotechnol. Acta 2017, 10, 20–30. [Google Scholar] [CrossRef]
  72. Sewelam, N.; Kazan, K.; Schenk, P.M. Global plant stress signaling: Reactive oxygen species at the cross-road. Front. Plant Sci. 2016, 7, 187. [Google Scholar] [CrossRef]
  73. Gong, Z.; Duan, Y.; Liu, D.; Zong, Y.; Zhang, D.; Shi, X.; Hao, X.; Li, P. Physiological and transcriptome analysis of response of soybean (Glycine max) to cadmium stress under elevated CO2 concentration. J. Hazard. Mater. 2023, 448, 130950. [Google Scholar] [CrossRef]
  74. Zheng, G.; Chen, J.; Li, W. Impacts of CO2 elevation on the physiology and seed quality of soybean. Plant Divers. 2020, 42, 44–51. [Google Scholar] [CrossRef] [PubMed]
  75. Shabbaj, I.I.; AbdElgawad, H.; Balkhyour, M.A.; Tammar, A.; Madany, M.M. Elevated CO2 differentially mitigated oxidative stress induced by indium oxide nanoparticles in young and old leaves of C3 and C4 crops. Antioxidants 2022, 11, 308. [Google Scholar] [CrossRef] [PubMed]
  76. de Oliveira, F.K.; Da-Silva, C.J.; Garcia, N.; Agualongo, D.A.P.; de Oliveira, A.C.B.; Kanamori, N.; Takasaki, H.; Urano, K.; Shinozaki, K.; Nakashima, K.; et al. The overexpression of NCED results in waterlogging sensitivity in soybean. Plant Stress 2022, 3, 100047. [Google Scholar] [CrossRef]
  77. Khalafallah, A.A.; Abo-Ghalia, H.H. Effect of arbuscular mycorrhizal fungi on the metabolic products and activity of antioxidant system in wheat plants subjected to short-term water stress, followed by recovery at different growth stages. J. Appl. Sci. Res. 2008, 4, 559–569. [Google Scholar]
  78. Fukami, J.; Cerezini, P.; Hungria, M. Azospirillum: Benefits that go far beyond biological nitrogen fixation. AMB Express 2018, 8, 73. [Google Scholar] [CrossRef]
  79. Fukami, J.; Ollero, F.J.; Megías, M.; Hungria, M. Phytohormones and induction of plant stress tolerance and defense genes by seed and foliar inoculation with Azospirillum brasilense cells and metabolites promote maize growth. AMB Express 2017, 7, 153. [Google Scholar] [CrossRef]
  80. Lugtenberg, B.; Kamilova, F. Rizobactérias promotoras de crescimento de plantas. Annu. Rev. Microbiol. 2009, 63, 541–556. [Google Scholar] [CrossRef]
  81. Gamalero, E.; Berta, G.; Glick, B.R. The Use of Microorganisms to Facilitate the Growth of Plants in Saline Soils. In Microbial Strategies for Crop Improvement; Khan, M., Zaidi, A., Musarrat, J., Eds.; Springer: Berlin/Heidelberg, Germany, 2009. [Google Scholar] [CrossRef]
  82. Wang, C.J.; Yang, W.; Wang, C.; Gu, C.; Niu, D.D.; Liu, H.X.; Wang, Y.P.; Guo, J.H. Induction of drought tolerance in cucumber plants by a consortium of three plant growth-promoting rhizobacterium strains. PLoS ONE 2012, 7, e52565. [Google Scholar] [CrossRef]
  83. Upadhyay, S.K.; Singh, J.S.; Saxena, A.K.; Singh, D.P. Impact of PGPR inoculation on growth and antioxidant status of wheat under saline conditions. Plant Biol. 2012, 14, 605–611. [Google Scholar] [CrossRef]
  84. Zakikhani, H.; Ardakani, M.R.; Rejali, F.; Gholamhoseini, M.; Joghan, A.K.; Dolatabadian, A. Influence of diazotrophic bacteria on antioxidant enzymes and some biochemical characteristics of soybean subjected to water stress. J. Integr. Agric. 2012, 11, 1828–1835. [Google Scholar] [CrossRef]
  85. Yasmeen, T.; Ahmad, A.; Arif, M.S.; Mubin, M.; Rehman, K.; Shahzad, S.M.; Iqbal, S.; Rizwan, M.; Ali, S.; Alyemeni, M.N.; et al. Biofilm forming rhizobacteria enhance growth and salt tolerance in sunflower plants by stimulating antioxidant enzymes activity. Plant Physiol. Biochem. 2020, 156, 242–256. [Google Scholar] [CrossRef] [PubMed]
  86. Barros, F.C.; De Camargo, R.; Lana, R.M.Q.; Franco, M.H.R.; Stanger, M.C.; Pereira, V.J.; Lemes, E.M. Azospirillum brasilense and organomineral fertilizer co-inoculated with Bradyrhizobium japonicumon oxidative stress in soybean. Int. J. Recycl. Org. Waste Agric. 2022, 11, 229–245. [Google Scholar] [CrossRef]
  87. Pucciariello, C.; Boscari, A.; Tagliani, A.; Brouquisse, R.; Perata, P. Exploring legume-rhizobia symbiotic models for waterlogging tolerance. Front. Plant Sci. 2019, 10, 578. [Google Scholar] [CrossRef] [PubMed]
  88. Kim, Y.H.; Hwang, S.J.; Waqas, M.; Khan, A.L.; Lee, J.H.; Lee, J.D.; Nguyen, H.T.; Lee, I.J. Comparative analysis of endogenous hormones level in two soybean (Glycine max L.) lines differing in waterlogging tolerance. Front. Plant Sci. 2015, 6, 714. [Google Scholar] [CrossRef] [PubMed]
  89. António, C.; Päpke, C.; Rocha, M.; Diab, H.; Limami, A.M.; Obata, T.; Fernie, A.R.; van Dongen, J.T. Regulation of primary metabolism in response to low oxygen availability as revealed by carbon and nitrogen isotope redistribution. Plant Physiol. 2016, 170, 43–56. [Google Scholar] [CrossRef]
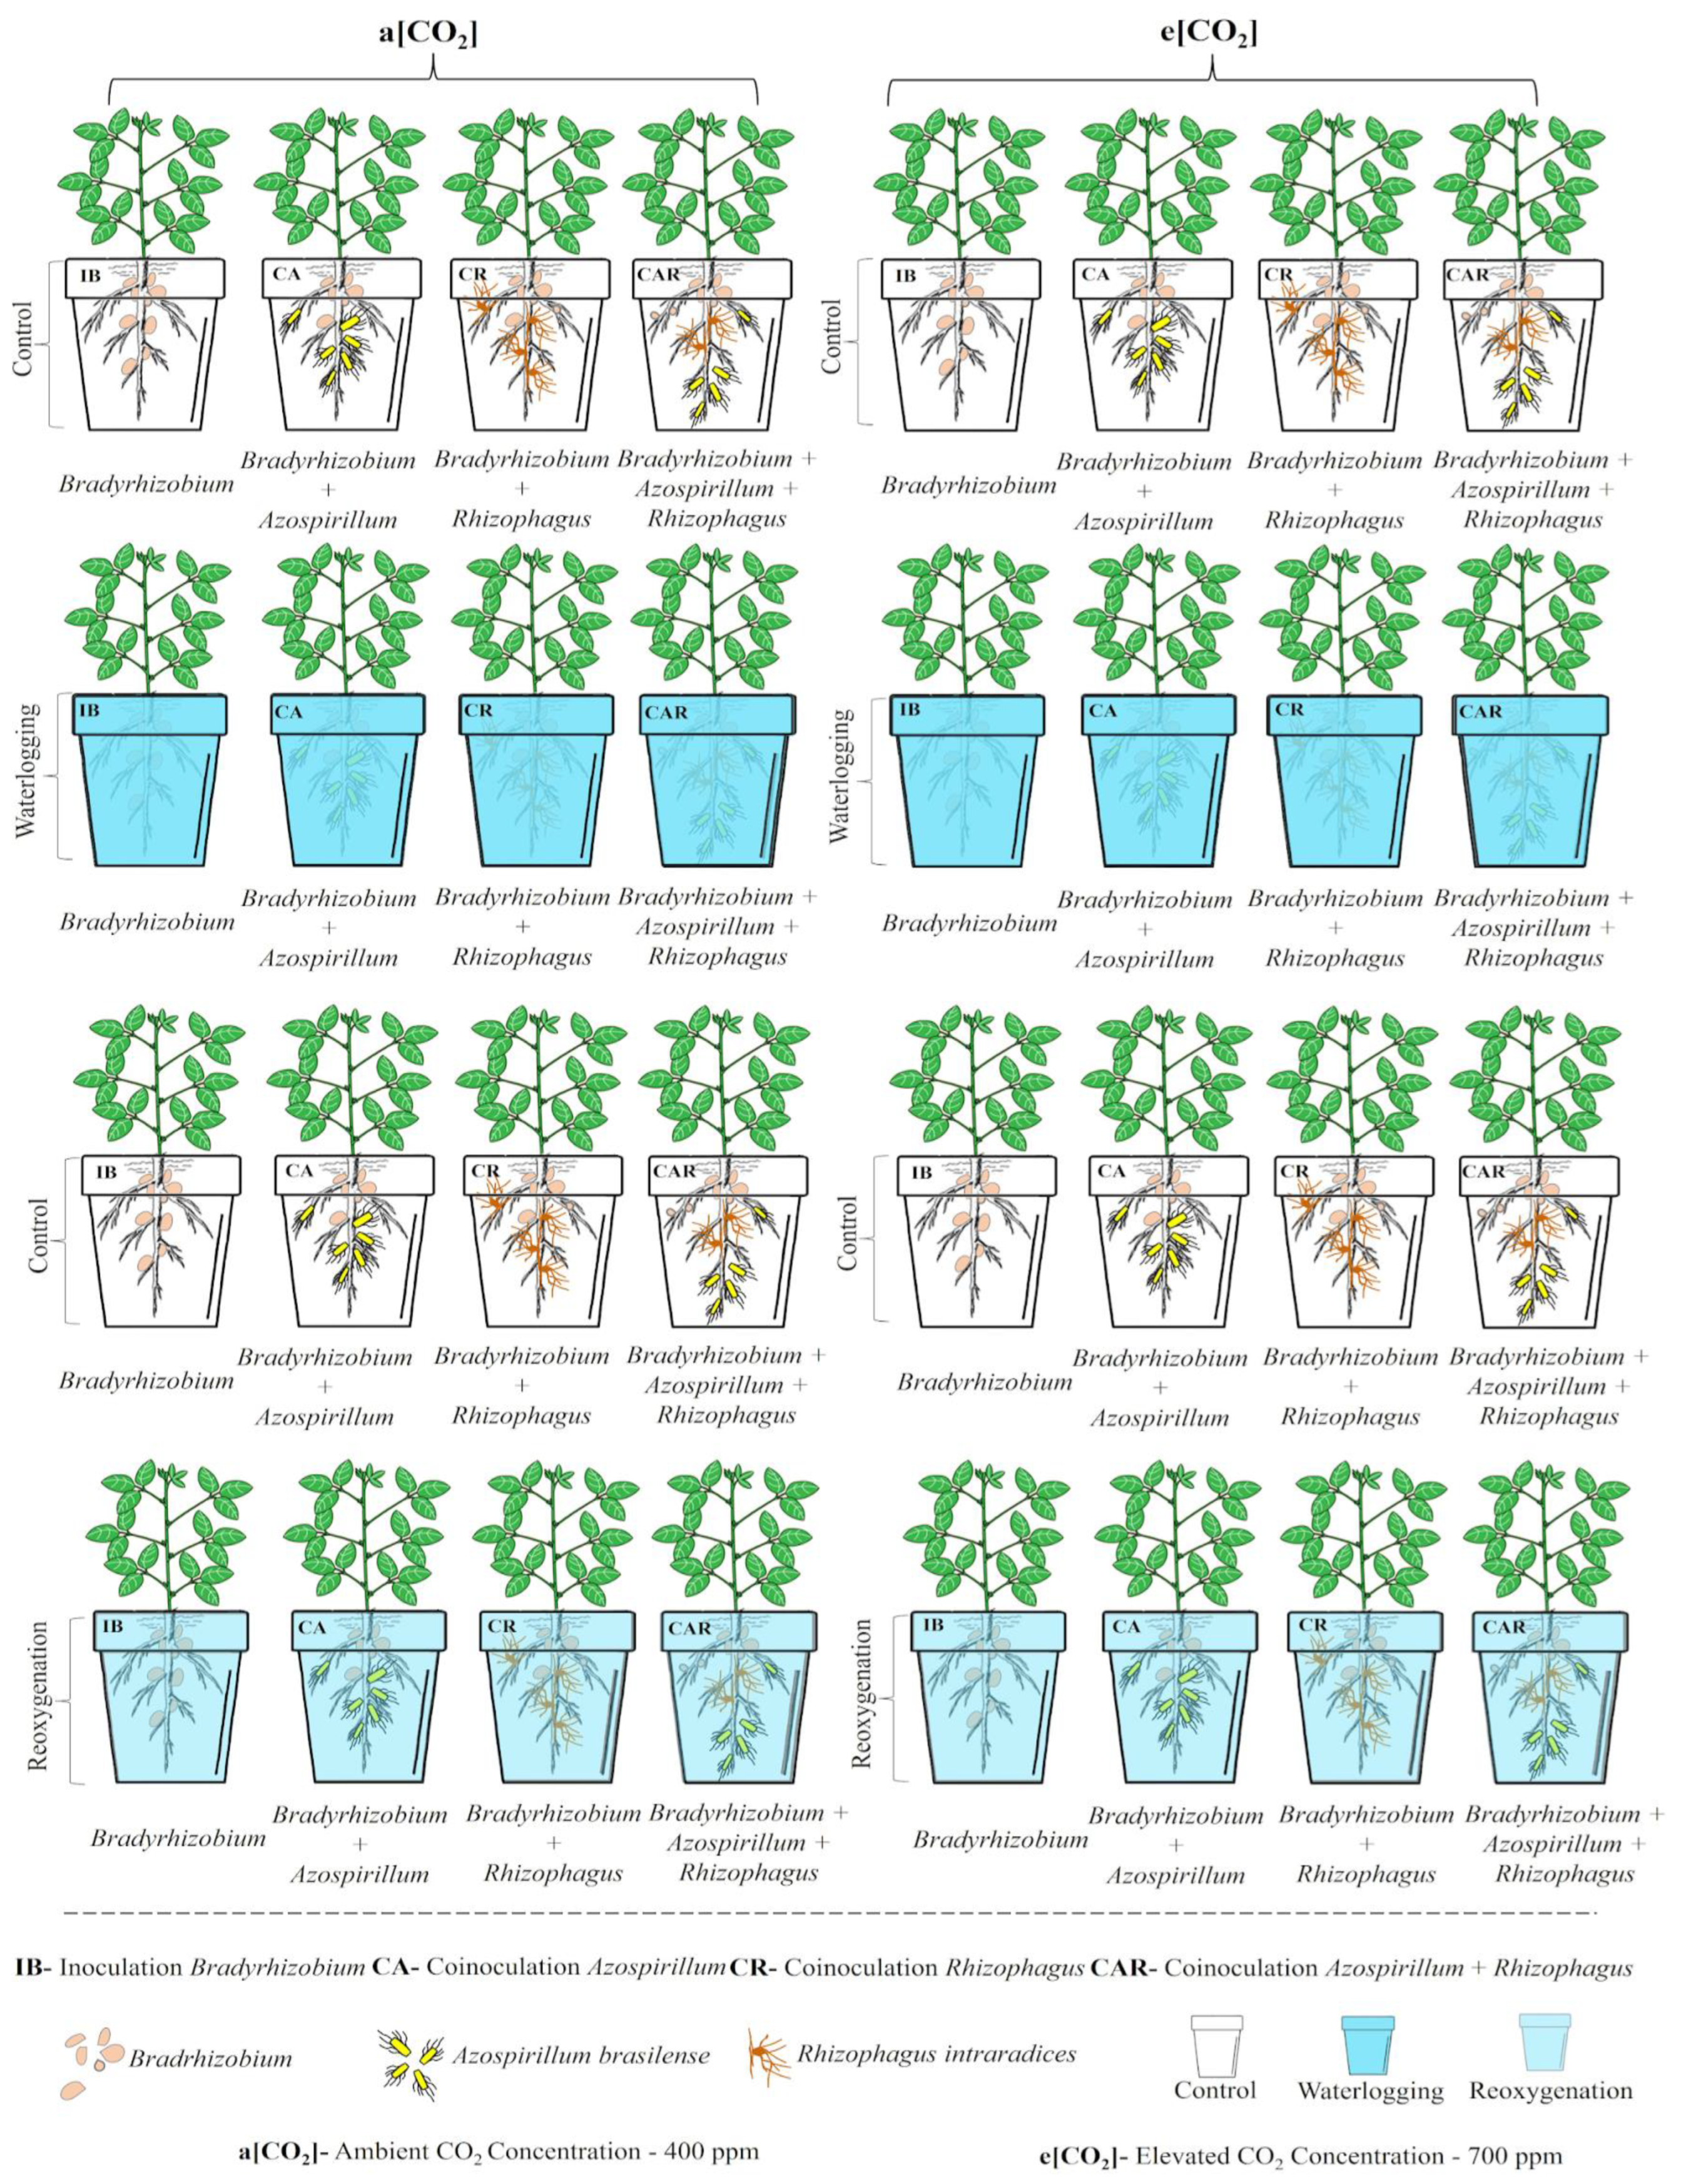
Figure 1. Schematic representation of the treatments and experimental design. Soybean plants were cultivated under different CO2 concentrations (ambient a[CO2] or elevated e[CO2]) with different symbiotic associations and subjected to waterlogging (seven days) and subsequent reoxygenation (four days). IB—Bradyrhizobium inoculation; CA—co-inoculation with Azospirillum brasilense + Bradyrhizobium; CR—co-inoculation with Rhizophagus intraradices + Bradyrhizobium; CAR—triple co-inoculation with Bradyrhizobium + Azospirillum brasilense + Rhizophagus intraradices.
Nitrogen 05 00061 g001
Figure 2. Leaf gaseous exchange. Net CO2 assimilation (A) (A), stomatal conductance (gs) (B), transpiration (E) (C), and internal CO2 concentration (Ci) (D) in soybean plants grown under different CO2 concentrations (ambient concentration a[CO2] or elevated concentration e[CO2]) with different symbiotic associations and subjected to waterlogging (seven days) followed by reoxygenation (four days). Values represent the mean ± standard deviation (SD), n = 4. Asterisks indicate a difference between control or waterlogged/reoxygenated plants (t-test; p < 0.05), uppercase letters indicate differences between treatments under control conditions, lowercase letters indicate differences between treatments under waterlogging/reoxygenated conditions (Tukey, p < 0.05), and Greek letters indicate differences between treatment in a[CO2] or e[CO2] (t-test; p < 0.05). IB—Bradyrhizobium inoculation; CA—co-inoculation with Azospirillum brasilense + Bradyrhizobium; CR—co-inoculation with Rhizophagus intraradices + Bradyrhizobium; CAR—triple inoculation with Bradyrhizobium + Azospirillum brasilense + Rhizophagus intraradices.
Nitrogen 05 00061 g002
Figure 3. Pigment content. Chlorophyll a content (Chlo_a) (A), chlorophyll b (Chlo_b) (B), total chlorophyll (Chlo-total) (C), and carotenoids (Carot) (D) in soybean plants grown under different CO2 concentrations (ambient concentration a[CO2] or elevated concentration e[CO2]) with different symbiotic associations and subjected to waterlogging (seven days) followed by reoxygenation (four days). Values represent the mean ± SD, n = 4. Asterisks indicate a difference between control or waterlogged/reoxygenated plants (t-test; p < 0.05), uppercase letters indicate differences between treatments under control conditions, lowercase letters indicate differences between treatments under waterlogging/reoxygenated conditions (Tukey, p < 0.05), and Greek letters indicate differences between treatment in a[CO2] or e[CO2] (t-test; p < 0.05). IB—Bradyrhizobium inoculation; CA—co-inoculation with Azospirillum brasilense + Bradyrhizobium; CR—co-inoculation with Rhizophagus intraradices + Bradyrhizobium; CAR—triple inoculation with Bradyrhizobium + Azospirillum brasilense + Rhizophagus intraradices.
Nitrogen 05 00061 g003
Figure 4. Peroxide content and lipid peroxidation in leaves. Accumulation of hydrogen peroxide (H2O2) (A) and lipid peroxidation (MDA) (B) in leaves of soybean plants grown under different CO2 concentrations (ambient concentration a[CO2] or elevated concentration e[CO2]) with different symbiotic associations and subjected to waterlogging (seven days) followed by reoxygenation (four days). Values represent the mean ± SD, n = 4. Asterisks indicate a difference between control or waterlogged/reoxygenated plants (t-test; p < 0.05), uppercase letters indicate differences between treatments under control conditions, lowercase letters indicate differences between treatments under waterlogging/reoxygenated conditions (Tukey, p < 0.05), and Greek letters indicate differences between treatment in a[CO2] or e[CO2] (t-test; p < 0.05). IB—Bradyrhizobium inoculation; CA—co-inoculation with Azospirillum brasilense + Bradyrhizobium; CR—co-inoculation with Rhizophagus intraradices + Bradyrhizobium; CAR—triple inoculation with Bradyrhizobium + Azospirillum brasilense + Rhizophagus intraradices.
Nitrogen 05 00061 g004
Figure 5. Peroxide content and lipid peroxidation in roots. Accumulation of hydrogen peroxide (H2O2) (A) and lipid peroxidation (MDA) (B) in roots of soybean plants grown under different CO2 concentrations (ambient concentration a[CO2] or elevated concentration e[CO2]) with different symbiotic associations and subjected to waterlogging (seven days) followed by reoxygenation (four days). Values represent the mean ± SD, n = 4. Asterisks indicate a difference between control or waterlogged/reoxygenated plants (t-test; p < 0.05), uppercase letters indicate differences between treatments under control conditions, lowercase letters indicate differences between treatments under waterlogging/reoxygenated conditions (Tukey, p < 0.05), and Greek letters indicate differences between treatment in a[CO2] or e[CO2] (t-test; p < 0.05). IB—Bradyrhizobium inoculation; CA—co-inoculation with Azospirillum brasilense + Bradyrhizobium; CR—co-inoculation with Rhizophagus intraradices + Bradyrhizobium; CAR—triple inoculation with Bradyrhizobium + Azospirillum brasilense + Rhizophagus intraradices.
Nitrogen 05 00061 g005
Figure 6. Antioxidant enzyme activity in leaves. The activity of the enzymes superoxide dismutase (SOD) (A), catalase (CAT) (B), and ascorbate peroxidase (APX) (C) in leaves of soybean plants grown under different CO2 concentrations (ambient concentration a[CO2] or elevated concentration e[CO2]) with different symbiotic associations and subjected to waterlogging (seven days) followed by reoxygenation (four days). Values represent the mean ± SD, n = 4. Asterisks indicate a difference between control or waterlogged/reoxygenated plants (t-test; p < 0.05), uppercase letters indicate differences between treatments under control conditions, lowercase letters indicate differences between treatments under waterlogging/reoxygenated conditions (Tukey, p < 0.05), and Greek letters indicate differences between treatment in a[CO2] or e[CO2] (t-test; p < 0.05). IB—Bradyrhizobium inoculation; CA—co-inoculation with Azospirillum brasilense + Bradyrhizobium; CR—co-inoculation with Rhizophagus intraradices + Bradyrhizobium; CAR—triple inoculation with Bradyrhizobium + Azospirillum brasilense + Rhizophagus intraradices.
Nitrogen 05 00061 g006
Figure 7. Antioxidant enzyme activity in roots. The activity of the enzymes superoxide dismutase (SOD) (A), catalase (CAT) (B), and ascorbate peroxidase (APX) (C) in roots of soybean plants grown under different CO2 concentrations (ambient concentration a[CO2] or elevated concentration e[CO2]) with different symbiotic associations and subjected to waterlogging (seven days) followed by reoxygenation (four days). Values represent the mean ± SD, n = 4. Asterisks indicate a difference between control or waterlogged/reoxygenated plants (t-test; p < 0.05), uppercase letters indicate differences between treatments under control conditions, lowercase letters indicate differences between treatments under waterlogging/reoxygenated conditions (Tukey, p < 0.05), and Greek letters indicate differences between treatment in a[CO2] or e[CO2] (t-test; p < 0.05). IB—Bradyrhizobium inoculation; CA—co-inoculation with Azospirillum brasilense + Bradyrhizobium; CR—co-inoculation with Rhizophagus intraradices + Bradyrhizobium; CAR—triple inoculation with Bradyrhizobium + Azospirillum brasilense + Rhizophagus intraradices.
Nitrogen 05 00061 g007
Figure 8. Fermentative enzyme activity. Activity of the enzymes lactate dehydrogenase (LDH) (A), pyruvate decarboxylase (PDC) (B), alcohol dehydrogenase (ADH) (C), and alanine aminotransferase (Ala-At) (D) in roots of soybean plants grown under different CO2 concentrations (ambient concentration a[CO2] or elevated concentration e[CO2]) with different symbiotic associations and subjected to waterlogging (seven days) followed by reoxygenation (four days). Values represent the mean ± SD, n = 4. Asterisks indicate a difference between control or waterlogged/reoxygenated plants (t-test; p < 0.05), uppercase letters indicate differences between treatments under control conditions, lowercase letters indicate differences between treatments under waterlogging/reoxygenated conditions (Tukey, p < 0.05), and Greek letters indicate differences between treatment in a[CO2] or e[CO2] (t-test; p < 0.05). IB—Bradyrhizobium inoculation; CA—co-inoculation with Azospirillum brasilense + Bradyrhizobium; CR—co-inoculation with Rhizophagus intraradices + Bradyrhizobium; CAR—triple inoculation with Bradyrhizobium + Azospirillum brasilense + Rhizophagus intraradices.
Nitrogen 05 00061 g008
Figure 9. Shoot biometric parameters. Leaf area (LA) (A), shoot dry mass (SDM) (B), and stem diameter (SD) (C) in soybean plants grown under different CO2 concentrations (ambient concentration a[CO2] or elevated concentration e[CO2]) with different symbiotic associations and subjected to waterlogging (seven days) followed by reoxygenation (four days). Values represent the mean ± SD, n = 4. Asterisks indicate a difference between control or waterlogged/reoxygenated plants (t-test; p < 0.05), uppercase letters indicate differences between treatments under control conditions, lowercase letters indicate differences between treatments under waterlogging/reoxygenated conditions (Tukey, p < 0.05), and Greek letters indicate differences between treatment in a[CO2] or e[CO2] (t-test; p < 0.05). IB—Bradyrhizobium inoculation; CA—co-inoculation with Azospirillum brasilense + Bradyrhizobium; CR—co-inoculation with Rhizophagus intraradices + Bradyrhizobium; CAR—triple inoculation with Bradyrhizobium + Azospirillum brasilense + Rhizophagus intraradices.
Nitrogen 05 00061 g009
Figure 10. Root biometric parameters. Accumulation of total soluble sugars (TSS) (A) and root fresh mass (RFM) (B) in roots of soybean plants grown under different CO2 concentrations (ambient concentration a[CO2] or elevated concentration e[CO2]) with different symbiotic associations and subjected to waterlogging (seven days) followed by reoxygenation (four days). Values represent the mean ± SD, n = 4. Asterisks indicate a difference between control or waterlogged/reoxygenated plants (t-test; p < 0.05), uppercase letters indicate differences between treatments under control conditions, lowercase letters indicate differences between treatments under waterlogging/reoxygenated conditions (Tukey, p < 0.05), and Greek letters indicate differences between treatment in a[CO2] or e[CO2] (t-test; p < 0.05). IB—Bradyrhizobium inoculation; CA—co-inoculation with Azospirillum brasilense + Bradyrhizobium; CR—co-inoculation with Rhizophagus intraradices + Bradyrhizobium; CAR—triple inoculation with Bradyrhizobium + Azospirillum brasilense + Rhizophagus intraradices.
Nitrogen 05 00061 g010
Figure 11. Principal component analysis (PCA) was performed using PC1 and PC2 derived from morphophysiological and biochemical characteristics in the shoots of soybean plants grown under different symbiotic associations and subjected to waterlogging for seven days, followed by four days of reoxygenation, under either elevated CO2 (e[CO2]) or ambient CO2 (a[CO2]) conditions. I—first sampling during waterlogging; II—second sampling during reoxygenation; 400—plants grown under a[CO2]; 700—plants grown under e[CO2]; Ctrl—plants maintained as hydric controls; Wtlg—plants subjected to waterlogging; Rox—plants undergoing reoxygenation; IB—Bradyrhizobium inoculation; CA—co-inoculation of Azospirillum brasilense and Bradyrhizobium; CR—co-inoculation of Rhizophagus intraradices and Bradyrhizobium; CAR—triple co-inoculation of Bradyrhizobium, Azospirillum brasilense, and Rhizophagus intraradices. Ellipses of different colors delineate the 95% confidence intervals, with colors chosen according to the water treatment in each CO2 environment. Different symbols represent the microbiological treatments.
Nitrogen 05 00061 g011
Figure 12. Principal component analysis (PCA) was performed using PC1 and PC2 derived from morphophysiological and biochemical characteristics in the roots of soybean plants grown under different symbiotic associations and subjected to waterlogging for seven days, followed by four days of reoxygenation, under either elevated CO2 (e[CO2]) or ambient CO2 (a[CO2]) conditions. I—first sampling during waterlogging; II—second sampling during reoxygenation; 400—plants grown under a[CO2]; 700—plants grown under e[CO2]; Ctrl—plants maintained as hydric controls; Wtlg—plants subjected to waterlogging; Rox—plants undergoing reoxygenation; IB—Bradyrhizobium inoculation; CA—co-inoculation of Azospirillum brasilense and Bradyrhizobium; CR—co-inoculation of Rhizophagus intraradices and Bradyrhizobium; CAR—triple co-inoculation of Bradyrhizobium, Azospirillum brasilense, and Rhizophagus intraradices. Ellipses of different colors delineate the 95% confidence intervals, with colors chosen according to the water treatment in each CO2 environment. Different symbols represent the microbiological treatments.
Nitrogen 05 00061 g012
Figure 13. Hierarchical clustering analysis (HCA) of H2O2, MDA, Chlo_a, Chlo_b, SOD, CAT, and APX enzyme activities, gas exchange parameters (gs, E, A, and Ci), and biometric measurements (LA, SD, SDW) in the shoots of waterlogged soybean plants grown under elevated CO2 (e[CO2]) or ambient CO2 (a[CO2]) conditions. Variations in red and blue colors indicate increases and decreases, respectively, for each variable. Light gray shades represent control plants grown under a[CO2], while dark gray shades represent waterlogged plants grown under a[CO2]. Red shades indicate control plants grown under e[CO2], and blue shades represent waterlogged plants grown under e[CO2].
Nitrogen 05 00061 g013
Figure 14. Hierarchical clustering analysis (HCA) of H2O2, MDA, Chlo_a, Chlo_b, SOD, CAT, and APX enzyme activities, gas exchange parameters (gs, E, A, and Ci), and biometric measurements (LA, SD, SDW) in the shoots of reoxygenated soybean plants grown under elevated CO2 (e[CO2]) or ambient CO2 (a[CO2]) conditions. Variations in red and blue colors indicate increases and decreases, respectively, for each variable. Light gray shades represent control plants grown under a[CO2], while dark gray shades represent waterlogged plants grown under a[CO2]. Red shades indicate control plants grown under e[CO2], and blue shades represent waterlogged plants grown under e[CO2].
Nitrogen 05 00061 g014
Figure 15. Hierarchical clustering analysis (HCA) of H2O2, MDA, TSS, SOD, CAT, APX, ADH, LDH, PDC, and Ala-AT enzyme activities, as well as RFW in the roots of waterlogged soybean plants grown under elevated CO2 (e[CO2]) or ambient CO2 (a[CO2]) conditions. Variations plotted in red and blue colors on a log10 scale indicate increases and decreases, respectively, for each variable. Light gray shades represent control plants grown under a[CO2], while dark gray shades denote waterlogged plants grown under a[CO2]. Red shades indicate control plants grown under e[CO2], and blue shades represent waterlogged plants grown under e[CO2].
Nitrogen 05 00061 g015
Figure 16. Hierarchical clustering analysis (HCA) of H2O2, MDA, TSS, SOD, CAT, APX, ADH, LDH, PDC, and Ala-AT enzyme activities, as well as RFW in the roots of reoxygenated soybean plants grown under elevated CO2 (e[CO2]) or ambient CO2 (a[CO2]) conditions. Variations plotted in red and blue colors on a log10 scale indicate increases and decreases, respectively, for each variable. Light gray shades represent control plants grown under a[CO2], while dark gray shades denote waterlogged plants grown under a[CO2]. Red shades indicate control plants grown under e[CO2], and blue shades represent waterlogged plants grown under e[CO2].
Nitrogen 05 00061 g016
Table 1. Seed inoculation and co-inoculation treatments information.
TreatmentAbbreviationMicroorganisms *
Bradyrhizobium elkanii SEMIA 5019 and Bradyrhizobium Japonicum SEMIA 5079Azospirillum brasilense Strains Ab-V5 and Ab-V6Rhizophagus intraradices ROOTELLA BR® (Joinville, SC, Brazil)
Bradyrhizobium InoculationIB4 mL seeds kg−1
with 5 × 10⁹ CFU mL−1
--
Co-inoculation Bradyrhizobium + AzospirillumCA4 mL seeds kg−1
with 5 × 10⁹ CFU mL−1
2 mL seeds kg−1
with 2 × 10⁸ CFU mL−1
-
Co-Inoculation Bradyrhizobium + RhizophagusCR4 mL seeds kg−1
with 5 × 10⁹ CFU mL−1
-1.35 g seeds kg−1
with 20,800 propagules g−1
Co-Inoculation Bradyrhizobium + Azospirillum + RhizophagusCAR4 mL seeds kg−1
with 5 × 10⁹ CFU mL−1
2 mL seeds kg−1
with 2 × 10⁸ CFU mL−1
1.35 g seeds kg−1
with 20,800 propagules g−1
* All microorganism doses were applied as recommended to avoid competition between them. CFU: colony forming unit.
Disclaimer/Publisher’s Note: The statements, opinions and data contained in all publications are solely those of the individual author(s) and contributor(s) and not of MDPI and/or the editor(s). MDPI and/or the editor(s) disclaim responsibility for any injury to people or property resulting from any ideas, methods, instructions or products referred to in the content.