Article

New Nitrogen Use Efficiency Indices for Biomass Formation and Productivity in Green Beans Under Foliar Fertilization with Molybdenum Nanofertilizer

by
Ezequiel Muñoz-Márquez
1,
Juan Manuel Soto-Parra
2,
Ramona Pérez-Leal
1 and
Esteban Sanchez
1,*
1
Research Center in Food & Development A. C., Delicias 33089, Chihuahua, Mexico
2
School of Agrotechnological Sciences, Universidad Autónoma de Chihuahua, Chihuahua 31000, Chihuahua, Mexico
*
Author to whom correspondence should be addressed.
Nitrogen 2024, 5(3), 667-687; https://doi.org/10.3390/nitrogen5030044
Submission received: 2 July 2024 / Revised: 26 July 2024 / Accepted: 29 July 2024 / Published: 5 August 2024

Abstract

:
Most crops are fertilized with high amounts of nitrogen, and have an alarmingly low utilization efficiency. For this reason, the coordination between the fertilizer contribution and the nitrogen requirements of the crop is very important. Therefore, the objective of the present study was to establish new indices to determine nitrogen use efficiency (NUE), and to define the amount of assimilated nitrogen, which is used for the formation of green bean plant organs, fertilized with molybdenum nanofertilizer applied foliarly, and combined with edaphic fertilization of ammonium nitrate. The plants were grown in a greenhouse covered with anti-aphid mesh and irrigated with nutrient solution. Three sources of foliar molybdenum (Nanofertilizer, molybdenum Chelate and Sodium Molybdate) were applied in four doses of 0, 5, 10 and 20 ppm Mo, complemented with edaphic fertilization of NH4NO3 (0, 3, 6 and 12 mM of N). As results, the NUE indices showed that with the application of the nanofertilizer, the total biomass production increased 41.65% more than with the application of the chelate, and 36.84% more than with the application of molybdate. In summary, the dose that presented the highest efficiency was 6 mM-N with 10 ppm-Mo. Finally, it is concluded that the use of NUE indices is an important approach that evaluates the fate of nitrogen and accurately estimates plant yield.

1. Introduction

Nowadays, the role of nitrogen (N) for the growth, development and productivity of crops is essential. This essential macroelement has a direct effect on the production of biomass and dry weight of plants, by influencing, in addition to many other physiological processes, the efficiency of the photosynthetic system of the leaves. In this way, a strong photosynthetic system allows optimal development; in contrast, a limited or stunted photosynthetic system results in low photosynthetic efficiency, causing rickets and plant death [1,2].
Particularly, beans are associated with Rhizobium, which has the capacity to fix atmospheric nitrogen. However, this N-fixing capacity is not sufficient to meet the demand for high yields, which are necessary to satisfy the feeding needs of the population [3]. For this purpose, nitrogen fertilization is required; this widely studied agronomic practice is determinant to increase yield [4].
For this reason, it is essential to improve nitrogen use efficiency (NUE) within crop agronomic management programs. The increase in NUE through agronomic management practices, and with the use of high-performance technologies, manages to reduce intensive applications of nitrogen, increase its use and reduce environmental pollution caused by nitrogen fertilizers. [5]. In parallel, it must be considered that N is a key component of living cells, and that nitrogen fertilizer is the second largest requirement after water in crop production [6]. For this reason, the relationship between the applied N and its absorption and fixation efficiency must be high, and not inefficient or on a scale higher than the plant’s requirements [7].
It is then evident that the elements that are key for nitrogen fixation must also be taken into account. In this sense, molybdenum (Mo) stands out for being an essential microelement that plays a fundamental role in N metabolism, and that regulates and optimizes the activities and expressions of the enzymes responsible for N assimilation. In addition, it participates in different biosyntheses responsible for the normal functioning of plant growth and development processes [8].
To enhance the effect of Mo, its application must be foliar and can be effectively combined with the use of nanotechnology; in this way, a nanofertilizer is created capable of penetrating plant tissues and intelligently releasing the active ingredient (Mo), so that it is fully available to the plant [9]. The harmony of these tools aligns agricultural systems with global needs to protect natural resources [5]. Therefore, the objective of the present study was to establish new indices to determine nitrogen use efficiency (NUE), and to define the amount of assimilated nitrogen, which is used for the formation of green bean plant organs, fertilized with molybdenum nanofertilizer applied foliarly, and combined with edaphic fertilization of ammonium nitrate.

2. Materials and Methods

2.1. Location and Growth Conditions

The crop was grown in an experimental greenhouse located in Lázaro Cárdenas, Meoqui, Chihuahua, Mexico. The research started on 2 September 2020, and the plants were harvested on 3 November 2020. Seeds of ejotero bean cv. Strike, a short-cycle variety, which reaches physiological maturity after 60 days, were germinated. The plants were transplanted 12 days after germination; polyethylene bags were used and filled with vermiculite and perlite (2:1). Two plants were planted in each bag, and a complete nutrient solution was applied for 20 days [10] as proposed by [11] after germination. After that time, differentiated nitrogen treatments were applied every third day until harvest. Foliar molybdenum treatments were applied every seven days from the appearance of true leaves.

2.2. Experimental Design and Treatments

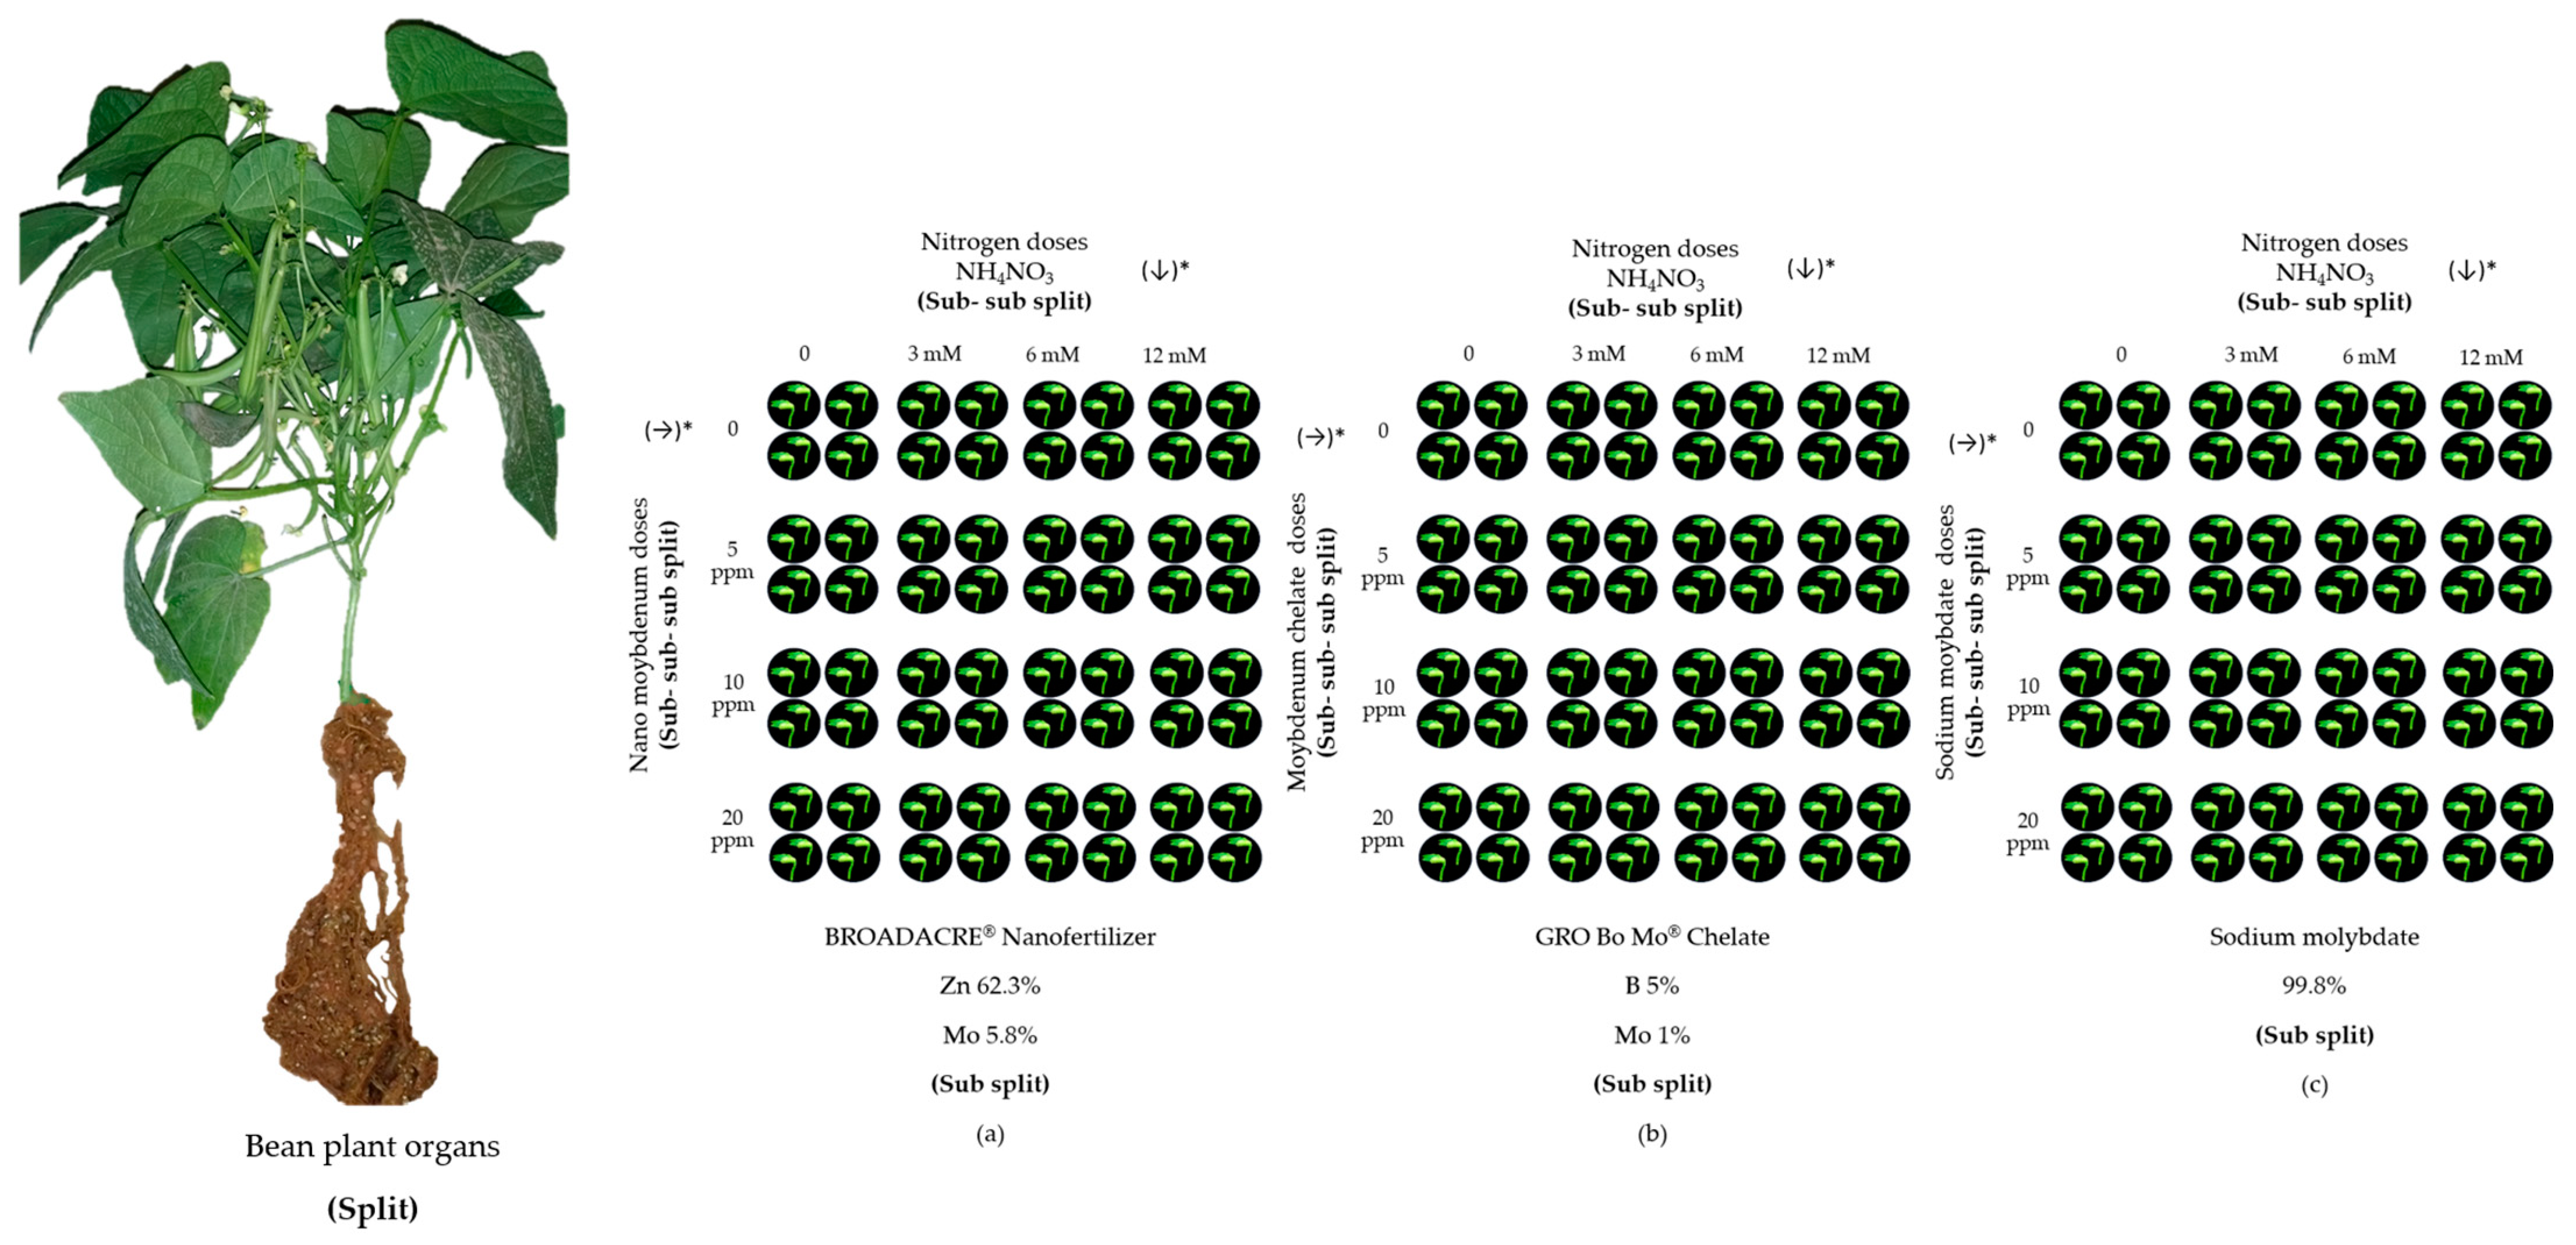
The experimental design was a completely randomized split-plot arrangement with four replications. Plots were considered as plant organs: leaves, stems, fruits and roots; molybdenum sources represented the subplots (BROADACRE® Zn Mo Nanofertilizer, Agrichem de Mexico, Mazatlan, Sinaloa, Mexico), GRO Bo Mo® Che-late (Fertilizados Tepeyac, Delicias, Chihuahua, Mexico) and Sodium Molybdate (J. T. Baker, Estado de Mexico, Mexico). T. Baker, Estado de Mexico, Mexico); nitrogen doses as ammonium nitrate (NH4NO3): 0, 3, 6 and 12 mM represented the sub-sub plots, and molybdenum doses: 0, 5, 10 and 20 ppm represented the sub-sub plots (Figure 1). From day 21 after germination, foliar applications of molybdenum sources were made. And from day 22 after germination, the nutrient solution differentiated in nitrogen was applied. The additive linear model was the following:
Υijklm = μ + θi + εim + Ωj + (θΩ)ij + λijm + βk + (θβ)ik + (Ωβ)jk + (θΩβ)ijk + Zijkm + Σl + (θΣ)ij + (ΩΣ)jl + (βΣ)kl + (θΩβΣ)ijkl + Ψijkl
where
  • i = Bean plant organs (Split)
  • j = Molybdenum Source (Sub-split)
  • k = Nitrogen doses (Sub-sub-split)
  • l = Molybdenum doses (Sub-sub-sub-split)
  • m = Repetition
Figure 1. Experimental design. Soil nitrogen fertilization supplemented with foliar molybdenum fertilization in green beans cv. Strike. The figure shows how the experiment was laid out inside the greenhouse. The organs of the plant were considered as Split: leaves, stems, fruits and roots. (ac) molybdenum source: (a) Sub-split where nanofertilizer was applied, (b) Sub-split where chelate was applied, (c) Sub-split where sodium molybdate was applied. (↓)* Direction of application in columns of nitrogen doses (Sub-sub split); (→)* Direction of application in rows of molybdenum doses (Sub-sub-sub split).
Nitrogen 05 00044 g001

2.3. Plant Analysis

2.3.1. Total Biomass

The samples were washed with tridistilled water, drained on paper towels, and dried at 70 °C (Felisa® Oven St. Livonia, MI, USA) for 24 h. The total biomass was calculated based on the dry weight of the plant material, and the result was expressed in grams (g plant−1) [12].

2.3.2. Total Yield

It was obtained based on the fresh weight of the fruits. Green beans were harvested and weighed at the time of sampling (Analytical Balance, Precision Electronic Balance AND Company Limited, Milpitas, CA, USA). The total yield was expressed in grams per plant (g plant−1) [12].

2.3.3. Total Nitrogen Content

The total nitrogen content was quantified in the Flash 2000 Organic Elemental Analyzer (Thermo Scientific® Corporation, Cambridge, UK), which is based on the method initially described by Jean-Baptiste Dumas [13]. The concentration of total organic nitrogen was expressed as a percentage (%).

2.4. Efficiency Indices of Absorption, Distribution and Utilization of Nitrogen for the Formation of Plant Biomass

The indices are the following:
  • Total weight (TW)
Refers to the total weight of the plant biomass.
T W = W l + W s + W f + W r = g
where Wl is the total weight of the leaves (g), Ws is the total weight of the stems (g), Wf is the total weight of the fruit (g), Wr is the total weight of the root (g). The result was expressed in grams (g).
  • Relative physiological contribution (RPC).
It refers to what each organ represents in the total weight of the plant, in percentage (%).
R P C = W h W l + W s + W f + W r 100 = %
where Wh is the total weight of the leaves (g), Ws is the total weight of the stems (g), Wf is the total weight of the fruit (g), Wr is the total weight of the root (g), between 100. The result was expressed as a percentage (%).
  • Physiological nitrogen requirement (PNRmg).
It refers to the milligrams of nitrogen necessary to form each organ of the plant.
P N R m g = C O N 100 P O 1000
where CON is the nitrogen concentration of the plant organ (leaf, stem, fruit or root), PO is the weight of the plant organ, all multiplied by 10,000. The result was expressed in milligrams (mg).
  • Relative nitrogen contribution (RNC%).
It refers to the amount of nitrogen in percentage (%) to form each organ of the plant.
R C N % = m g N O m g N l + m g N s + m g N f + m g N r 10000
where mgNO are the milligrams of nitrogen necessary to form the plant organ, mgNl are the milligrams of nitrogen necessary to form the leaves, mgNs are the milligrams of nitrogen necessary to form the stems, mgNf are the milligrams of nitrogen necessary to form the fruits, mgNr are the milligrams of nitrogen necessary to form the root, all multiplied by 10,000. The result was expressed as a percentage (%).
  • Nitrogen fixation efficiency (NFiE).
It refers to efficiency as the maximum yield produced per unit of nitrogen used by the plant for the production of biomass.
N F i E = P l N T l 1000 = %
where Pl is the dry weight of the leaf, TNl is the total accumulation of nitrogen in the leaf, divided by 1000. The result was expressed as a percentage (%).
  • Nitrogen conduction (translocation) efficiency (NCoE).
Refers to the efficiency of nitrogen translocation for biomass production.
N C o E = P s N T s 1000 = %
where Ps is the dry weight of the stem, NTs is the total accumulation of nitrogen in the stems, divided by 1000. The result was expressed as a percentage (%).
  • Nitrogen absorption efficiency (NAbE).
Refers to the efficiency of nitrogen absorption for biomass production.
N A b E = P r N T r 1000 = %
where Pr is the dry weight of the root, NTr is the total accumulation of nitrogen in the root, divided by 1000. The result was expressed as a percentage (%).
  • Productivity.
It refers to efficiency as the maximum yield produced per unit of nitrogen used by the plant for fruit production.
P r o d u c t i v i t y = N u m b e r   o f   f r u i t s T N A = F r u i t s m g N
where Number of fruits is the number of fruits produced per plant, and TNA is the total nitrogen accumulation. The result was expressed in number of fruits per milligrams of nitrogen. (Fruits mg-N).

2.5. Statistical Analysis

The data obtained were subjected to an analysis of variance based on the proposed additive linear model; the probabilities of impact were Pr > 0.05 not significant, 0.05 ≤ Pr ≤ 0.01 significant, Pr < 0.01 highly significant; the multiple range test was obtained. Tukey test (α 0.05) to separate the treatment means within each factor (division, subdivision and sub-subdivision); subsequently, a response surface analysis of the split x sub-split interaction was carried out for the split cell factor with greater statistical relevance [14].
The response surface analysis included the following steps: (1) model adjustment and analysis of variance to estimate the parameters. The estimated surface will typically be curved, a hill whose peak occurs at the single estimated point of maximum response, a valley, or a saddle-shaped surface with no maximum or minimum; it is determined model adjustment and analysis of variance to estimate the parameters if the types of effects are linear, quadratic or cross products, what part of the residual error is due to the lack of fit and what is the contribution of each factor in the statistical fit; (2) canonical correlation to investigate the shape of the predicted response surface, calculating whether the fixed point is a maximum, a minimum or a saddle point and which factor or factors are the most sensitive predicted responses and (3) ridge analysis for the search for the optimal response. The eigenvalues and eigenvectors of the canonical analysis characterize the shape of the response surface; the eigenvalues indicate the direction of the primary orientation of the surface, and the signs and magnitudes of the associated eigenvectors give the shape of the surface in those directions. Positive eigenvalues indicate upward curvature directions and negative eigenvalues indicate downward curvature directions. The eigenvector for the largest eigenvalue gives the direction of the steep rise from the fixed point, if positive, or the steep fall, if negative. Eigenvectors corresponding to small or zero eigenvalues indicate directions of relative flattening. To determine whether the solution is a maximum or a minimum, we observe the sign of the eigenvalues: if the eigenvalues are all negative, the solution is a maximum; if they are all positive, the solution is a minimum; if they have mixed signs, the solution is a saddle point; and if they contain zeros, the solution is a flattened area [15].
The SigmaPlot 14.0 program was used to obtain the graphs with the results predicted by the SAS program. The graphs are for those variables that were significant, whether in linear regression, quadratic regression or factor interaction.

3. Results

3.1. Effect of Nitrogen Fertilization Supplemented with Molybdenum Foliar Nanofertilizer on NUE Indices for Biomass Formation

3.1.1. NUE Indices in Leaves

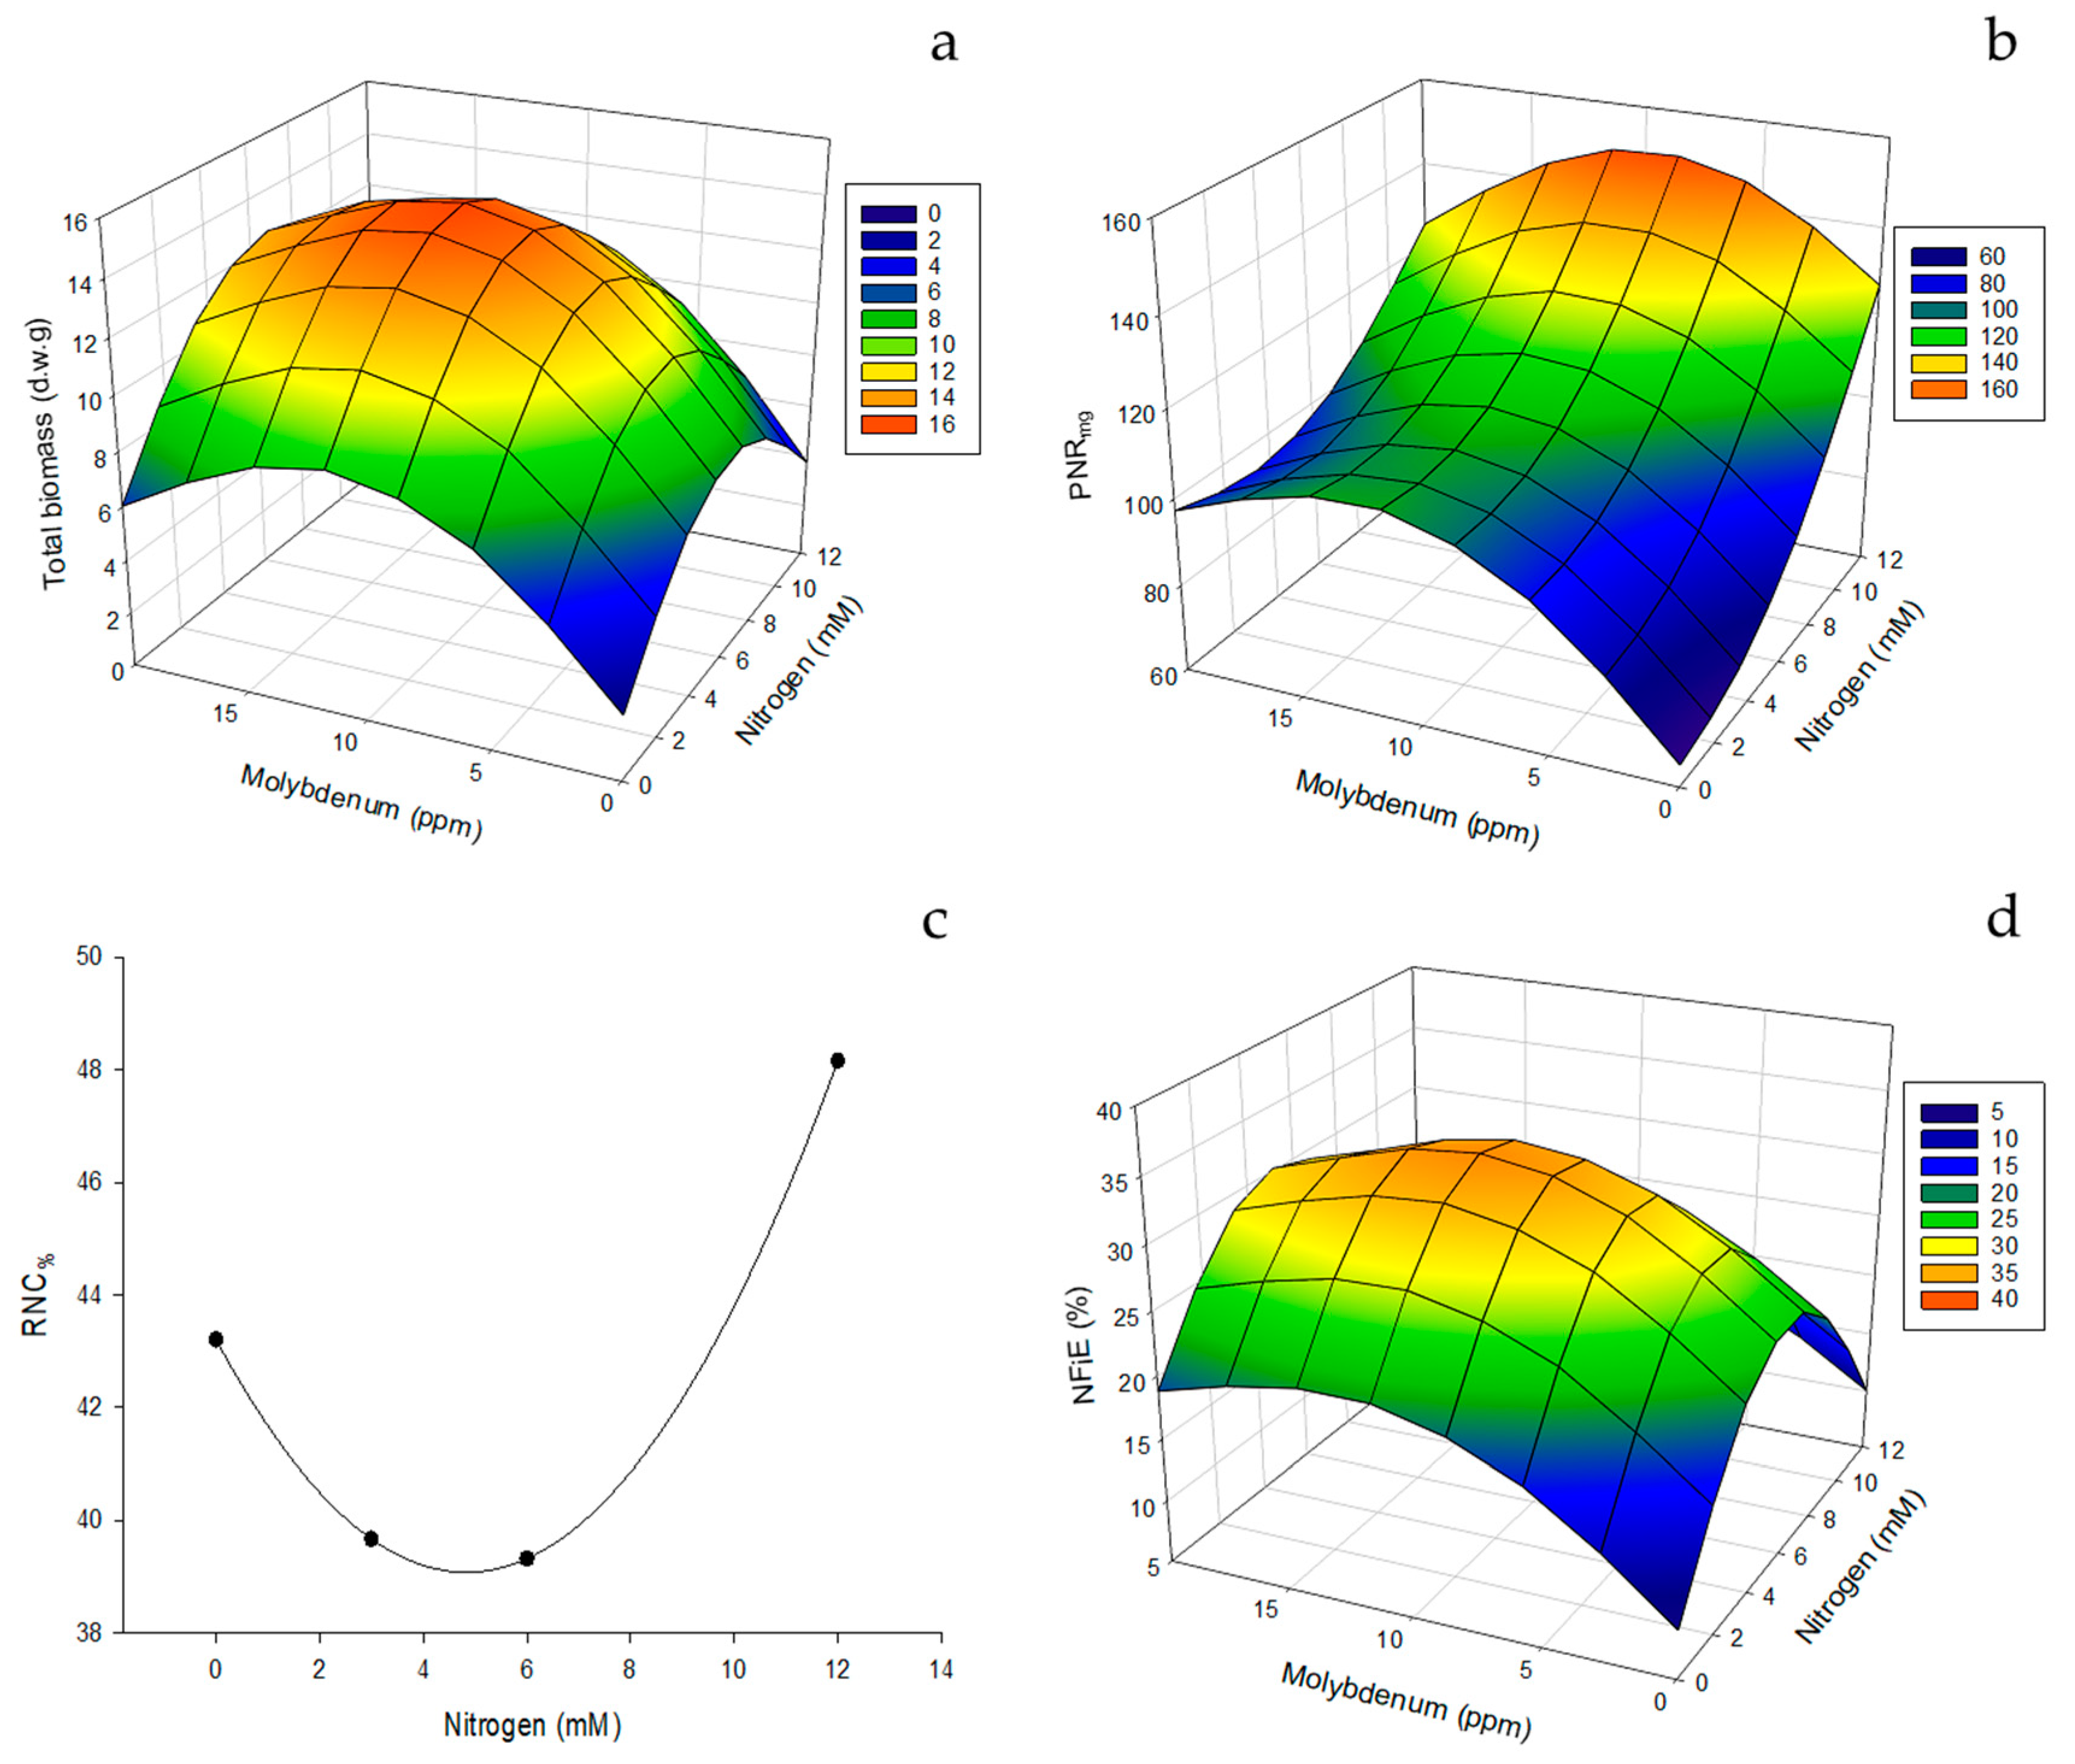
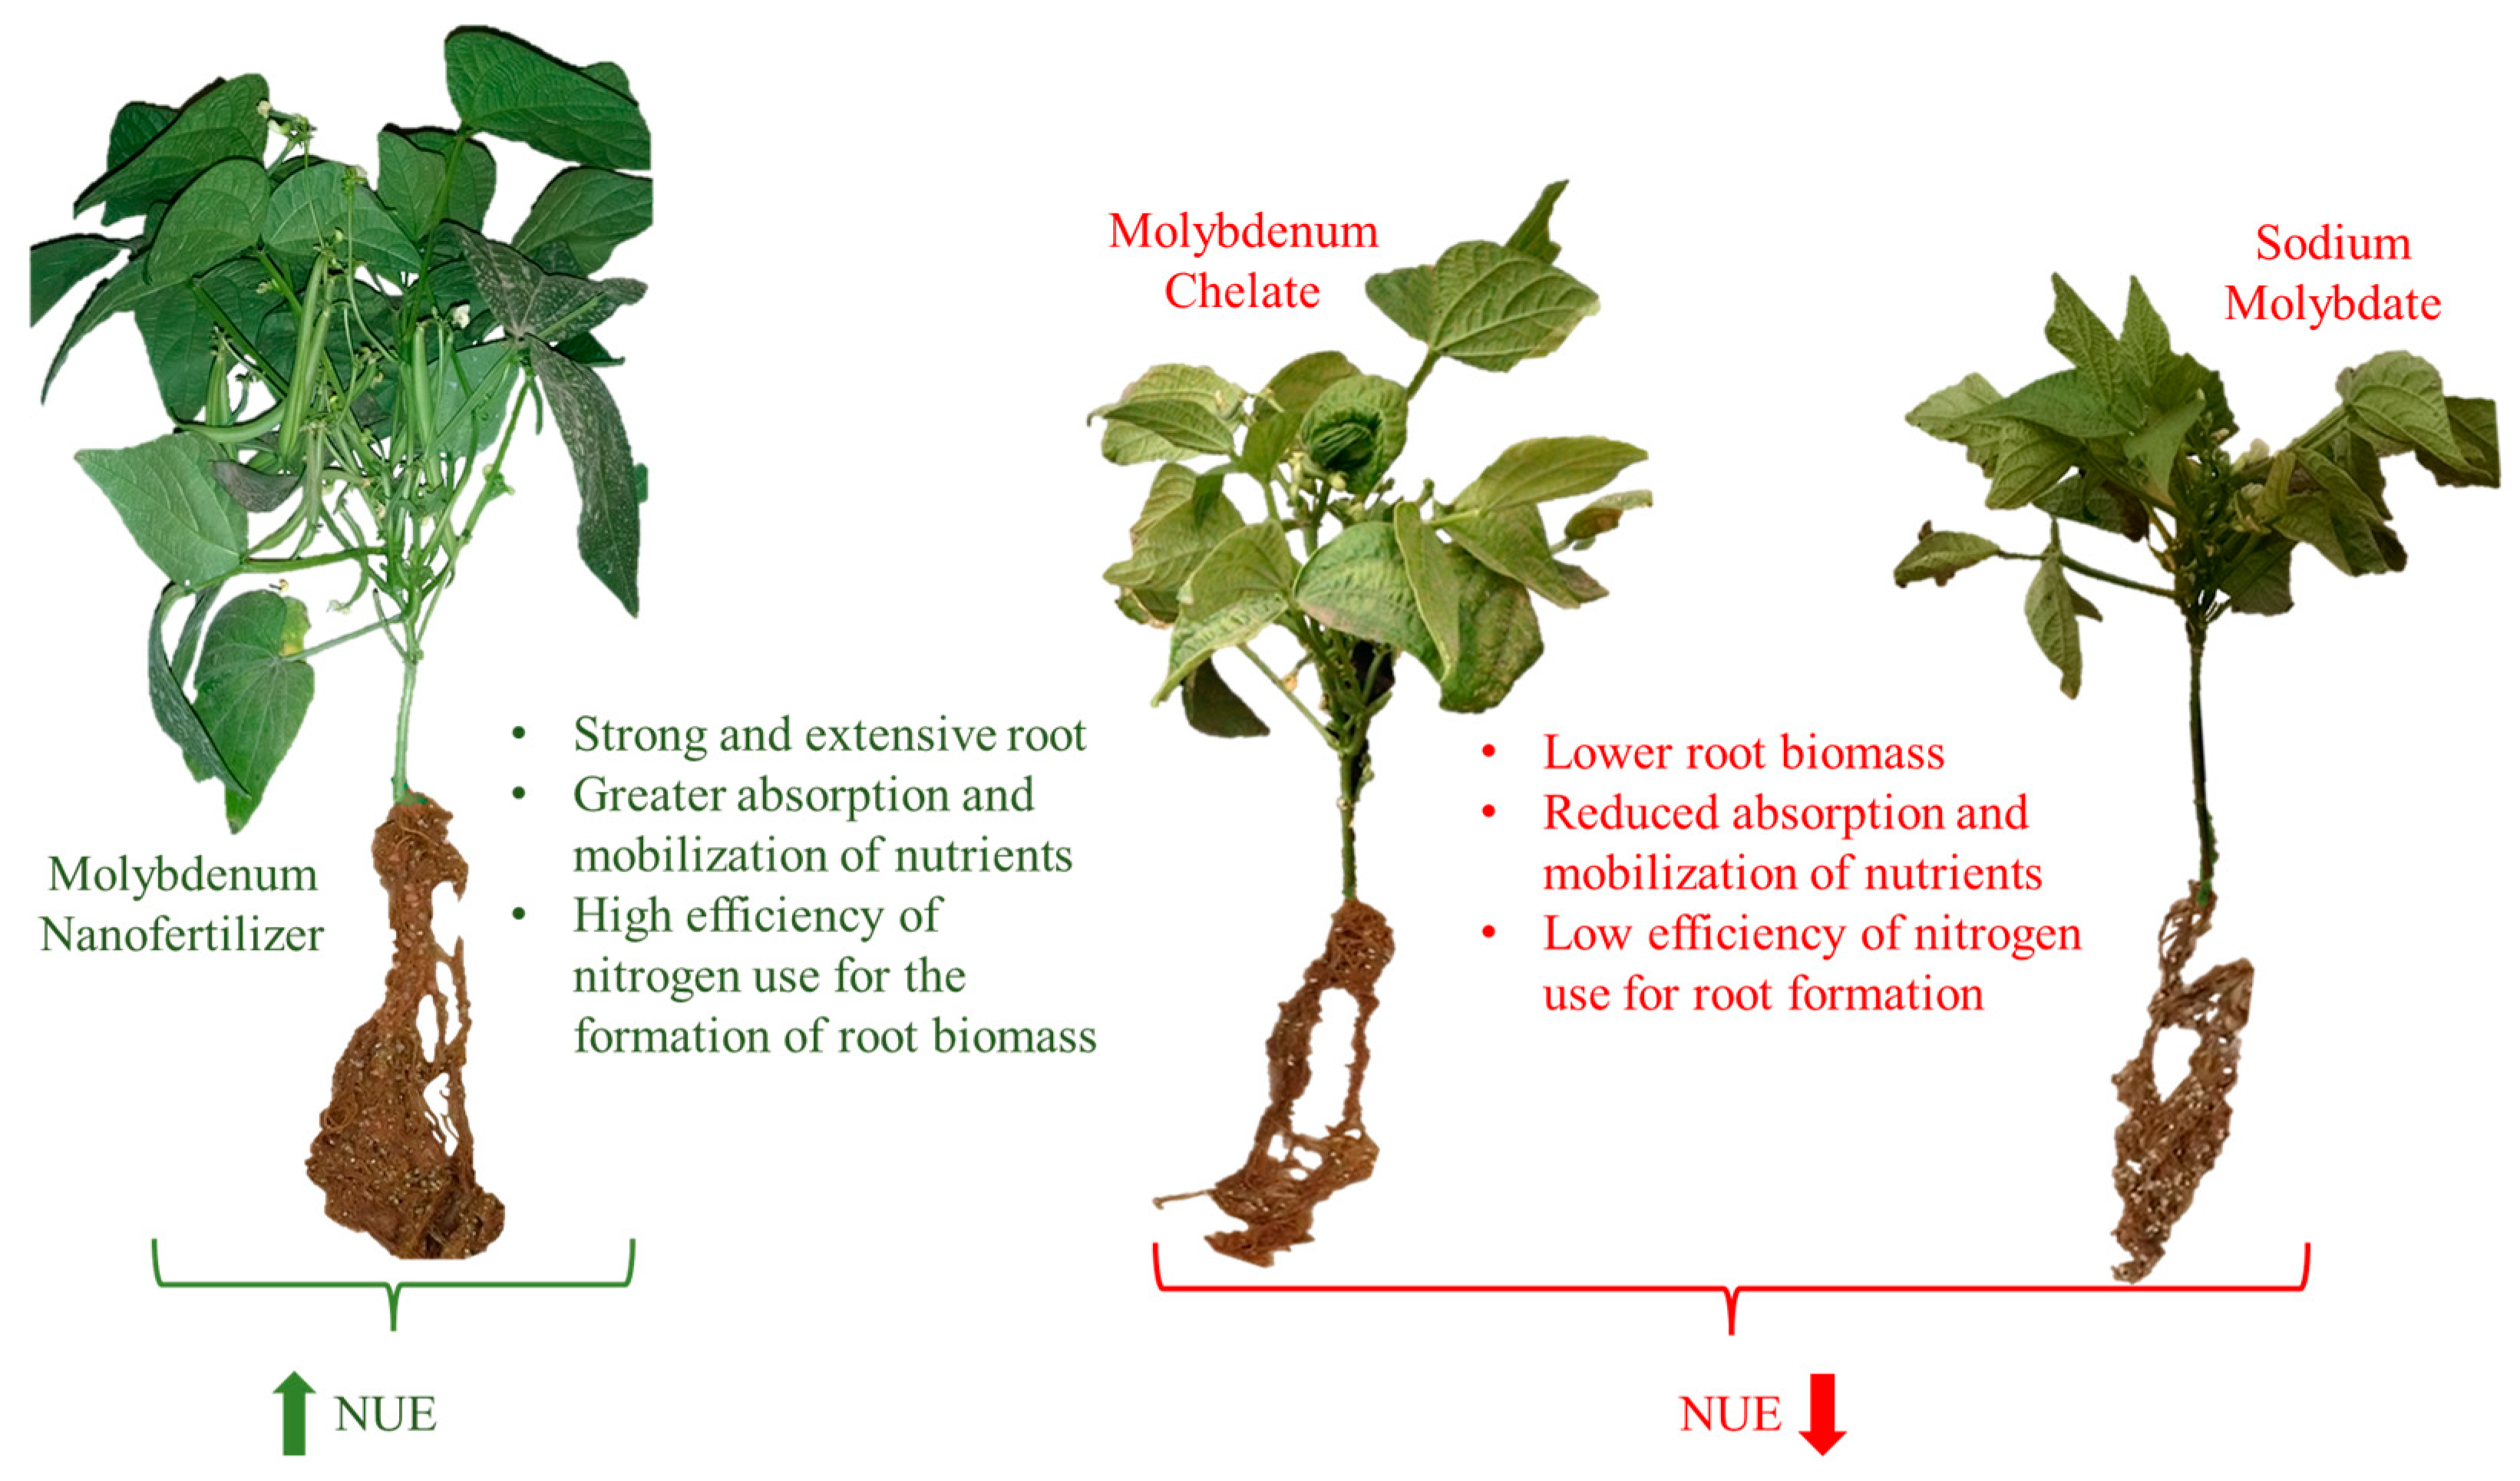
In the present study, the results showed that with the application of the molybdenum nanofertilizer (NanoMo), it was possible to increase the efficiency of nitrogen use for the efficient formation of the total biomass of the plant (Table 1). The nitrogen use efficiency indices showed that, with the application of molybdenum nanofertilizer, total biomass production increased 41.65% more than with the application of molybdenum chelate, and 36.84% more than with the application of sodium molybdate. This biomass index allowed us to observe how the nanofertilizer achieved greater nitrogen assimilation, which translated into an increase in the accumulation of dry matter, in this case, greater development and number of leaves. The clear advantage of nanofertilizer over the most commonly used conventional fertilizers is presented as a reliable alternative that increases the efficient use of nitrogen for the benefit of the crop (Figure 2).
It is important to highlight the benefit of the interaction of edaphic nitrogen with foliar NanoMo (Figure 3a). Although the joint action of nitrogen and molybdenum naturally is essential for the plant, the strategy of applying NanoMo enhanced the assimilation and fixation of nitrogen (doses of 6 mM-N and 10 ppm-Mo), and could be used more efficiently for the formation of a greater number of and larger leaves. With a greater amount of foliage, the leaf area of the plant was considerably increased; this allowed for greater light capture and an efficient photosynthetic system.
In the NUE index that estimates the amount of milligrams of nitrogen necessary for the formation of leaves (mg-N-leaf), the difference in the use of nitrogen for the formation of dry biomass of the NanoMo compared to the chelate and molybdate ranges from 25.46% and 50.14%, respectively (Table 1). With the use of this index, it could be clearly seen how nitrogen, under the effect of NanoMo, was easily metabolized and transformed to form part of the amino acids and proteins necessary for the optimal development of the plant. In Figure 3b, we can see the positive effect of NanoMo at the dose of 10 ppm, and how it has a quite favorable response when interacting with a high dose of nitrogen (12 mM). This may mean that, as there is a greater amount of molybdenum available in the plant’s metabolism, there is a greater probability of metabolizing a high amount of nitrogen for the formation of foliage, which helps to mitigate to a certain extent the toxic effects of a plant nitrogen supersaturation.
In relation to the NUE index that indicates the percentage of nitrogen used to form leaves (RNC%), the plants treated with the chelate source were those that required the highest percentage of nitrogen for foliage formation (Table 1). Likewise, in Figure 3c, it can be seen how the doses of 3 mM and 6 mM of nitrogen supplemented with NanoMo foliar fertilization were the most efficient in leaf production per unit of nitrogen applied. Under the principle of efficiency, with these low doses of nitrogen and NanoMo, the plants developed and managed to produce a greater number of leaves, unlike the plants where the double dose of nitrogen (12 mM) was applied (Figure 4).
Regarding the nitrogen fixation efficiency (NFiE) (Figure 3c), the favorable effect of NanoMo and nitrogen is clearly seen at the doses of 6 mM-N and 10 ppm-Mo. This interaction potentiates the transformation of absorbed nitrogen into abundant leaf tissue (greater number of leaves and larger size) which will be essential for the survival and optimal development of the plant. The efficient use of nitrogen transformed into dry matter is an unequivocal indicator of adequate use of nitrogen fertilizers.

3.1.2. NUE Indices for Stems

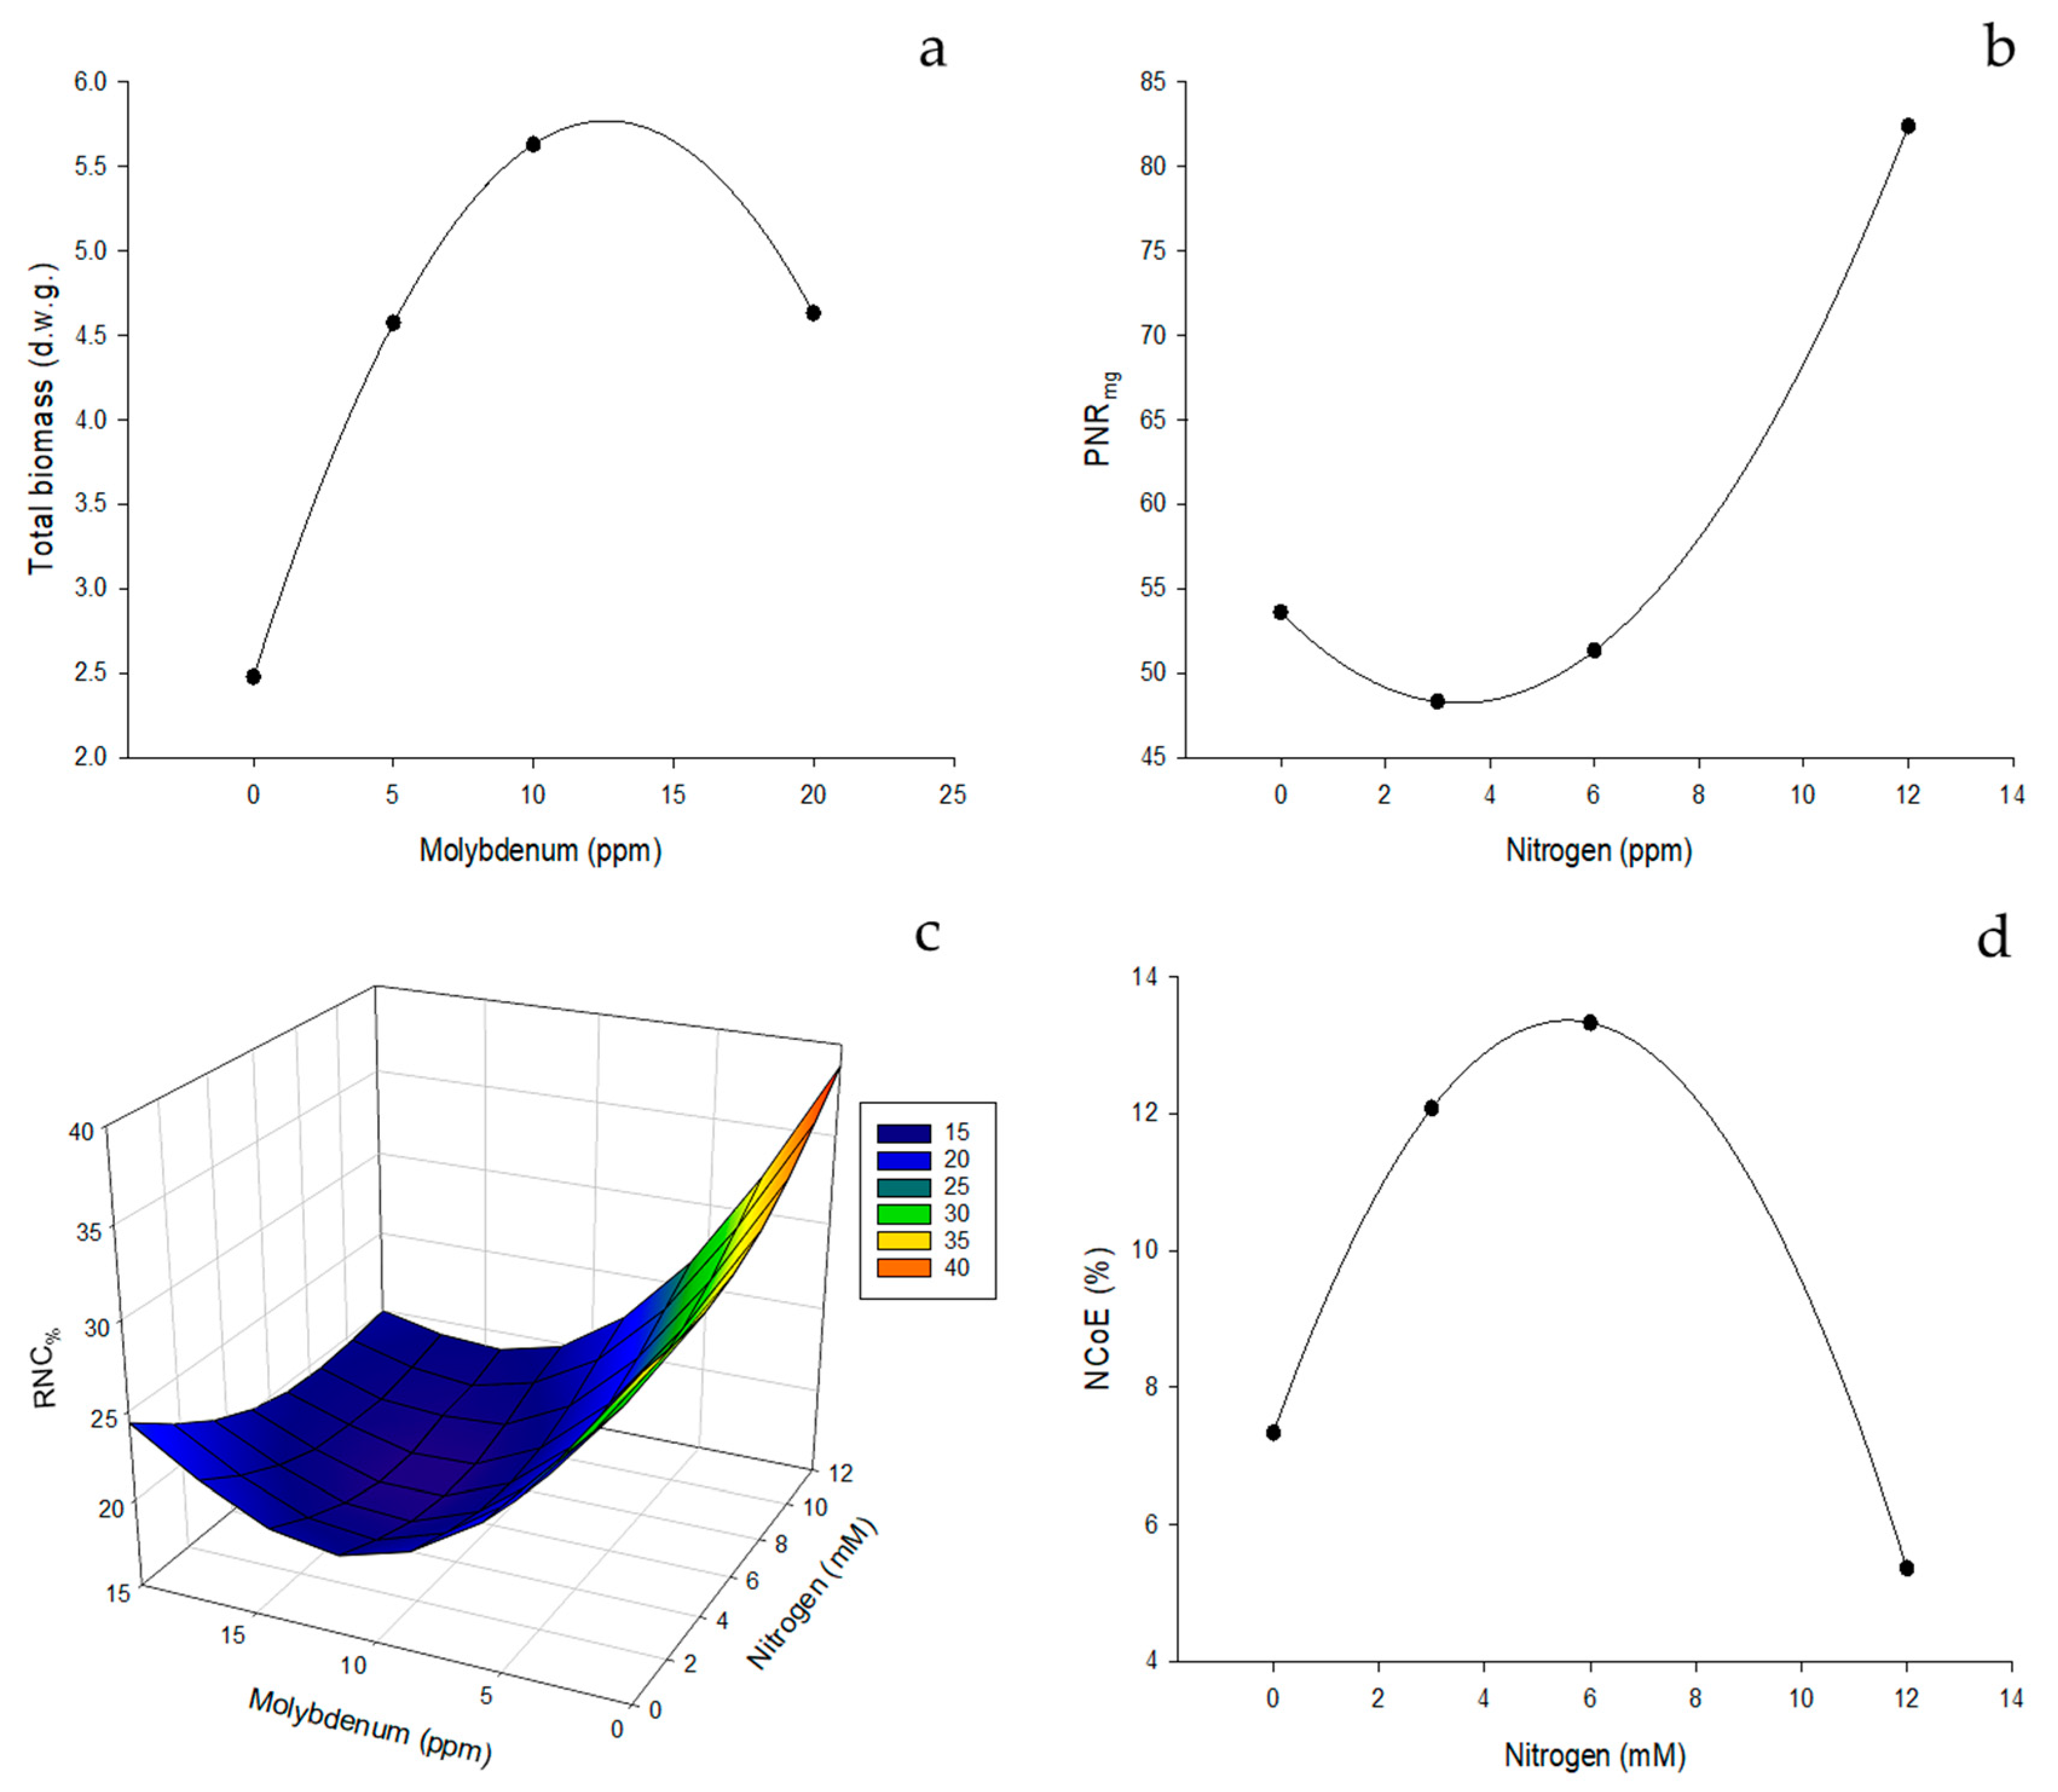
NanoMo had a quite favorable response in stem production, unlike the other two sources of molybdenum (Table 2). This difference was 43.52% more for the chelate and 23.84% more for the molybdate. Likewise, in Figure 5a, we can observe the effect of the NanoMo doses directly on this index. The graph shows how the greatest development of stems was obtained with the dose of 10 ppm, and that a higher dose can cause a significant reduction in the formation of stems, in thickness, height and number.
In the indices that determine the percentage by weight of the plant organ (RCP) and the amount of nitrogen to form each organ (RNC%), no significant statistical difference was found between the sources of molybdenum (Table 2); for this reason, the use of nanofertilizer continues to be prioritized due to its high efficiency in nitrogen assimilation and fixation. In the response surface analysis (Figure 5c), the importance of efficient nitrogen fixation can be observed, since this nitrogen is responsible for the formation and proper development of the stems.
On the other hand, in Figure 5b referring to the index that determines the milligrams of nitrogen necessary to form the stems, a behavior similar to that recorded for the leaves can be seen, where the low doses of nitrogen (3 and 6 mM) were the most efficient in the use of nitrogen, since, with a smaller amount and efficiently used in the plant metabolism, the development of a system was promoted. Stems are large enough to hold the size of the entire foliage of the plant. Similarly, the graph shows how plants that are subjected to excessive nitrogen fertilization (12 mM) use a greater amount of nitrogen to produce dry matter, breaking with the principle of nitrogen use efficiency.
Finally, the index that measures the efficiency of nitrogen conduction through the stems (NCoE) shows how plants fertilized with NanoMo and with low doses of nitrogen (3 and 6 mM) had the highest conduction efficiency (Figure 5d). And, on the contrary, high doses of nitrogen (12 mM) led to a dramatic drop in translocation efficiency by approximately 61% compared to the 6 mM dose.

3.1.3. NUE Indices for Roots

In the present investigation, root development was favored by the application of NanoMo. The difference in total biomass varied from 2.29% with respect to sodium molybdate and 25.96% with respect to molybdenum chelate. These differences in root volume allowed the plants fertilized with the nanofertilizer to develop a larger and more efficient root system. This efficiency of nitrogen use in the root can also be verified with the index that determined the milligrams of nitrogen used to form the dry matter of the root (PNRmg), where the difference in this index in the NanoMo with respect to the other sources of molybdenum was around 50% (Table 3).
On the other hand, it is important to highlight how the source of sodium molybdate registers a higher percentage of the root weight (RPC) compared to the chelate and NanoMo; similarly, the nitrogen absorption efficiency index (NAbE) shows how molybdate led to the highest absorption efficiency, where the difference is 36.56% more than the chelate and 56.50% more than the nanofertilizer. To explain this behavior, it is necessary to analyze the data from all the plant organs together. This apparent superiority of the effect of molybdate in these two parameters did not translate into a positive effect on the total development of the plant, since the greatest production of foliage (leaves) and productivity (fruit production) was obtained with the NanoMo application. This means that the amount of nitrogen absorbed by the plants under molybdenum fertilization did not necessarily translate into development of aerial biomass and fruit formation, and only had an effect of nitrogen overaccumulation that could affect optimal plant development.
It is important to highlight the direct effect that the NanoMo doses had on the total biomass (Figure 6a). The graph shows how with the dose of 10 ppm of molybdenum the maximum biomass production was achieved. Likewise, we can see how a double dose (20 ppm) causes a drastic drop in leaf production, most likely due to overfertilization with molybdenum. In the percentage index by weight of the root (RPC) (Figure 6b), it can be seen that with the increase in nitrogen doses, the percentage by weight of the root decreases. The direction of the graph expresses how the volume of the root decreases as there is a greater contribution and consequently an overaccumulation of nitrogen, which results in a decrease in the production of root biomass. Figure 6c (PNRmg indice) shows how the 10 ppm dose of molybdenum had greater efficiency in the use of nitrogen to form the root. On the other hand, in Figure 6d (RNC% indice) and 6e (NAbE indice), a similar behavior can be seen, where the dose of 3 mM of nitrogen had the highest absorption efficiency (6e), and a greater formation of the root with the lowest dose of nitrogen (6d).

3.1.4. Indices NUE for Fruit

The highest efficiency of nitrogen use for fruit production was achieved with the application of NanoMo (Table 4). The difference in production with respect to the chelate source was 45.78% more, and 17.77% more than with the molybdate source. The ease of absorption and translocation of NanoMo allowed the plant to have the molybdenum necessary to assimilate the absorbed nitrogen through the enzymatic metabolism responsible for its transformation; and in this way, it can be used by the plant for its growth and fruit production.
Another determining index to measure the efficiency of nitrogen use for fruit formation was the mg-N index, which shows that with the application of NanoMo, the plants achieved greater productivity and use of nitrogen by 60.22% more milligrams used for fruit formation than the chelate source, and 11.43% more than plants treated with molybdate. Similarly, the productivity efficiency of the nanofertilizer exceeded the chelate and molybdate sources by 45.10% and 20.19%, respectively. These results show the capacity of the nanofertilizer to increase the efficiency of nitrogen use in favor of the crop, to produce more fruits per unit of applied nitrogen.
On the other hand, the direct effect of NanoMo on nitrogen indices should be highlighted. The graphs in Figure 7 show a similar trend, where the dose of 10 ppm was the most efficient for fruit production. With the application of 10 ppm, the plants achieved greater efficiency in the use of fertilizers to produce a greater amount of fruit (parameter Productivity (fruits·mg-N, Figure 7a). Similarly, the highest nitrogen use efficiency was achieved, where a greater number of fruits were produced per milligrams of nitrogen used (PNRmg indice, Figure 7c). The greater efficiency of utilization of absorbed nitrogen for fruit production (Productivity indice) per unit of nitrogen and molybdenum applied was also favored by the application of 10 ppm of NanoMo. It is important to highlight that applying a higher dose of NanoMo (20 ppm or more) causes a drop in yield; this may be caused by the overaccumulation of molybdenum in the plant, derived from the high absorption efficiency that the plant has nanofertilizer. This particular characteristic should be considered essential, and special care should be taken in fertilization programs to avoid toxicity in plants.

4. Discussion

Nitrogen shortage or overfertilization severely affects the physiological, molecular and biochemical responses of the plant. In addition, the general metabolism and the distribution of metabolites and general resources necessary for their survival are affected [16]. For this reason, nitrogen is considered, among all essential nutrients, the most limiting nutrient for agricultural production [7]. However, its intensive and unbalanced use is strongly related to the losses that cause low efficiency in the use of nitrogen fertilizers (NUE) [17]. Given the urgency of solving the problem of low nitrogen use efficiency, techniques were used that allowed raising the level of use of this nutrient to the maximum. The use of microelements as important as molybdenum, essential in the nitrogen assimilation process, and the use of cutting-edge tools such as nanotechnology, have proven to be nitrogen-use efficient.
Nitrogen use efficiency represents the ability of plants to use the mineral nitrogen that is available. For this reason, its definition implies the increase in yield per unit of nitrogen applied, absorbed and used by the plant for the production of economically viable fruit [18]. However, it is also used to determine the production efficiency of the entire plant biomass. For this reason, the different parameters calculated in the present research were able to demonstrate the positive effect of NanoMo on the efficiency of nitrogen use in the production of leaves, stems, roots and fruit in bean plants. The particular characteristics of NanoMo facilitated its penetration through the surface of the leaves, and its nanometric size allowed it to be distributed throughout all tissues, which guaranteed an effective concentration required by the plant for its growth (Figure 8) [19].
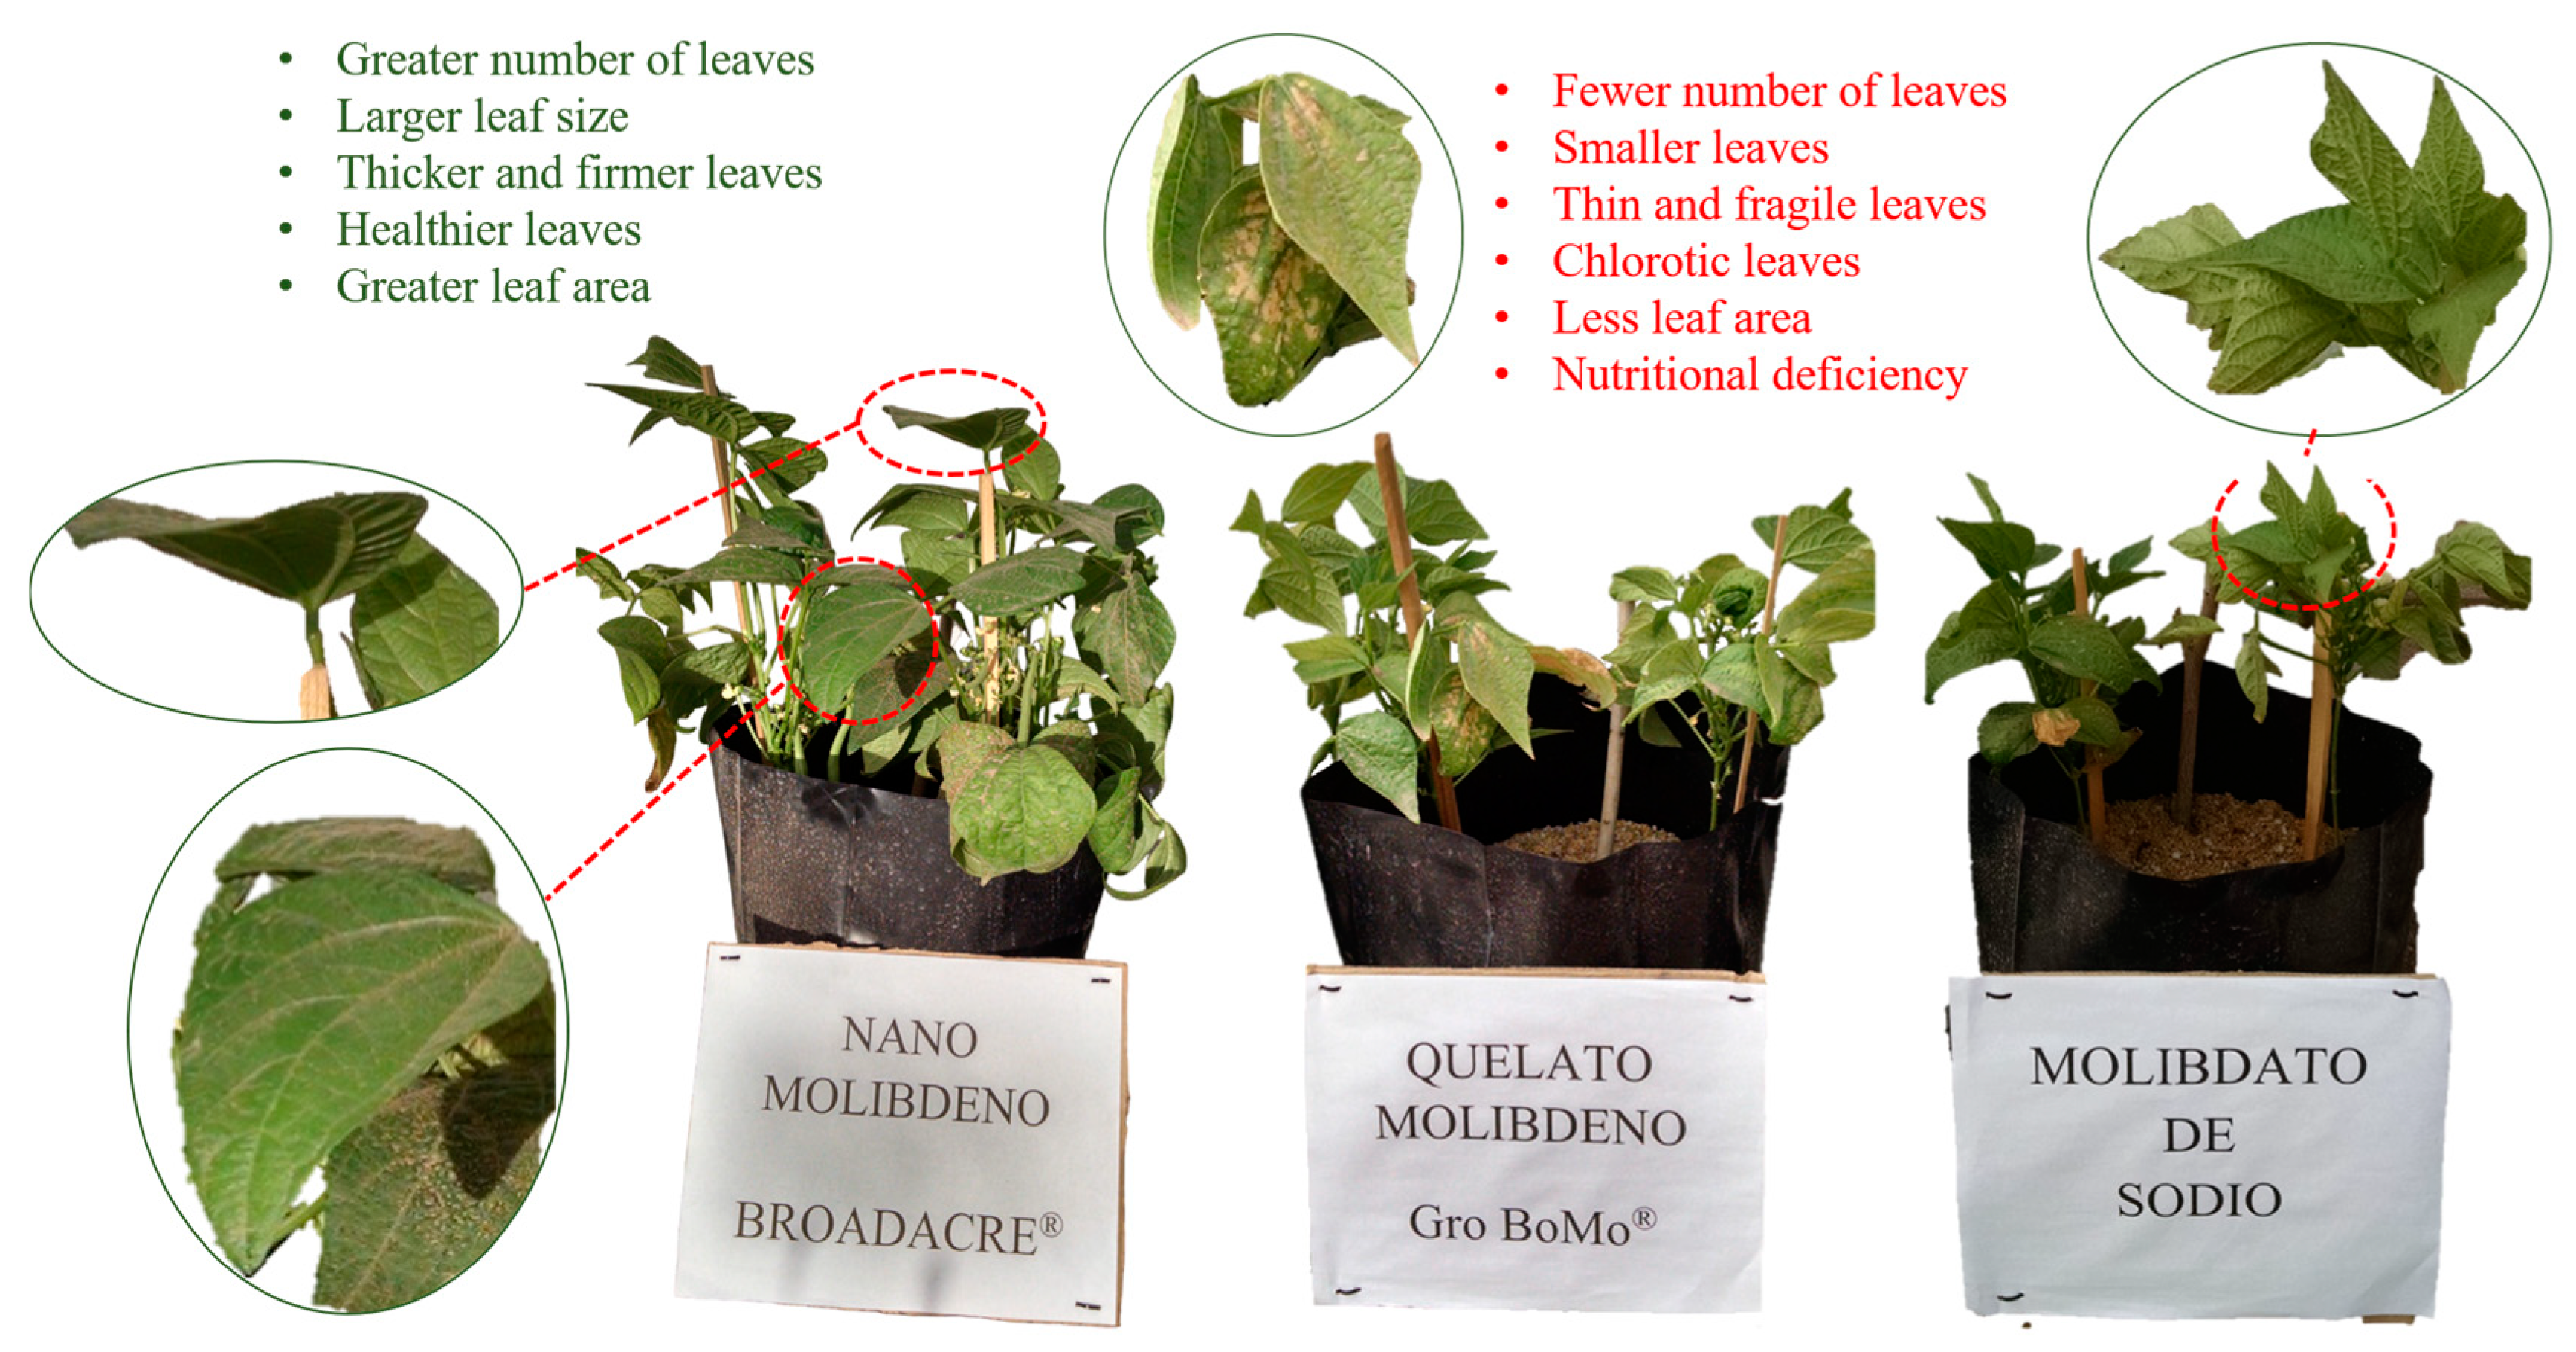
The importance of Mo being available in the cells lies in the fact that it is a metallic component that plays a fundamental role in the biosynthesis of the cofactor Moco, which binds to the molybdoenzymes (enzymes that require molybdenum) responsible for the reduction, assimilation and nitrate fixation (Nitrate reductase (NR) and Nitrite reductase (NiR)), in addition to the regulation of the enzymes glutamine synthetase (GS) and glutamate synthase (GOGAT) responsible for the assimilation of ammonium [8]. In this way, a sufficient amount of Mo allowed the plant to use it in the metabolic process of nitrogen assimilation, and the activity of the enzymes responsible for its assimilation and fixation was not stopped or decreased. Likewise, nitrogen used efficiently allowed the development of meristems, the formation and growth of leaf tissue in the increase in the growth rate and elongation of the leaves [20] (Figure 9).
The adequate supply of nutrients, and especially nitrogen, allows the plant to develop a support system strong enough so that it can remain upright, and prevent the stems from breaking despite the overturning forces that the plant can generate, such as wind and the weight of the plant itself; the stems must have the ability to redirect and transmit those forces to the anchoring system in the ground [21].
Likewise, the effect of NUE was reflected in the formation of strong and resistant stems in the plants treated with NanoMo, which were not prevented from developing properly. On the other hand, the deficiency in the growth of plants treated with Chelate and Molybdate supposes a low assimilation of nitrogen, which consequently affects the production of proteins and various nitrogen products essential for the development of the plant. The low assimilation of nitrogen triggered various metabolic effects, which strongly impact metabolic pathways, and specific actions that involve some macronutrients that act on the specific development of the stems. In this case, it can be assumed that there was an affectation in the phosphorus (P) cycle, which results in a reduction in the synthesis of cellulose, starch and sucrose, which affects the formation of stems, in such a way that the plants may present dwarfism. Likewise, the activity of potassium (K) could be affected; the inaction or deficiency of this element caused by the N-K relationship produces a stagnation in the development of the plant, especially by shortening the internodes of the stems, making them weaker [22] (Figure 10).
The root is the fundamental organ of the plant that anchors it to the soil. Furthermore, it has the indispensable function of capturing water and nutrients from the soil, and is a site of great interaction with biotic and abiotic factors that are frequently determinants for crop productivity [23]. For good root development to occur, there must be an adequate supply of nutrients, especially nitrogen. The absence or shortage of this element drastically reduces root growth, which directly impacts the development and quality of the plant [24].
The development of a strong and abundant root system facilitates the absorption and translocation of nitrogen for the development of the entire vegetative system, and especially in fruit formation [25]. The adequate nutritional status of the plants fertilized with NanoMo allowed, among many other plant mechanisms, the timely activation of nutrient transporters, which are distributed in all their organs. In the particular case of this research, nitrate transporters are responsible for the absorption and transport of nitrate to assimilation sites within cells [26]. In such a way, plants with a high nitrogen use efficiency develop a strong and extensive root system during their growth and vegetative development, which is an essential basis for the continuous absorption and translocation of nitrogen, until culminating in the stage of fruit formation and filling [27,28] (Figure 11).
Nitrogen was vital for increasing the yield of the bean crop. Adequate supply of this nutrient can increase yield by more than 40%; Yang et al. [29] obtained similar results by applying different doses of nitrogen to blackberry crops. It is important to note that fruit quality depends on the quantity and proportion of amino acids, proteins, vitamins, sugars and other metabolites that depend on the supply of nitrogen to the plant [30]. In addition, it was necessary to increase the efficient use of nitrogen to improve fruit productivity and quality.
It is very important to remember that high-quality fruit is vital for consumers and food processors. In addition, high-quality fruits are mainly desired in the world market, where they are expected to have good flavor, excellent appearance, firmness, size and, above all, be rich in nutrients essential for health. All this can be achieved with proper crop management, and especially fertilization management [31]. For this reason, the efficient use of nitrogen and nanomolybdenum allowed the bean plants to produce a greater quantity of high-quality fruit (Figure 12), since nitrogen directly impacts fruit growth and regulates its quality [29]. Furthermore, the high assimilation efficiency of nanomolybdenum allowed optimizing the metabolic functions of the enzymes and cofactors responsible for the reduction, assimilation and fixation of nitrogen, which are intended for plant growth and fruit development [8]. Efficiently assimilated nitrogen is an important component of the chemical structure of proteins, chlorophylls, some phytohormones, nucleic acids and secondary metabolites responsible for the quality of the fruits [32]. In this way, a higher content of sugars, antioxidant compounds and firmness are guaranteed [33,34].
On the other hand, [35] reported that high nitrogen applications combined with low efficiency caused a decrease in phenolic content, yield and nutritional content. In addition, the size, shape, color and general appearance of the olive fruit was affected. Likewise, most crops are undoubtedly affected by nitrogen, and it is for this reason that the calculation of nitrogen parameters is a reliable tool to effectively determine the use of nitrogen and other essential nutrients for plant development and performance.

5. Conclusions

Foliar applications of Nanomolybdenum considerably increased the efficiency of nitrogen use, which increased the productivity of bean plants per unit of applied nitrogen by 42% and 37% more in the leaf, 44% and 24% more in the stem, 26% and 2% more in roots, and 46% and 18% in fruit production than chelate and molybdate, respectively.
Furthermore, the determination of the NUE through the use of the different efficiency indices allowed us to specify the final destination of the assimilated nitrogen and its use in the production of leaves, stems, fruit and roots of the green bean plants.
Importantly, the results prove that the use of NUE indices is an important approach to evaluate the efficiency of nitrogen applied to crops; and they can be used to estimate the growth, development and yield of cultivated plants.
Finally, these strategies imply a significant advance in actions that help minimize pollution and the toxic effects of nitrogen fertilizers on the environment and human beings. They will also allow the development of new techniques that complement this purpose.

Author Contributions

E.S., J.M.S.-P. and E.M.-M. designed the study. E.S., R.P.-L. and J.M.S.-P. analyzed the data. E.S. and E.M.-M. prepared the manuscript. E.M.-M., R.P.-L. and E.S. conducted the experiments. E.S., J.M.S.-P. and E.M.-M. organized the data and performed the statistical analysis. All authors have read and agreed to the published version of the manuscript.

Funding

This research work was funded by the National Science and Technology Council of Mexico (CONACyT), and was duly approved in the Call for National Problems: Project #1529 “Biofortification of basic agricultural crops representing the key to combatting malnutrition and ensuring food security in Mexico”.

Data Availability Statement

For more information about the research, please contact the authors at [email protected] and [email protected].

Acknowledgments

We would like to thank the National Science and Technology Council of Mexico (CONACyT), and was duly approved in the Call for National Problems: Project #1529 “Biofortification of basic agricultural crops representing the key to combat 361 malnutrition and ensure food security in Mexico”.

Conflicts of Interest

The authors declare no conflicts of interest.

References

  1. Doi, M.; Higuchi, K.; Saito, A.; Sato, T.; Ohyama, T.N. Absorption, Transport, and Recycling in Nodulated Soybean Plants by Split-Root Experiment Using 15N-Labeled Nitrate. Nitrogen 2022, 3, 636. [Google Scholar] [CrossRef]
  2. Poultney, D.M.N.; Thuriès, L.; Versini, A. Importance of Overlooked Crop Biomass Components in Sugarcane Nitrogen Nutrition Studies. Nitrogen 2024, 5, 62–78. [Google Scholar] [CrossRef]
  3. Escalante-Estrada, J.A.S.; Rodríguez-González, M.T.; Escalante-Estrada, Y.I. Rendimiento de frijol y la aplicación de nitrógeno. Explor. Rev. Real. Glob. 2021, 10, 106–112. [Google Scholar]
  4. Rojas-Victoria, N.J.; Escalante-Estrada, J.A.S.; Aguilar-Carpio, C. Análisis de crecimiento, rendimiento de frijol ayocote (Phaseolus coccineus L.) en un sistema de fertilización nitrogenada. Trop. Subtrop. Agroecosyst. 2023, 26, 12. [Google Scholar] [CrossRef]
  5. Govindasamy, P.; Muthusamy, S.K.; Bagavathiannan, M.; Mowrer, J.; Jagannadham, P.T.K.; Maity, A.; Halli, H.M.; Vadivel, R.T.K.D.; Raj, R.; Pooniya, V.; et al. Nitrogen use efficiency—A key to enhance crop productivity under a changing climate. Front. Plant Sci. 2023, 14, 1121073. [Google Scholar] [CrossRef]
  6. Marschner, H. Functions of mineral nutrients: Micronutrients. In Mineral Nutrition of Higher Plants 1995, 2nd ed.; Academic Press: London, UK, 1995; pp. 313–404. [Google Scholar]
  7. Anas, M.; Liao, F.; Verma, K.K.; Sarwar, M.A.; Mahmood, A.; Chen, Z.L.; Li, Q.; Zeng, P.X.; Liu, Y.; Li, R.Y. Fate of nitrogen in agriculture and environment: Agronomic, eco-physiological and molecular approaches to improve nitrogen use efficiency. Biol. Res. 2020, 53, 47. [Google Scholar] [CrossRef]
  8. Imran, M.; Sun, X.; Hussain, S.; Ali, U.; Rana, M.S.; Rasul, F.; Hu, C.X. Molybdenum-Induced Effects on Nitrogen Metabolism Enzymes and Elemental Profile of Winter Wheat (Triticum aestivum L.) Under Different Nitrogen Sources. Int. J. Mol. Sci. 2019, 20, 3009. [Google Scholar] [CrossRef]
  9. Muñoz-Márquez, E.; Soto-Parra, J.M.; Noperi-Mosqueda, L.C.; Sánchez, E. Application of molybdenum nanofertilizer on the nitrogen use efficiency, growth and yield in green beans. Agronomy 2022, 12, 3163. [Google Scholar] [CrossRef]
  10. Hoagland, D.R.; Arnon, D.I. The Water Culture Method for Growing Plants without Soil; California Agricultural Experiment Station, University of California: Berkeley, CA, USA, 1950. [Google Scholar]
  11. Sánchez, E.; Romero, L.; Ruíz, J.M. Caracterización del Estado Nutricional y Fisiológico en Plantas de Judía (Phaseolus vulgaris L. cv. Strike) Sometidas a un Estrés Por Nitrógeno; Editorial de la Universidad de Granada: Granada, Spain, 2006; ISBN 84-338-4168-8. [Google Scholar]
  12. Ponce-García, C.O.; Soto-Parra, J.M.; Sánchez, E.; Muñoz-Márquez, E.; Piña-Ramírez, F.J.; Flores-Córdova, M.A.; Pérez-Leal, R.; Yáñez Muñoz, R.M. Efficiency of Nanoparticle, Sulfate, and Zinc-Chelate Use on Biomass, Yield, and Nitrogen Assimilation in Green Beans. Agronomy 2019, 9, 128. [Google Scholar] [CrossRef]
  13. Dumas, J.B.A. Dumas. In A History of Chemistry; Palgrave: London, UK, 1964; pp. 337–375. [Google Scholar]
  14. SAS Institute Inc. SAS/STATR User’s Guide, Version 6, Fourth Edition, Volume 2; SAS Institute Inc.: Cary, NC, USA, 1989; pp. 1457–1478. [Google Scholar]
  15. Vargas, H.M.; Zarate, D.L.G.P.; Burguete, H.F. Factoriales fraccionados y superficie de respuesta, uso de paquetes estadísticos para microcomputadoras. Monogr. Man. Estadíst. Cómp. 1991, 10, 1. [Google Scholar]
  16. Yadav, M.R.; Kumar, S.; Lal, M.K.; Kumar, D.; Kumar, R.; Yadav, R.K.; Kumar, S.; Nanda, G.; Singh, J.; Udawat, P.; et al. Mechanistic Understanding of Leakage and Consequences and Recent Technological Advances in Improving Nitrogen Use Efficiency in Cereals. Agronomy 2023, 13, 527. [Google Scholar] [CrossRef]
  17. Bindraban, P.S.; Dimkpa, C.O.; White, J.C.; Franklin, F.A.; Melse-Boonstra, A.; Koele, N.; Pandey, R.; Rodenburg, J.; Senthilkumar, K.; Demokritou, P.; et al. Safeguarding Human and Planetary Health Demands a Fertilizer Sector Transformation. Plants People Planet 2020, 2, 302–309. [Google Scholar] [CrossRef]
  18. Fageria, N.K.; Baligar, V.C. Enhancing Nitrogen Use Efficiency in Crop Plants. Adv. Agron. 2005, 88, 97–185. [Google Scholar]
  19. Echevarría-Machado, I. El tamaño sí importa: Los nanofertilizantes en la era de la agricultura de precisión. Desde El Herb. CICY 2019, 11, 69–75. [Google Scholar]
  20. Rademacher, I.; Nelson, C. Nitrogen Effects on Leaf Anatomy within the Intercalary Meristems of Tall Fescue Leaf Blades. Ann. Bot. 2001, 88, 893–903. [Google Scholar] [CrossRef]
  21. Crook, M.J.; Ennos, A.R. The effect of nitrogen and growth regulators on stem and root characteristics associated with lodging in two cultivars of winter wheat. J. Exp. Bot. 1995, 46, 931–938. [Google Scholar] [CrossRef]
  22. Rodríguez, S.M.; Flórez, J.V.R. Ferti-Riego: Tecnologías y Programación en Agroplasticultura; Guzmán, M., López Gálvez, J., Eds.; CYTED: Cambridge, UK, 2004; pp. 25–36. ISBN 84-96023-27-3. DL: Al-290-2004; Available online: http://www.cyted.org (accessed on 14 June 2024).
  23. Mora-García, E.Y.; Reyes-Matamoros, J.; Martínez-Moreno, D.; Tenorio-Arvide, M.G. Eficiencia de nitrógeno en plántulas de maíz. RD-ICUAP 2019, 5, 14. [Google Scholar] [CrossRef]
  24. Monsalve, J.; Escobar, R.; Acevedo, M.; Sánchez, M.; Coopman, R. Efecto de la concentración de nitrógeno sobre atributos morfológicos, potencial de crecimiento radical y estatus nutricional en plantas de Eucalyptus globulus producidas a raíz cubierta. Bosque 2009, 30, 88–94. [Google Scholar] [CrossRef]
  25. Wang, H.; Guo, Z.; Shi, Y.; Zhang, Y.; Yu, Z. Impact of tillage practices on nitrogen accumulation and translocation in wheat and soil nitrate-nitrogen leaching in drylands. Soil Tillage Res. 2015, 153, 20–27. [Google Scholar] [CrossRef]
  26. Kant, S. Understanding nitrate uptake, signaling and remobilisation for improving plant nitrogen use efficiency. Semin. Cell Dev. Biol. 2017, 74, 89–96. [Google Scholar] [CrossRef]
  27. Tian, Z.; Li, Y.; Liang, Z.; Guo, H.; Cai, J.; Jiang, D.; Cao, W.; Dai, T. Genetic improvement of nitrogen uptake and utilization of winter wheat in the Yangtze River Basin of China. Field Crops Res. 2016, 196, 251–260. [Google Scholar] [CrossRef]
  28. Namiki, S.; Takashi, O.; Yutaka, M.; Nobuyasu, S.; Takashi, I. Differential uptake and translocation of organic chemicals by several plant species from soil. J. Pestic. Sci. 2018, 43, 96. [Google Scholar] [CrossRef] [PubMed]
  29. Yang, Y.; Huang, Z.; Wu, Y.; Wu, W.; Lyu, L.; Li, W. Effects of nitrogen application level on the physiological characteristics, yield and fruit quality of blackberry. Sci. Hortic. 2023, 313, 111915. [Google Scholar] [CrossRef]
  30. Sete, P.B.; Comin, J.J.; Nara Ciotta, M.; Almeida Salume, J.; Thewes, F.; Brackmann, A.; Brunetto, G. Nitrogen fertilization affects yield and fruit quality in pear. Sci. Hortic. 2019, 258, 108782. [Google Scholar] [CrossRef]
  31. Duan, Y.; Yang, H.; Wei, Z.; Yang, H.; Fan, S.; Wu, W.; Lyu, L.; Li, W. Effects of different nitrogen forms on blackberry fruit quality. Foods 2023, 12, 2318. [Google Scholar] [CrossRef] [PubMed]
  32. Marschner, P. Marschner’s Mineral Nutrition of Higher Plants, 3rd ed.; Academic Press: San Diego, CA, USA, 2012. [Google Scholar]
  33. Bénard, C.; Gautier, H.; Bourgaud, F.; Grasselly, D.; Navez, B.; Caris-Veyrat, C. Effects of low nitrogen supply on tomato (Solanum lycopersicum) fruit yield and quality with special emphasis on sugars, acids, ascorbate, carotenoids, and phenolic compounds. J. Agric. Food Chem. 2009, 57, 4112–4123. [Google Scholar] [CrossRef] [PubMed]
  34. Cardeñosa, V.; Medrano, E.; Lorenzo, P.; Sánchez-Guerrero, M.C.; Cuevas, F.; Pradas, I. Effects of salinity and nitrogen supply on the quality and health-related compounds of strawberry fruits (Fragaria × ananassa cv. Primoris). J. Sci. Food Agric. 2015, 95, 2924–2930. [Google Scholar] [CrossRef]
  35. Erel, R.; Kerem, Z.; Ben-Gal, A.; Dag, A.; Schwartz, A.; Zipori, I.; Basheer, L.; Yermiyahu, U. Olive (Olea europaea L.) tree nitrogen status is a key factor for olive oil quality. J. Agric. Food Chem. 2013, 61, 11261–11272. [Google Scholar] [CrossRef]
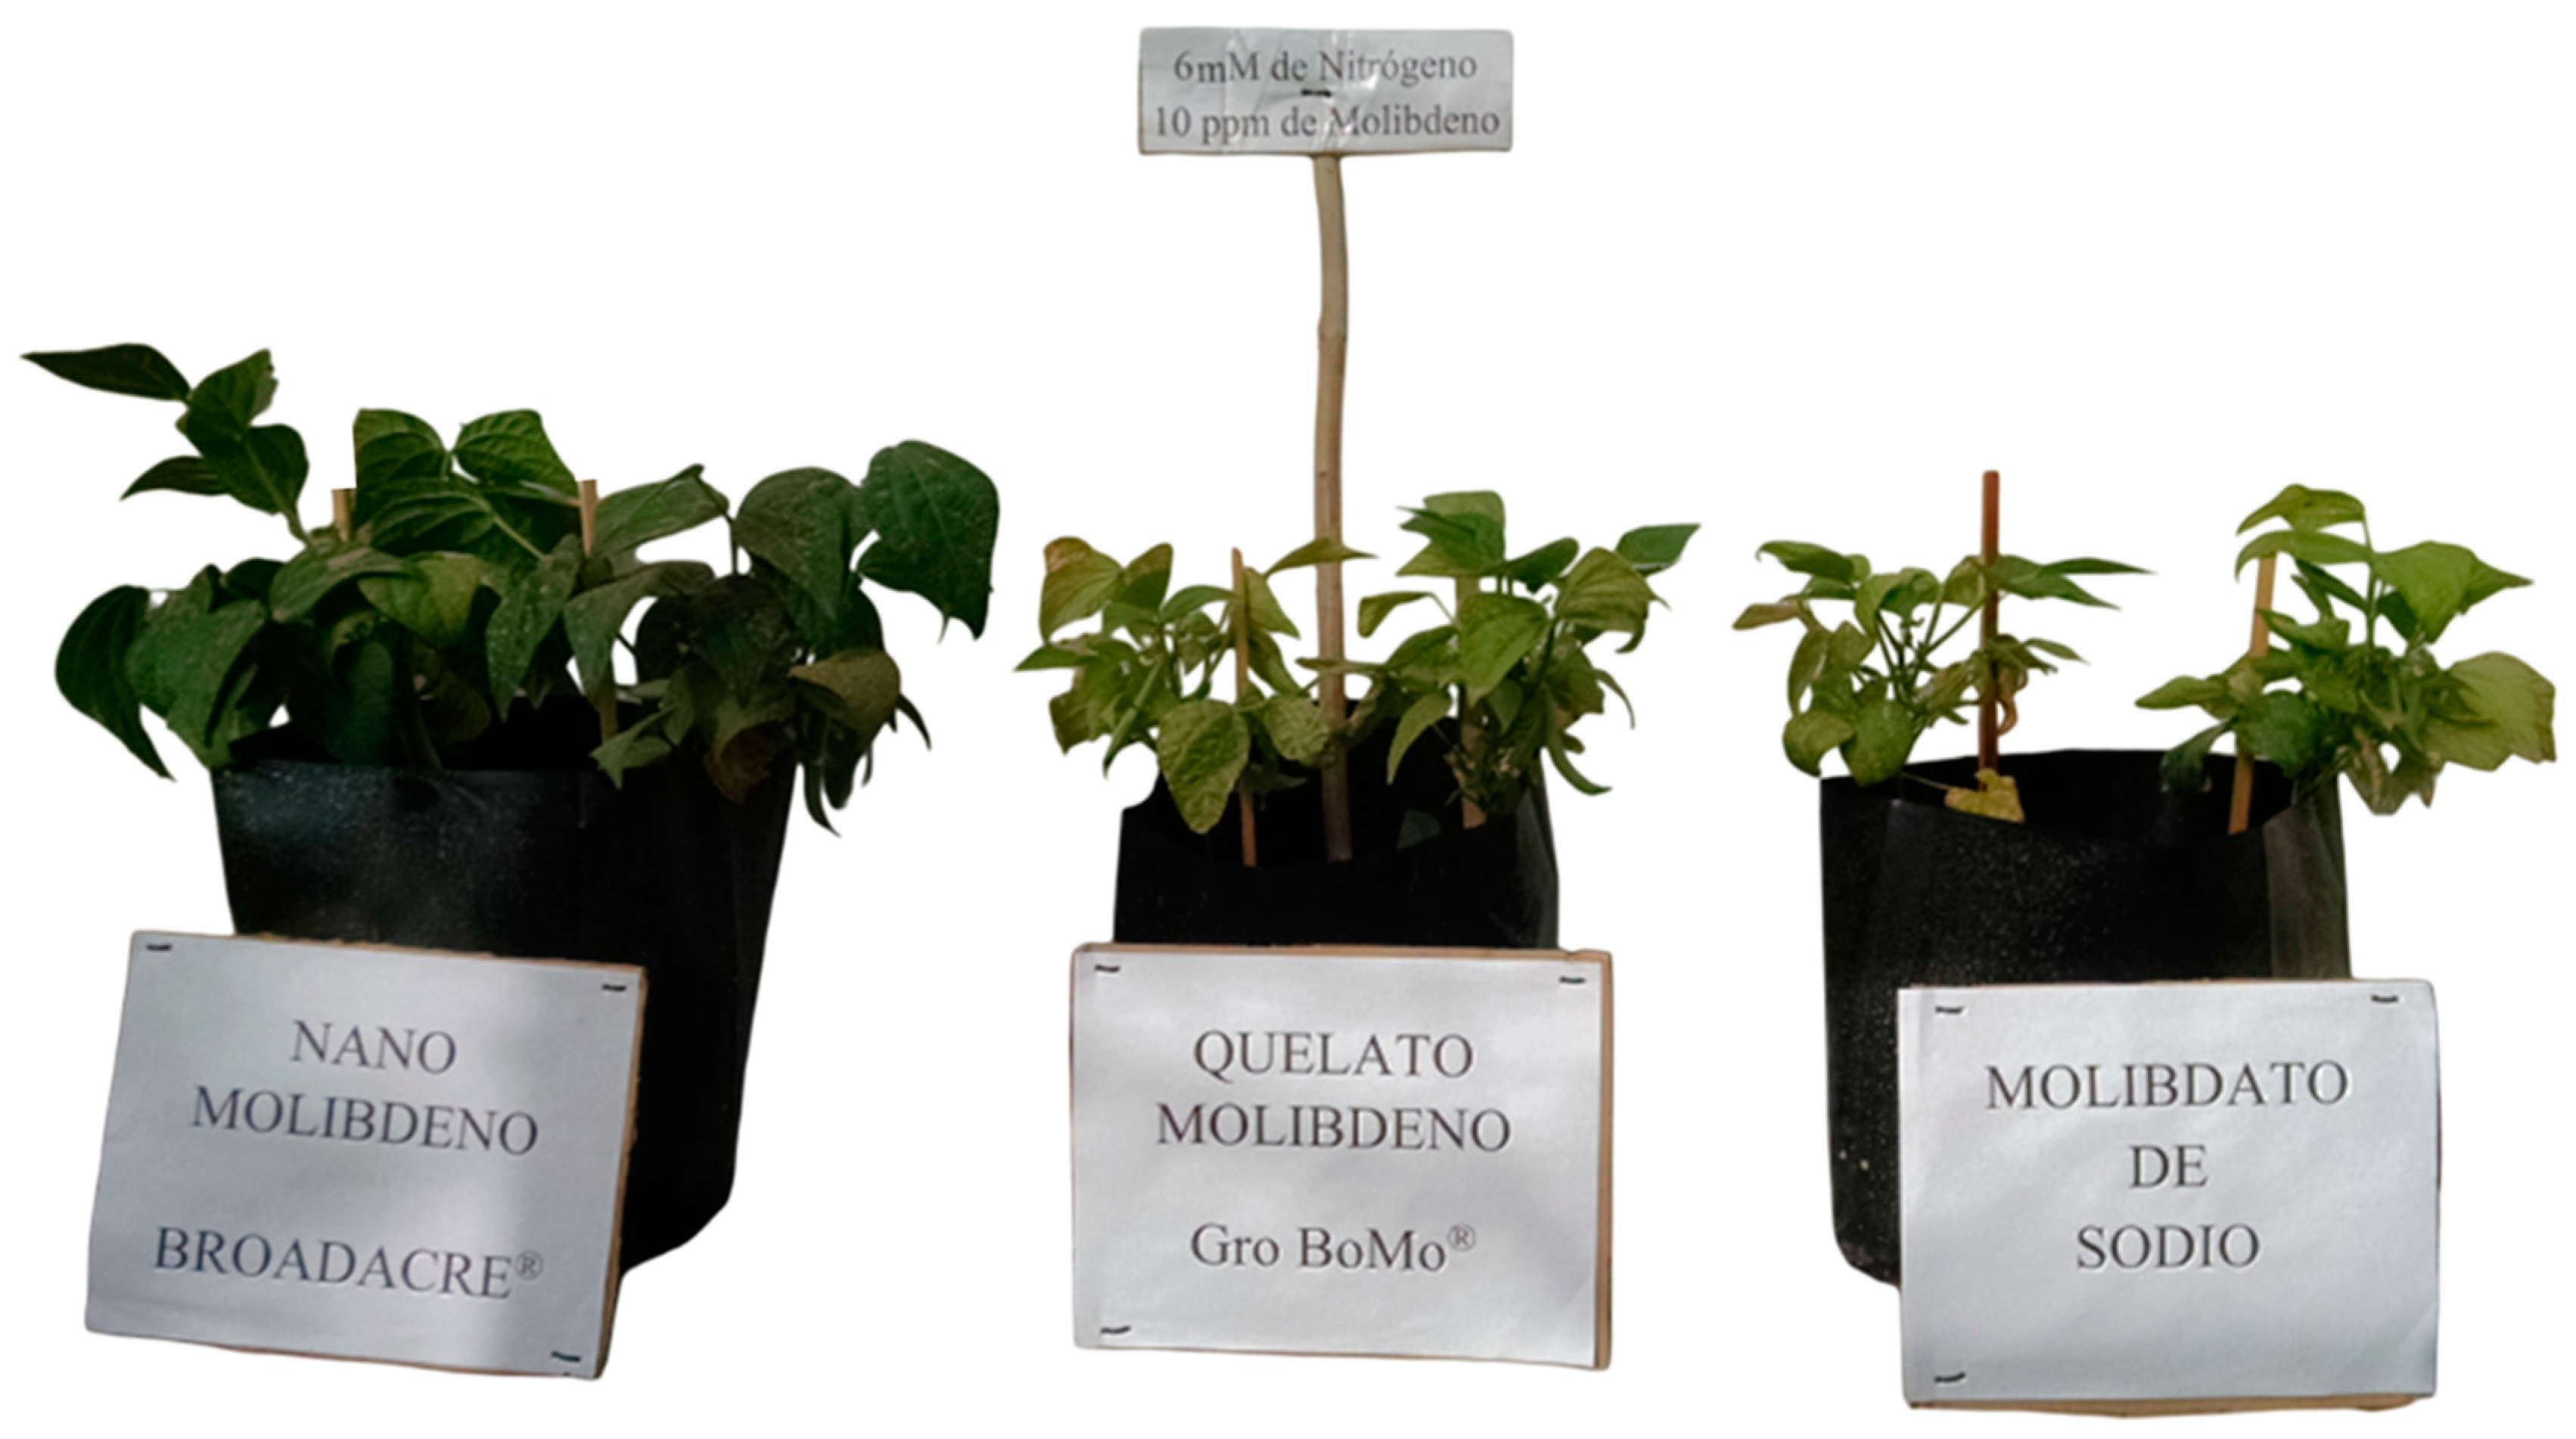
Figure 2. Effect of edaphic nitrogen fertilization, complemented with foliar fertilization with molybdenum nanofertilizer on nitrogen use efficiency (NUE).
Nitrogen 05 00044 g002
Figure 3. Effect of edaphic nitrogen fertilization, complemented with foliar fertilization with molybdenum nanofertilizer on NUE indices for biomass formation. (a) Total foliage biomass (grams dry weight). (b) Milligrams of nitrogen needed to form the leaves of the plant (PNRmg). (c) Quantity of nitrogen to form the leaves (RNC%). (d) Nitrogen fixation efficiency (NFiE).
Nitrogen 05 00044 g003
Figure 4. Nitrogen use efficiency in biomass production as an effect of foliar application of NanoMo. The image shows how the combination of low doses of nitrogen (3 mM) and low doses of NanoMo (10 ppm) favor biomass production, increasing productivity efficiency per unit of fertilizer applied.
Nitrogen 05 00044 g004
Figure 5. Effect of edaphic nitrogen fertilization, complemented with foliar fertilization with molybdenum nanofertilizer on NUE indices for stem formation. (a) Total stem biomass (grams dry weight). (b) Physiological nitrogen requirement of stems (PNRmg). (c) Relative nitrogen contribution of stems (RNC%). (d) Nitrogen conduction efficiency (NCoE).
Nitrogen 05 00044 g005
Figure 6. Effect of edaphic nitrogen fertilization, complemented with foliar fertilization with molybdenum nanofertilizer on NUE indices for root formation. (a) Total biomass (grams of dry weight). (b) Relative physiological contribution of roots (RPC). (c) Physiological nitrogen requirement of roots (PNRmg). (d) Relative nitrogen contribution of roots (RNC%). (e) Nitrogen absorption efficiency (NAbE).
Nitrogen 05 00044 g006
Figure 7. Effect of edaphic nitrogen fertilization, complemented with foliar fertilization with molybdenum nanofertilizer on NUE indices for fruit formation. (a) Total biomass (grams of dry weight). (b) Relative physiological contribution of fruits (RPC). (c) Physiological nitrogen requirement of fruits (PNRmg). (d) Relative nitrogen contribution of fruits (RNC%). (e) Productivity of fruits (fruits·mg-N).
Nitrogen 05 00044 g007
Figure 8. Effect of NanoMo on nitrogen use efficiency in green beans cv. Strike on the different NUE indices. The image shows the plants of the 3 mM-N and 20 ppm-Mo treatments, in the three molybdenum sources.
Nitrogen 05 00044 g008
Figure 9. Effect of NanoMo on NUE in green beans cv. Strike on the growth and development of leaves. The image shows the plants of the 3 mM-N and 20 ppm-Mo treatments, in the three molybdenum sources. Red text represents potential negative impacts.
Nitrogen 05 00044 g009
Figure 10. Effect of NanoMo on nitrogen use efficiency in green beans cv. Strike on the growth and development of stems. The image shows the plants of the 3 mM-N and 20 ppm-Mo treatments, in the three molybdenum sources. Red text represents potential negative impacts.
Nitrogen 05 00044 g010
Figure 11. Effect of NanoMo on NUE in green beans cv. Strike on root growth and development. The image shows the plants of the 3 mM-N and 20 ppm-Mo treatments, in the three molybdenum sources. Red text represents potential negative impacts.
Nitrogen 05 00044 g011
Figure 12. Effect of NanoMo on NUE in green beans cv. Strike on the growth and development of the fruit. Red text represents potential negative impacts.
Nitrogen 05 00044 g012
Table 1. Effect of edaphic nitrogen fertilization supplemented with foliar fertilization of molybdenum nanofertilizer on leaf NUE indices.
Indices NUE (Leaf)
TWRPCPNRmgRCN%NFiE
Mo Source<0.0001 U<0.00010.00080.07190.6624
Nano Mo8.93 a V52.50 a103.92 a42.58 a21.54 a
Mo Chelate5.21 b54.05 a77.46 b48.06 a23.49 a
Na Molybdate5.64 b43.52 b51.81 c40.44 a22.24 a
LSD1.35 W3.9124.518.195.95
Nitrogen X<0.00010.0649<0.00010.0064<0.0001
04.74 c46.25 b51.76 b40.36 b30.90 a
37.22 ab51.17 ab53.65 b39.71 b27.11 a
68.20 a49.32 ab101.23 a44.14 ab17.27 b
126.19 bc53.35 a104.26 a50.57 a14.42 b
LSD1.627.0715.648.547.49
Molybdenum Y<0.00010.13270.96020.19240.0009
05.34 c50.34 a75.89 a44.68 a17.86 b
56.07 bc52.35 a79.30 a46.80 a22.43 ab
107.76 a47.88 a77.49 a40.99 a26.77 a
207.20 ab49.56 a78.30 a43.30 a22.64 ab
LSD1.164.9416.907.485.51
SoMo*N0.08170.50160.00010.0926<0.0001
SoMo*Mo<0.00010.94080.00250.36200.0378
N*Mo0.06750.29290.02560.04150.0327
SoMo*N*Mo0.29560.05190.00850.0022<0.0001
µ6.5950.0277.7343.6922.42
C.V.33.0818.5740.8332.1746.18
R20.78720.62170.77040.59900.7705
U Probability not significant Pr > 0.05, significant 0.05 ≤ Pr ≤ 0.01, highly significant Pr < 0.0001; V means with the same letter are statistically equal; W least significant difference; X Mm edaphic nitrogen concentration; Y leaf ppm concentration of molybdenum, overall average µ, CV coefficient of variation, R2 coefficient of determination; regression analysis: Linear L, Quadratic C, P N*Mo interaction. Total weight of leaves (TW), relative physiological contribution of leaves (RPC), physiological nitrogen requirement of leaves (PNRmg), relative nitrogen contribution of leaves (RNC%), nitrogen fixation efficiency (NFiE).
Table 2. Effect of edaphic nitrogen fertilization supplemented with foliar fertilization of molybdenum nanofertilizer on NUE indices in stems.
Indices NUE (Stems)
TWRPCPNRmgRCN%NCoE
Mo Source0.0004 U0.25060.00030.44230.0074
Nano Mo4.32 a V23.29 a58.91 a24.82 a9.52 b
Mo Chelate2.44 c23.88 a45.49 b27.26 a9.89 b
Na Molybdate3.29 b25.53 a34.25 c26.24 a12.90 a
LSD0.80 W3.5910.315.102.45
Nitrogen X0.01490.0104<0.0001<0.0001<0.0001
02.68 b22.52 b24.23 b17.65 b14.47 a
33.53 ab25.41 ab33.98 b26.79 a13.31 a
64.10 a25.86 a62.06 a29.45 a9.07 b
123.09 ab23.14 ab64.59 a30.55 a6.24 c
LSD1.152.9814.045.531.73
Molybdenum Y<0.00010.44510.17230.00650.0078
02.77 b25.39 a50.77 a29.29 a9.14 b
52.85 b24.00 a47.76 a27.59 ab10.40 ab
104.08 a23.57 a43.34 a22.77 b12.29 a
203.70 a23.97 a42.99 a24.78 ab11.26 ab
LSD0.743.1010.595.152.41
SoMo*N0.65150.84210.0004<0.0001<0.0001
SoMo*Mo<0.00010.43620.23160.02870.9227
N*Mo0.08570.38590.01110.12520.4571
SoMo*N*Mo0.20700.87770.00220.00010.1112
µ3.3524.2346.2126.1110.77
C.V.41.4024.0343.0137.0642.09
R20.71130.44070.78340.69000.7300
U Probability not significant Pr > 0.05, significant 0.05 ≤ Pr ≤ 0.01, highly significant Pr < 0.0001; V means with the same letter are statistically equal; W least significant difference; X Mm edaphic nitrogen concentration; Y leaf ppm concentration of molybdenum, overall average µ, CV coefficient of variation, R2 coefficient of determination; regression analysis: Linear L, Quadratic C, P N*Mo interaction. Total weight of stems (TW), relative physiological contribution of stems (RPC), physiological nitrogen requirement of stems (PNRmg), relative nitrogen contribution of stems (RNC%), nitrogen conduction efficiency (NCoE).
Table 3. Effect of edaphic nitrogen fertilization supplemented with foliar fertilization of molybdenum nanofertilizer on NUE indices in roots.
Indices NUE (Roots)
TWRPCPNRmgRCN%NAbE
Mo Source0.0141 U<0.0001<0.00010.3945<0.0001
Nano Mo1.31 a V15.22 c47.30 a21.84 a5.75 c
Mo Chelate0.97 b18.74 b21.91 b19.42 a8.40 b
Na Molybdate1.28 a24.22 a21.83 b21.66 a13.24 a
LSD0.27 W3.007.525.242.39
Nitrogen X0.0006<0.00010.0002<0.0001<0.0001
01.31 a25.80 a31.75 a35.50 a16.70 a
31.34 a18.39 b32.14 a23.40 b9.30 b
61.34 a18.26 b36.09 a16.02 c6.36 c
120.85 b15.13 b21.40 b8.98 d4.15 c
LSD0.313.397.955.872.29
Molybdenum Y0.09950.85980.11300.24690.0318
01.12 a20.11 a28.25 a19.98 a7.57 b
51.05 a19.34 a27.97 a19.19 a8.54 ab
101.31 a19.40 a33.34 a23.04 a10.54 a
201.26 a18.73 a31.83 a21.70 a9.88 ab
LSD0.304.146.865.392.81
SoMo*N0.18970.02740.5581<0.0001<0.0001
SoMo*Mo0.07190.15800.00040.37570.4295
N*Mo0.02640.60660.00790.00270.3090
SoMo*N*Mo0.00060.09220.00010.04030.2646
µ1.1919.3930.3520.989.13
C.V.48.6540.1042.4948.2457.94
R20.60520.61140.77140.76420.7653
U Probability not significant Pr > 0.05, significant 0.05 ≤ Pr ≤ 0.01, highly significant Pr < 0.0001; V means with the same letter are statistically equal; W least significant difference; X Mm edaphic nitrogen concentration; Y leaf ppm concentration of molybdenum, overall average µ, CV coefficient of variation, R2 coefficient of determination; regression analysis: Linear L, Quadratic C, P N*Mo interaction. Total weight of roots (TW), relative physiological contribution of roots (RPC), physiological nitrogen requirement of roots (PNRmg), relative nitrogen contribution of roots (RNC%), nitrogen absorption efficiency (NAbE).
Table 4. Effect of edaphic nitrogen fertilization supplemented with foliar fertilization of molybdenum nanofertilizer on NUE indices in fruit.
Indices NUE (Fruit)
TWRPCPNRmgRCN%Productivity
Mo Source0.0020 U0.01450.09230.03340.0059
Nano Mo2.25 a V8.97 a28.78 a10.73 ab0.0510 a
Mo Chelate1.22 b3.31 b11.45 a5.25 b0.0280 b
Na Molybdate1.85 a6.72 ab25.49 a12.00 a0.0407 ab
LSD0.55 W4.2420.56.280.0147
Nitrogen X0.52070.37970.04760.52600.0005
01.62 a5.41 a7.91 a6.47 a0.0543 a
31.72 a5.01 a15.76 a10.09 a0.0490 a
62.05 a6.54 a29.40 a10.38 a0.0356 ab
121.70 a8.36 a34.56 a10.37 a0.0209 b
LSD0.845.6227.338.470.0203
Molybdenum Y0.00010.00300.00950.00300.0008
01.43 bc1.18 b13.73 b6.04 b0.0229 b
51.39 c4.30 b12.80 b6.40 b0.0357 ab
102.28 a9.13 a33.16 a13.19 a0.0524 a
201.99 ab7.72 ab27.93 ab11.68 ab0.0488 a
LSD0.581.1318.826.050.0201
SoMo*N0.71880.58790.68990.85140.0011
SoMo*Mo0.00970.00110.02240.00480.0094
N*Mo0.33470.75460.50630.98490.2249
SoMo*N*Mo0.14430.98910.98340.91640.0687
µ1.776.3321.919.330.03
C.V.61.29122.40161.29121.7194.54
R20.620.560.560.540.61
U Probability not significant Pr > 0.05, significant 0.05 ≤ Pr ≤ 0.01, highly significant Pr < 0.0001; V means with the same letter are statistically equal; W least significant difference; X Mm edaphic nitrogen concentration; Y leaf ppm concentration of molybdenum, overall average µ, CV coefficient of variation, R2 coefficient of determination; regression analysis: Linear L, Quadratic C, P N*Mo interaction. Total weight of fruit (TW), relative physiological contribution of fruits (RPC), physiological nitrogen requirement of fruits (PNRmg), relative nitrogen contribution of fruits (RNC%), productivity of fruit (fruits·mg-N).
Disclaimer/Publisher’s Note: The statements, opinions and data contained in all publications are solely those of the individual author(s) and contributor(s) and not of MDPI and/or the editor(s). MDPI and/or the editor(s) disclaim responsibility for any injury to people or property resulting from any ideas, methods, instructions or products referred to in the content.