Abstract
The availability of nitrogen in the soil is influenced by several factors associated with the forms and characteristics of organic nitrogen present in it, as well as by any property that impacts its microbiological and biochemical activity. The objective of the present work was to evaluate the combined effect of manure fertilization, soil type, and incubation time on soil N forms and availability. The experiment was conducted in a factorial scheme (2 soils × with (20 Mg ha−1) or without manure × 4 incubation times (15, 45, 90, and 180 days)). The levels of organic matter and fractions of organic N and mineral N were evaluated. Fertilization increased the organic matter and mineral N content in both soils, but the effect of fertilization on the organic N fractions was different depending on the type of soil. In the clayey soil, there was an accumulation of nitrogen in the unidentified hydrolysable fraction, whereas, in the sandy soil, the greatest increase occurred in the hydrolysable ammonium fraction. The application of manure generated different effects on the dynamics of N forms, depending on the type of soil. It is important to understand the impacts of different soil properties on the forms of nitrogen.
1. Introduction
The use of waste in agriculture stands out as a sustainable and efficient practice, providing benefits for both the environment and agricultural productivity. A notable example of this is the use of cattle manure as organic fertilizer. The potential for generating waste in animal husbandry is very high and, in Brazil, which has one of the largest cattle herds in the world [1], the manure is most commonly applied to the soil. This material constitutes a valuable source of macro and micronutrients for crops, in addition to improving microclimatic conditions and intensifying microbial activity in soils [2].
From the point of view of soil fertility and plant nutrition, the use of organic fertilizers reflects on the supply of nutrients, such as nitrogen (N), phosphorus (P), and potassium (K), as well as on the improvement of other chemical attributes related to the decrease in acidity and the increase in the organic matter content and cation exchange capacity (CEC) of the soil [3,4].
Of the nutrients that are released during manure mineralization, there is particular interest in N, due to the high production cost of industrialized nitrogen fertilizers and the high demand for this nutrient by plants. However, the dynamics of N from cattle manure in the soil is a complex process influenced by a series of factors, and it is essential to understand the interactions between soil characteristics, manure properties and contact time to optimize the use of this resource in agriculture [4,5,6]. The transformations of N in the soil are directly influenced by the physical, chemical and microbiological characteristics of the soil, and by the characteristics of the manure itself, especially the proportion of organic and mineral forms of N and the carbon/nitrogen (C/N) ratio [4].
The total N in manure consists, for the most part, of stable organic Mecules, which, after addition to the soil, need to be decomposed by microorganisms to originate the forms of N absorbed by plants (N-NH4+ and N-NO3−). However, manure constituents decompose at varying rates due to the different forms of organic N found in the residue. These forms can be relatively labile compounds, which cycle quickly, or very humified and recalcitrant Mecules, which cycle slowly, with a gradient between these extremes [5,7].
Nitrogen from manure is still redistributed between various forms in the soil. While part of the organic N in soils fertilized with manure is mineralized, another part may undergo transformations that improve stabilization, with an increase in the strength of the chemical bonds of the substances or by physical protection of the Mecules by clays. Furthermore, part of mineral N can be immobilized by microorganisms to form microbial tissue. These transformations, over time, have direct implications on the availability of nitrogen for cultivated plants, which can affect agricultural planning and the expected residual effect of manure. Therefore, the mineralization of the different forms of N contained in manure can vary from days to years and even millennia [8,9].
Despite being widely used, little is known about the transformations of N in soils fertilized with cattle manure. The study of organic N fractions and their transformations over time can help predict the availability of N for cultivated plants, including defining expected residual effects. In the present case, we worked with the hypothesis that N in manure, after going through a phase of rapid transformations, tends to accumulate in more stable but less available forms, particularly in clayey soils. Therefore, this work aimed to evaluate nitrogen transformations in cattle manure as a function of soil texture and contact time and to associate forms of organic N with potentially available N.
2. Materials and Methods
2.1. Soil and Manure Characterization
Samples were collected from two soils, in the 0 to 20 cm layer: a clayey Hapludox (LV), in a rubber tree cultivation area, in Jaboticabal-SP, at the Faculty of Agricultural and Veterinary Sciences (FCAV), and a sandy Hapludult (PVA) [10], in a mango orchard, in Monte Alto-SP. The climate was Cwa (humid subtropical, with a dry winter) according to the Koppen International classification system. In both situations, the soil was collected between the crop rows.
The LV and PVA were classified as Latossolo Vermelho and Argissolo Vermelho-Amarelo, according to Brazilian soil classification [11].
The soil samples were air-dried, crumbled, and passed through a 4 mm mesh sieve. From the total volume collected, a sample was obtained and passed through a 2 mm sieve to determine chemical attributes (Table 1), according to methods described in Raij et al. [12] and Cantarella and Trevelin [13].

Table 1.
Chemical attributes of soils used in the experiment.
Organic C was determined using wet oxidation and volumetric quantification of C. Soil pH was measured in 0.01 M CaCl2 solution at 1:2.5 soil/solution. Exchangeable K+ and Ca2+, Mg2+, and P were extracted with ion exchange resin and their concentrations of K+, Ca2+ and Mg2+ were determined using an atomic absorption spectrometer, whereas the concentration of P was determined using a spectrophotometer. Potential acidity at pH 7.0 (H + Al) was extracted by 0.5 M Ca acetate at pH 7 and determined by titration with 0.025 M NaOH solution. Cation exchange capacity (CEC) and base saturation (BS) were determined according to calculation.
The particle size was determined according to Camargo et al. [14], the total N, N-NH4+ and N-NO3− by Cantarella and Trevelin [13], and the N available by the direct steam distillation (DSD) method according to Roberts et al. [15]. Results are shown in Table 2.
Table 2.
Total N, mineral N, potentially mineralizable N, particle size and textural class of the soils used in the experiment.
The total N was obtained by the Kjeldahl method, and N-NH4+ was determined by distillation using MgO as alkalizer e o N-NO3− Devarda’s alloy. The N-DSD was determined by distilling the soil with 10 M NaOH.
The fractions of organic N hydrolysable N-NH4+ (N-HA), N-amino sugars (N-AS), N-amino acids (N-AA), unidentified N (N-HU), total hydrolysable N (N-HT) and acid-insoluble N (N-AI) were performed by the method described by Mulvaney and Khan, in which soil N is hydrolyzed in an acidic solution. Soil hydrolysates were obtained by treating 5 g soil samples with 20 mL of 6 M HCl and two drops of octyl alcohol in a 10-mL digestion tube stopped with a glass funnel and heated at 115 °C for 12 h. After heating, the suspension was filtered using Whatman no. 51 filter paper, and its acidity was neutralized by the addition of NaOH solution. The N forms were fractionated using diffusion techniques to determine total hydrolyzable N, hydrolyzable NH4+, NH4+ + amino sugar, and amino acid N contents [8] (Table 3).
Table 3.
Fractions of organic N in the soils were used in the experiment.
The manure used in the experiment was collected at the dairy cattle sector at FCAV (Jaboticabal-SP). The collected material underwent a stabilization process for approximately 6 months. After this period, the manure was dried, sieved through a 4 mm mesh, and sampled to determine chemical attributes. The pH was determined in water [16]; C and N by dry combustion in LECO® C/N628 equipment; N-NH4+ and N-NO3− [13]; available N by the direct steam distillation method (N-DSD) [15]; and fractions of organic N [17], hemicellulose, cellulose and lignin using the method described by Silva and Queiroz [18]. The results obtained on a dry basis were: pH 7.4; C 366 g kg−1; N 33 g kg−1; N-NH4+ 110 mg kg−1; N-NO3− 224 mg kg−1; N-DSD 1.572 mg kg−1; hydrolyzed N-NH4+ 1288 mg kg−1; N-AS 3.113 mg kg−1; N-AA 104 mg kg−1; N-HU 12,618 mg kg−1; N-TH 15,622 mg kg−1; N-AI 6282 mg kg−1; hemicellulose 110 g kg−1; cellulose 280 g kg−1; and lignin 172 g kg−1. The C/N ratio was 11, and the lignin/N ratio was 5.
2.2. Greenhouse Trail
The experiment was conducted following a factorial scheme combining the factors soil (LV and PVA) × fertilizer (control and 20 Mg ha−1 of cattle manure on a dry basis, which resulted in the application of 660 kg ha−1 of N) × time of contact between soil and fertilizer (15, 45, 90 and 180 days). A completely randomized design was used with four replications, totalling 64 plots.
The mass equivalent to 3.2 dm3 of each soil was weighed and placed in plastic bags. Based on soil analysis, acidity was corrected to reach a base saturation index value of 70%. Liming was carried out using pure calcium and magnesium carbonates, maintaining a Ca:Mg ratio of 3:1, mixed with the soil volume. After adding and mixing the amendments, the soil was transferred to pots with a capacity of 3.3 dm3, moistened to 60% of the water retention capacity, covered with paper and incubated in a greenhouse for 30 days for reaction of correctives. Humidity was maintained during this period.
After the end of incubation with acidity correctors, the soil was removed from the pots, dried, passed through a 4 mm mesh sieve and placed in plastic bags for fertilizer application. In treatments with the application of cattle manure, the manure was added and mixed at a dose equivalent to 20 Mg ha−1. To convert this dose, the volume of soil from the 0 to 20 cm deep layer was used.
After mixing the manure with the soil, the soil from all treatments was transferred again to the pots, remoistened to 60% of the water retention capacity, and placed to incubate in a greenhouse for the second time. The pots were placed randomly on the greenhouse bench and during the experiment they were moved to minimize environmental effects. During the soil incubation period, the pots were kept covered with paper and soil moisture was maintained as already described.
The incubation started with soil samples from the plots corresponding to the incubation time of 180 days. After 90, 135 and 165 days had elapsed since the beginning of the 180-day incubation period, the plots corresponding to times 90, 45 and 15 days were incubated, respectively. In this way, the end of incubation of the plots of all treatments occurred simultaneously.
2.3. Soil Analysis
After completion of the incubation period, the soil was removed from the pots, homogenized and air-dried. After drying, the soil was passed through a 4 mm mesh sieve, homogenized and sampled (around 0.4 dm3). In the soil samples, the following were determined: pH, total organic C [12], N-NH4+, N-NO3−, total N [13], and N potentially available by the direct steam distillation method [15], and the previously mentioned organic N fractions. A more detailed description of the methods can be found in item 2.3 of this article.
2.4. Statistical Analysis of Data
The data obtained were evaluated for normality of residues and homoscedasticity of variances, and then submitted to analysis of variance (F test) and regression to evaluate the effects of time on each fraction of N, the inorganic forms N-NH4+ and N-NO3−, N-DSD and other soil attributes (pH, organic C, and total N). The differences arising from each soil or fertilization with cattle manure in the variables evaluated were compared using the Tukey test (p < 0.05). N-DSD contents were correlated with organic N forms.
3. Results
The summary of the analysis of variance is found in Table 4. It is possible to observe whether there is significance in the effect of the treatments on all the variables studied in the present work, in addition to the coefficient of variation values.
Table 4.
Summary of the analysis of variance, with the values of calculated F and coefficient of variation for all dependent variables evaluated in the experiment, depending on the effect of soil factors, application of cattle manure, incubation time and combinations between these three factors.
3.1. Chemical Attributes of the Soil
The pH values increased, on average, 6% with the application of manure to clayey soil, and 9% to sandy soil (Table 5). During the incubation period, the pH in the clayey soil increased until the 70th day of incubation, followed by a decrease, and in the sandy soil, it decreased linearly (Figure 1A).
Table 5.
Values of pH CaCl2, organic C, total N, and potentially available N (N-DSD) contents of soils, depending on whether cattle manure was applied, as well as the soil-fertilizer reaction time.
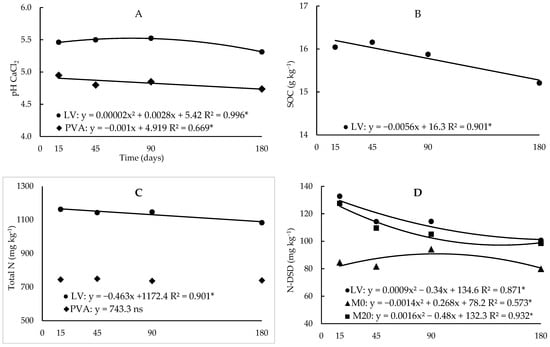
Figure 1.
Regression analysis between pH (A), soil organic carbon (B), total N (C) and N-DSD (D) values as a function of incubation time in the two soils (Hapludox-LV and Hapludult-PVA), and fertilization with cattle manure (doses of 0 and 20 Mg ha−1, M0 and M20, respectively). In the case of significant interaction with the time factor, only significant developments were presented. * and ns: significant at 5% probability and not significant, respectively.
The average content of organic C and total N were 16.5 and 52.6% higher in the LV soil compared to the PVA soil, respectively. For the N contents extracted using the DSD method, N-mineral, N-NO3− and organic N were higher in clayey soil compared to sandy soil, on average, 45%, 41%, 55% and 54%, respectively (Table 5 and Table 6).
Table 6.
Values of N-mineral, N-NH4+ and N-NO3− in soils, depending on whether cattle manure was applied and the soil-fertilizer reaction time.
As incubation time increased, organic C decreased linearly in clayey soil and was not changed in sandy soil (Figure 1B). In the clayey soil, the organic C content at the end of incubation returned to the initial condition (Table 1), because, probably, in the first assessments, C from the manure was added to the C in the soil.
In the average incubation times, the application of manure increased the total N content in the clayey soil (+13.5%), and there was no change in the sandy soil (Table 5), but from time 0 to time 180 days of incubation, total N decreased linearly in both soils (Figure 1C). The potentially available N contents assessed by the DSD method were not changed with the application of manure (Table 5). N-DSD in clayey soil, in the average of manure doses, showed quadratic behaviour throughout the incubation period, with a decrease in content until the 175th day (Figure 1D). With the application of manure, the behaviour of N-DSD, in the average soil, decreased until the 149th day of incubation, and without the application of manure, it increased until the 134th day (Figure 1D).
The N-NH4+ contents, opposite to what was observed with other forms of N, were higher in the sandy soil, on average, 14% (Table 6). The application of manure increased, on average, 12.7% of N-NH4+ levels in sandy soil, but there was no change in N-NH4+ in clayey soil. As for the N-NO3− and N-mineral (N-NH4+ + N-NO3−) contents, there was no increase in any of the soils (Table 6). The effect of incubation time was the same in both soils, with an increase in mineral N (Figure 2A) and accumulation of N-NO3− (Figure 2C) throughout the incubation period, and a decrease in N-NH4+ until close to 130 days (Figure 2B), due to the conversion of ammonium into nitrate during mineralization. With the application of manure, organic N increased, on average, 14% in the clayey soil (Table 6), as much of the N present in the manure was already in the form of organic N (98%) (Table 4).
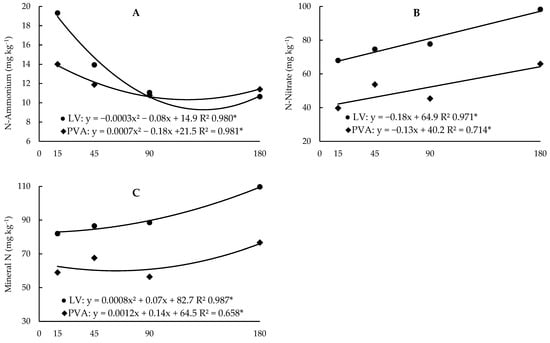
Figure 2.
Regression analysis between ammonium (A), nitrate (B) and mineral N (C) contents as a function of incubation time in the two soils (Hapludox-LV and Hapludult-PVA), and fertilization with cattle manure (doses of 0 and 20 Mg ha−1, M0 and M20, respectively). In the case of significant interaction with the time factor, only significant developments were presented. * and ns: significant at 5% probability and not significant, respectively.
3.2. Forms of Organic N in Soils
The N in the amino sugar, amino acid, total hydrolysable and acid-insoluble fractions was higher in clayey soil compared to sandy soil, regardless of other factors (Table 7). Only the N-HA and N-HU fractions were higher in the sandy soil compared to the clayey soil, on average, 15% and 25%, respectively (Table 7). In LV soil, manure application resulted in increases in all fractions, apart from the N-AI fraction. In the PVA soil, fertilization resulted in increases in N content only in the hydrolysable N-NH4+ and N-HU fractions, a decrease in the N-AS fractions and no effect on the N-AA and N-AI fractions (Table 7).
Table 7.
Contents of soil N fractions obtained by the acid hydrolysis method, depending on the type of soil, whether cattle manure was applied and the soil-soil-fertilizer reaction time.
Regarding the effect of incubation time on N fractions, there were several interaction effects with other factors (Figure 3 and Figure 4). In the unfertilized samples, there was a slight linear decrease, while in the fertilized plots there was an increase until 104 days of incubation, followed by a decrease (Figure 3A). In the N-AS fraction, despite being significant, the effect of time was not significant, with values being very close in all evaluations (Figure 3B). As for the N-AA fraction, the effect of time was significant only in the LV soil and in the plots fertilized with manure (Figure 3C). In both cases, there was a strong increase until days 112 and 115, followed by a decrease.
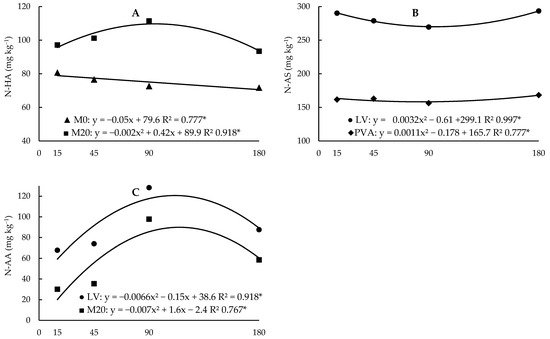
Figure 3.
Regression analysis between the contents of hydrolysable ammonium organic N fractions (A), amino sugars (B) and amino acids (C) as a function of incubation time in the two soils (Hapludox-LV and Hapludult-PVA), as well as fertilization with cattle manure (doses of 0 and 20 Mg ha−1, M0 and M20, respectively). In the case of significant interaction with the time factor, only significant developments were presented. * and ns: significant at 5% probability and not significant, respectively.
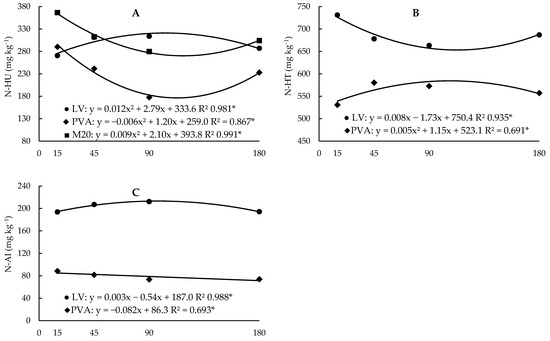
Figure 4.
Regression analysis between the contents of unidentified hydrolysable ammonium organic N fractions (A), total hydrolysable N (B) and acid-insoluble N (C) as a function of incubation time in the two soils (Hapludox-LV and Hapludult-PVA), and fertilization with cattle manure (doses of 0 and 20 Mg ha−1, M0 and M20, respectively). In the case of significant interaction with the time factor, only significant developments were presented. * and ns: significant at 5% probability and not significant, respectively.
The N-HU contents had opposite behaviour in the two soils, with LV having a strong decrease followed by a small increase close to the end of incubation, while in PVA there was a slight increase up to 115 days of incubation followed by a small decrease. (Figure 4A). When we consider the effect of the interaction between time and fertilizer dose, we observe that there was only an effect in fertilized plots, where there is a strong initial decrease followed by stabilization (Figure 4A). The effect of time on the N-HT and N-AI fractions was significant despite the little variation in the levels of these fractions (Figure 4B,C).
3.3. Relationships between N Forms and Soil Attributes
The N recovery rate in the various fractions analyzed about the total N determined by acid digestion ranged from 70 to 92% considering the two soils. Recovery was lower in clayey soil, from 70 to 88%, and higher in sandy soil, from 78 to 92%. The correlation between the total N determined by acid digestion and the total N obtained by the sum of N-HT and N-AI was high (r = 0.87), which indicates that there was proportional recovery of N from the manure in the fractions evaluated.
Total N showed a high correlation with pH (r = 0.87 **), organic C (r = 0.87 **), N-DSD (r = 0.77 **), mineral N (r = 0.68 **), N-NO3− (r = 0.68 **), N-AS (r = 0.91 **), N-AA (r = 0.78 **), N-HT (r = 0.71 **), and N-AI (r = 0.92 **), as well as low correlation for N-HA (r = −0.25 *). There was no correlation between N-total, N-HA and N-HU (Table 8). N-DSD showed weaker correlations with N-AA (r = 0.48 **) and N-AS (r = 0.66 **) and no correlation with N-HA. On the other hand, there was a stronger correlation with the sum of N-HA and N-AS (r = 0.74 **).
Table 8.
Correlation coefficients between pH, organic carbon content, N forms and fractions of soil.
When analyzing the data separating them by soil type, we can observe that the correlations between N forms behaved differently depending on the soil type (Table 8, Tables S1 and S2). In the LV soil, there was a strong correlation between the N-DSD and the N content in the N-HU fraction, while in the PVA, the N-DSD had a strong correlation only with the N-HA fraction.
4. Discussion
The increase in pH values may have occurred due to the neutralization effect of acidity by bicarbonate ions present in animal manure [19,20], as is the case with the manure used in this experiment. The increase in pH may also have occurred due to the reaction of H+ with organic acid anions, in the process called decarboxylation, which occurs during the microbial decomposition of organic material, and results in the consumption of H+ protons and the release of CO2, resulting in a gradual rise in pH as the waste decomposes [20]. The more intense increase in sandy soil is due to its lower buffering capacity, which implies less resistance to pH variation. The subsequent decrease in the pH of the two soils can be associated with the mineralization of organic N, which produces H+ in the NH4+ nitrification process since the decrease in pH was accompanied by the accumulation of N-NO3− [20].
As for the accumulation of soil organic matter (SOM) due to organic fertilization, this is an expected effect and has already been extensively described in the literature [21]. The difference between the soils was due to the higher initial SOM content and the higher clay content, which results in greater protection of organic compounds from microbial attack [22]. The effect of time, despite being significant in LV, did not result in a significant decrease. Total N and N-DSD contents followed the same trend as SOM contents, regarding the effects of soil and organic fertilizer. This is due to the strong correction between these attributes [23].
N-DSD corresponds to N in the forms of N-HA, N-AS and part of N-AA, in smaller quantities [15]. Therefore, the increase or decrease in N-DSD must be associated, in principle, with the increase or decrease in the aforementioned N forms. However, in the PVA soil, fertilization increased the N-DSD content simultaneously with the decrease in the N-AS fraction, indicating that the processes that lead to the accumulation of N in each fraction, as well as their effects on availability, are different depending on the type of soil [24].
The higher N-NH4+ contents in sandy soil (PVA) can be explained by the lower pH value in this soil, which disfavors nitrification, with a consequent greater accumulation of N-NH4+ about LV [25,26]. Despite this effect, in both soils N-NO3− was the predominant form of mineral N, indicating that nitrification occurred even under conditions of high acidity. The N-min and N-NO3− contents increased with the incubation time, an effect justified by the fact that the incubation of the vessels occurred in a closed system, where losses due to leaching (there was no percolation), volatilization and absorption were possibly low. Thus, N-min tends to accumulate, mainly in the nitric form, since there is no restriction on nitrification [26]. The nitrification process also explains the decrease in N-NH4+ levels as a function of time.
The distribution of N in the different fractions evaluated was different in the two soils, and in LV, the highest levels were observed in the fractions N-AS, N-HU and N-AI. Although the N-AS fraction is considered the main reservoir of N potentially available in the soil, the N-HU and N-AI fractions are considered unavailable [17,24]. In PVA, the N-HU and N-AS fractions stand out for their high levels, and the N-AA fraction for its much lower value. The accumulation of N in the different fractions of soil organic N varies between soils, and this variation depends on other soil attributes. Thus, both the contents and their contribution to the potentially mineralizable N of each fraction may be different in each soil [24].
In LV, fertilization increased the content of all acid-hydrolyzable fractions (Table 7), which are considered, except the N-HU fraction, as potentially available [8,27]. In PVA, there was a different effect, with more significant increases in the N-HA, N-HU and N-AI fractions, and a decrease in the N-AS fraction, which suggests that each soil has more relevant fractions in the dynamics of N transformations. This can also be observed in the different correlations between the fractions of organic N and the other properties evaluated, which were different for each type of soil (Tables S1 and S2).
The linear decrease in N-HA in soils not fertilized with manure indicates that this fraction may have been the main source of mineralized N after the start of incubation since this effect was only observed in this fraction and coincided with the increase in N-min contents. The initial phase of microbial attack on organic waste is characterized by rapid losses of readily decomposable organic substances. Depending on the nature of the soil microflora and the amount of C (and N) in the substrate, 10% to 70% of the C can be used for cellular synthesis [9]. Proteins and simple biochemical compounds, such as sugars and amino acids, break down quickly, while cell walls and certain microbial melanins resist decomposition [9]. The increase up to the 95th day of incubation in the soils that received residue application may be associated with favouring the N immobilization process due to the availability of N from manure, which is used by microorganisms to form microbial tissue.
The N-AS fraction is intermediate in degradation between N-HA, which is more labile, and N-AA, which is less labile [28], and it is the fraction that best differentiates soils cultivated with corn or sugarcane regarding the potential response to nitrogen fertilization [28,29]. Mulvaney et al. [29] used 18 soils from the United States cultivated under different management systems and determined that soils with N-AS contents greater than 250 mg kg−1 were non-responsive, while soils with less than 200 mg kg−1 were responsive to nitrogen fertilizer. In this way, the mineralization of compounds from this fraction increases the supply of mineral N to plants, and results in a non-response to nitrogen fertilizer. Studies using soils from the same region from which both LV and PVA samples were taken show that the contribution of each N fraction to the potentially available N varies greatly among different soils, depending on the contents of each fraction, other physical-chemical characteristics and those related to management [24,30,31].
As for the N-AA fraction, the values observed in PVA were very low, with irrelevant levels considering the total N of this soil. This result differs from that observed in LV and other studies where this fraction always represented a large part of the total N in the soil [24]. This result highlights the distinct behaviour of the two soils, although the processes they lead to are not yet elucidated. However, we can infer that in both soils, the N-AA fraction does not affect the N-DSD content, used in this study as a measure of potentially available N [24,27].
The increase in N-HU levels occurred because the manure contained a large amount of N-HU, which represented more than half of the total N obtained by the sum of the fractions N-HA, N-AS, N-AA, N-HU, and N-AI from manure (Table 3). This fraction includes hydrolysable compounds, such as traces of nucleic acids and other nitrogenous biochemical products that are not identified because they require specific techniques for their separation and identification, and which present greater difficulty in degradation among the hydrolysable fractions [32]. With the application of manure to the soil, the N that is in unidentified form begins to be decomposed by microorganisms, causing this N to change into mineral form or be redistributed into other fractions (Table 6 and Table 7). After 117 days of incubation, there was a small increase in the levels of this fraction, which may be due to a decrease in the mineralization of N-HU from manure, and synthesis processes began to predominate.
The availability of N varies with the chemical characteristics of organic residues in terms of the C/N and lignin/N ratio, which vary with the animal’s management standards, age, feeding and feed conversion [32]. The C/N ratio of the manure used in this work, lower than 20, as well as the lignin/N ratio, lower than 6.5, favours N mineralization [33].
N-DSD showed weaker correlations with N-AA (r = 0.48 **) and N-AS (r = 0.66 **), and no correlation with N-HA. On the other hand, when the soils were evaluated separately, there was a stronger correlation with N-HA in PVA and N-HU in LV. With the DSD method, the forms of N-NH4+, amino sugars and a small part of the amino acids in the soil are quantified and, in this way, it was expected to obtain a strong correlation between these fractions. On the other hand, a weaker correlation with N-amino acids was expected due to the method quantifying only a small part of the soil amino acids.
N-DSD also showed a correlation with organic C (r = 0.80 **) and total N (r = 0.77 **), which was expected, since the objective is to extract easily degradable chemical compounds that represent a subfraction of the total soil organic matter. Ross et al. [33] also obtained a correlation between mineralized N measured in an incubation test with total organic C and suggested that fertilizer recommendation systems that use an estimate of mineralizable N should, at least, rely on a soil variable that reflects the size of the organic matter reservoir.
5. Conclusions
The results of this work demonstrate that the dynamics of N forms differ greatly from one type of soil to another. The application of manure resulted in different dynamics in the two soils, mainly increasing the unidentified hydrolysable N (N-HU) fraction in Hapludox and the hydrolysable ammonium N (N-HA) fraction in Hapludult. The statement that the N-AA and N-AS fractions are the most relevant for availability is not unanimous for all soils. The content and correlations of these fractions with other soil attributes varied greatly from one soil to another, which suggests that other soil properties act in a more relevant way in the distribution and dynamics of these forms of N. This also impacts the contribution of each fraction to the availability of N in the soil. It is necessary to identify the factors associated with the accumulation and mineralization processes of N in each fraction so that we can carry out a more accurate interpretation of these results and so that we can indicate practices and management that result in an increase in N in forms that can be used by plants.
Supplementary Materials
The following supporting information can be downloaded at: https://www.mdpi.com/article/10.3390/nitrogen5010007/s1, Table S1: Correlation coefficients between pH, organic carbon content and the forms and fractions of N in clayey soil (LV); Table S2: Correlation coefficients between pH, organic carbon content and the forms and fractions of N in sandy soil (PVA).
Author Contributions
Conceptualization, C.R.A., M.C.P.d.C. and L.B.B.; methodology, C.R.A. and M.C.P.d.C.; software, L.B.B.; validation, M.E.F. and M.C.P.d.C.; formal analysis, C.R.A.; investigation, C.R.A., R.S.C. and L.B.B.; data curation, R.S.C. and L.B.B.; writing—original draft, C.R.A.; writing—review and editing, R.S.C., L.B.B., M.E.F. and M.C.P.d.C.; supervision, M.E.F.; project administration, M.E.F.; funding acquisition, M.C.P.d.C. All authors have read and agreed to the published version of the manuscript.
Funding
This study was partially funded by the Coordenação de Aperfeiçoamento Pessoal de Nível Superior (CAPES), project number 001 and São Paulo Research Foundation (FAPESP) grant #2014/11466–3.
Data Availability Statement
The data presented in this study are available on request from the corresponding author.
Conflicts of Interest
The authors declare no conflicts of interest.
References
- Martins, M.M.; Spolador, H.F.S.; Njuki, E. Production Environment and Managerial Techniques in Explaining Productivity Growth in Brazilian Beef Cattle Production. Agribusiness 2022, 38, 371–385. [Google Scholar] [CrossRef]
- Dalias, P.; Christou, A. Nitrogen Supplying Capacity of Animal Manures to the Soil in Relation to the Length of Their Storage. Nitrogen 2020, 1, 52–66. [Google Scholar] [CrossRef]
- Chen, M.; Wang, X.; Ding, X.; Liu, L.; Wu, L.; Zhang, S. Effects of Organic Fertilization on Phosphorus Availability and Crop Growth: Evidence from a 7-Year Fertilization Experiment. Arch. Agron. Soil Sci. 2023, 69, 2092–2103. [Google Scholar] [CrossRef]
- Impraim, R.; Weatherley, A.; Chen, D.; Suter, H. Effect of Lignite Amendment on Carbon and Nitrogen Mineralization from Raw and Composted Manure during Incubation with Soil. Pedosphere 2022, 32, 785–795. [Google Scholar] [CrossRef]
- Aranguren, M.; Castellón, A.; Besga, G.; Ojinaga, M.; Aizpurua, A. Influence of Wheat Crop on Carbon and Nitrogen Mineralization Dynamics after the Application of Livestock Manures. Geoderma 2021, 402, 115351. [Google Scholar] [CrossRef]
- Miranda-Vélez, J.F.; Vogeler, I. Exploring Temperature-Related Effects in Catch Crop Net N Mineralization Outside of First-Order Kinetics. Nitrogen 2021, 2, 110–127. [Google Scholar] [CrossRef]
- Whalen, J.K.; Thomas, B.W.; Sharifi, M. Novel Practices and Smart Technologies to Maximize the Nitrogen Fertilizer Value of Manure for Crop Production in Cold Humid Temperate Regions. Adv. Agron. 2019, 153, 1–85. [Google Scholar] [CrossRef]
- Mulvaney, R.L.; Khan, S.A. Diffusion Methods to Determine Different Forms of Nitrogen in Soil Hydrolysates. Soil Sci. Soc. Am. J. 2001, 65, 1284–1292. [Google Scholar] [CrossRef]
- Stevenson, F.J. Nitrogen-Organic Forms. In Methods of Soil Analysis Part 3—Chemical Methods; Sparks, D.L., Ed.; Soil Science Society of America: Madison, WI, USA, 1996; pp. 1185–1200. [Google Scholar]
- Soil Survey Staff. Keys to Soil Taxonomy, 12th ed.; USDA-NRCS: Washington, DC, USA, 2014; ISBN 0926487221.
- Embrapa. Sistema Brasileiro de Classificação de Solos, 3rd ed.; dos Santos, H.G., Jacomine, P.K.T., Anjos, L.H.C., dos Oliveira, V.Á., de Lumbreras, J.F., Coelho, M.R., de Almeida, J.A., Cunha, T.J.F., de Oliveira, J.B., Eds.; Embrapa: Brasília, Brazil, 2013; ISBN 85-85864-19-2. [Google Scholar]
- Raij, B.V.; Andrade, J.C.; Cantarella, H.; Quaggio, J.A. Análise Química Para Avaliação Da Fertilidade de Solos Tropiciais; van Raij, B., de Andrade, J.C., Cantarella, H., Quaggio, J.A., Eds.; Instituto Agronômico: Campinas, Brazil, 2001. [Google Scholar]
- Cantarella, H.; Trivelin, P.C.O. Determinação de Nitrogênio Inorgânico Em Solo Pelo Método Da Destilação a Vapor. In Análise Química para Avaliação da Fertilidade de Solos Tropicais; van Raij, B., Cantarella, H., Quaggio, J.A., Eds.; Instituto Agronômico de Campinas: Campinas, Brazil, 2001; pp. 270–276. [Google Scholar]
- Camargo, O.A.; Moniz, A.C.; Jorge, J.A.; Valadares, J.M.A.S. Métodos de Análise Química, Mineralógica e Física de Solos Do Instituto Agronômico de Campinas; Instituto Agronômico: Campinas, Brazil, 2009; Volume 106. [Google Scholar]
- Roberts, T.L.; Norman, R.J.; Slaton, N.A.; Wilson, C.E.; Ross, W.J.; Bushong, J.T. Direct Steam Distillation as an Alternative to the Illinois Soil Nitrogen Test. Soil Sci. Soc. Am. J. 2009, 73, 1268–1275. [Google Scholar] [CrossRef]
- Brasil Instrução Normativa SDA N° 28, de 27 de Julho de 2007. In Diário Oficial da União; Imprensa Nacional: Brasília, Brazil, 2007; p. 11.
- Mulvaney, R.L.; Khan, S.A.; Hoeft, R.G.; Brown, H.M. A Soil Organic Nitrogen Fraction That Reduces the Need for Nitrogen Fertilization. Soil Sci. Soc. Am. J. 2001, 65, 1164–1172. [Google Scholar] [CrossRef]
- de Campos, F.P.; Nussio, C.M.B.; Nussio, L.G. (Eds.) Métodos de Análise de Alimentos; FEALQ: Piracicaba, Brazil, 2004. [Google Scholar]
- Braos, L.B.; Carlos, R.S.; Bettiol, A.C.T.; Bergamasco, M.A.M.; Terçariol, M.C.; Ferreira, M.E.; da Cruz, M.C.P. Soil Carbon and Nitrogen Forms and Their Relationship with Nitrogen Availability Affected by Cover Crop Species and Nitrogen Fertilizer Doses. Nitrogen 2023, 4, 85–101. [Google Scholar] [CrossRef]
- Liu, S.; Wang, J.; Pu, S.; Blagodatskaya, E.; Kuzyakov, Y.; Razavi, B.S. Impact of Manure on Soil Biochemical Properties: A Global Synthesis. Sci. Total Environ. 2020, 745, 141003. [Google Scholar] [CrossRef] [PubMed]
- Whalen, J.K.; Chang, C.; Clayton, G.W.; Carefoot, J.P. Cattle Manure Amendments Can Increase the PH of Acid Soils. Soil Sci. Soc. Am. J. 2000, 64, 962–966. [Google Scholar] [CrossRef]
- Maillard, É.; Angers, D.A. Animal Manure Application and Soil Organic Carbon Stocks: A Meta-analysis. Glob. Chang. Biol. 2014, 20, 666–679. [Google Scholar] [CrossRef] [PubMed]
- Castellano, M.J.; Mueller, K.E.; Olk, D.C.; Sawyer, J.E.; Six, J. Integrating Plant Litter Quality, Soil Organic Matter Stabilization, and the Carbon Saturation Concept. Glob. Chang. Biol. 2015, 21, 3200–3209. [Google Scholar] [CrossRef]
- Braos, B.B.; Ferreira, M.E.; da Cruz, M.C.P.; Braos, L.B.; Barbosa, J.C. Mild and Moderate Extraction Methods to Assess Potentially Available Soil Organic Nitrogen. Rev. Bras. Ciência Solo 2016, 40, e0151059. [Google Scholar] [CrossRef]
- Braos, L.B.; Carlos, R.S.; Kuhnen, F.; Ferreira, M.E.; Mulvaney, R.L.; Khan, S.A.; Cruz, M.C.P. Predicting Soil Nitrogen Availability for Maize Production in Brazil. Nitrogen 2022, 3, 555–568. [Google Scholar] [CrossRef]
- Sahrawat, K.L. Factors Affecting Nitrification in Soils. Commun. Soil Sci. Plant Anal. 2008, 39, 1436–1446. [Google Scholar] [CrossRef]
- Bergamasco, M.A.M.; Braos, L.B.; Guidini Lopes, I.; Cruz, M.C.P. Nitrogen Mineralization and Nitrification in Two Soils with Different PH Levels. Commun. Soil Sci. Plant Anal. 2019, 50, 2873–2880. [Google Scholar] [CrossRef]
- Roberts, T.L.; Norman, R.J.; Slaton, N.A.; Wilson, C.E. Changes in Alkaline Hydrolyzable Nitrogen Distribution with Soil Depth: Fertilizer Correlation and Calibration Implications. Soil Sci. Soc. Am. J. 2009, 73, 2151–2158. [Google Scholar] [CrossRef]
- Otto, R.; Mulvaney, R.L.; Khan, S.A.; Trivelin, P.C.O. Quantifying Soil Nitrogen Mineralization to Improve Fertilizer Nitrogen Management of Sugarcane. Biol. Fertil. Soils 2013, 49, 893–904. [Google Scholar] [CrossRef]
- Khan, S.A.; Mulvaney, R.L.; Hoeft, R.G. A Simple Soil Test for Detecting Sites That Are Nonresponsive to Nitrogen Fertilization. Soil Sci. Soc. Am. J. 2001, 65, 1751. [Google Scholar] [CrossRef]
- Bettiol, A.C.T.; Braos, L.B.; Lopes, I.G.; Andriolli, I.; Ferreira, M.E.; Cruz, M.C.P. Evaluation of Potentially Available Nitrogen by Biological and Chemical Methods in Soil Cultivated with Maize in Succession to Cover Crops. J. Plant Nutr. 2021, 45, 1919–1932. [Google Scholar] [CrossRef]
- Stevenson, F. Humus Chemistry; John Willet & Sons: New York, NY, USA, 1994; ISBN 9780471594741. [Google Scholar]
- Ros, G.H.; Hanegraaf, M.C.; Hoffland, E.; van Riemsdijk, W.H. Predicting Soil N Mineralization: Relevance of Organic Matter Fractions and Soil Properties. Soil Biol. Biochem. 2011, 43, 1714–1722. [Google Scholar] [CrossRef]
Disclaimer/Publisher’s Note: The statements, opinions and data contained in all publications are solely those of the individual author(s) and contributor(s) and not of MDPI and/or the editor(s). MDPI and/or the editor(s) disclaim responsibility for any injury to people or property resulting from any ideas, methods, instructions or products referred to in the content. |
© 2024 by the authors. Licensee MDPI, Basel, Switzerland. This article is an open access article distributed under the terms and conditions of the Creative Commons Attribution (CC BY) license (https://creativecommons.org/licenses/by/4.0/).