Article

The First Reaction Steps of Lithium-Mediated Ammonia Synthesis: Ab Initio Simulation

by
Dominykas Maniscalco
1,
Dominik A. Rudolph
1,
Ebrahim Nadimi
1,2 and
Irmgard Frank
1,*
1
Theoretical Chemistry, Leibniz University Hannover, Callinstr. 3A, 30167 Hannover, Germany
2
Faculty of Electrical Engineering, K. N. Toosi University of Technology, P.O. Box 16315-1355, Tehran 1996715433, Iran
*
Author to whom correspondence should be addressed.
Nitrogen 2022, 3(3), 404-413; https://doi.org/10.3390/nitrogen3030026
Submission received: 25 May 2022 / Revised: 22 June 2022 / Accepted: 27 June 2022 / Published: 4 July 2022

Abstract

:
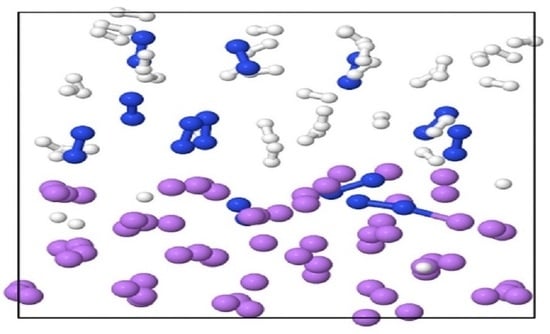
The reaction of molecular nitrogen with molecular hydrogen was simulated using ab initio molecular dynamics. The reaction was catalyzed by the addition of bulk lithium and oxygen. As is known from the experiment, the limiting step is the breaking of the nitrogen–nitrogen triple bond. We observed a mechanism that has not been discussed before: one of the nitrogen atoms of a nitrogen molecule is absorbed by the lithium bulk, whereas the other nitrogen atom reacts with hydrogen. Adding oxygen leads to a dominating reaction of oxygen with the lithium surface. The oxygen molecules break easily into single atoms and are, in part, absorbed by the lithium structure. Part of them remains on the surface and reacts with hydrogen. In this way, hydrogen is activated and can, in turn, react easily with molecular nitrogen. The overall reactivity as observed in the ab initio simulations reflects the extremely low density of lithium. Interstitial sites are readily occupied, leading to oxide and nitride structures.

Graphical Abstract

1. Introduction

The formation of ammonia from the elements is a technologically important reaction [1,2].
3 H 2 + N 2 2 NH 3 , Δ f H = 46 kJ / mol
The reaction is exothermic [3]. However, there is a huge barrier for the breaking of the N-N triple bond. In industry, the Haber–Bosch process is normally employed, which requires high pressures and high temperatures with iron as a catalyst. These extreme conditions result in a large CO 2 footprint. There is renewed interest in the ammonia formation as neither educt nor product contain or react to carbondioxide [4,5,6]. This renewed interest is accompanied by more recent developments concerning reaction parameters and catalysts. For example, the lithium-mediated ammonia synthesis was investigated experimentally [7,8,9]. Remarkably, metallic lithium is able to split the nitrogen triple bond at ambient conditions [9]. The formation of Li 3 N is considered to be the first reaction step. Surprisingly, an enhancement of the reaction by addition of oxygen was observed [10] which seems to be counter-intuitive: In the Haber-Bosch synthesis removal of oxygen is important. One would expect that oxygen poisons the lithium surface, reducing its ability to react with other species.
In the present study, we use Car-Parrinello molecular dynamics (CPMD), a method that belongs to the class of ab-initio molecular dynamics (AIMD) methods, to simulate the first reaction steps in this complex system. CPMD is a still-underestimated approach for the simulation of chemical reactions [11,12], in particular for surface reactions, see for example, refs. [13,14]. AIMD was applied before to the simulation of lithium ions in electrochemical setups [15], but not in reactive simulations showing the lithium-mediated reaction mechanism of N 2 and H 2 .
CPMD solves the problem of how to describe nuclear motion in a very simple way, namely by using the classical approach as it is known from classical molecular dynamics (or force-field) calculations. The electronic structure is described quantum mechanically using density functional theory (DFT). The motion of the system is described semi-classically using the Car-Parrinello equations [11]. The electronic cloud follows the motion of the nuclei in every time step. With time steps of approximately 0.1 fs, it is possible to describe the dynamics of molecular systems on the scale of a few ps and of a few nm 3 . Chemical reactions are rare events and it is difficult to model them in a meaningful way. In particular, it is desirable to construct an equilibrated system with a well-defined temperature before observing reactions. Obtaining such equilibrated systems is often not easy or is even impossible. Equilibrated systems are characterized by a Maxwell–Boltzmann distribution of velocities that determines the temperature of the system. Fortunately, such a Maxwell–Boltzmann distribution develops quickly, typically within 0.1–0.2 ps, as it is the most likely distribution. Ideally, during this time, the system should be chemically stable. In contrast, during the production run, one would like to observe chemical reactions. The accuracy of the results and the computational cost are highly correlated to the density functional, which is used to approximate the quantum mechanical interaction between the electrons. A favourable cost–value ratio is obtained only for pure generalized gradient approximation (GGA) functionals, such as BLYP. The more accurate hybrid B3LYP method, using a mixture of BLYP exchange with Hartree-Fock exchange plus some admixture of BLYP correlation, is hardly affordable. Hence, the normal procedure is to perform CPMD simulations and to compute the observed reaction intermediates and products in a second step using more accurate approaches. This option, however, is very limited in the case of condensed phase simulations. Most quantum chemical approaches are not implemented with periodic boundary conditions as would be needed for describing a solid or liquid phase. In difficult situations, such as highly reactive systems with many possible reaction pathways, there is no alternative to trusting the results obtained with the Car–Parrinello molecular dynamics code. If we cannot perform further computational checks, Car–Parrinello simulations can merely assist in the intuition of a chemist to explain all of the steps involved in a complex mechanism. CPMD has the advantage that it is possible to test all potential reaction pathways at once. A disadvantage is that chemical reactions are rare events and may not be observed on the picosecond timescale. To overcome this gap, we use very high temperatures.

2. Results and Discussions

In the beginning the performance of the lithium Troullier–Martins pseudopotential and the BLYP functional were checked by varying the size of the unit cell. We found a favorable agreement with a deviation of less than one percent from the experimental value (see the Supplementary Materials, Figure S1).
The simulation protocols are listed in Table 1. We performed simulations for different compositions and temperatures. We started with an equilibration of a pure lithium (100) surface containing four lithium layers. In simulation 1 the stability of the slab was tested. We chose the (100) surface because it is most easily to prepare and to understand and has a similar surface energy as the (111) and (110) surfaces.
In summary, in simulations 3 to 13, the beginning of the formation of lithium nitride species was observed for the system without oxygen. In the simulations 20 and 23, the presence of oxygen enhances the N-H formation, while in simulations 10, 11, and 24 N-H formation occurs without the interaction with oxygen.
In detail: in simulation 1 we find only minor reconstructions (Figures S2 and S3 in the Supplementary Materials). The system relaxes in z direction only. For the distance of the outer two lithium layers the bulk value (1.756 Angstrom) is reduced to 1.660 Angstrom. The distance to the inner layer relaxes even more strongly to 1.378 Angstrom.
While this structure is perfectly stable, we observe a fast reaction if we add nitrogen and hydrogen molecules (Figure 1).
Hereby, it is the nitrogen molecules that react the most strongly with the surface. In contrast to the behavior of molecules in contact with oxidic surfaces [13,14,15,16], we observed that the metallic lithium surface ’swallows’ the nitrogen molecules within a few picoseconds. In most cases, this leads to an elongation of the nitrogen–nitrogen bond. In most simulations, the complete dissociation of at least one nitrogen molecule was observed. In simulation 2 (see the Supplementary Materials, Figures S4–S6), an undissociated nitrogen molecule is integrated into the lithium bulk, forming a characteristic structure with D3h symmetry (Figure 2). The two nitrogen atoms are surrounded by nine lithium atoms. The three lithium atoms in the middle of the arrangement are coordinated with both nitrogen atoms; hence, each nitrogen atom is coordinated by six lithium atoms. The nitrogen–lithium distances are all in the range of 1.9–2.1 Angstrom, with the distances to the inner nitrogen atoms being a little bit longer, by approximately 0.1 Angstrom on average. The nitrogen–nitrogen bond is elongated to values of approximately 1.7–1.8 Angstrom, but, in this particular simulation, it did not break (Figure 2).
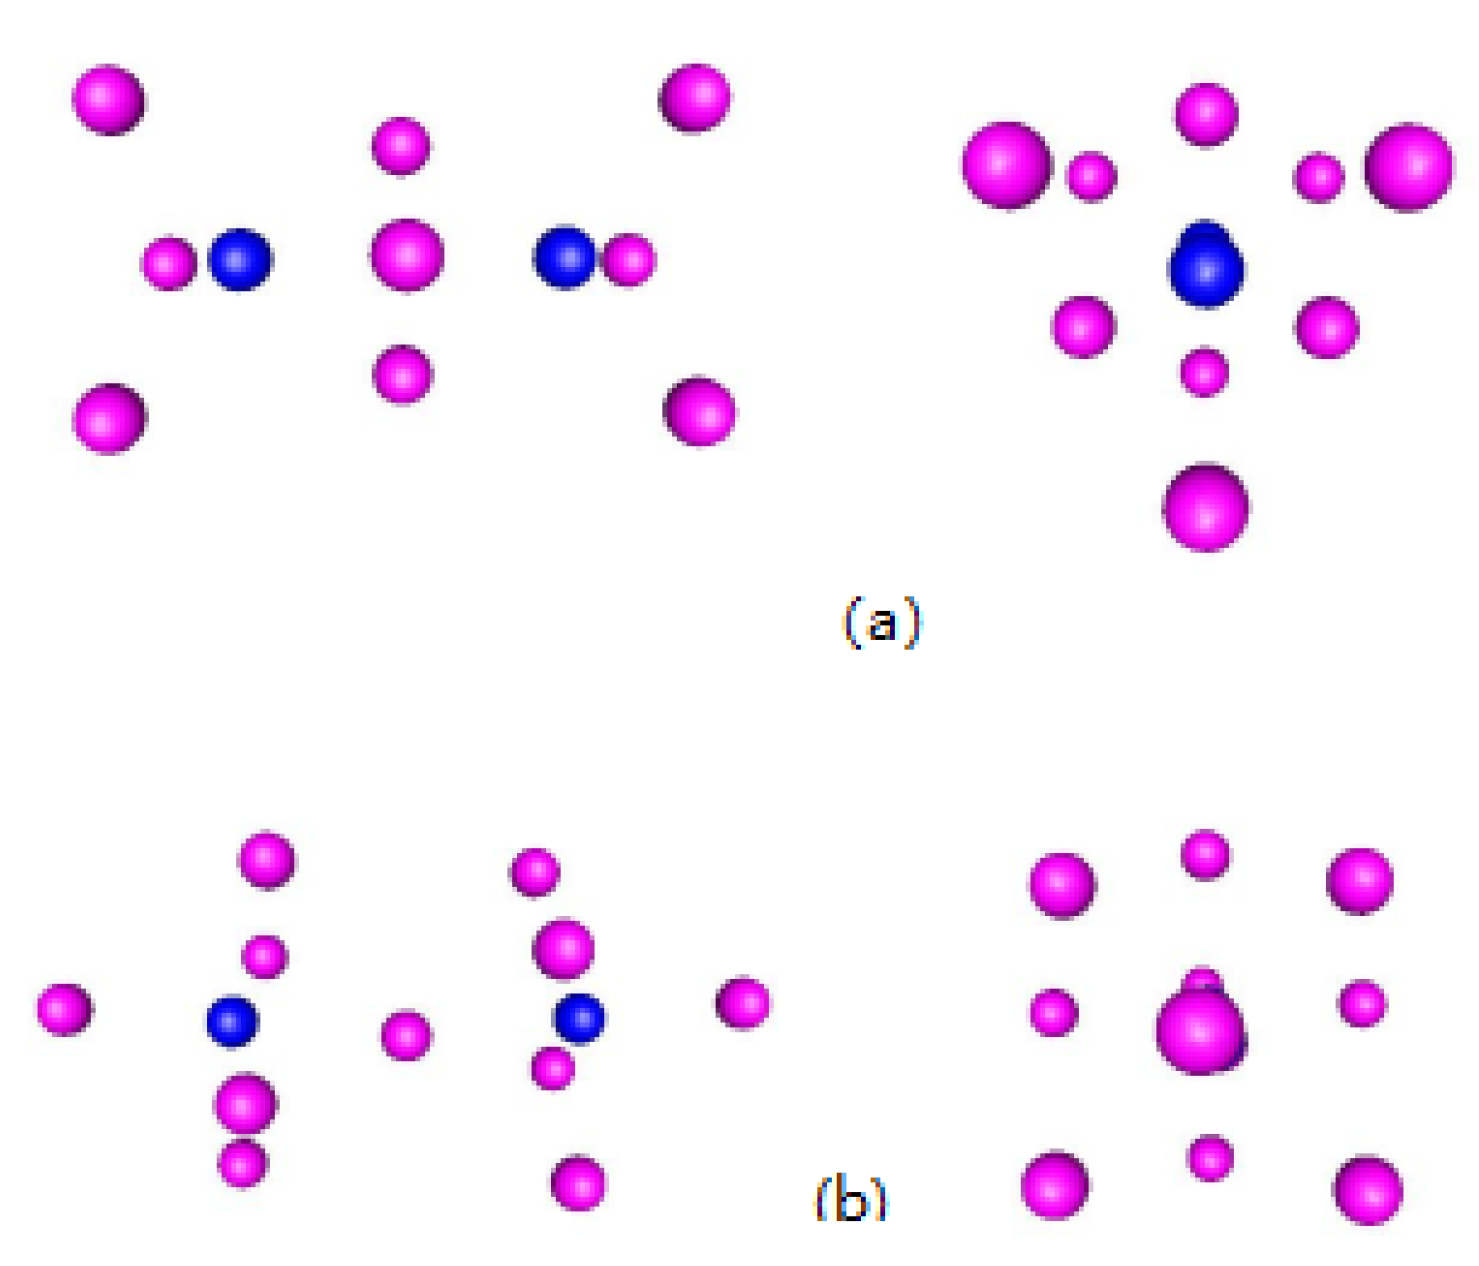
It is possible to optimize this Li 9 N 2 structure in vacuo and to perform a method comparison for this system (Figure 3 and Table 2). All methods agree well. MP2 shows the largest deviations from the most powerful double-hybrid B2PLYP calculations (Table 2). In particular, the BLYP values are close to that obtained with the much more expensive, but also much more accurate, B2PLYP and CCSD calculations. Dispersion corrections lead to no improvement. The comparison supports the validity of BLYP for the condensed-phase simulations. In contrast to the situation in the bulk, the N-N distance is large enough to be considered as broken. Nevertheless, all methods converge to a perfect D3h structure. Hence, as a consequence of nitrogen interacting with the lithium surface, we obtained a very well-defined structure with strong bonds that is floating in the almost-liquid lithium surrounding.
This also accounts for structures that result from the breaking of a nitrogen bond. A Li 11 N 2 structure, as formed in the simulations, can be optimized without the Li surrounding. The result is close to D4d symmetry (Figure 3 and Table 3). While lithium is a ductile metal, these lithium–nitride clusters have a well-defined structure, whereby the deviations from the perfect symmetry are larger for Li 11 N 2 than for Li 9 N 2 ; see Table 3.
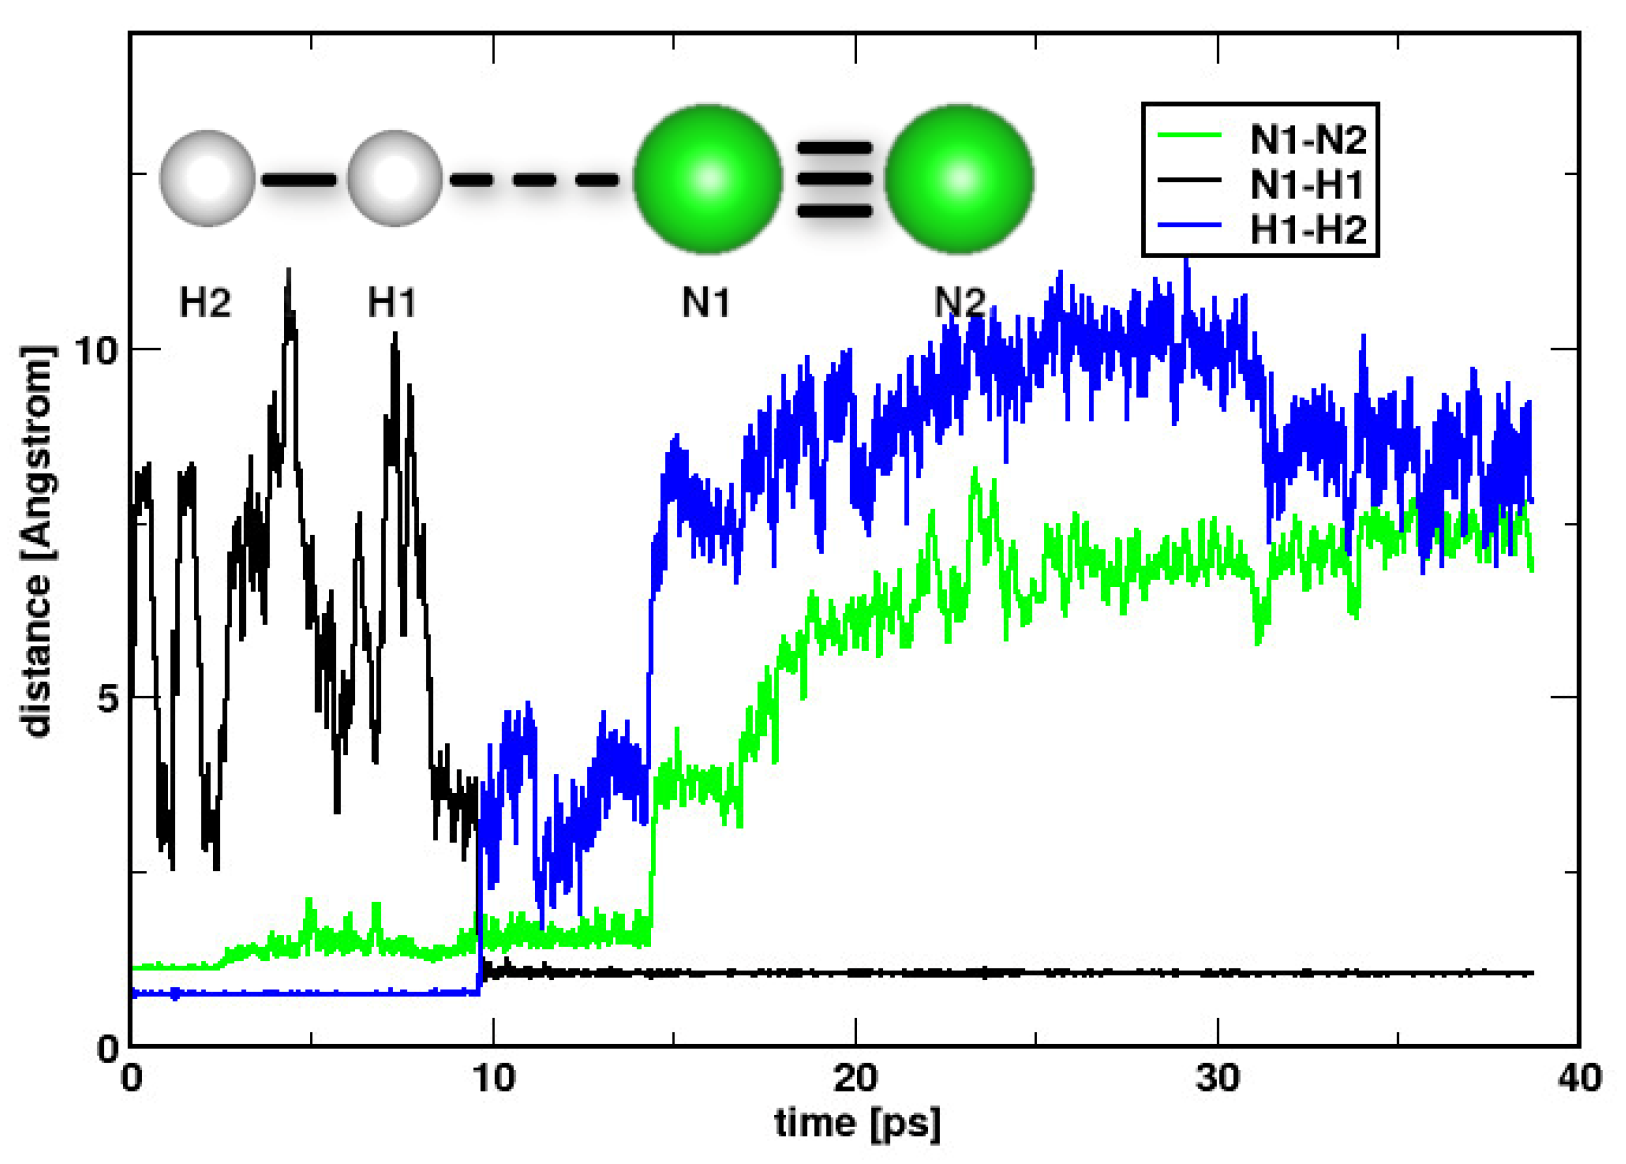
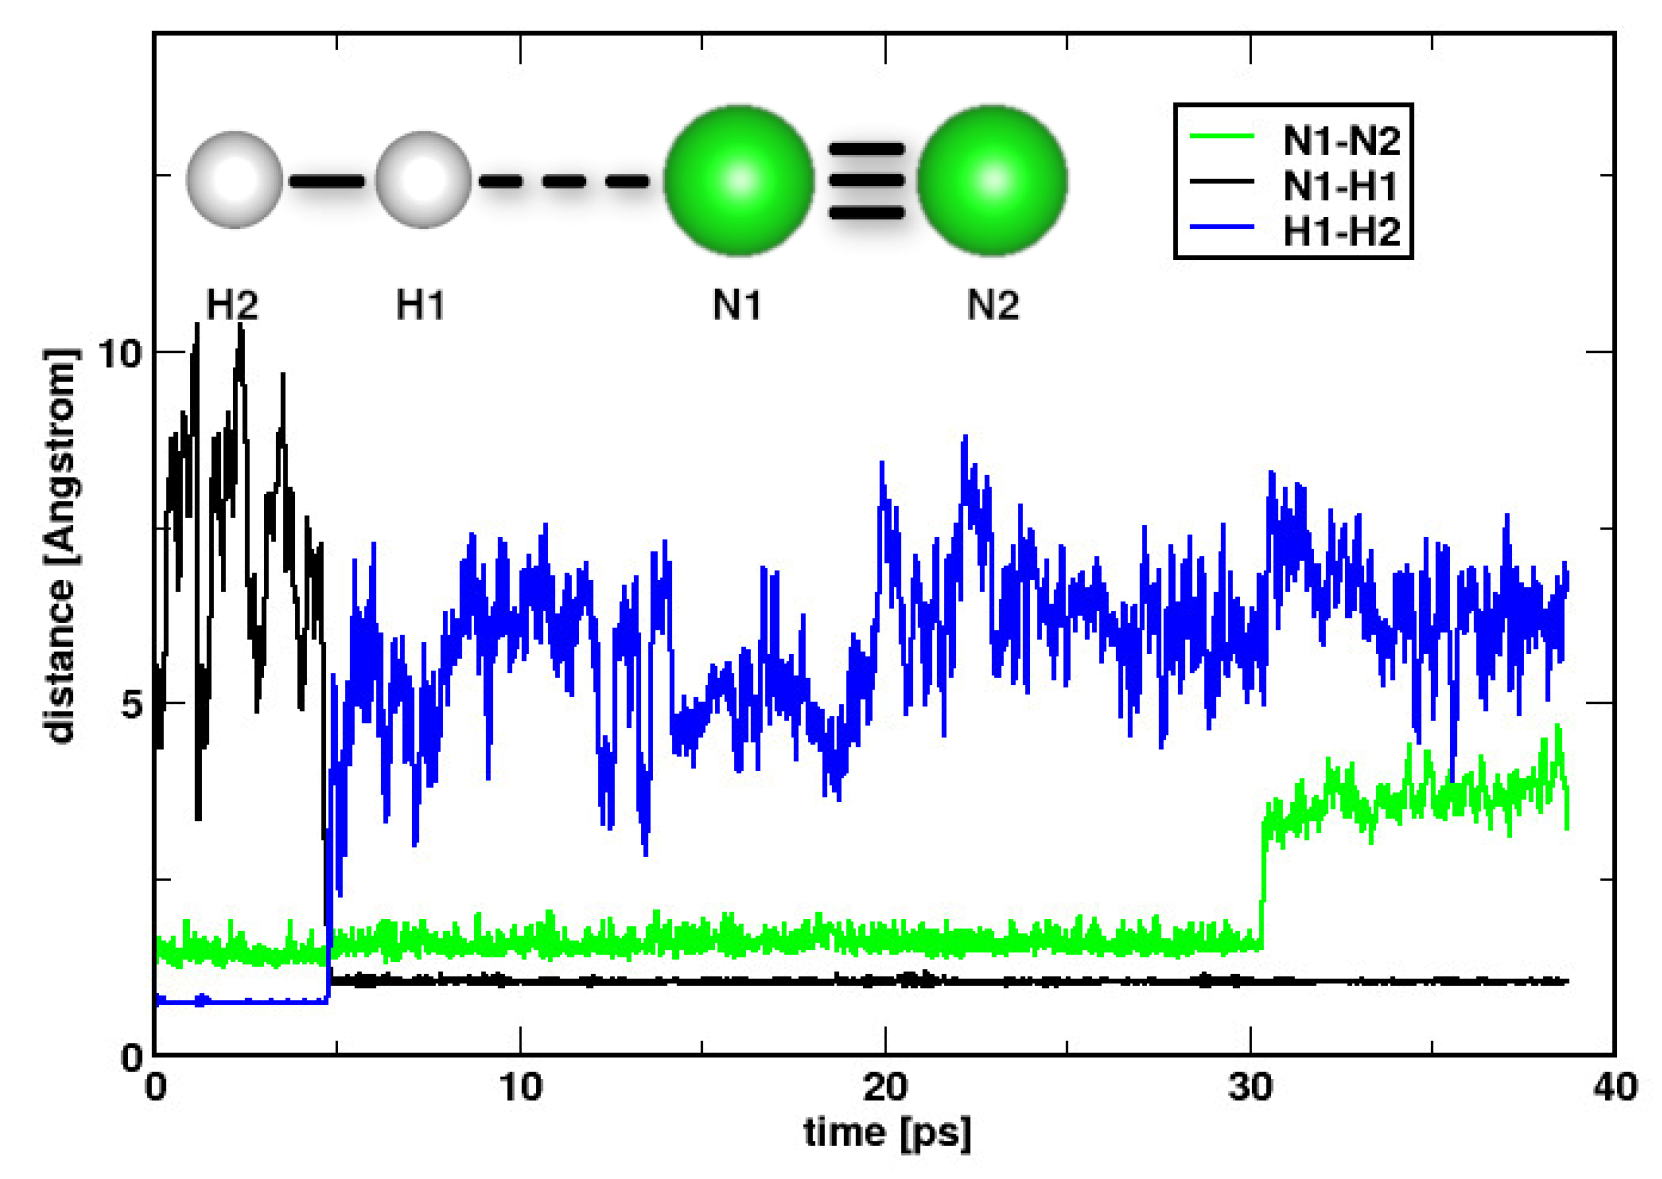
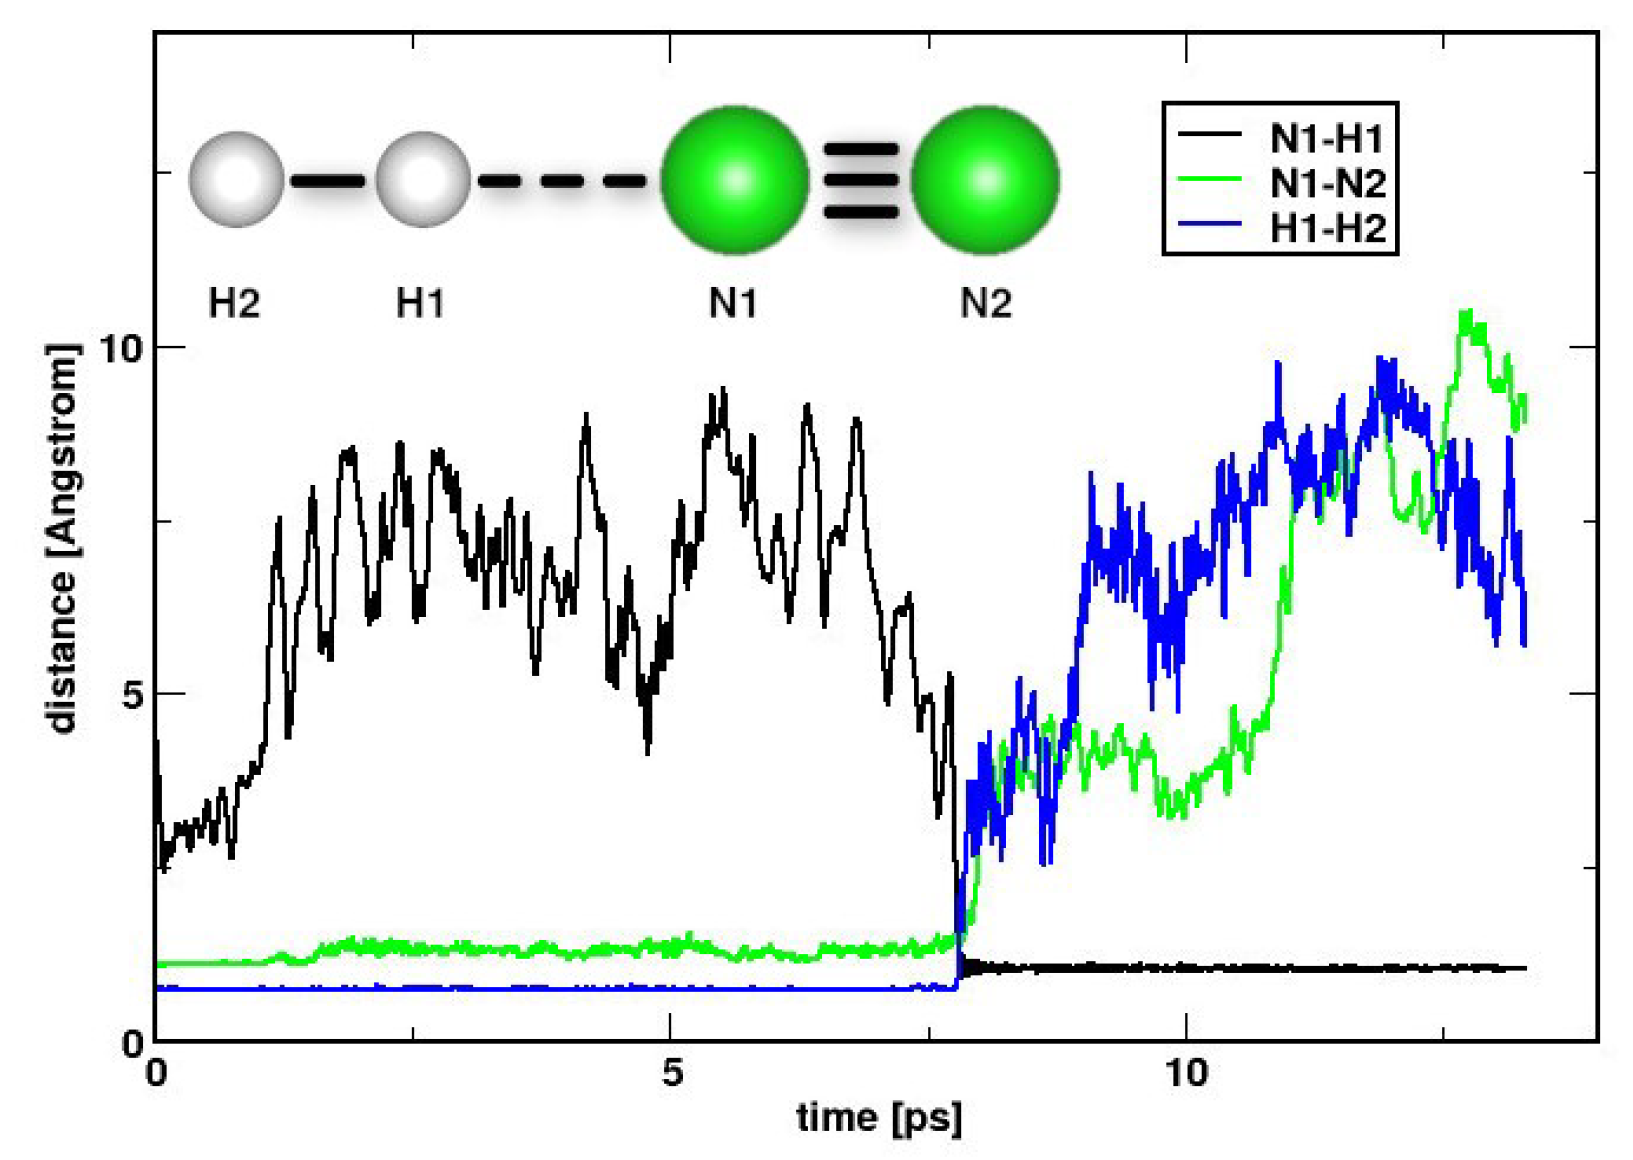
In simulations 3 to 13, we observed at least one nitrogen–nitrogen cleavage after intrusion in the lithium slab. A more detailed analysis of the change of the relevant distances with time is given in the Supplementary Materials for simulations 3 (Figures S7–S11) and 4 (Figures S12–S14). Normally, the nitrogen–nitrogen distance increases rapidly until it reaches a constant value, indicating the integration into the lithium lattice. Only in a few cases is the formation of N-H observed (Figure 4 and Figure 5; see also the Supplementary Materials). The N-H formation is clearly temperature-dependent and is not observed at low temperatures. Figure 4 and Figure 5 show the mechanism for two nitrogen–nitrogen rupture events in simulation 10. Both reaction sequences start with the N-H bond formation connected with the H-H bond breaking. The N-N bond breaks some picoseconds later. A different sequence is observed in simulation 11 (Figure S15): Here the N-H formation occurs after the breaking of the N-N triple bond. Hence, also this reaction pathway is possible. A further reaction to ammonia was not observed on the time scale of the simulations.
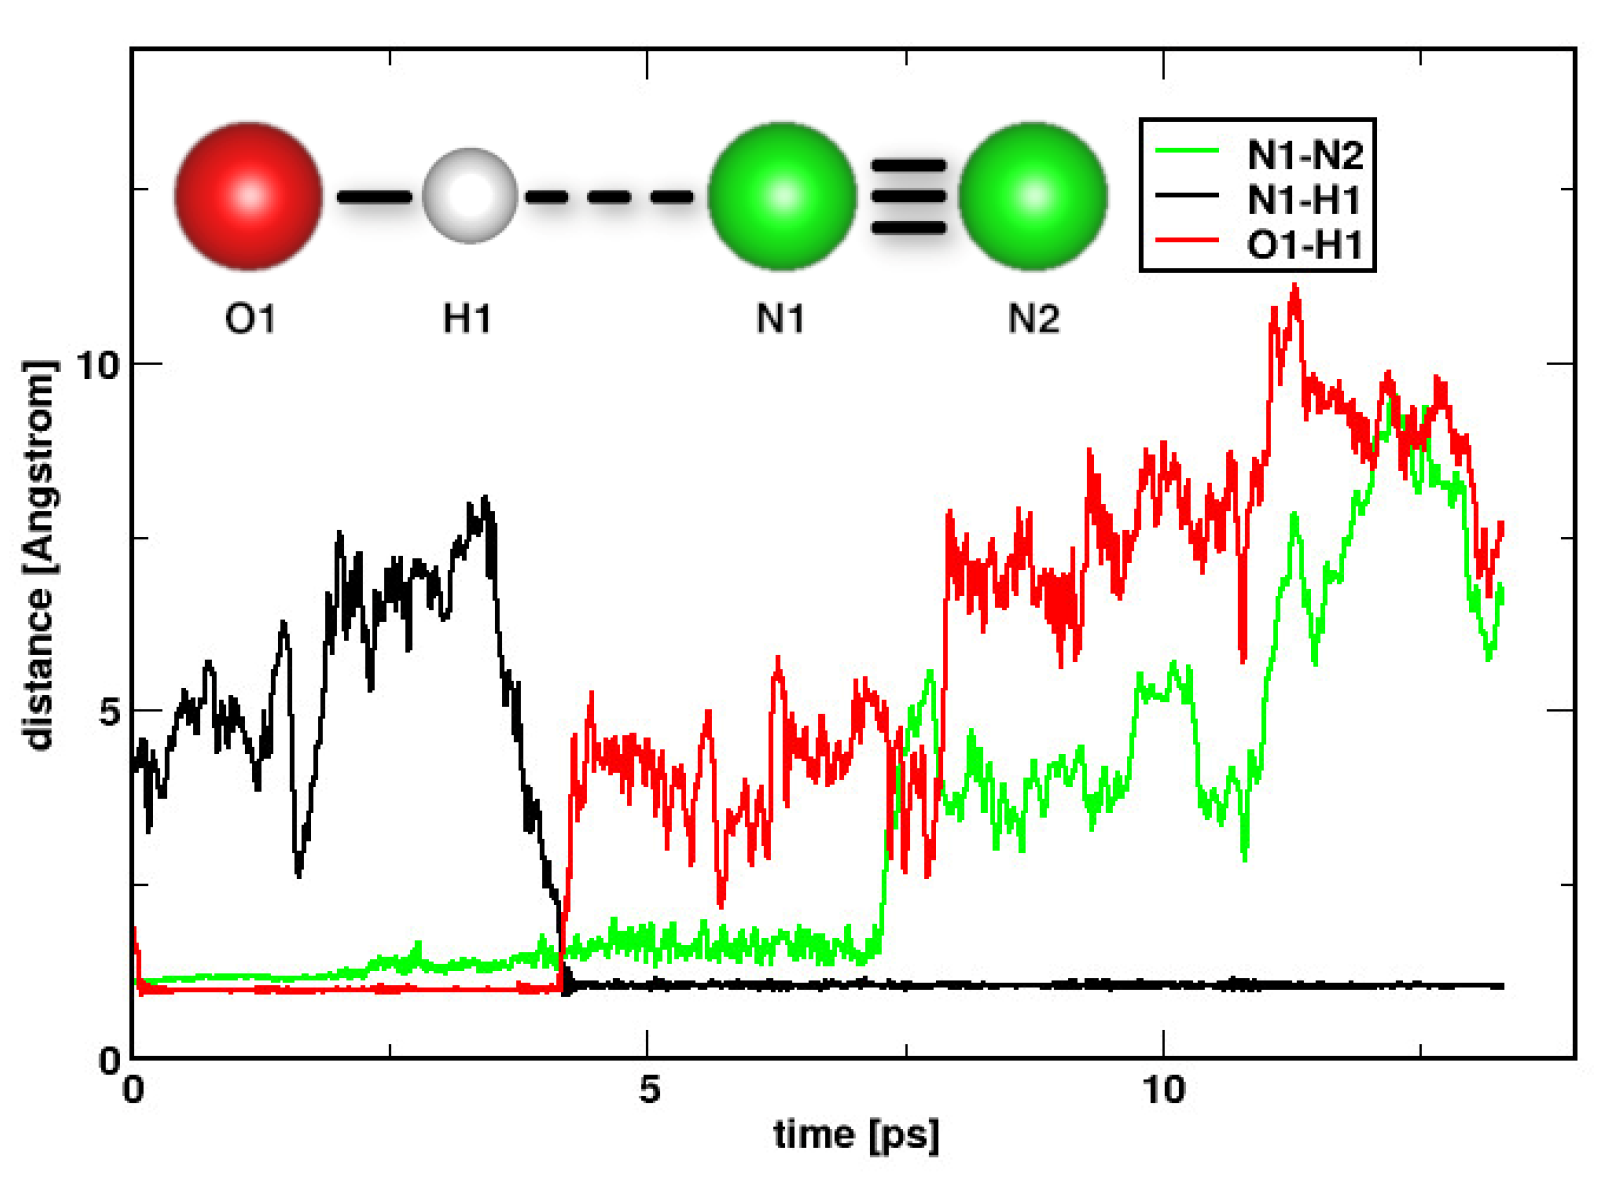
The next step was to include molecular oxygen in the simulations (Figure 6 and Figure 7, see also the Supplementary Materials, Figures S16 and S17). It turned out that it was hopeless to model the system with oxygen molecules before oxygen adsorption. Oxygen is strongly attracted by the surface and decomposes immediately. It forms surface oxygen ad-atoms and OH groups, thus activating the hydrogen molecules. The oxygen coverage partially inhibits the formation of lithium nitride.
In simulations 20 and 23, oxygen actively participates in the N-H formation. In simulation 23 N-H formation is followed by N-N cleavage (Figure 6). In simulation 20 again the N-N cleavage proceeds N-H formation (Figure S16).
Table 4 lists the coordination numbers of lithium that were obtained during the simulations that led to N-H formation (simulations 10, 11, 20, 23, and 24, with simulations 10 and 23 exhibiting two independent reaction sequences). In the case of simulations 20 and 23, a participation of oxygen in the reaction is observed. Only in a few cases did nitrogen atoms reach the full coordination with six lithium atoms. This is in contrast to what was observed for the clean surface which is not covered by oxygen. Obviously, nitrogen is more easily integrated into the lithium lattice if no surface oxygen inhibits it.

3. Conclusions

We observed an ultrafast reaction of molecular nitrogen with the lithium (100) surface. Hydrogen reacts slower with the lithium surface. In contrast to what was found in experiment, we do not necessarily obtain a Li 3 N stoichiometry. We find the formation of Li 9 N 2 and Li 11 N 2 clusters. Of course this is just the start of the bulk formation and higher N 2 pressure would easily yield a stoichiometry that is closer to experiment. Hydrogen reacts more slowly with the lithium surface. It has a chance to react with a nitrogen atom in the moment the nitrogen molecule reacts with the surface which leads to N-N cleavage. Once nitrogen is fully integrated into the bulk, it is no longer reactive.
Oxygen is even more reactive than nitrogen. It is difficult at best to equilibrate the surface before oxygen is drawn into the lithium bulk. Oxygen has two effects: firstly, the ultrafast formation of lithium oxide species renders the surface less active and prevents the formation of the corresponding nitride. It can be concluded that this coverage of the catalyst prevents the formation of inactive nitride species that cannot desorb anymore. The second effect of oxygen addition is the generation of active species by attacking the relatively unreactive hydrogen molecules, thus making additional reaction pathways viable. While we can tentatively explain the experimental behavior by this partial poisoning of the catalyst, we were not able to observe the full reaction to ammonia. We can observe, however, two important steps: the breaking of the nitrogen–nitrogen bond and the formation of adsorbed N-H. These two steps can occur simultaneously. It was frequently observed that the lithium surface absorbs one of the nitrogen atoms, whereas the other nitrogen atom reacts with molecular hydrogen. The extremely easy integration of nitrogen and oxygen atoms into the lithium bulk is in line with the extremely low density of the lithium lattice (0.534 g/cm 3 , cf. lithum nitride: 1.294 g/cm 3 , lithium oxide: 2.013 g/cm 3 , beryllium: 1.848 g/cm 3 , boron: 2.460 g/cm 3 ).
From the above, it is evident that CPMD/BLYP has the accuracy and efficiency to describe heterogeneous catalysis by lithium. Strictly speaking we obtain the high-temperature behaviour, that is, some caution is necessary when interpreting the results. However, also in experiment, high local kinetic energies are to be expected for the exothermic reaction of the lithium surface with nitrogen. Partial melting of the metallic lithium surface may occur, while Li 3 N has a higher melting point and forms rigid islands in the metallic surrounding. (Melting point Li: 454 K, Li 3 N: 1086 K.) It is also clear, however, that a larger amount of and much longer simulations would yield a more complete picture. Increasing the amount of simulations is not only hindered by the CPU time that is needed, but also by the time that is needed for the evaluation of the complex reaction sequences. Under these circumstances, we can determine and analyze only the most important reaction scenarios.

4. Methods

Ab-initio molecular dynamics simulations [11,12] have been performed with the CPMD code [17] using the Becke–Lee–Yang–Parr (BLYP) functional. The time step was chosen as 5 a.u. (0.1209 fs) and the fictitious electron mass as 400 a.u. Troullier–Martins pseudopotentials as optimized for the BLYP functional were employed for describing the core electrons [18,19]. The plane wave cutoff, which determines the size of the basis set, was set to 50.0 Rydberg. The simulation cell size was chosen as 26.5 × 26.5 × 26.5 a.u. 3 (14.0 × 14.0 × 14.0 Angstrom 3 ) for the periodic systems. This super-cell size corresponds to 4 × 4 × 4 times the size of the bcc unit cell of bulk lithium. After equilibration, the production runs were performed with Nose–Hoover thermostats [20,21,22] for the electrons and the ions. The Nose parameters were chosen as 0.01 a.u. and 10,000 cm 1 for the electrons and 300 K, 600 K, 800 K, or 1000 K and 3000 cm 1 for the ions. Data were accumulated for 37.49 ps (Li slab) and 13.30 ps (Li slab plus oxygen), respectively.
A method comparison for the Li 9 N 2 and Li 11 N 2 clusters in vacuo was performed using the Gaussian program package [23], namely for the density functional methods BLYP [24], BLYP-D3BJ [25,26], B3LYP [27], and B3LYP-D3BJ, in addition for the post-Hartree-Fock methods MP2 and CCSD, and finally for the double hybrid methods B2PLYP [28], and B2PLYP-D3BJ. The latter two methods are a mixture of B3LYP and MP2. The abbreviation D3BJ indicates that the Becke-Johnson damping was used in the D3 dispersion corrections [25,26]. The 6-311G(d,p) basis set was employed.

Supplementary Materials

The following supporting information can be downloaded at: https://www.mdpi.com/article/10.3390/nitrogen3030026/s1, Figure S1: Cell constant depending on the plane wave cutoff for the 3 × 3 × 3 supercell; Figure S2: z-Axis of all the 64 lithium atoms in simulation 1, eight atoms per plot (100 K); Figure S3: z-Axis of all the 64 lithium atoms in simulation 1, eight atoms per plot (300 K); Figure S4: Diatomic distances of all nitrogen molecules in simulation 2 (300 K); Figure S5: Simulation 2: Distances of the nearest neighbors, first nitrogen atom; Figure S6: Simulation 2: Distances of the nearest neighbors, second nitrogen atom; Figure S7: Diatomic distances of all nitrogen molecules in simulation 3 (300 K); Figure S8: Simulation 3: Distances of the nearest neighbors, first nitrogen atom; Figure S9: Simulation 3: Distances of the nearest neighbors, second nitrogen atom; Figure S10: Distances of the nearest neighbors, third nitrogen atom; Figure S11: Distances of the nearest neighbors, fourth nitrogen atom; Figure S12: Diatomic distances of all nitrogen molecules in simulation 4 (300 K); Figure S13: Simulation 4: Distances of the nearest neighbors, first nitrogen atom; Figure S14: Simulation 4: Distances of the nearest neighbors, second nitrogen atom; Figure S15: Simulation 11: Formation of the N-H bond, breaking of the N-N and H-H bonds; Figure S16: Simulation 20: Formation of the N-H bond, breaking of the N-N and O-H bonds; Figure S17: Simulation 24: Formation of the N-H bond, breaking of the N-N and H-H bonds.

Author Contributions

Conceptualization, I.F. and E.N.; methodology I.F.; software, I.F.; validation, I.F., D.M. and D.A.R.; formal analysis, D.M. and D.A.R.; investigation, D.M. and D.A.R.; resources, I.F.; accuracy, D.M. and D.A.R.; writing—original draft preparation, I.F.; writing—review and editing, I.F., E.N., D.M. and D.A.R.; visualization, D.M. and D.A.R.; supervision, I.F.; project administration, I.F.; funding acquisition, I.F. and E.N. All authors have read and agreed to the published version of the manuscript.

Funding

The study was supported by the Deutsche Forschungsgemeinschaft (DFG), grant FR1246/10-1 and by the BMBF, project 01DK20091. Part of the calculations were performed on the local cluster of the Leibniz University of Hannover at the LUIS and on the Höchstleistungsrechner Nord, HLRN, maintained by the North German Supercomputing Alliance, project nic00061.

Data Availability Statement

Input files for CPMD version 4.1 are available on demand from the corresponding author.

Conflicts of Interest

The authors declare no conflict of interest.

Abbreviations

The following abbreviations are used in this manuscript:
AIMDAb-Initio Molecular Dynamics
BLYPBecke-Lee-Yang-Parr density functional
B3LYPBecke-Lee-Yang-Parr hybrid density functional with three parameters
B2PLYPDouble hybrid functional: B3LYP combined with 2nd order perturbation theory
CCSDCoupled-Cluster, singles, doubles
CPMDCar-Parrinello Molecular Dynamics
D3BJDispersion correction 3, Becke-Johnson damping
DFTDensity functional theory
MP2Moller-Plesset perturbation theory, 2nd order

References

  1. Holleman, A.F.; Wiberg, E. Lehrbuch der Anorganischen Chemie, 101st ed.; de Gruyter: Berlin, Germany; New York, NY, USA, 1995. [Google Scholar]
  2. Wikipedia. Available online: https://en.wikipedia.org/wiki/Ammonia–production (accessed on 16 June 2022).
  3. NIST Chemistry WebBook. Available online: https://webbook.nist.gov/ (accessed on 16 June 2022).
  4. Christensen, C.H.; Johannessen, T.; Sørensen, R.Z.; Nørskov, J.K. Towards an ammonia-mediated hydrogen economy? Catal. Today 2006, 111, 140. [Google Scholar] [CrossRef]
  5. Giddey, S.; Badwal, S.P.S.; Kulkami, A. Review of electrochemical ammonia production tech- nologies and materials. Int. J. Hydrogen Energy 2013, 38, 14576. [Google Scholar] [CrossRef]
  6. MacFarlane, D.R.; Choi, J.; Suryanto, B.H.R.; Jalili, R.; Chatti, M.; Azofra, L.M.; Simonov, A.N. Liquefied sunshine: Transforming renewables into fertilizers and energy carriers with electromaterials. Adv. Mater. 2020, 32, e1904804. [Google Scholar] [CrossRef] [PubMed]
  7. Tsuneto, A.; Kudo, A.; Sakata, T. Efficient electrochemical reduction of N2 to NH3 catalyzed by lithium. Chem. Lett. 1993, 22, 851. [Google Scholar] [CrossRef]
  8. Tsuneto, A.; Kudo, A.; Sakata, T. Lithium-mediated electrochemical reduction of high pressure N2 to NH3. J. Electroanalytical Chem. 1994, 367, 183. [Google Scholar] [CrossRef]
  9. Lazouski, N.; Schiffer, Z.J.; Williams, K.; Manthiram, K. Understanding Continuous Lithium- Mediated Electrochemical Nitrogen Reduction. Joule 2019, 3, 1127. [Google Scholar] [CrossRef] [Green Version]
  10. Li, K.; Andersen, S.Z.; Statt, M.J.; Saccoccio, M.; Bukas, V.J.; Krempl, K.; Sazinas, R.; Pedersen, J.B.; Shadravan, V.; Zhou, Y.; et al. Enhancement of lithium-mediated ammonia synthesis by addtion of oxygen. Science 2021, 374, 1593. [Google Scholar] [CrossRef]
  11. Car, R.; Parrinello, M. Unified Approach for Molecular Dynamics and Density-Functional Theory. Phys. Rev. Lett. 1985, 55, 2471–2474. [Google Scholar] [CrossRef] [Green Version]
  12. Marx, D.; Hutter, J. Ab Initio Molecular Dynamics: Basic Theory and Advanced Methods; Cambridge University Press: Cambridge, UK, 2009. [Google Scholar]
  13. Langel, W.; Parrinello, M. Hydrolysis at stepped MgO surfaces. Phys. Rev. Lett. 1994, 73, 504. [Google Scholar] [CrossRef]
  14. Langel, W. Car-Parrinello simulation of H2O dissociation on rutile. Surf. Sci. 2002, 496, 141. [Google Scholar] [CrossRef]
  15. Tachikawa, H. Mechanism of Dissolution of a Lithium Salt in an Electrolytic Solvent in a Lithium Ion Secondary Battery: A Direct Ab Initio Molecular Dynamics (AIMD) Study. ChemPhysChem 2014, 15, 1604. [Google Scholar] [CrossRef] [PubMed]
  16. Carrasco, E.; Brown, M.A.; Sterrer, M.; Freund, H.H.; Kwapien, K.; Sierka, M.; Sauer, J. Thickness-dependent hydroxylation of MgO(001) thin films. J. Phys. Chem. C 2010, 114, 18207. [Google Scholar] [CrossRef]
  17. Kirchner, B.; Seitsonen, A.P.; Hutter, J. CPMD, Version 4.1, Copyright IBM Corp 1990–2015, Copyright MPI für Festkörperforschung Stuttgart 1997–2001. Available online: http://www.cpmd.org/ (accessed on 25 May 2022).
  18. Troullier, N.; Martins, J.L. Efficient Pseudopotentials for Plane-Wave Calculations. Phys. Rev. B 1991, 43, 1993. [Google Scholar] [CrossRef] [PubMed]
  19. Boero, M.; Parrinello, M.; Terakura, K.; Weiss, H. Car-Parrinello study of Ziegler-Natta heterogeneous catalysis: Stability and destabilization problems of the active site models. Mol. Phys. 2002, 100, 2935–2940. [Google Scholar] [CrossRef]
  20. Nosé, S. A molecular dynamics method for simulations in the canonical ensemble. Mol. Phys. 1984, 52, 255. [Google Scholar] [CrossRef]
  21. Nosé, S. A unified formulation of the constant temperature molecular dynamics methods. J. Chem. Phys. 1984, 81, 511. [Google Scholar] [CrossRef] [Green Version]
  22. Hoover, W.G. Canonical dynamics: Equilibrium phase-space distributions. Phys. Rev. A 1985, 31, 1695. [Google Scholar] [CrossRef] [Green Version]
  23. Frisch, M.J.; Trucks, G.W.; Schlegel, H.B.; Scuseria, G.E.; Robb, M.A.; Cheeseman, J.R.; Scalmani, G.; Barone, V.; Petersson, G.A.; Nakatsuji, H.; et al. Gaussian˜16 Revision A.03; Gaussian Inc.: Wallingford, CT, USA, 2016. [Google Scholar]
  24. Becke, A. Density-Functional Exchange-Energy Approximation with Correct Asymptotic Behavior. Phys. Rev. A 1988, 38, 3098–3100. [Google Scholar] [CrossRef]
  25. Grimme, S. Semiempirical GGA-type density functional constructed with a long-range dispersion correction. J. Comput. Chem. 2006, 27, 1787–1799. [Google Scholar] [CrossRef]
  26. Becke, A.D.; Johnson, E.R. A simple effective potential for exchange. J. Chem. Phys. 2006, 124, 221101. [Google Scholar] [CrossRef]
  27. Becke, A. A New Mixing of Hartree-Fock and Local-Density Functional Theories. J. Chem. Phys. 1993, 98, 1372–1377. [Google Scholar] [CrossRef]
  28. Grimme, S. Semiempirical hybrid density functional with perturbative second-order correlation. J. Chem. Phys. 2006, 124, 034108. [Google Scholar] [CrossRef] [PubMed] [Green Version]
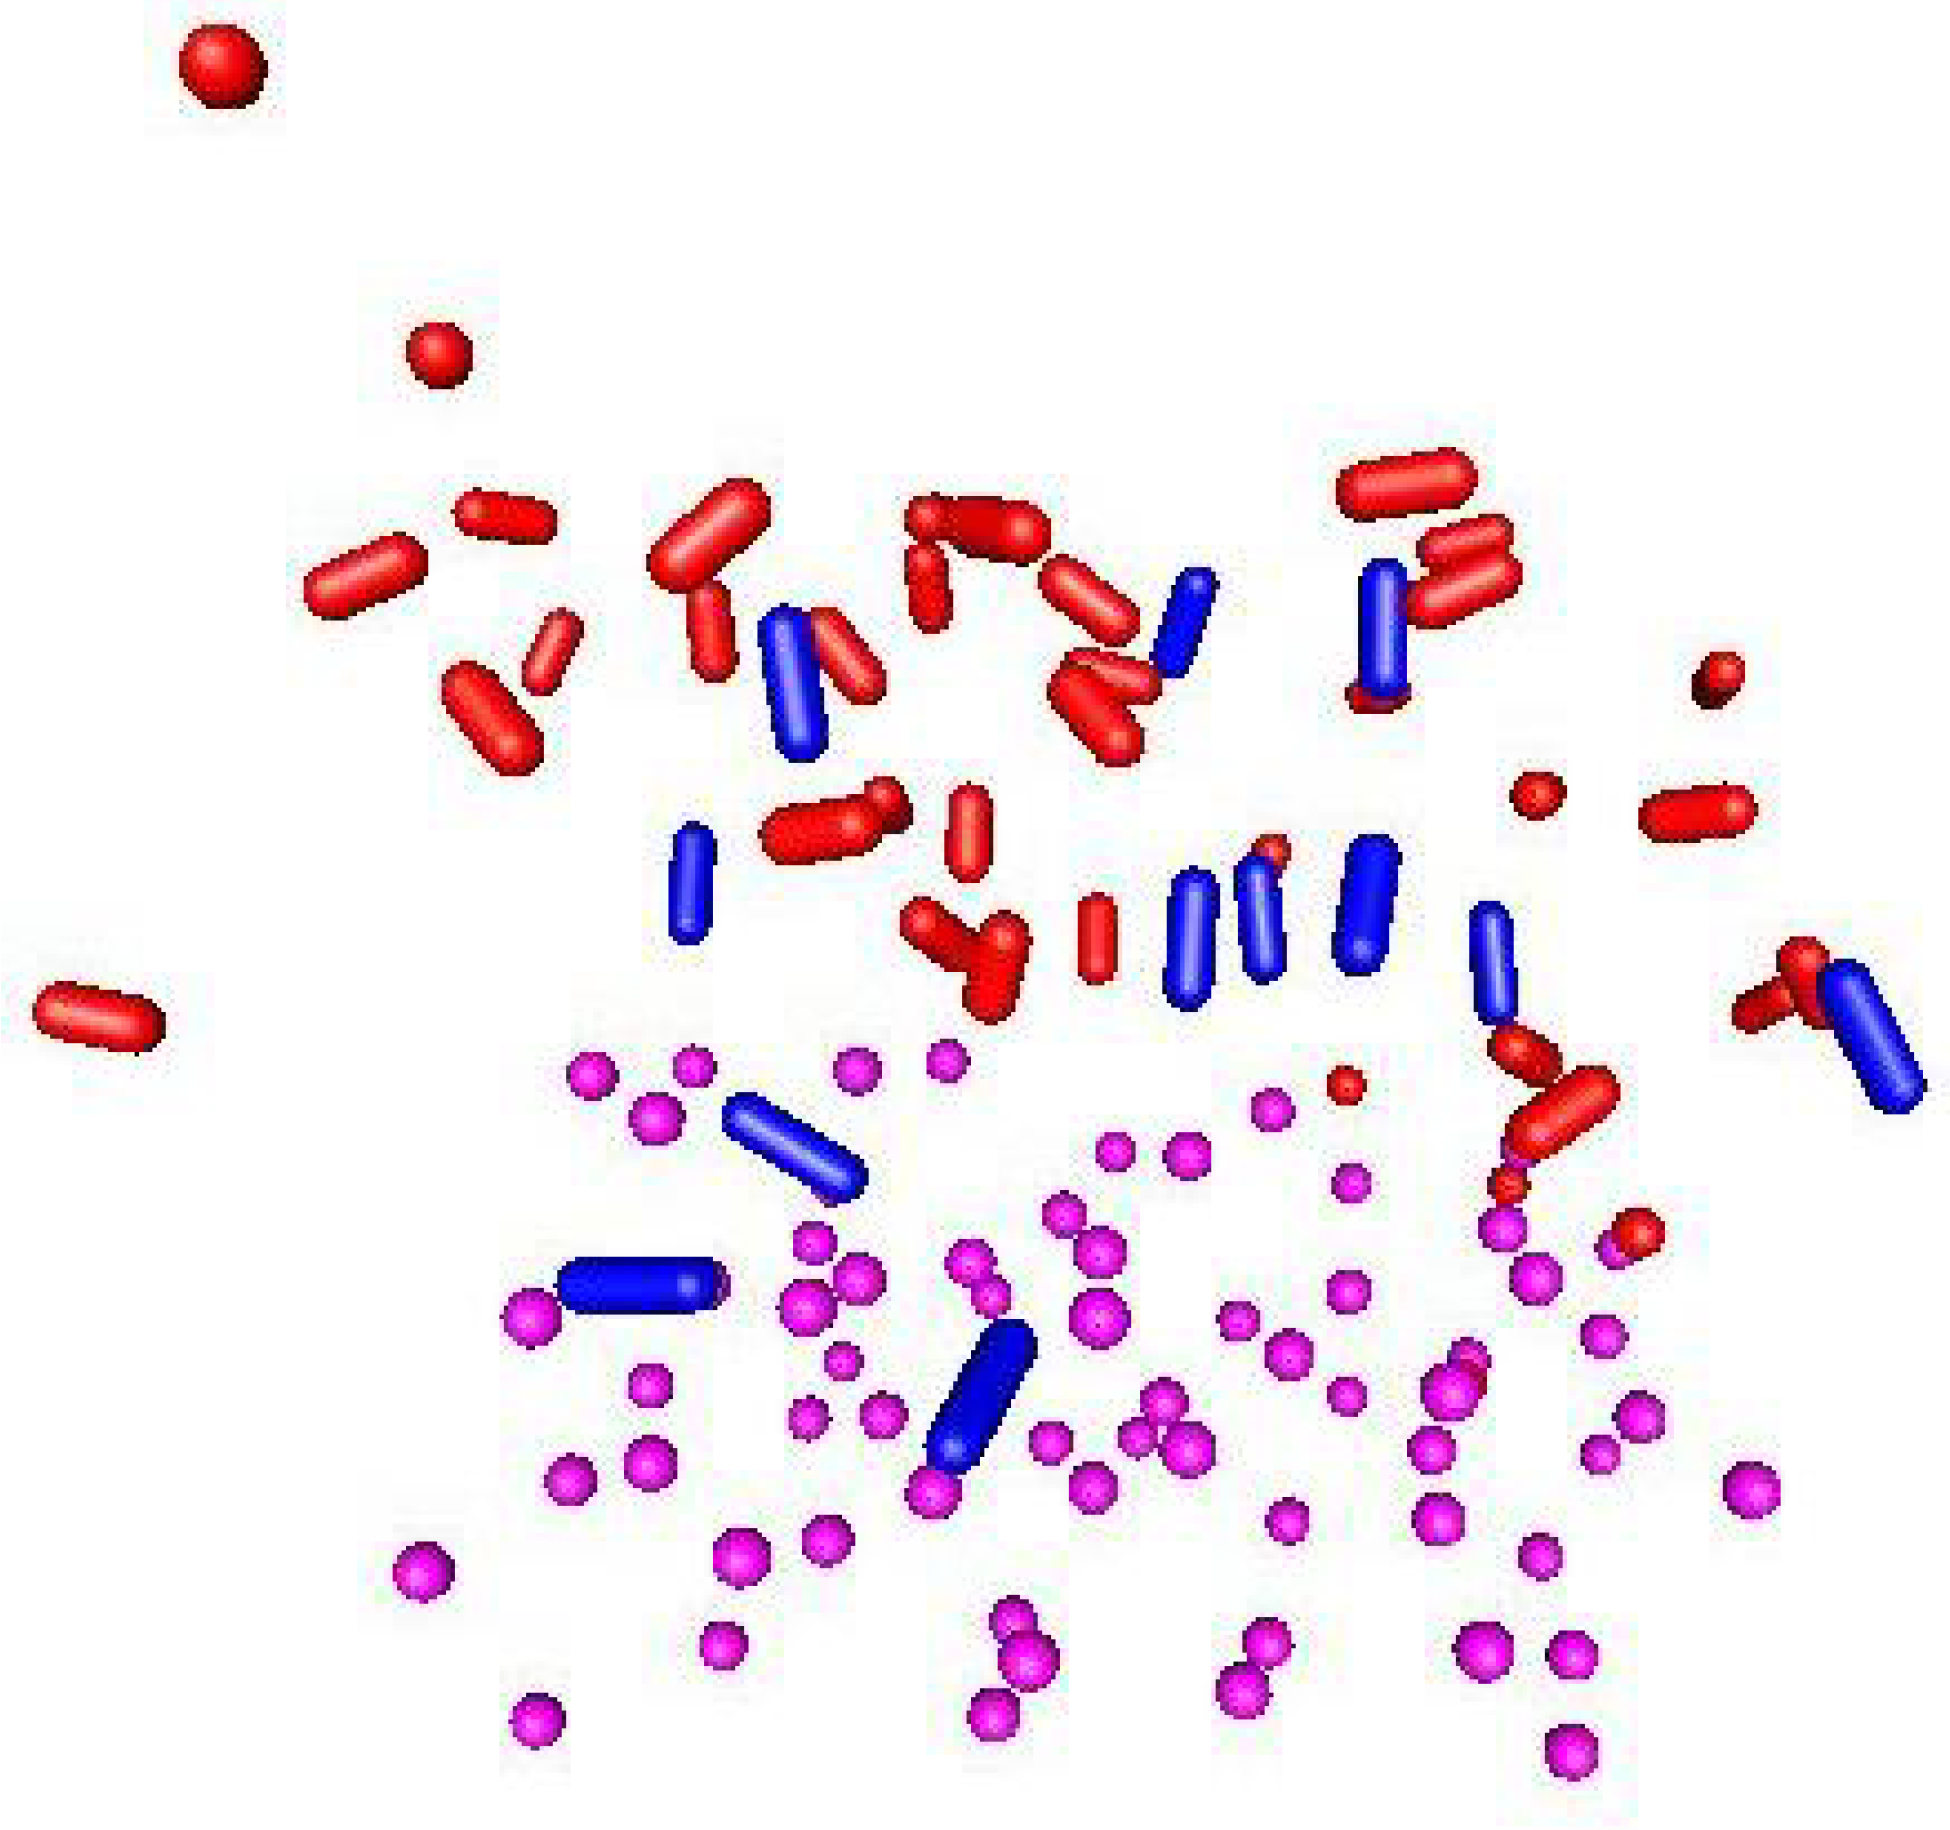
Figure 1. Start of simulation 2 after the equilibration, side view. Blue: nitrogen, red: hydrogen, magenta: lithium.
Nitrogen 03 00026 g001
Figure 2. Simulation 2, top view. For a mixture of nitrogen and hydrogen, a fast reaction of nitrogen with the lithium slab was observed. In the figure, only one nitrogen molecule is shown (blue), which is integrated into the bulk. All other nitrogen molecules and the hydrogen molecules are omitted in the graphical representation. The nearest neighbors of the N 2 moiety are highlighted in magenta; all other lithium atoms are turquoise.
Nitrogen 03 00026 g002
Figure 3. Li 9 N 2 (a) and Li 11 N 2 (b) structures from different perspectives, as observed in the CPMD simulations and then optimized in vacuo (BLYP). Upper row: Li 9 N 2 (D3h), lower row: Li 11 N 2 (D4d). Nitrogen: magenta, lithium: blue. The D3h symmetry of Li 9 N 2 and the close-to D4d symmetry of Li 11 N 2 were not imposed in the input but were obtained from the calculations.
Nitrogen 03 00026 g003
Figure 4. Simulation 10, first reaction: in the beginning, the N-H bond is formed and the H-H bond is broken. The N-N bond breaks a few picoseconds later.
Nitrogen 03 00026 g004
Figure 5. Simulation 10, second reaction: in the beginning, N-H is formed. Almost simultaneously, the H-H bond breaks. A few picoseconds later, the N-N bond is broken.
Nitrogen 03 00026 g005
Figure 6. Simulation 23, first reaction: a hydrogen atom is readily transferred from an OH group to nitrogen, causing N-N bond breaking.
Nitrogen 03 00026 g006
Figure 7. Simulation 23, second reaction: also in the simulations containing oxygen, the oxygen-free reaction can be observed. In the actual case, bond breaking (N-N, H-H) and bond formation (N-H) occur almost simultaneously, with the H-H bond breaking being the fastest.
Nitrogen 03 00026 g007
Table 1. Protocol of the CPMD simulations containing nitrogen and hydrogen discussed in this paper. Given are the numbers of Li, N, H, and O atoms in the single models and the initial temperature. Production runs are listed only, not the equilibration runs. Higher temperatures facilitate the reactions, while the effect of pressure is unclear.
SystemSimulationLi/N/H/OTemp.N-NN-H
Number [K]CleavageFormation
Li slab164/0/0/0300nono
Li slab264/24/72/0300nono
Li slab364/20/68/0300yesno
Li slab464/20/64/0300yesno
Li slab564/24/72/0600yesno
Li slab664/20/68/0600yesno
Li slab764/20/64/0600yesno
Li slab864/24/72/0800yesno
Li slab964/20/68/0800yesno
Li slab1064/20/64/0800yesyes
Li slab1164/24/72/01000yesyes
Li slab1264/20/68/01000yesno
Li slab1364/20/64/01000yesno
Li slab, O 2 1464/20/68/12300nono
Li slab, O 2 1564/12/36/8300nono
Li slab, O 2 1664/6/18/4300nono
Li slab, O 2 1764/20/68/12600nono
Li slab, O 2 1864/12/36/8600yesno
Li slab, O 2 1964/ 6/18/4600yesno
Li slab, O 2 2064/20/68/12800yesyes
Li slab, O 2 2164/12/36/8800yesno
Li slab, O 2 2264/ 6/18/4800nono
Li slab, O 2 2364/20/68/121000yesyes
Li slab, O 2 2464/12/36/81000yesyes
Li slab, O 2 2564/6/18/41000yesno
Table 2. Optimized Li 9 N 2 structure, method comparison. Each nitrogen atom is coordinated by six lithium atoms. The inner three lithium atoms are bound to both nitrogen atoms, see Figure 3.
MethodN-NOuter Li-NInner Li-N
[Å][Å][Å]
BLYP3.041.852.02
BLYP/D3BJ3.021.842.00
B3LYP3.031.842.00
B3LYP/D3BJ3.011.831.99
B2PLYP3.041.852.01
B2PLYP/D3BJ3.031.852.01
MP23.111.872.06
CCSD3.061.862.02
Table 3. Optimized Li 11 N 2 structure, method comparison. Each nitrogen atom is coordinated by six lithium atoms. The two nitrogen atoms share one lithium atom.
MethodN-NOuter Li-NCentral Li-NInner Li-N
[Å][Å][Å][Å]
BLYP3.961.851.91–1.942.00
BLYP/D3BJ3.891.841.91–1.931.95
B3LYP3.951.841.90–1.921.98
B3LYP/D3BJ3.891.831.90–1.911.94
B2PLYP3.981.841.92–1.931.99
B2PLYP/D3BJ3.941.841.92–1.931.97
MP24.041.871.94–1.952.02
CCSD4.011.851.93–1.942.01
Table 4. Final coordination numbers of the relevant nitrogen and oxygen atoms with lithium in the simulations where N-H formation was observed. In simulations 10 and 23, two reaction events were monitored. High coordination numbers indicating nitride formation were observed preferably at low temperatures and in the systems without oxygen.
SimulationAtomCoordination
10N6
10N2
10N6
10N3
11N6
11N3
20O3
20N3
20N5
23N3
23N4
23O4
23N3
23N3
24N4
24N3
Publisher’s Note: MDPI stays neutral with regard to jurisdictional claims in published maps and institutional affiliations.