Article

Negligible Response of Transpiration to Late-Summer Nitrogen Fertilization in Japanese Oak (Quercus crispula)

1
Graduate School of Bioresource and Bioenvironmental Sciences, Kyushu University, 744 Motooka, Nishi Ward, Fukuoka 819-0395, Japan
2
Kyushu University Forest, Kyushu University, 394 Tsubakuro, Sasaguri, Fukuoka 811-2415, Japan
*
Author to whom correspondence should be addressed.
Nitrogen 2022, 3(1), 76-89; https://doi.org/10.3390/nitrogen3010006
Submission received: 21 December 2021 / Revised: 26 January 2022 / Accepted: 31 January 2022 / Published: 3 February 2022

Abstract

:
Increased atmospheric nitrogen (N) deposition, caused by anthropogenic activities, has various effects on forest ecosystems. Some reports have investigated the responses in tree transpiration to N addition, but few studies have measured the short-term response of mature tree transpiration to N fertilization. This study aimed to clarify the short-term transpiration response in 27-year-old deciduous hardwood trees to an increase in N availability. We established two plot types (control and N-fertilized plots) in Quercus crispula plantation stands in Hokkaido, Northern Japan. We measured sap flow density (SFD; cm3 m−2 s−1) using a thermal dissipation method for three months during the growing season. In the N-fertilized plot, we added 50 kg N ha−1 yr−1 of ammonium nitrate (NH4NO3) to the forest floor in the middle of the measurement periods. For daily mean SFD, we did not find a significant difference between the control and the N-fertilized plots. Leaf N contents did not differ between treatments, implying a negligible difference in physiological responses and transpiration rates. The slight difference between treatments could be because the trees had already foliated before applying the N fertilizer to our deciduous hardwood trees. The present results indicate that the potential increase in N deposition during the growing season does not immediately alter tree transpiration.

1. Introduction

Atmospheric nitrogen (N) deposition has increased due to anthropogenic activities, such as fossil fuel combustion and the fertilization of farmlands, and deposition will likely continue to rise in the future [1,2]. Previous studies have revealed that elevated atmospheric N deposition has changed both below-ground and above-ground forest ecosystems. Examples of below-ground changes include increasing soil respiration [3], promoting soil acidification, and leaching exchangeable cations [4]. Above-ground changes include increasing the stem volume of trees [5] and the degradation of vegetation diversity [6]. Although the effects of increased N deposition in forest ecosystems have been investigated worldwide, few reports have considered the response of tree transpiration to increased N deposition [7,8,9,10,11,12,13,14,15,16]. Transpiration is synchronized with photosynthesis because of stomatal behavior; therefore, there is a trade-off between carbon gain and water loss. The behavior of transpiration is an important index used to understand plant physiological functions and, consequently, carbon assimilation [17,18].
Most previous studies used seedlings to evaluate the response of tree transpiration to increased N deposition and observed that transpiration was enhanced with an increase in N deposition in Cryptomeria japonica [8], Malus domestica [9], and Picea abies [10] after artificial N addition. These increases in transpiration likely occurred because of an increase in biomass or leaf N contents under high N availability and well-watered treatments, although some exceptions are noted [11,12].
Previous studies targeting the transpiration of mature trees (i.e., trees >5 years) [13,14,15,16] indicated a similar tendency to that of young seedlings in response to increased N deposition, with one exception [13]. Factors that increased transpiration included increased stomatal conductance (i.e., transpiration per unit of leaf area) [14] and biomass (i.e., increases in leaf area index (LAI; m2 m−2) and sapwood area) [15]; however, these studies examined long-term (>1 year) effects after the addition of N. Assessing short-term responses within 1 year will provide insight into the short-term impacts of elevated N deposition on tree physiology. Measurement of the thermal dissipation-based sap flow enables detection of the short-term effects of N fertilization with a high accuracy, as a result of continuous measurements after instantaneous application of fertilizer to the forest floor. To the best of our knowledge, only one previous study [16] has examined rapid changes in transpiration of mature trees in response to increased N deposition.
This study aimed to investigate the short-term transpiration response of mature individuals of Quercus crispula to increased N deposition in Hokkaido, Northern Japan, based on sap flux measurements. Q. crispula was selected because it is a wide-spread deciduous species found across Japan. This investigation started with low-level N loading because the target of the present study was to study the immediate and sensitive response of transpiration after N fertilization. Therefore, we conducted continuous observations using sap flow measurements, before and after relatively mild N fertilization in a pristine forest area. The study site was one of the least N-polluted areas in Japan [19], which is essential when the goal is to elucidate the immediate and sensitive response of pristine forest ecosystems to increased N deposition. We also discuss the utility of sap flux measurements in this experiment.

2. Materials and Methods

2.1. Study Site

We conducted this study in a Q. crispula plantation forest in the Ashoro Research Forest, Ashoro, Japan (32°22′ N, 131°09′ E, 350 m). The mean annual precipitation and temperature were 752.5 mm and 6.8 °C, respectively [20]. Q. crispula is widely distributed through cool temperate forests in East Asia, including in Japan. The maximum height, diameter, and life span were 25 m, 1.5 m, and 300−400 years, respectively. The leaf lifespan of Q. crispula is about six months, from May to October. Leaves start to emerge in mid-May and finish emerging in early June. The foliation period is from June to mid-September, and defoliation begins in late September. The plantation was established in 1992 as part of a 150-year Q. crispula forestation experiment [21]. The surface soil in the study area freezes in winter [22], and the soil type is kuroboku soil (black volcanic ash soil). The dominant understory vegetation is Sasa nipponica.
We established two study plots (control and N-fertilized). Each plot was 160 m2 (10 m long × 16 m wide) and settled at an interval of 5.0 m. We found almost the same stand density (SD; stems ha−1), mean diameter at breast height (DBH; cm), and LAI for Q. crispula in both plots (Table 1). We estimated the LAI from hemispherical photographs [23] taken by a 360° camera (RICOH THETA V, RICOH, Tokyo, Japan) on 27 September 2019, with a designated application (RICOH THETA, RICOH, Tokyo, Japan), projection converter plugin (THETATools, aitch-two, Tokyo, Japan), image editing software (Paint.NET, dotPDN LLC, Seattle, WA, USA), and calculation software (Gap Light Analyzer, Cary Institute, Millbrook, NY, USA).

2.2. Meteorological and Soil Moisture Measurements

We obtained the meteorological measurements from a weather station established in an open area that was 20 m away from the study plots and at a height of 1.2 m above the ground, except for precipitation (P; mm). The P measurements came from a 12 m high tower that was 4.5 km away from the site. We obtained the temperature (T; °C) and relative humidity (Rh; %) measurements using a thermo-hygrometer (S-THB-M002; Onset, Bourne, MA, USA). In addition, we measured the photosynthetic active radiation (PAR, μmol m−2 s−1) with a PAR sensor (S-LIA-M003, Onset, Bourne, MA, USA). We measured each meteorological variable at 10 s intervals, and recorded them as an average of 10 min, using a data logger (HOBO U30, Onset, Bourne, MA, USA).
We calculated the vapor pressure deficit (VPD; kPa) with T and Rh using Buck’s equation [24].
  VPD = 0.611 × e ( 17.502 T T + 240.97 ) × ( 1 Rh )
We collected the meteorological measurements from 11 July 2019 to 6 October 2019. The daytime mean (06:00–18:00) or total daily amounts for the meteorological conditions during the measurement period are shown in Figure 1. The daily amount of P ranged from 0 to 73 mm. The daytime mean VPD, PAR, and T ranged from 0 to 1.5 kPa, from 53.0 to 1100.0 μmol m−2 s−1, and from 10.8 °C to 29.3 °C, respectively.
We measured the volumetric water contents (VWC; m3 m−3) of soil with soil moisture sensors (EC5, METER, Pullman, WA, USA) at two points and three depths (10 cm, 20 cm, and 50 cm) per plot. We took measurements every 30 s and recorded them as an average over a 10 min timespan using a data logger (CR1000, Campbell Scientific, Logan, UT, USA). The period for these measurements was from 3 July 2019 to 6 October 2019. These measurements were used to calculate weighted averages of VWC between depths of 0 and 50 cm per plot. We defined the weighted averages from depths of 0 to 50 cm, such that the VWC at a depth of 10 cm represented the VWC from 0 to 10 cm, that at a depth of 20 cm represented the VWC from 10 to 30 cm, and that at 50 cm represented the VWC from 30 to 50 cm.
These showed the minor differences (<0.03 m3 m−3) throughout the year between the two plots (Figure 1).

2.3. Sap Flow Measurements

This study used thermal dissipation-based sap flow measurements to assess the effect of instantaneous artificial N fertilization on transpiration. We measured the sap flow density (SFD; cm3 m−2 s−1) continuously for 32 trees (16 trees per plot), for approximately three months, from 3 July 2019 to 6 October 2019. We selected dominant trees without dieback or epicormic sprouting for the sap flow measurements to eliminate the inhibiting effect of growth competition. There was no significant difference in DBH for the selected trees between the plots (Table 1). Therefore, we deployed Granier-type sensors [25] and followed the thermal dissipation method for these measurements. We deployed sensors in pairs: one was a heater sensor (HS), the other was a reference sensor (RS), and both consisted of 2 mm diameter steel probes and copper-constantan thermocouples. In this study, we used 10 mm length probes to fit the sap flow conducting area of ring-porous species more precisely [26]. We inserted a pair of sensors into the stems at breast height and placed the HS on the upper side and the RS on the lower side of the stem at an interval of 150 mm. We covered the sensors with silicon and aluminum plates to protect them from the sun and insects. We supplied the HS with 0.15 W power, according to the method of James et al. [26]. We measured the temperature differences (ΔT) between the HS and the RS every 30 s and recorded them as an average over a 10 min time period using a data logger (CR1000, Campbell Scientific, Logan, UT, USA) and a multiplexer (AM16/32B, Campbell Scientific, Logan, UT, USA). We converted the ΔT into SFD using the formula below [25].
SFD = 1.19   ×   10 4   ×   ( Δ T m a x Δ T Δ T ) 1.231   ×   10 6
We defined ΔTmax as the instantaneous maximum temperature difference over 24 h for each sensor [27]. Then, we calculated the daytime mean (06:00–18:00) SFD from the time series data of SFD.
The sensors were often broken during measurements, mainly due to electrical problems; we replaced the sensors within one week of sensor trouble. We analyzed the sap flow data based on three criteria: (1) we deleted 1-day data when missing data exceeded 30% of all data in a day; (2) we deleted 1-week data after we changed sensors, since unstable data frequently appeared during those periods; and (3) we deleted 1-month data when days with missing data exceeded 30% of all data in a month. Periods with available data per sensor are provided in Tables S1–S7.

2.4. N Fertilization

We conducted N fertilization on 6 August 2019. In the present study, N fertilization was conducted in early August to gain an adequate amount of data in both periods, before and after N fertilization, within one growing season to focus on the short-term response of Q. crispula. Q. crispula has a growth potential for biomass in August and September when N fertilization finishes [28]. Thus, this timing is reasonable in evaluating the short-term response. We applied fertilizer to the 352.5 m2 area, including the N-fertilized plot and a 2.5 m buffer zone. The fertilizer that we applied to the forest floor was 50 kg N ha−1 yr−1 of NH4NO3, which is approximately 10 times the annual atmospheric N deposition at this study site [19]. The amount of fertilizer (50 kg N ha−1 yr−1) was based on the current maxima of atmospheric N deposition, around 40−50 kg N ha−1 yr−1 in China [29,30] and 44 kg N ha−1 yr−1 in Europe [31], whereas 225 kg N ha−1 yr−1 is the amount of N fertilizer used in forestry.

2.5. Dye Injection Experiments

We also conducted dye injection experiments to confirm the correlation between short-length-type probes and vessel position. Experiments were conducted on 20 and 24 September 2019 in an area close to the study site. We selected four trees as sample trees with similar DBHs to target trees for sap flow measurements (Table 2). First, we placed plastic funnels on the target trees at 1.2 m and filled them with water. Then, we drilled the sapwood of each stem at a 3 cm depth underwater. Subsequently, we replaced the water with 0.1% acid fuchsin solution [32] and maintained that for 15 min. Immediately after absorption, we cut down the trees and measured the dye ascending distance. We harvested sample discs from the trees at 0.5 m intervals from the injection height to the maximum dying height. We used liquid N to freeze-dry the discs (FDU-2200, Tokyo Rikakikai, Tokyo, Japan) and then planed and observed the sections, and counted the number of stained annual rings using a stereomicroscope (CX41N, Olympus, Tokyo, Japan) with a digital camera (α6000, Sony, Tokyo, Japan). We measured the dyed radial length at four points in the sapwood and averaged those measurements. Finally, we obtained a 1 cm3 block at the outermost part of the disc and embedded it with epoxy resin. We then sectioned the embedded blocks with a sliding microtome (REM-700, Yamato Kohki Industrial, Saitama, Japan) and observed the dye distribution using fluorescent microscopy (U-RFLT50, Olympus, Tokyo, Japan).

2.6. Leaf N Contents

On 11 July 2019 and 21 September 2019, we collected canopy leaves from the 10 target trees and used sap flow measurements from each plot to investigate the change in leaf N content before and after fertilization. We then dried these leaves at 80 °C for 48 h. Finally, we powdered and analyzed the leaf N contents with a CN Corder (MT-700, Yanaco Technical Science Co. Ltd., Kyoto, Japan).

2.7. Calculations and Statistical Analysis

We evaluated the effect of N fertilization on transpiration using the change in SFD, before and after N fertilization, in each plot. We tested the differences in the regression lines composed of daytime mean SFD of trees in two the plots (control and N-fertilized) between three periods using ANCOVA. The three periods that we examined were (1) before N fertilization, from 3 July 2019 to 5 August 2019; (2) the 1st month after fertilization from 6 August 2019 to 5 September 2019; and (3) the 2nd month after fertilization from 6 September 2019 to 6 October 2019. We then tested changes in the responses of SFD to meteorological conditions after N fertilization using a comparison of regression lines between daytime mean SFD and meteorological conditions, such as daytime mean (06:00–18:00) PAR and VPD during the three periods. We performed this comparison among the three periods mentioned above and between the control and the N-fertilized plots in each period with ANCOVA. We used a t-test to perform other comparisons between treatments (such as DBH, LAI, and leaf N contents). We conducted statistical tests using R [33] and RStudio in the integrated development environment [34].

3. Results

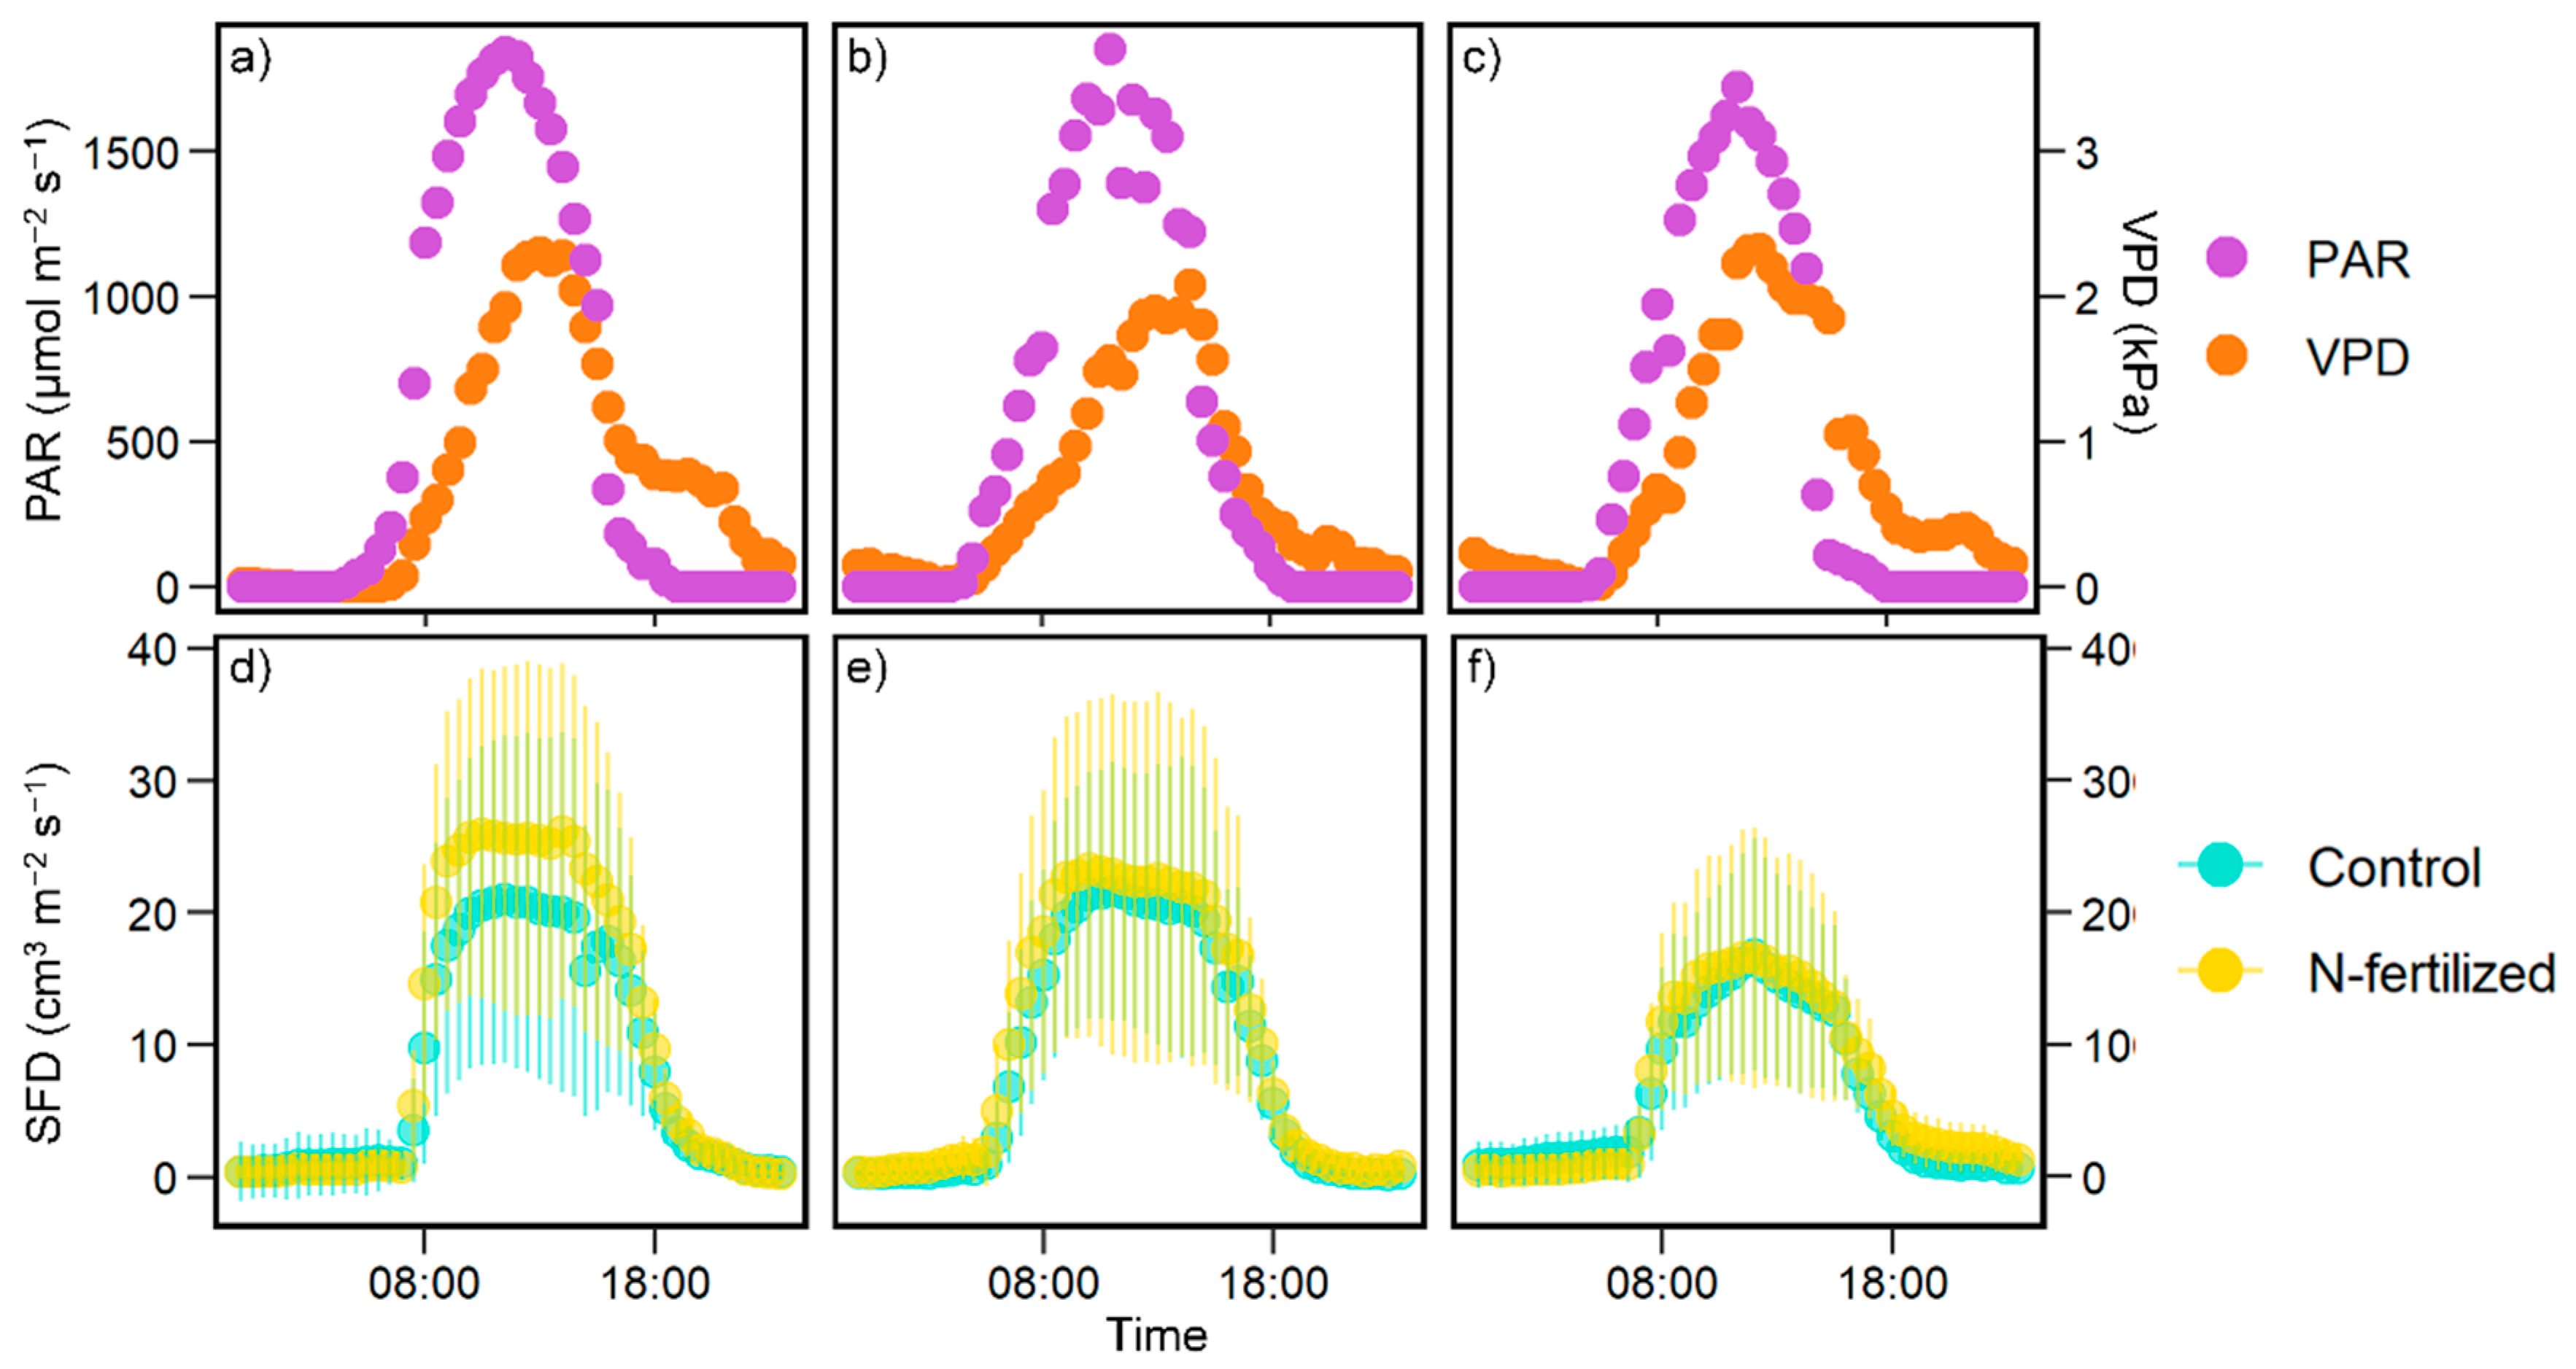
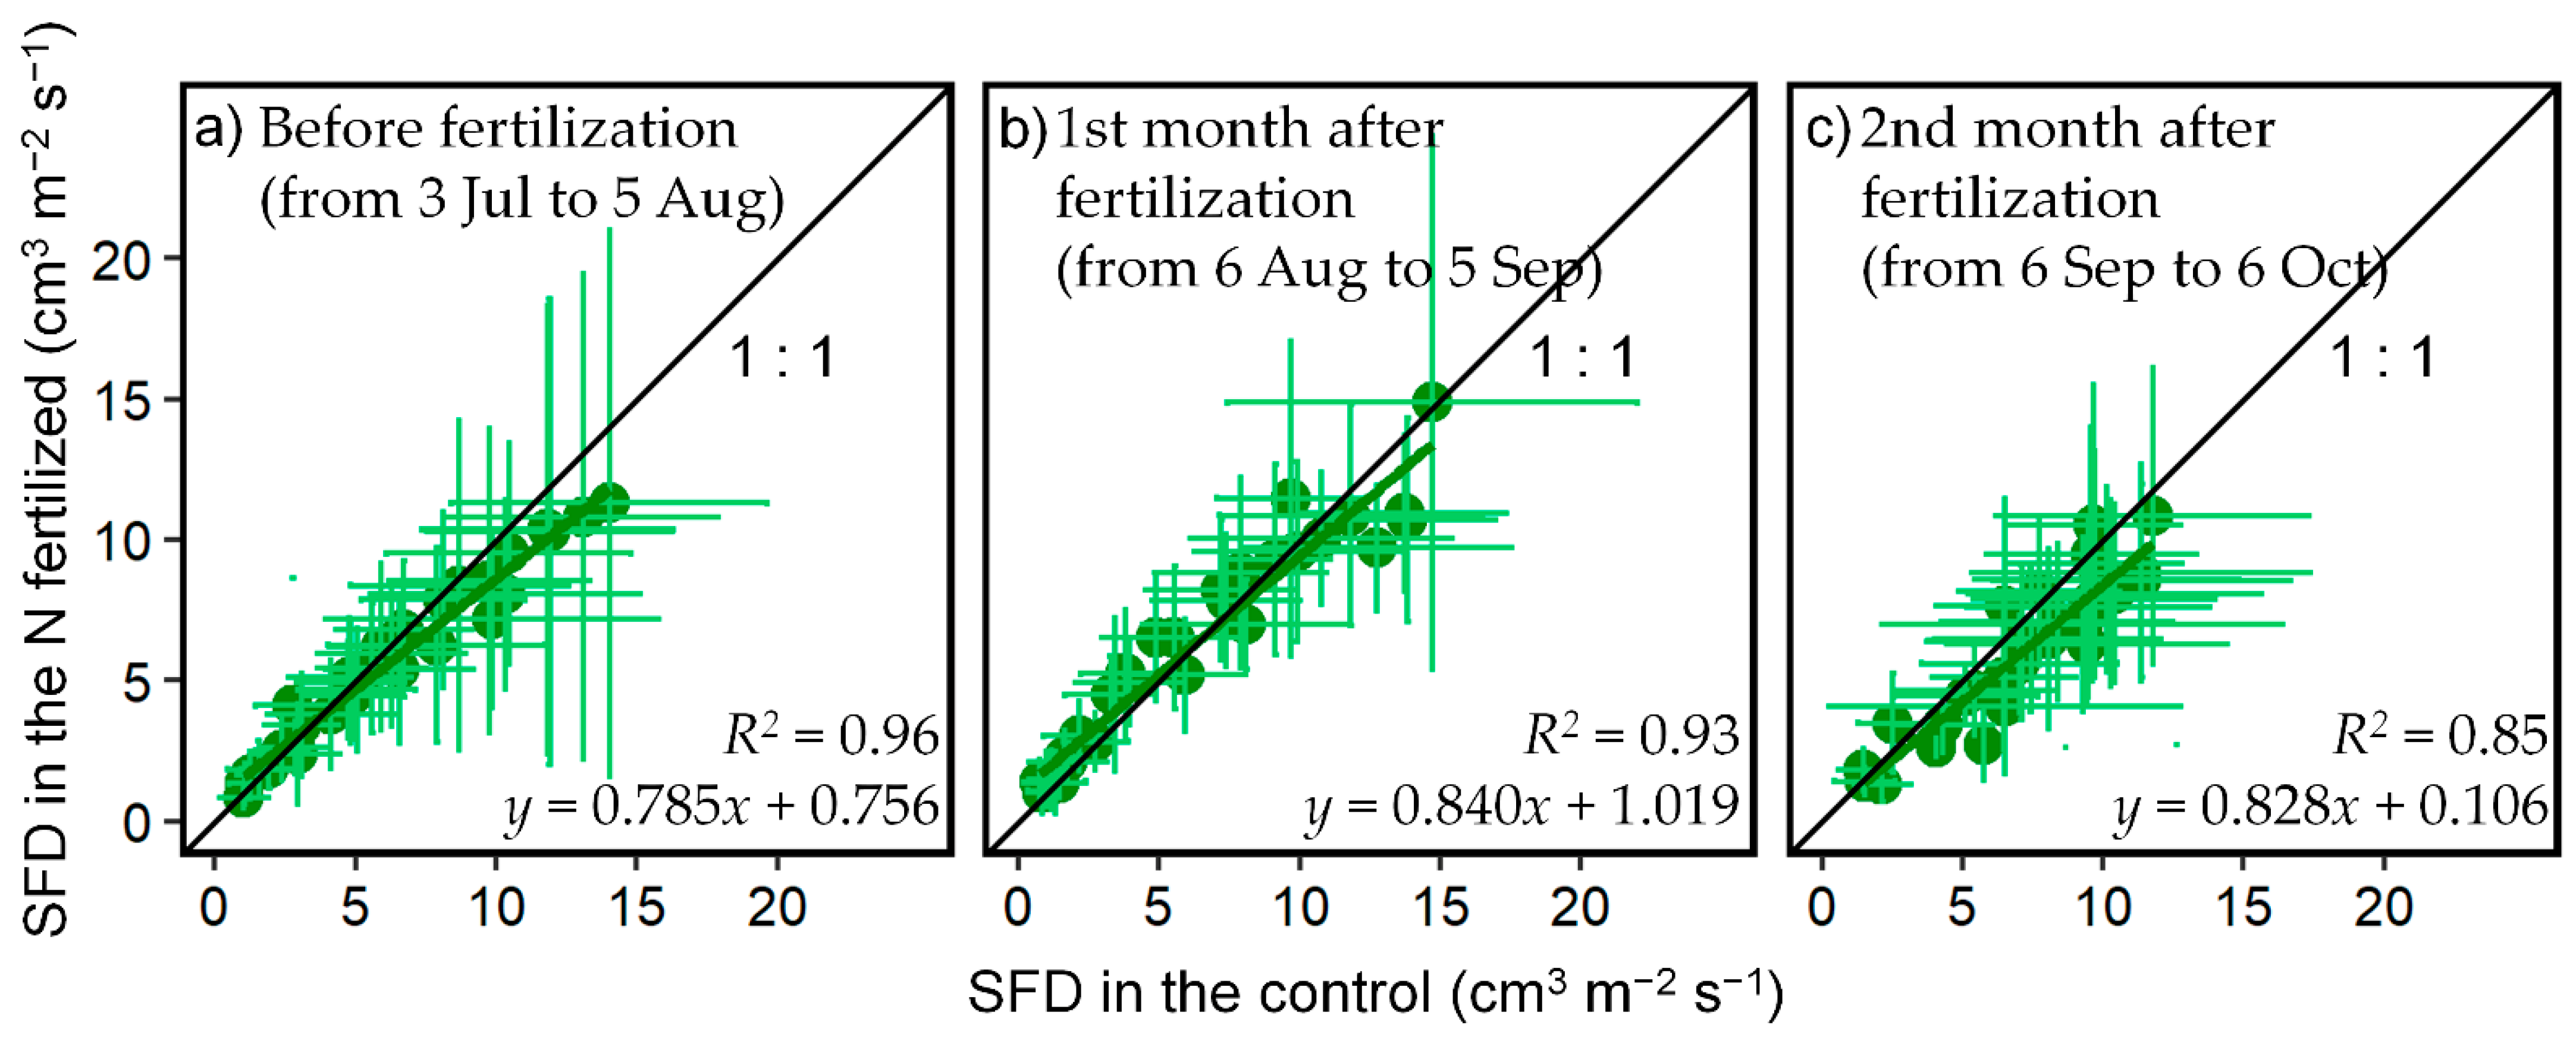
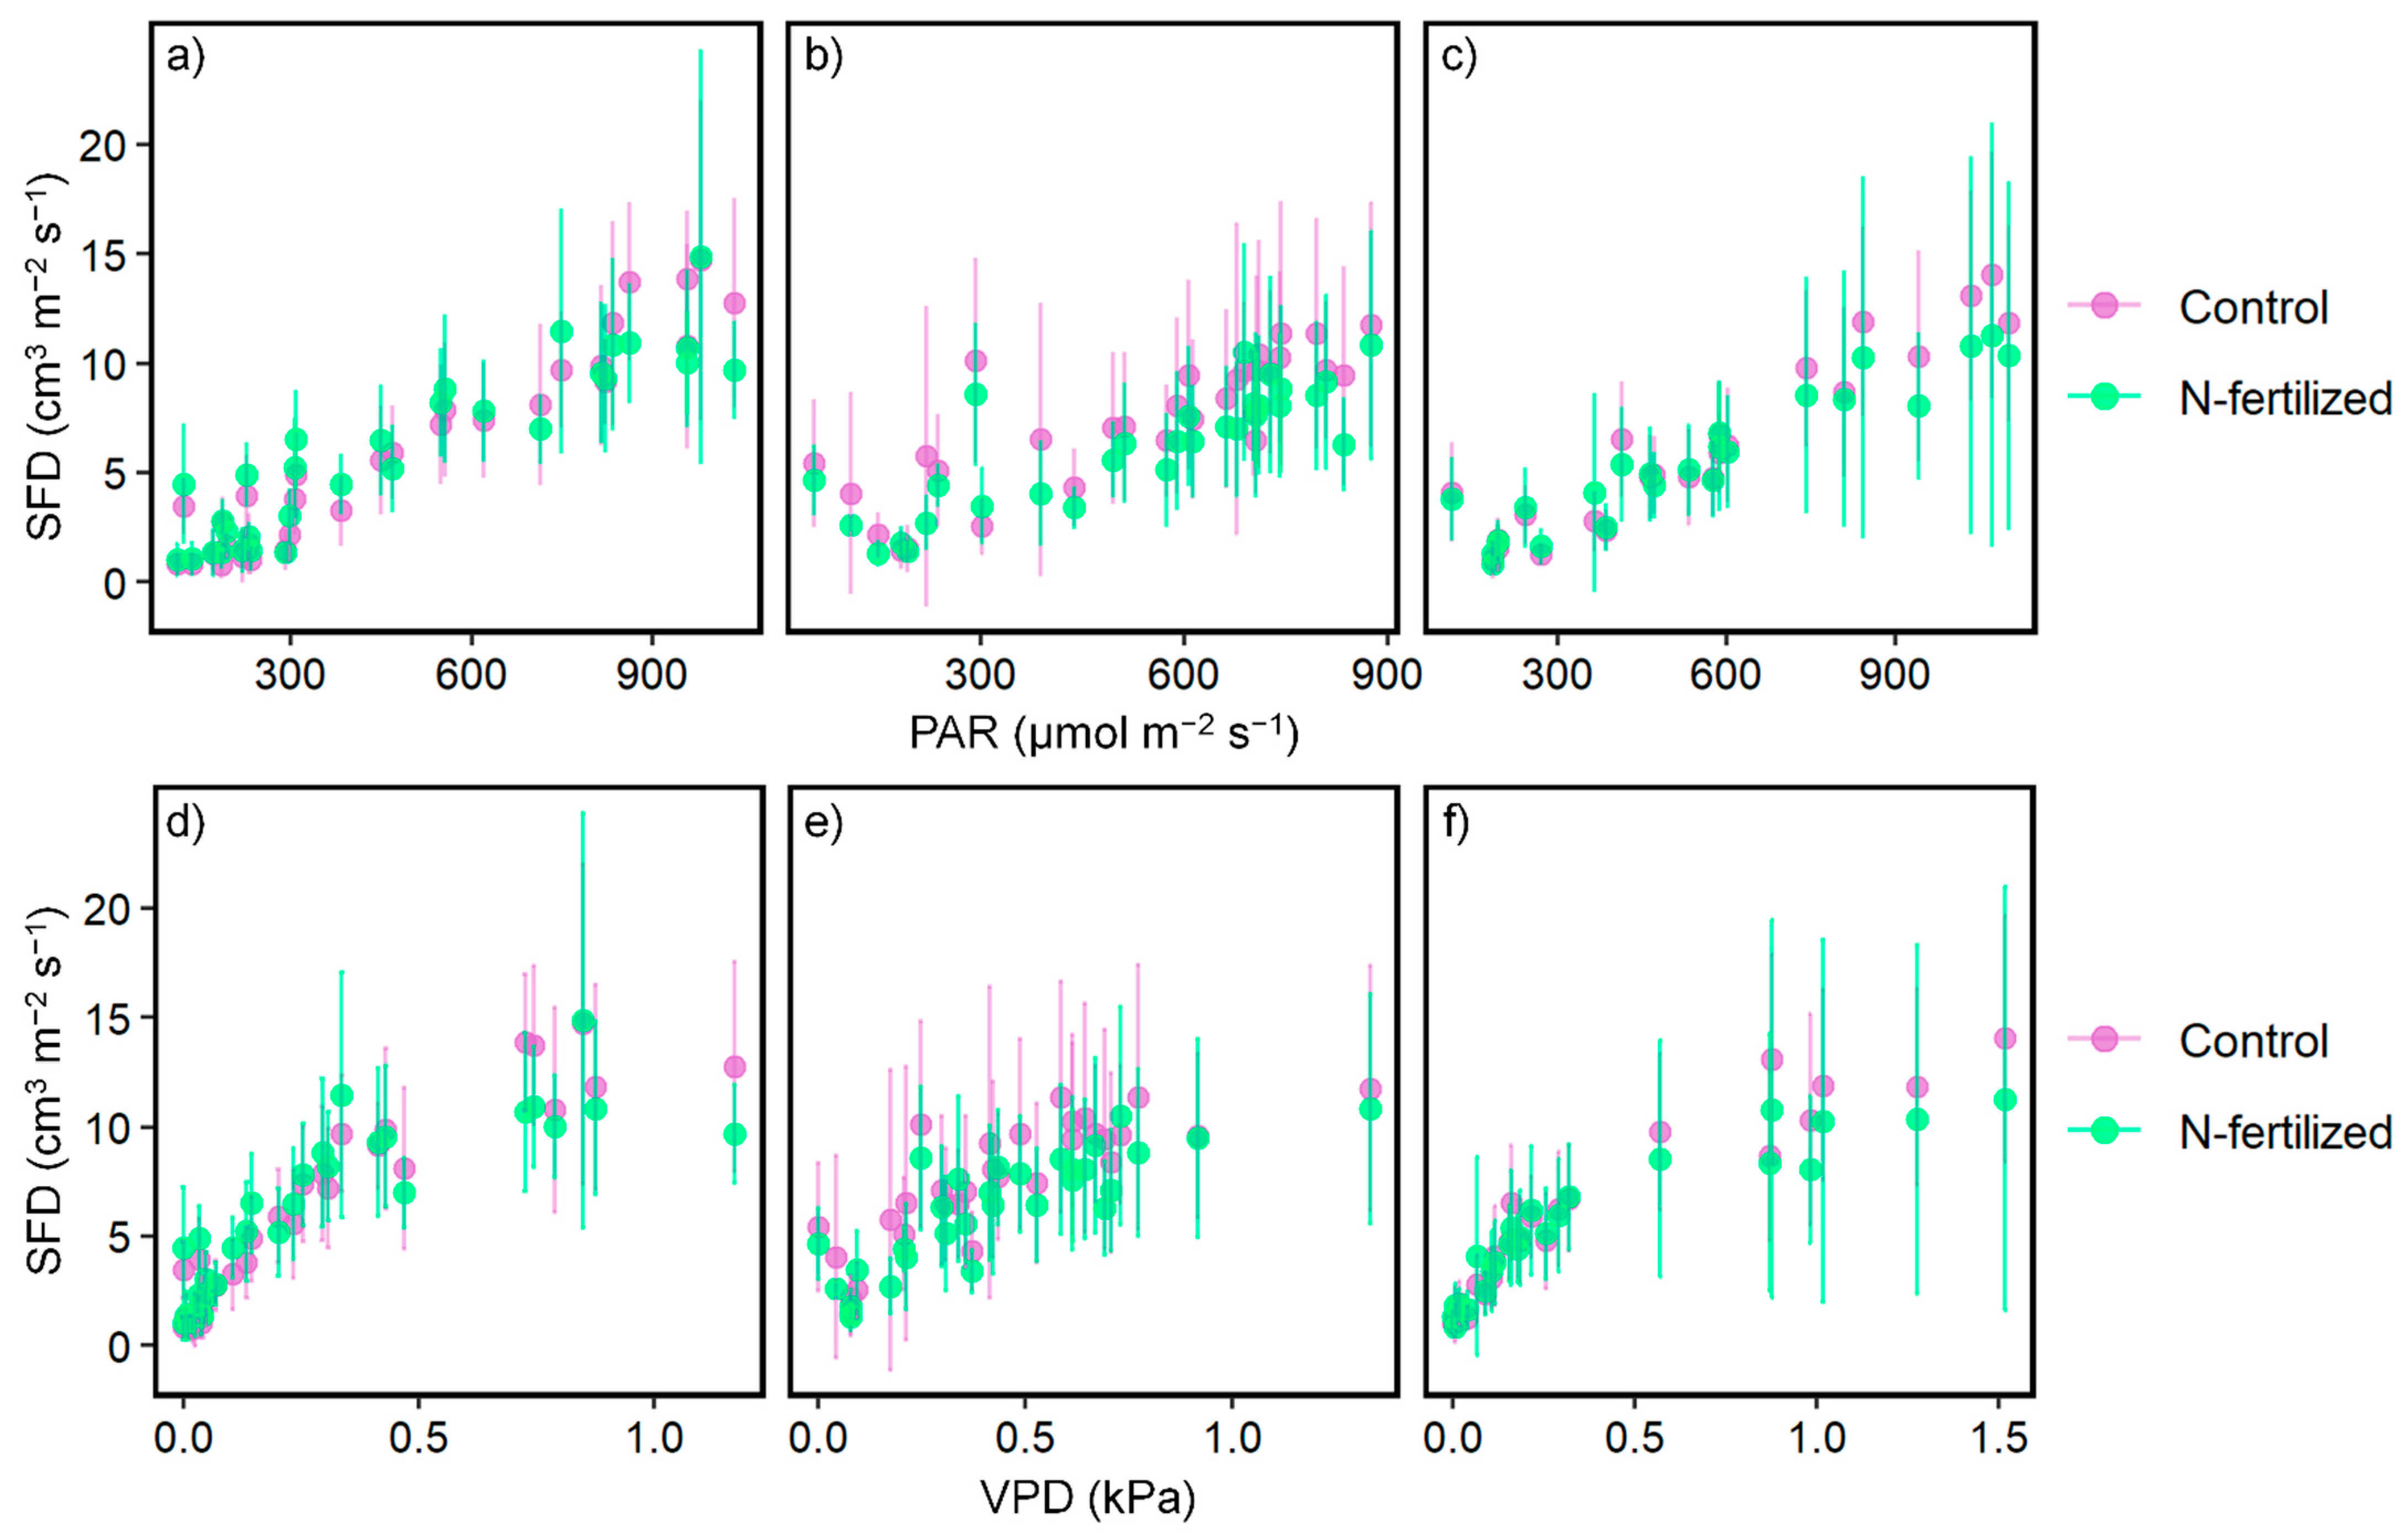
3.1. Effect of N Fertilization on SFD

The diurnal pattern of SFD in tree individuals corresponded to the meteorological conditions (VPD and PAR), which is similar to findings in previous studies [26,35] (Figure 2). The SFDs averaged over individuals in each plot per 10 min were not significantly different between treatments for each day (p > 0.05, t-test). When the daytime mean SFDs of each plot per day were compared, there were no differences in slopes and intercepts of regression lines among the three periods in Figure 3 (p > 0.05, Table 3).
Figure 4 and Table 4 show the responses of SFD to meteorological conditions, such as PAR (μmol m−2 s−1) and VPD (kPa), for three periods in each plot. We found no significant differences in the responses between control and fertilization plots in each period (p > 0.05). In contrast, we detected seasonal variations in relationships between SFD and meteorological conditions among the three periods (p < 0.05). We did not consider the cause of the seasonal variations in the relationships to be a result of fertilization because we saw the same changes in both plots following seasonal transitions.

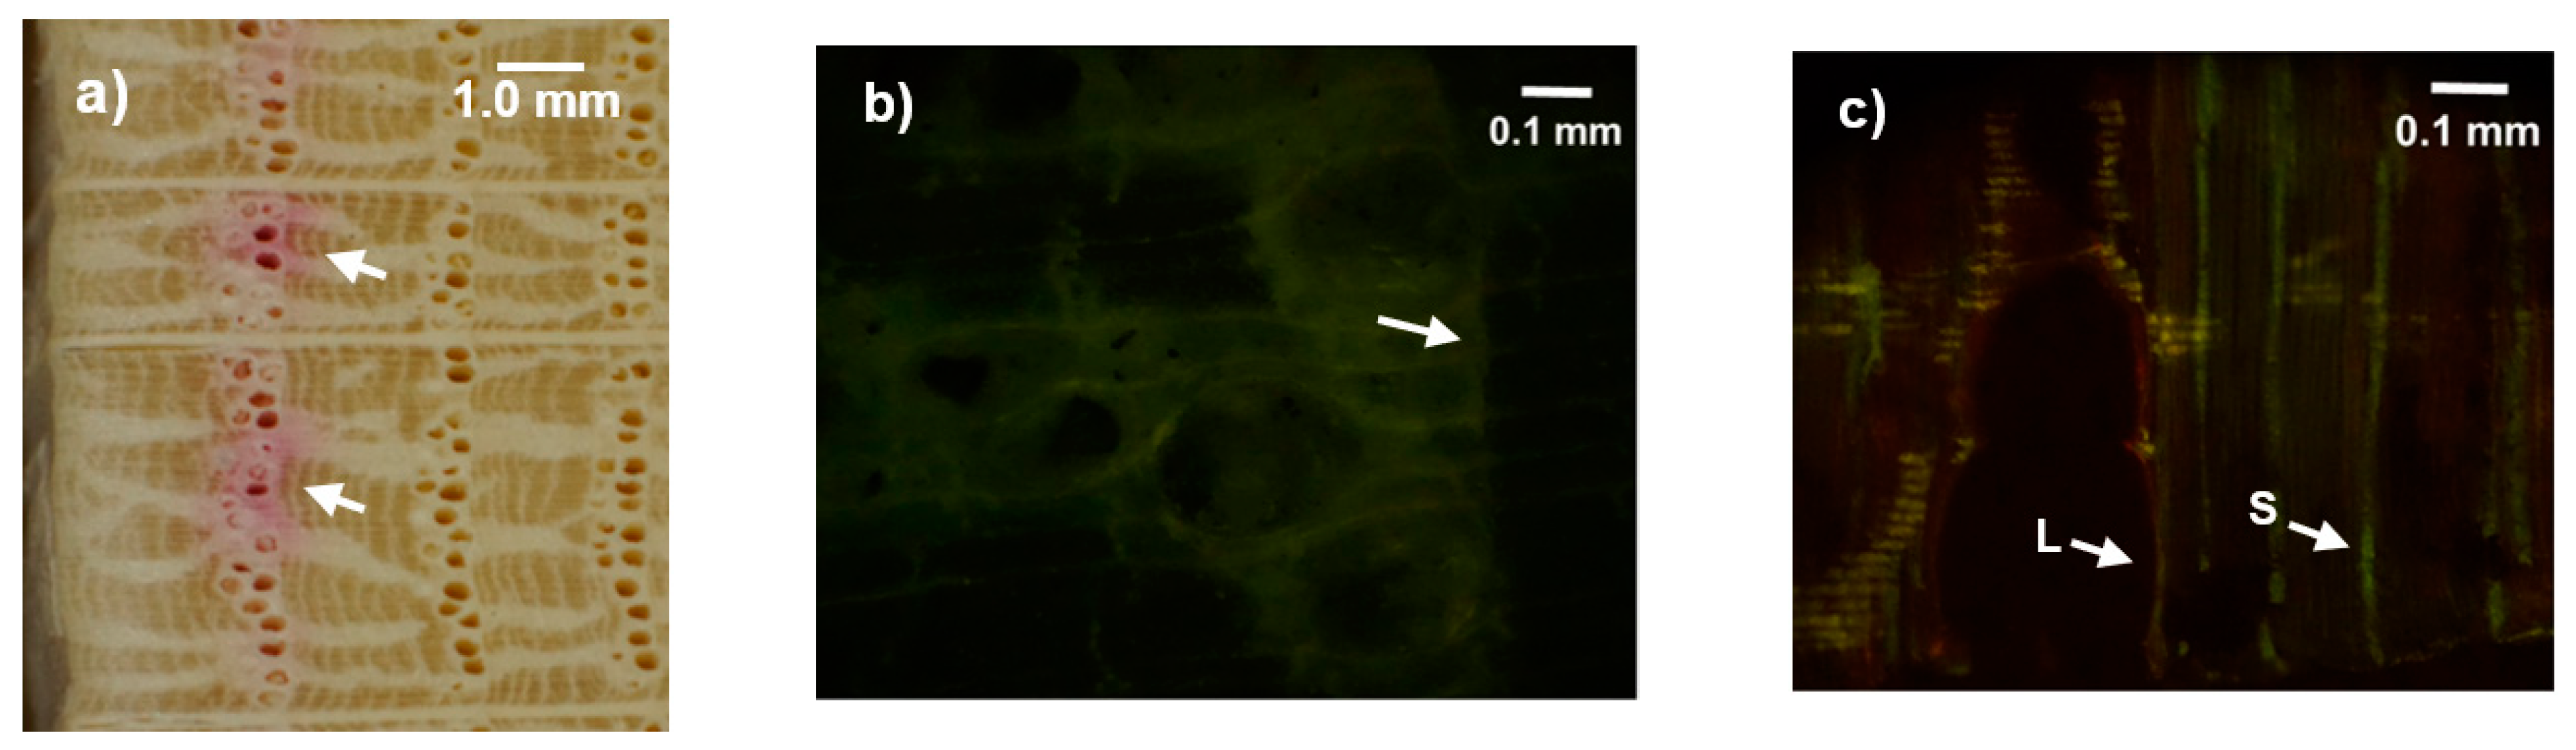
3.2. Dye Injection Experiments

The earlywood vessels ranged from 3 to 7 mm in depth from the cambium. We only observed stained vessels in the earlywood of the current annual ring (Figure 5a) and did not see any fluorescence dye in the second annual ring (Figure 5b). In the earlywood of the current annual ring, large (L) and small (S) vessels showed staining (Figure 5c).

3.3. Leaf N Contents

Before N-fertilization, the mean leaf N contents were 2.25% and 2.17% in the control and N-fertilized plots, respectively (Figure 6a), and after fertilization, 2.12% and 2.20% were found, respectively (Figure 6b). Thus, we did not find significant differences between the control and the N-fertilized plots before and after fertilization (p > 0.05, t-test).

4. Discussion

4.1. Utility of Sap Flux Measurements in N Addition Experiments

Sap flux in sapwood shows radial and circumferential variations [36,37]. A smaller sensor probe length in relation to the active water conducting depth in sapwood leads to larger errors in the calculated sap flux [38]. However, our dye injection experiments indicated that the sap flow of Q. crispula conducted water only in the earlywood of the current annual ring. Therefore, 10 mm long probes fully covered the active water-conducting tissues in this study. Previous studies have reported that only current earlywood vessels in the outermost sapwood function act as water conductors and that previously formed vessels lose water conductivity in ring-porous species [39,40]. However, a previous study reported high sap flux, even in the inner sapwood in a ring porous species [41]. The present results were consistent with the majority of previous studies, in that only current earlywood vessels were stained (Figure 5a–c).
It has also been reported that circumferential variations in sap flow lead to errors when calculating individual sap flux [38,42]. The insertion of sensors in several azimuthal directions per tree is recommended to minimize the errors in individual sap flux. In contrast, for the estimation of stand-scale mean sap flux, tree-to-tree variations are the most important sources of errors, compared with those derived from radial and circumferential variations. Thus, the insertion of as many sensors as possible in one direction per tree is preferable if the number of available sensors is limited [36,43,44]. Furthermore, to capture tree-to-tree variation in sap flux, 10–15 trees are needed to derive the stand-scale mean sap flux with a potential estimation error of 10–15% even in aged and monospecific plantations [45,46]. The number of trees measured in the present study was equivalent to the above-mentioned range.

4.2. Response of Tree Transpiration to Increased N Deposition

In our study, we found nonsignificant, short-term changes in tree transpiration as a response to N-fertilization. The effect of understory vegetation [47] and soil water shortage [48] on canopy tree transpiration was implied; nevertheless, the effect of those conditions on the response of transpiration may be negligible in the present study because two plots were adjacent and regarded as having almost the same conditions (Figure 1e). Consequently, the different responses between two plots were suggested to be caused by increased N. However, our findings differed from a previous study in which a rapid increase in SFD within one month of N-fertilization was observed [16]. The rapid increase was determined to be caused by an increase in leaf area, which may be the reason for the difference in our results, in which an increase in leaf area was not observed. Okano and Nakai [49] suggested that Q. crispula trees expanded their leaves simultaneously, from May to June, and completed their foliation within this period, which differs from Eucalyptus species, which show continuous leaf production throughout the growing season [50]. N fertilization in the middle of the growing season, when leaf expansion has finished, might not stimulate an increase in the leaf area of Q. crispula. The characteristics of the Quercus species that show it to not be highly sensitive to increased N compared with other species supported our findings [51]. A meta-analysis of N addition experiments conducted on native plant species worldwide [7] revealed that N addition predominantly causes an increase in total leaf area and leaf N contents, leading to increases in photosynthesis and transpiration through the changes in leaf physiology. It has also been reported that N addition does not result in leaf morphological changes, such as in specific leaf area (SLA; cm2 g−1) [7], indicating that positive responses of transpiration to N addition are caused by correlative increases in canopy area and/or physiological responses by increasing leaf N contents. The positive correlation between leaf N contents and transpiration has been observed in previous research, targeting mature trees [14] and seedlings [8]. Hence, the nonsignificant changes in LAI (Table 1) and leaf N contents (Figure 6a,b) in response to the present treatments may be a crucial cause of the modest response of tree transpiration.

4.3. Response of Leaf N Contents to Increased N Deposition

A possible reason for the nonsignificant changes in leaf N contents may be the limited number of leaf samples (n = 10). However, the minimum required sample size calculated using Student’s t-test [52] was three to five, with an acceptable error of 10% at the 0.05 significance level for the present study site (Table 5). Therefore, the sample size for leaf N contents in this study was indicated to be satisfactory.
The nonsignificant changes in leaf N contents may be a result of the timing of N addition. Hikosaka et al. [53] reported that leaf productivity such as photosynthesis of Q. crispula increased from June to early August and decreased after that. The N fertilization did not affect leaf N contents in this study because we fertilized in early August, which is the last stage when the productivity of leaves increases. Ueda et al. [54] reported that N absorbed in the previous growing season can be used for current-year fresh leaves. This implies that the effect of N fertilization would appear in leaves in the next growing season, if larger amounts of N were taken up by trees.

4.4. Nonsignificance of the Short-Term Response

The modest short-term response of mature tree transpiration to N addition in the present study suggests that a potential increase in N deposition during the growing season, when trees have completed foliation, would not immediately alter tree transpiration. Nonsignificant short-term changes in tree transpiration in response to N fertilization have been reported in previous studies using seedlings. Decreasing stomatal conductance has been suggested to cause a decline in transpiration 3 months after N fertilization in Quercus robur L. [11]. In addition, stomatal conductance does not increase transpiration in Populus trichocarpa in the short term after N addition [12]. In contrast, short-term increases in the transpiration of mature trees correspond to that of biomass [16]. Therefore, a potential increase in N deposition does not always immediately affect tree transpiration without changes in canopy area and/or leaf physiology caused by N deposition.
There may be a time lag between N addition and the detection of responses in transpiration. Similar time lags between air pollutants (O3) and tree growth have been reported [55,56]. This time lag may underestimate the effects of elevated N deposition in a forest ecosystem; therefore, we will continue to monitor SFD until changes are detected.

5. Conclusions

The immediate responses in the transpiration of individual trees to an increase in N supply after leaf flushing were examined in the present study. We clarified that the short-term response was negligible in this Q. crispula plantation and suggest that a potential increase in N deposition during the growing season, when trees have completed foliation, may not immediately alter tree transpiration. There may be a time lag between N addition and tree response. Therefore, further studies are needed to clarify the long-term effects on tree transpiration in this region in the context of the trend for marginal increases in N deposition with the measurements of morphological and physiological leaf traits, total leaf area, and root biomass.

Supplementary Materials

The following supporting information can be downloaded at: https://www.mdpi.com/article/10.3390/nitrogen3010006/s1, Table S1: Periods with available data per sensor for two weeks from 3 July 2019 to 16 July 2019; Table S2: Periods with available data per sensor for two weeks from 17 July 2019 to 30 July 2019; Table S3: Periods with available data per sensor for two weeks from 31 July 2019 to 13 August 2019; Table S4: Periods with available data per sensor for two weeks from 14 August 2019 to 27 August 2019; Table S5: Periods with available data per sensor for two weeks from 28 August 2019 to 10 September 2019; Table S6: Periods with available data per sensor for two weeks from 11 September 2019 to 24 September 2019; Table S7: Periods with available data per sensor for two weeks from 25 September 2019 to 6 October 2019.

Author Contributions

Conceptualization, N.N., T.K., and M.C.; investigation, N.N., T.K., Y.U., N.T., K.O., and M.C.; formal analysis, N.N.; writing—original draft, N.N.; writing—review and editing, N.N., T.K., Y.U., N.T., K.O., and M.C. All authors have read and agreed to the published version of the manuscript.

Funding

This work was partly supported by KAKENHI (17H03833 and 19H03088) and the Sasakawa Scientific Research Grant from The Japan Science Society.

Data Availability Statement

Not applicable.

Acknowledgments

This research was supported by the staff and students of the Laboratory of Forest Ecosystem Management and of the Ashoro Research Forest, Kyushu University, Japan. We thank Margaret J. Sporck-Koehler, from Edanz Group (www.edanzediting.com/ac, accessed 9 June 2021) for editing a draft of this manuscript.

Conflicts of Interest

The authors declare no conflict of interest.

References

  1. Ackerman, D.; Millet, D.B.; Chen, X. Global Estimates of Inorganic Nitrogen Deposition AcrossFour Decades. Glob. Biogeochem. Cycles 2018, 33, 100–107. [Google Scholar] [CrossRef] [Green Version]
  2. Galloway, J.N.; Dentene, F.J.; Capone, D.G.; Boyer, E.W.; Howarth, R.W.; Seitzinger, S.P.; Asner, G.P.; Cleveland, C.C.; Green, P.A.; Holland, E.A.; et al. Nitrogen cycles: Past, present, and future. Biogeochemistry 2004, 70, 153–226. [Google Scholar] [CrossRef]
  3. Gao, Q.; Hasselquist, N.J.; Palmroth, S.; Zheng, Z.; You, W. Short-term response of soil respiration to nitrogen fertilization in a subtropical evergreen forest. Soil Biol. Biochem. 2014, 76, 297–300. [Google Scholar] [CrossRef]
  4. Aber, J.; McDowell, W.; Nadelhoffer, K.; Magill, A.; Berntson, G.; Kamakea, M.; McNulty, S.; Currie, W.; Rustad, L.; Fernandez, I. Nitrogen saturation in temperate forest ecosystem. hypotheses rivisited. Bioscience 1998, 48, 921–934. [Google Scholar] [CrossRef]
  5. Högberg, P.; Fan, H.; Quist, M.; Binkley, D.; Tamm, C. Tree growth and soil acidification in response to 30 years of experimental nitrogen loading on boreal forest. Glob. Chang. Biol. 2006, 12, 489–499. [Google Scholar] [CrossRef]
  6. Bobbink, R.; Hicks, K.; Galloway, J.; Spranger, T.; Alkemade, R.; Ashmore, M.; Bustamante, M.; Cinderby, S.; Davidson, E.; Dentener, F.; et al. Global assessment of nitrogen deposition effects on terrestrial plant. Ecol. Appl. 2010, 20, 30–59. [Google Scholar] [CrossRef] [PubMed] [Green Version]
  7. Liang, X.; Zhang, T.; Lu, X.; Ellsworth, D.S.; BassiriRad, H.; You, C.; Wang, D.; He, P.; Deng, Q.; Liu, H.; et al. Global response patterns of plant photosynthesis to nitrogen addition: A meta-analysis. Glob. Chang. Biol. 2020, 26, 3585–3600. [Google Scholar] [CrossRef] [PubMed]
  8. Nagakura, J.; Kaneko, S.; Takahashi, M.; Tange, T. Nitrogen promotes water consumption in seedlings of Cryptomeria japonica but not in Chamaecyparis obtusa. For. Ecol. Manag. 2008, 255, 2533–2541. [Google Scholar] [CrossRef]
  9. Yang, Q.; Zhang, F.; Li, F. Effect of different drip irrigation methods and fertilization on growth, physiology and water use of young apple tree. Sci. Hortic. 2011, 129, 119–126. [Google Scholar] [CrossRef]
  10. Nilsen, P. Effect of nitrogen on drought strain and nutrient uptake in Norway spruce Picea abies (L.) Karst.) trees. Plant Soil 1995, 172, 73–85. [Google Scholar] [CrossRef]
  11. Welander, N.T.; Ottosson, B. The influence of low light, drought and fertilization on transpiration and growth in young seedlings of Quercus robur L. For. Ecol. Manag. 2000, 127, 139–151. [Google Scholar] [CrossRef]
  12. Harvey, H.P.; Van Den Driessche, R. Nitrogen and potassium effects on xylem cavitation and water-use efficiency in poplars. Tree Physiol. 1999, 19, 943–950. [Google Scholar] [CrossRef] [PubMed]
  13. Hu, Y.; Zhao, P.; Zhu, L.; Zhao, X.; Ni, G.; Ouyang, L.; Schäfer, K.V.R.; Shen, W. Responses of sap flux and intrinsic water use efficiency to canopy and understory nitrogen addition in a temperate broadleaved deciduous forest. Sci. Total Environ. 2019, 648, 325–336. [Google Scholar] [CrossRef] [PubMed]
  14. Forrester, D.I.; Collopy, J.J.; Beadle, C.L.; Warren, C.R.; Baker, T.G. Effect of thinning, pruning and nitrogen fertiliser application on transpiration, photosynthesis and water-use efficiency in a young Eucalyptus nitens plantation. For. Ecol. Manag. 2012, 266, 286–300. [Google Scholar] [CrossRef]
  15. Ewers, B.E.; Oren, R.; Albaugh, T.J.; Dougherty, P.M. Carry-over effects of water and nutrient supply on water use of pinus taeda. Ecol. Appl. 1999, 9, 513–525. [Google Scholar] [CrossRef]
  16. Hubbard, R.M.; Ryan, M.G.; Giardina, C.P.; Barnard, H. The effect of fertilization on sap flux and canopy conductance in a Eucalyptus saligna experimental forest. Glob. Chang. Biol. 2004, 10, 427–436. [Google Scholar] [CrossRef]
  17. Lu, X.; Liu, Z.; An, S.; Miralls, D.G.; Maes, W.; Liu, Y.; Tang, J. Potential of solar-induced chlorophyll fluorescence to estimate transpiration in a temperate forest. Agric. For. Meteorol. 2018, 252, 75–87. [Google Scholar] [CrossRef]
  18. Wang, F.; Zhang, F.; Gou, X.; Fonti, P.; Xia, J.; Gao, Z.; Liu, J.; Wang, Y.; Zhang, J. Seasonal variations in leaf-level photosynthesis and water use efficiency of three isohydric to anisohydric conifers on the Tibetan Plateau. Agric. For. Meteorol. 2021, 308–309, 108581. [Google Scholar] [CrossRef]
  19. Chiwa, M. Long-term changes in atmospheric nitrogen deposition and stream water nitrate leaching from forested watersheds in western Japan. Environ. Pollut. 2021, 287, 117634. [Google Scholar] [CrossRef] [PubMed]
  20. Japan Meteorological Agency. Available online: http://www.jma.go.jp/jma/ (accessed on 13 August 2021).
  21. Imada, M. Study on the high forest system of Mizunara (Quercus crispula Blume). Bull. Kyushu Univ. For. 1972, 45, 81–225. [Google Scholar]
  22. Chiwa, M.; Nakamura, T. Temporal variation of air temperature, snow depth, and soil temperature at different slopes of Ashoro Research Forest, Kyushu University. Bull. Kyushu Univ. For. 2020, 101, 7–11, (In Japanese with English Summary). [Google Scholar]
  23. Frazer, G.W.; Canham, C.D.; Lertzman, K.P. Gap light analyzer (GLA), Version 2.0: Image-processing software to analyze true-color, hemispherical canopy photographs. Bull. Ecol. Soc. Am. 2000, 81, 191–197. [Google Scholar]
  24. Buck, A.L. New Equations for Computing Vapor Pressure and Enhancement Factor. J. Appl. Meteorol. Climatol. 1981, 20, 1527–1532. [Google Scholar] [CrossRef] [Green Version]
  25. Granier, A. Evaluation of transpiration in a Douglas-fir stand by means of sap flow measurements. Tree Physiol. 1987, 3, 309–320. [Google Scholar] [CrossRef] [PubMed]
  26. James, S.A.; Clearwater, M.J.; Meinzer, F.C.; Goldstein, G. Heat dissipation sensors of variable length for the measurement of sap flow in trees with deep sapwood. Tree Physiol. 2002, 22, 277–283. [Google Scholar] [CrossRef] [PubMed] [Green Version]
  27. Lu, P.; Urban, L.; Ping, Z. Granier’s Thermal Dissipation Probe (TDP) Method for Measuring Sap Flow in Trees: Theory and Practice. Acta Bot. Sin. 2004, 46, 631–646. [Google Scholar]
  28. Shen, Y.; Fukatsu, E.; Muraoka, H.; Saitoh, T.M.; Hirano, Y.; Yasue, K. Climate responses of ring widths and radial growth phenology of Betula ermanii, Fagus crenata and Quercus crispula in a cool temperate forest in central Japan. Trees 2020, 34, 679–692. [Google Scholar] [CrossRef]
  29. Song, L.; Kuang, F.; Skiba, U.; Zhu, B.; Liu, X.; Levy, P.; Dore, A.; Fowler, D. Bulk deposition of organic and inorganic nitrogen in southwest China from 2008 to 2013. Environ. Pollut. 2017, 227, 157–166. [Google Scholar] [CrossRef]
  30. Wang, X.; Wu, Z.; Shao, M.; Fang, Y.; Zhang, L.; Chen, F.; Chan, P.W.; Fan, Q.; Wang, Q.; Zhu, S.; et al. Atmospheric nitrogen deposition to forest and estuary environments in the Pearl River Delta region, southern China. Tellus B 2013, 65, 20480. [Google Scholar] [CrossRef] [Green Version]
  31. Stevens, C.J.; Duprè, C.; Dorland, E.; Gaudnik, C.; Gowing, D.J.G.; Bleeker, A.; Diekmann, M.; Alard, D.; Bobbink, R.; Fowler, D.; et al. Nitrogen deposition threatens species richness of grasslands across Europe. Environ. Pollut. 2010, 158, 2940–2945. [Google Scholar] [CrossRef] [Green Version]
  32. Umebayashi, T.; Utsumi, Y.; Koga, S.; Inoue, S.; Shiiba, Y.; Arakawa, K.; Matsumura, J.; Oda, K. Optimal conditions for visualizing water-conducting pathways in a living tree by the dye injection method. Tree Physiol. 2007, 27, 993–999. [Google Scholar] [CrossRef] [PubMed] [Green Version]
  33. R Core Team. R: A Language and Environment for Statistical Computing; R Foundation for Statistical Computing: Vienna, Austria, 2019. [Google Scholar]
  34. RStudio Inc. Available online: https://rstudio.com/ (accessed on 13 August 2021).
  35. Ocheltree, T.W.; Nippert, J.B.; Prasad, P.V.V. Stomatal responses to changes in vapor pressure deficit reflect tissue-specific differences in hydraulic conductance. Plant Cell Environ. 2014, 37, 132–139. [Google Scholar] [CrossRef] [PubMed]
  36. Kume, T.; Otsuki, K.; Du, S.; Yamanaka, N.; Wang, Y.-L.; Liu, G.-B. Spatial variation in sap flow velocity in semiarid region trees: Its impact on stand-scale transpiration estimates. Hydrol. Processes 2012, 26, 1161–1168. [Google Scholar] [CrossRef]
  37. Tseng, H.; Chiu, C.W.; Laplace, S.; Kume, T. Can we assume conservative temporal change in spatial variation of sap flux for year-round tree transpiration estimates? A case study in a Cryptomeria Japonica, central Taiwan. Trees 2017, 31, 1239–1251. [Google Scholar] [CrossRef]
  38. Tsuruta, K.; Kume, T.; Komatsu, H.; Higashi, N.; Umebayashi, T.; Kumagai, T.; Otsuki, K. Azimuthal variations of sap flux density within Japanese cypress xylem trunks and their effects on tree transpiration estimates. J. For. Res. 2010, 15, 398–403. [Google Scholar] [CrossRef]
  39. Umebayashi, T.; Utsumi, Y.; Koga, S.; Inoue, S.; Matsumura, J.; Oda, K.; Fujikawa, S.; Arakawa, K.; Otsuki, K. Xylem water-conducting patterns of 34 broadleaved evergreen trees in southern Japan. Trees 2010, 24, 571–583. [Google Scholar] [CrossRef]
  40. Umebayashi, T.; Fukuda, K. Seasonal changes in the occurrence of embolisms among broadleaved trees in a temperate region. Botany 2018, 96, 873–881. [Google Scholar] [CrossRef]
  41. Phillips, N.; Oren, R.; Zimmermann, R. Radial patterns of xylem sap flow in non-, diffuse- and ring-porous tree species. Plant Cell Environ. 1996, 19, 983–990. [Google Scholar] [CrossRef]
  42. Tateishi, M.; Kumagai, T.; Utsumi, Y.; Umebayashi, T.; Shiiba, Y.; Inoue, K.; Cho, K.; Otsuki, K. Spatial variations in xylem sap flux density in evergreen oak trees with radial-porous wood: Comparisons with anatomical observations. Trees 2008, 22, 23–30. [Google Scholar] [CrossRef]
  43. Komatsu, H.; Shinohara, Y.; Kume, T.; Tsuruta, K.; Otsuki, K. Does measuring azimuthal variations in sap flux lead to more reliable stand transpiration estimates? Hydrol. Process 2016, 30, 2129–2137. [Google Scholar] [CrossRef]
  44. Komatsu, H.; Kume, T.; Shinohara, Y. Optimal sap flux sensor allocation for stand transpiration estimates: A non-dimensional analysis. Ann. For. Sci. 2017, 74, 38. [Google Scholar] [CrossRef]
  45. Kume, T.; Tsuruta, K.; Komatsu, H.; Kumagai, T.; Higashi, N.; Shinohara, Y.; Otsuki, K. Effects of sample size on sap flux-based stand-scale transpiration estimates. Tree Physiol. 2010, 30, 129–138. [Google Scholar] [CrossRef] [PubMed] [Green Version]
  46. Kume, T.; Onozawa, Y.; Komatsu, H.; Tsuruta, K.; Shonohara, Y.; Umebayashi, T.; Otsuki, K. Stand-scale transpiration estimates in a Moso bamboo forest: (I) Applicability of sap flux measurements. For. Ecol. Manag. 2010, 260, 1287–1294. [Google Scholar] [CrossRef]
  47. Gobin, R.; Korboulewsky, N.; Dumas, Y.; Balandier, P. Transpiration of four common understorey plant species according to drought intensity in temperate forests. Ann. For. Sci. 2015, 72, 1053–1064. [Google Scholar] [CrossRef] [Green Version]
  48. Pietsch, S.A.; Hasenauer, H.; Kučera, J.; Čermák, J. Modeling effects of hydrological changes on the carbon and nitrogen balance of oak in floodplains. Tree Physiol. 2003, 23, 735–746. [Google Scholar] [CrossRef] [Green Version]
  49. Okano, T.; Nakai, T. Seasonal patterns of seedling growth and dry matter partitioning of deciduous broad-leaved trees in Hokkaido. Bull. Kyushu Univ. For. 1992, 65, 1–14, (In Japanese with English summary). [Google Scholar]
  50. Wirabuana, P.Y.A.P.; Sadono, R.; Juniarso, S. Fertilization Effects on Early Growth, Aboveground Biomass, Carbon Storage, and Leaf Characteristics of Eucalyptus pellita F. Muell. in South Sumatera. J. Manaj. Hutan Trop. 2019, 25, 154–163. [Google Scholar] [CrossRef] [Green Version]
  51. Guehl, J.M.; Fort, C.; Fehri, A. Differential response of leaf conductance, carbon isotope discrimination and water-use efficiency to nitrogen deficiency in maritime pine and pedunculate oak plants. New Phytol. 1995, 131, 149–157. [Google Scholar] [CrossRef]
  52. Adachi, M.; Bekku, Y.S.; Konuma, A.; Kadir, W.R.; Okuda, T.; Koizumi, H. Required sample size for estimating soil respiration rates in large areas of two tropical forests and of two types of plantation in Malaysia. For. Ecol. Manag. 2005, 210, 455–459. [Google Scholar] [CrossRef]
  53. Hikosaka, K.; Nabeshima, E.; Hiura, T. Seasonal changes in the temperature response of photosynthesis in canopy leaves of Quercus crispula in a cool-temperate forest. Tree Physiol. 2007, 27, 1035–1041. [Google Scholar] [CrossRef]
  54. Ueda, M.U.; Mizumachi, E.; Tokuchi, N. Foliage nitrogen turnover: Differences among nitrogen absorbed at different times by Quercus serrata saplings. Ann. Bot. 2011, 108, 169–175. [Google Scholar] [CrossRef] [PubMed] [Green Version]
  55. Krause, G.H.M.; Höckel, F.E. Long-term effects of ozone on Fagus sylvatica L.—An open-top chamber exposure study. Water Air Soil Pollut. 1995, 85, 1337–1342. [Google Scholar] [CrossRef]
  56. Lucas, P.W.; Diggle, P.J. The use of longitudinal data analysis to study the multi-seasonal growth responses of Norway and Sitka spruce to summer exposure to ozone: Implications for the determination of critical levels. New Phytol. 1997, 137, 315–323. [Google Scholar] [CrossRef] [PubMed]
Figure 1. Meteorological conditions and soil moisture from 11 July 2019 to 6 October 2019. (a) Daily total amount of precipitation (P). (b) The daytime mean photosynthetic active radiation (PAR). (c) The daytime mean vapor pressure deficit (VPD). (d) The daytime mean temperature (T). (e) Weighted averages of volumetric water contents (VWC) per plot. The solid line represents the control, and the dotted line represents the N-fertilized plots. The weighted averages were calculated from the values measured at depths of 10, 20, and 50 cm.
Nitrogen 03 00006 g001
Figure 2. The diurnal variation of (ac) photosynthetic active radiation (PAR; purple circles), vapor pressure deficit (VPD; orange circles), and (df) mean sap flow density (SFD) in the control (light blue circles) and the N-fertilized (yellow circles) plots. Error bars in (df) are the standard deviation of SFDs in individual trees (n = 11–14). The dates used were (a,d) 2 August 2019, (b,e) 6 August 2019, and (c,f) 10 September 2019.
Nitrogen 03 00006 g002
Figure 3. Comparison of the relationship between daily mean sap flow density (SFD) in the control and the N-fertilized plots (n = 3–15) in three periods: (a) before fertilization from 3 July 2019 to 5 August 2019, (b) 1st month after fertilization from 6 August 2019 to 5 September 2019, and (c) 2nd month after fertilization from 6 September 2019 to 6 October 2019. Formulas correspond to each regression line. R2 is the coefficient of determination. Error bars are the standard deviation of SFDs in individual trees (n = 3–15) for each plot.
Nitrogen 03 00006 g003
Figure 4. Comparison of the relationship between daytime mean sap flow density (SFD, n = 3–15) and meteorological conditions such as photosynthetic active radiation (PAR) and vapor pressure deficit (VPD) in three periods in 2019. Purple points indicate the data in the control plot, and green indicates the data in the N-fertilized plot. (ac) and (df) indicate SFD vs. PAR and SFD vs. VPD, respectively. (a,d), (b,e), and (c,f) indicate the data before fertilization from 3 July 2019 to 5 August 2019, 1st month after fertilization from 6 August 2019 to 5 September 2019, and 2nd month after fertilization from 6 September 2019 to 6 October 2019. Error bars are the standard deviation of SFDs in individual trees (n = 3–15).
Nitrogen 03 00006 g004
Figure 5. Micrographs of xylem for the dye injection experiment. (a) A part of a cross-sectional disc at 0.5 m from the dye injection site. The arrow shows stained large-diameter outermost vessels. (b) The outermost vessels in a radiation cross-sectional face. The arrow shows the fluorescent dye in the vessel lumen. (c) The outermost vessels in a cross-sectional face. The arrow shows the fluorescent dye in the vessel lumen and the annual ring boundary. L = large vessel. S = small vessel.
Nitrogen 03 00006 g005
Figure 6. (a) Tree leaf N contents before fertilization in July and (b) after fertilization in September (n = 10). The upper end of the line means the maximum. The upper end of the box means the first quartile. The center line of the box means the median. The lower end of the box means the third quartile. The lower end of the line means the minimum. The black circles indicate raw data points. The yellow boxes indicate the data in the control plot, and the light blue boxes indicate the data in the N-fertilized plot. No significant difference was found between the control and the N-fertilized before and after N-fertilization (p > 0.05, t-test).
Nitrogen 03 00006 g006
Table 1. Stand density (SD) and the average of leaf area index (LAI; n = 8), and diameter at breast height (DBH; n = 16) of sap flow measurement trees.
Stand Density (SD, Stems ha−1)Leaf Area Index (LAI, m2 m−2)Diameter at Breast Height (DBH, cm)
Control41883.9513 ± 1.1
N-Fertilized42504.0212 ± 1.5
p values-0.620.37
Table 2. Diameter at breast height (DBH) and tree height of target trees for dye injection experiment (n = 4).
Tree SampleT1T2T3T4
DBH (cm)9.311.513.414.5
Tree Height (m)10.810.512.212.3
Table 3. Comparison of slopes and interceptions of regression lines in Figure 3.
Before (from 3 July 2019 to 5 August 2019)1st Month after (from 6 August 2019 to 5 September 2019)2nd Month after (from 6 September 2019 to 6 October 2019)p Value
a 10.7850.8400.828>0.05
b0.7561.0190.106>0.05
R20.960.930.85
1 Coefficients in regression line y = ax + b and significance for ANCOVA in the datasets of the daily mean SFD that each plot covered: before fertilization from 3 July 2019 to 5 August 2019; 1st month after fertilization from 6 August 2019 to 5 September 2019; 2nd month after fertilization from 6 September 2019 to 6 October 2019.
Table 4. Summary of ANCOVA to examine significant difference for the daytime mean sap flow density (SFD) vs. meteorological conditions such as photosynthesis active radiation (PAR) and vapor pressure deficit (VPD) between the control and the N-fertilized in Figure 4.
Before (from 3 July 2019 to 5 August 2019)1st Month after (from 6 August 2019 to 5 September 2019)2nd Month after (from 6 September 2019 to 6 October 2019)1 p Value
PARControla0.0110.0140.0099ns
b−0.25−0.942.18<0.05
R20.790.930.67-
N-fertilizeda0.00910.0120.0091ns
b0.500.301.46<0.05
R20.800.840.70-
pnsnsns-
VPDControla7.2412.918.03<0.05
b3.032.243.92ns
R20.690.860.65-
N-fertilizeda5.7210.227.42<0.05
b3.203.083.02ns
R20.670.710.67-
2 p valuep3 nsnsns-
1 Results of tests between the periods. 2 Results of tests between the plots. 3 Ns mean no significant difference.
Table 5. Required sample size of leaf N contents within ±10% and ±20% of the sample mean at the 95% probability level.
JulySeptember
ControlN-FertilizedControlN-Fertilized
Sample number10101010
Mean value (%)2.252.172.122.20
Standard deviation (%)0.180.170.180.21
Required sample size (±10%)3345
Required sample size (±20%)1111
Publisher’s Note: MDPI stays neutral with regard to jurisdictional claims in published maps and institutional affiliations.

