Article

Feasibility Study of Using Absolute SPAD Values for Standardized Evaluation of Corn Nitrogen Status

by
Abdelaziz Rhezali
1,* and
Abdellah El Aissaoui
2
1
Private Crop Advisor Accredited by the Ministry of Agriculture, Department of Private Crop Consultant, P.O. Box 607, Rabat 10101, Morocco
2
Laboratory of Agricultural Engineering and Energy, National Institute of Agricultural Research, P.O. Box 586, Settat 26000, Morocco
*
Author to whom correspondence should be addressed.
Nitrogen 2021, 2(3), 298-307; https://doi.org/10.3390/nitrogen2030020
Submission received: 30 October 2020 / Revised: 20 January 2021 / Accepted: 9 April 2021 / Published: 28 June 2021

Abstract

:
Nitrogen fertilizer recommendations for corn (Zea mays L.) should ensure high yields using adequate N doses. Soil–plant analysis development (SPAD) meter technology using absolute SPAD values, might be more reliable than relative SPAD values in helping corn producers making timely decisions about N applications. This study aimed to develop a relationship between absolute SPAD values and leaf N concentration, and to determine optimal leaf N concentrations at early corn growth stages (V6, V8, V10, and V12). Three experiments were conducted during two summer seasons (2014 and 2015) using six N treatments applied at early corn growth stages. In parallel, two experiments were carried out in a high residual N environment to establish the optimum corn leaf N concentration. Results showed a significant linear relationship between corn leaf N concentrations and absolute SPAD values (R2 = 0.80, p < 0.05). The mean optimum corn leaf N concentration decreased over corn growth stages. It is of great importance to make the absolute SPAD method accessible for farmers, but more research is required to perform standardized reading of absolute SPAD values data.

1. Introduction

Nitrogen (N) fertilization is essential for many crops’ mineral nutrition. The use of N fertilizers for cereal production is crucial to ensure high yield [1]. For irrigated corn, several researchers determined a quadratic relationship between yield and N applications revealing that inadequate N fertilization fails to improve corn yield [2,3,4]. Furthermore, there is a big environmental concern to rationalize the use of N inputs to overcome problems of leaching, denitrification, surface runoff, and volatilization that might cause up to 67% of N fertilizer losses in cereal production [5].
Farmers tend to apply high N rates to ensure the maximum corn yield [6,7]. Determining the right quantities of N for corn is a big concern for promoting the best farming practices to increase yield and crop profitability without wasting resources. In fact, there is a great challenge for both farmers and environmentalists to protect groundwater from nitrate contamination.
Soil testing and plant tissue analysis have been used for diagnosing corn N utilization status. However, laboratory analyses are time consuming and are non-convenient to make timely decisions. For this reason, researchers have been interested in developing tools that allow an N assessment using non-destructive methods. In fact, the chlorophyll meter has been widely used as a quick decisional tool for managing N inputs.
The chlorophyll meter or soil–plant analysis development (SPAD) meter, is a hand-held device that calculates the red light absorbed by the plant leaf. The output is a unit-less parameter recorded and approached as an absolute or relative SPAD value. During the last two decades, several studies [8,9,10,11,12,13,14,15,16,17,18,19,20,21,22,23,24,25,26,27,28,29,30] were performed to analyze the usefulness of the SPAD meter in assessing corn N status and predicting corn yield.
The review of the main research done on SPAD metering technology (Table 1) showed the importance of two factors being taken into account—the metering method and the crop growth stage—for performing consistent reading of SPAD data. In fact, the SPAD metering method (absolute or relative) and the time of sampling relative to the corn growth stage are of great importance in using this technology.
The absolute SPAD value is an apparent reading collected directly from the SPAD meter, whereas, the assessment of the relative SPAD value is performed by referring to a well-N-fertilized check plot. Considering the difficulty of using relative SPAD values for farmers, the use of absolute SPAD values can be promoted to assess corn leaf N status and systematically avoid referencing data to check plots.
Concerning the effect of corn growth stage, several authors (Table 1) discussed the problem of plateau relative to SPAD-value readings of leaf N concentration at late corn growth stages. This problem can be solved by focusing on detection of N deficiencies at early corn growth stages. It may be also non-convenient to wait until R1 corn growth stage for determining the relationship between SPAD values and leaf N concentration, to decide about N application rate for recovering the yield potential. The use of the absolute SPAD values method at early corn growth stages (Table 1) can be more useful in deciding about side-dress N applications.
The use of absolute SPAD values to assess leaf N status at early corn growth stages might show the existence of a strong linear relationship, but this step is not sufficient to optimize N rates for achieving the maximum corn yield [32,33]. In fact, there is a need to interpret leaf N concentration based upon absolute SPAD measurements in the field with reference to a standard reading that gives an optimal leaf N concentration at early corn growth stages.
The N supplying increases corn yield in deficient situations [34]. The rationalization of N inputs requires optimal fertilizer application rates to address corn demands at different growth stages, specifically during the period of early crop vegetative growth [35]. Since yield is correlated to leaf N concentration [15], we were interested in determining optimal leaf N concentration at early corn growth stages to standardize the use of absolute SPAD values.
It would be possible for farmers to collect and convert SPAD values into leaf N concentrations, then interpret those values according to standardized optimal leaf N concentration level. The objectives of this study were (1) to develop a relationship between leaf N concentration and absolute SPAD values at early corn growth stages and (2) to determine optimal leaf N concentration levels at V6, V8, V10, and V12 corn growth stages as standards for precise use of absolute SPAD values.

2. Material and Methods

Experiments were hosted at the University of Arkansas research stations during 2014 and 2015. The soil pH was slightly acidic ranging between 6.5 and 6.8. The previous crop was soybean and experimental fields were fertilized to meet soil test recommendations for all nutrients except N [36]. All fields were disked followed by tillage using a field cultivator, and raised beds were formed 90-cm apart to allow furrow irrigation. No rain was recorded during the experiments.
Plots consisted of four rows, 91.5 cm apart and 9.15 m in length, which were seeded at a depth of 5 cm using a seeding rate of 84,030 kernels ha−1. Weeds were controlled with atrazine (AAtrex; 1.8 kg ai ha−1), S-metalochlor (Dual Magnum; 1.5 kg ai ha−1), and glyphosate (RoundUp Ultra; 1.12 kg ai ha−1). The experiment was furrow-irrigated as needed to maintain adequate soil moisture using the hand-feel method. In 2014, hybrid seeds were used—Mycogen 2V707 for Fay 3, and Pioneer 1690HR for Fay 4, Fay 5 and Kibler. In 2015, hybrids used were Mycogen 2V707 for Fay 3 and Pioneer 1690HR for Fay 4, and Pine Tree. The seeds were glyphosate (N-(phosphonomethyl) glycine)-tolerant and had the Bacillus thuringiensis (BT) trait. All N treatments were hand applied as urea (460 g N kg−1) coated with the urease inhibitor NBPT (N-(n-butyl) thiophosphoric triamide) and incorporated with irrigation within 2 days.
At physiological maturity, a combine harvester was used to harvest the middle two rows of each plot. Grain was weighed and yield was adjusted to 15.5% moisture.

2.1. Relationship between Leaf N Concentration and Absolute SPAD Values

To determine the relationship between leaf N concentration and SPAD values, the experimental design for each site was a randomized complete block design (RCBD) with four replications and six N treatments per replicate (Table 2). Nitrogen fertilizer rates ranged from 0 to 360 kg N ha−1 applied at different corn growth stages (Table 3).
At all sites, quadratic relationships were determined between yield and N inputs. Besides, the uppermost collared leaf from one plant per row was sampled from the middle two rows of each four-row plot at V6, V8, V10, and V12. Ten, leaves were removed from the plant, placed in plastic bags on ice, and transported to the laboratory [12]. Leaves within stains were discarded. Concerning the time of cutting leaves, samples were taken at different times of the day by referring to [37], as there is no effect of time of day on chlorophyll content.
Eight SPAD measurements were taken per leaf, on either side of the midvein, approximately at the midpoint of the leaf, and an average of absolute SPAD values was recorded. Leaves were dried at 65 °C until weight was constant. Dry matter was ground through a 20-mesh screen, and analyzed for total N using Dumas combustion (LECO FP-428 Determinator, LECO Corporation, St. Joseph, MO, USA) at the Soil Test and Plant Diagnostic Laboratory (Crop Soil and Environmental Department, University of Arkansas).
At each site, we determined the relationship between yield and N input. After that, SPAD values taken at early corn growth stages, were plotted against leaf N concentration to develop a correlation equation between corn leaf N concentration and SPAD values.

2.2. Optimal Corn Leaf N Concentration

We conducted a field experiment to develop optimal corn leaf N concentrations. The soil was a Captina silt loam (fine-silty, siliceous, active, mesic Typic Fragiudults). An amount of 10 Mg ha−1 of chicken litter was broadcast before planting, to establish a high residual N environment. This experiment was performed in one site (36°5′54.8″ N; 94°10′ 15″ W) during 2014. The experiment was a randomized complete block design (RCBD) with four replications. It was conducted in side-by-side fields that had either 0 or 67 kg N ha−1 applied and incorporated before planting. The planting was done on 29 May and emergence occurrence was within 5 days.
Concerning the field not receiving preplant N, treatments consisted of six N rates—0 kg N ha−1, 302 kg N ha−1 (at V6), and 246 kg N ha−1 as standard recommendations (at V6, V8, V10, and V12). For the field receiving 67 kg ha–1 preplant N, the side-dress amounts of N applied were decreased by 67 kg N ha–1 for both rates of 302 kg N ha−1 (at V6) and of 246 kg N ha−1 (at V6, V8, V10, and V12).
Before applying any N treatment, the uppermost collared leaf from one plant per row was sampled from the middle two rows of each four-row plot at V6, V8, V10, and V12. Leaves were transported immediately to the laboratory for N analysis. Leaf N concentration analyses were performed as described in Section 2.1.
Effects of growth stage and treatments on yield were tested using ANOVA. The preplant N levels were considered as separate environments, and the effect of preplant N was tested with the error term of replication nested within the preplant N level. Tukey’s test (HSD) was used to separate means for significant effects. Student’s test was used to develop critical corn leaf N concentration at V6, V8, V10, and V12. Statistical analyses were performed using SAS (v. 9.4, SAS Institute, Cary, NC, USA).

3. Results and Discussion

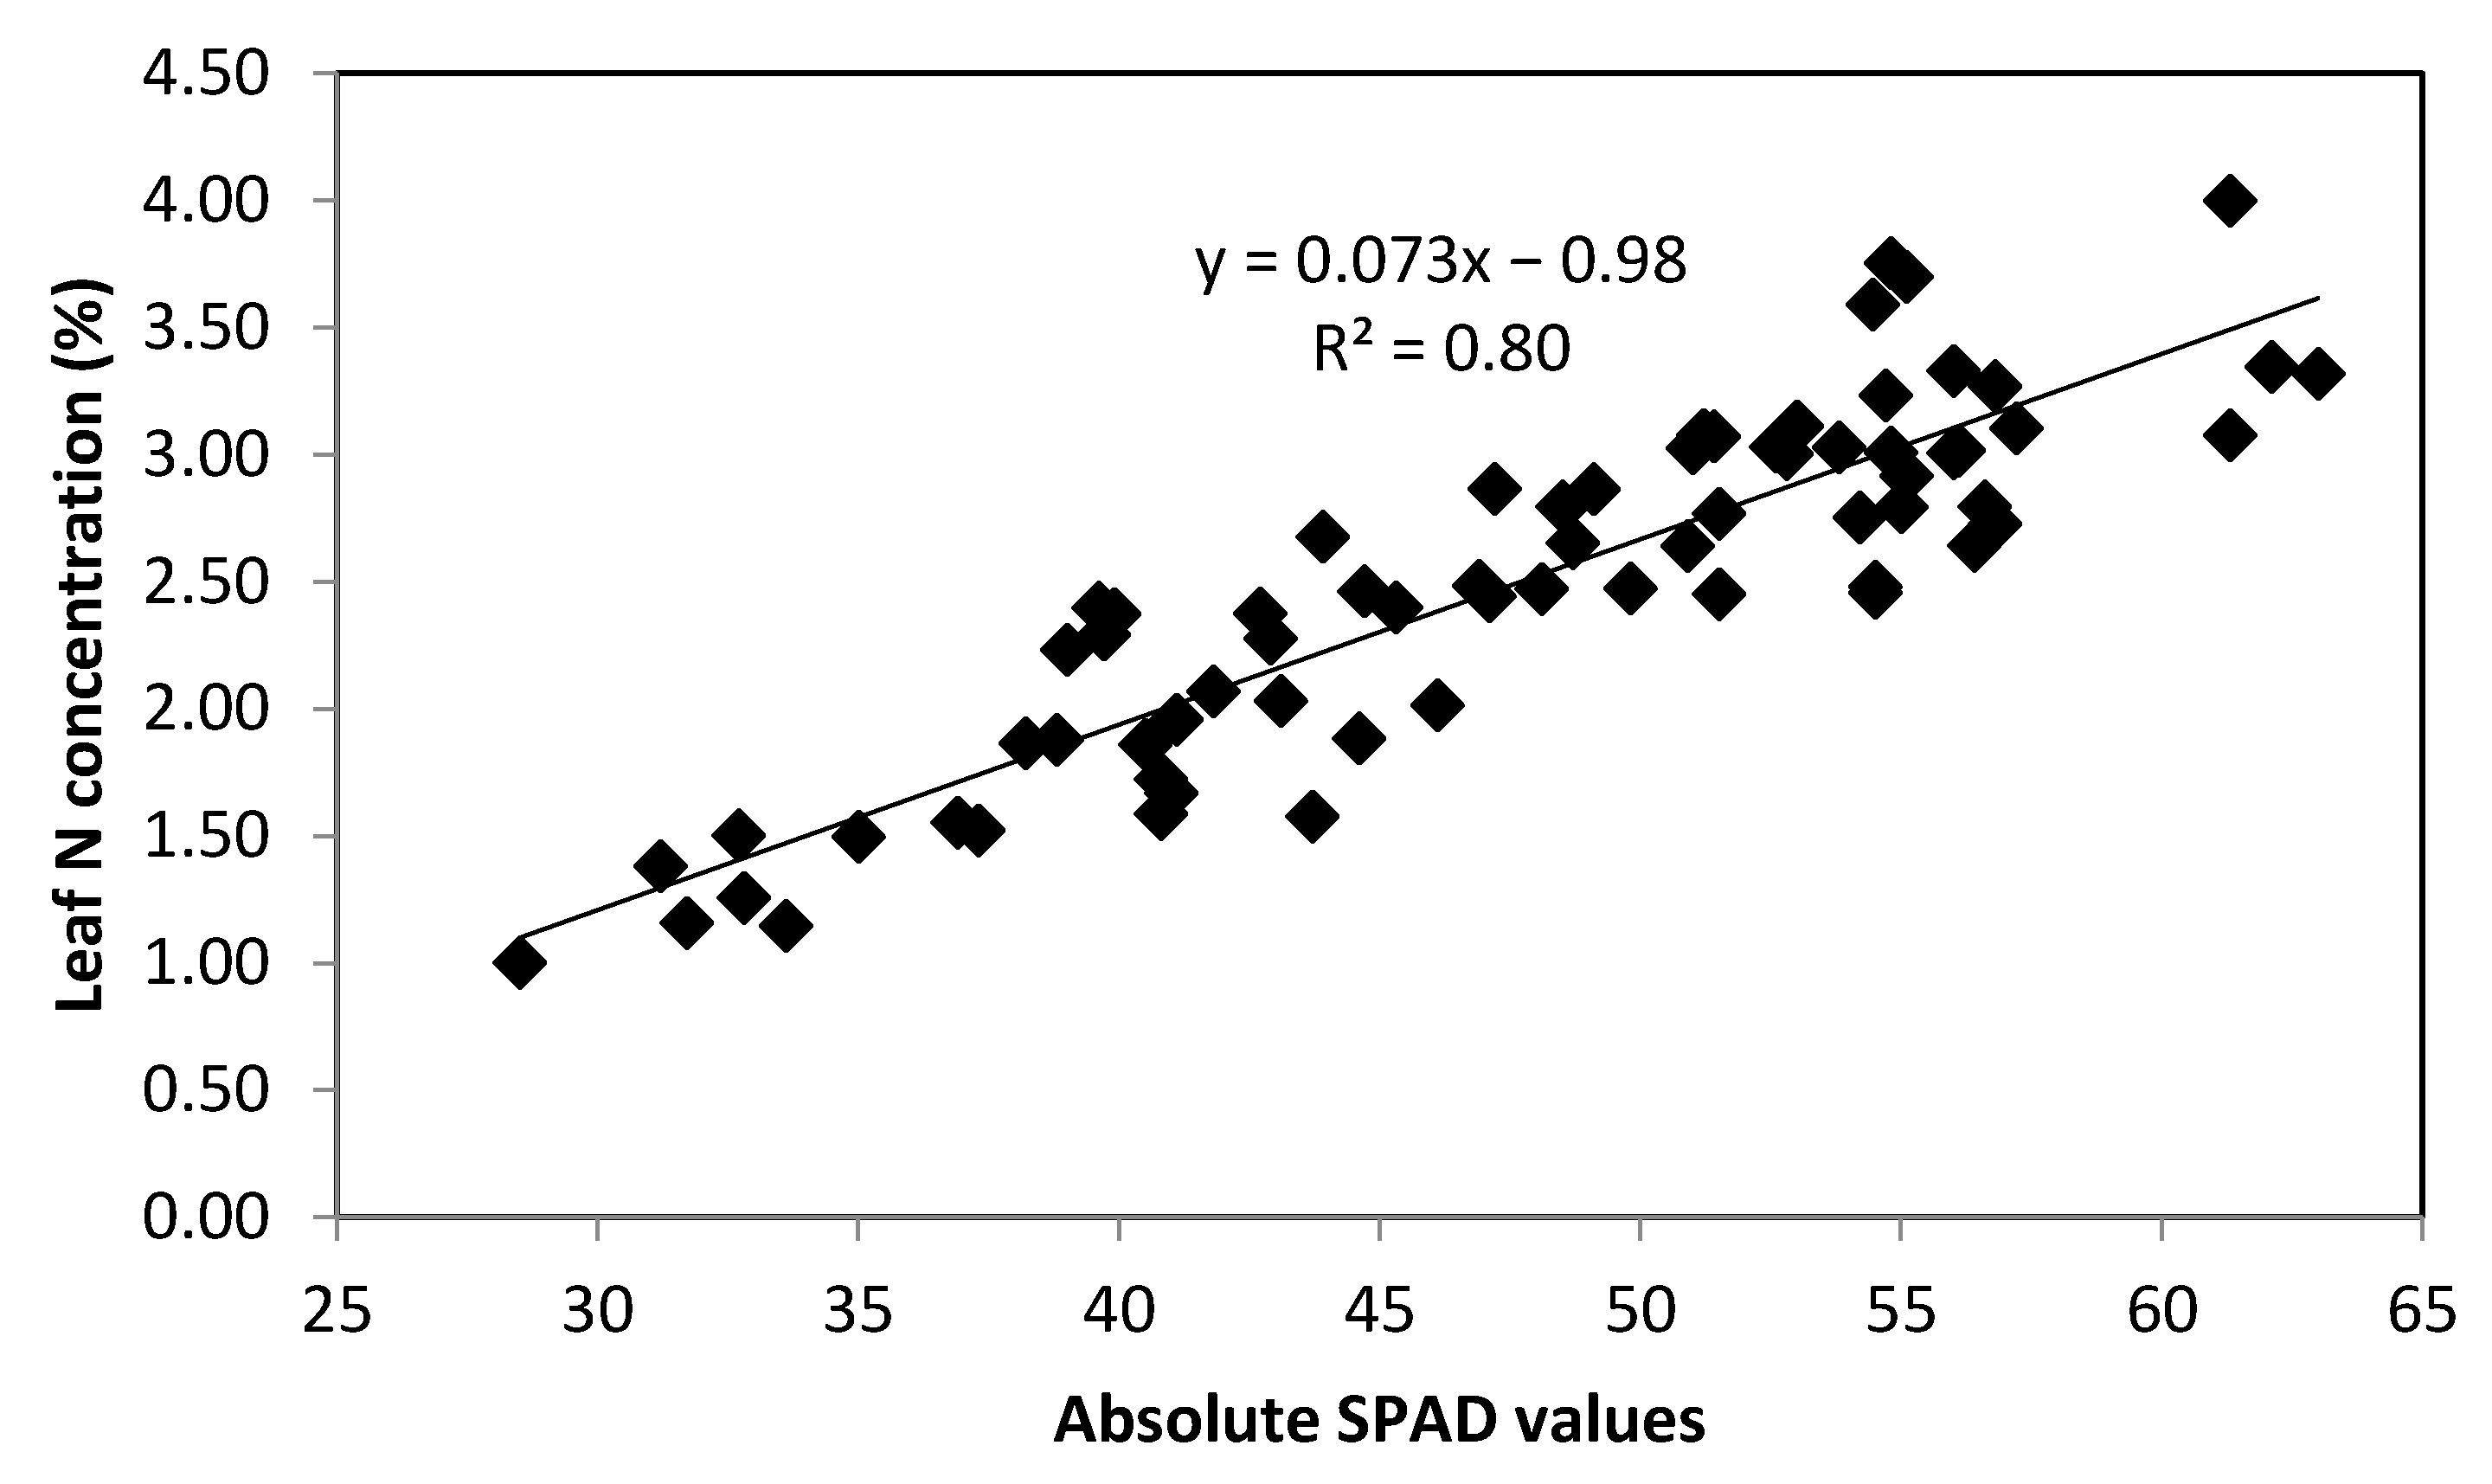
3.1. Relationship between Leaf N Concentration and Absolute SPAD Values

As statistical analysis showed no significant effect of year (p > 0.05), collected data of both years (2014 and 2015) were combined. Data analysis showed the existence of a consistent linear relationship (R2 = 0.80; p < 0.05) between leaf N concentration and absolute SPAD values (Figure 1). This study showed an absence of leaf N concentration plateau. However, other authors stated the presence of a plateau at high level of N inputs [13,14,15,16,19].
The reason for the difference between our results and the other precedent findings is attributed mainly to the timing of measurement at early or at late corn growth stages [25]. In fact, our SPAD values measurements were performed at early corn growth stages contrarily to the other authors [14,15,16,19].
According to the timing of measurement during the day, there is no effect on chlorophyl response [37]. However, [12] reported a variability in SPAD reading according to crop species and N supplementation. We do believe that more research is needed to determine the main factors affecting chlorophyl content change.
According to [15,16], SPAD values and the greenness of the leaf are significantly correlated. In fact, the dark-green color index (DGCI) used for measuring greenness of the corn leaf blade is tightly correlated with SPAD values [10,15,16]. Since the greenness of the leaf remains constant at R1 corn growth stage [38], the SPAD measurement is not accurate for evaluating leaf N concentration change at late corn growth stages because of the reading saturation.
The SPAD values plateau at R1 when leaf corn N concentration reaches a threshold of 2.5 g N 100 g−1 [38]. Reported critical values for leaf N concentration at R1 range from 2.76 to 3.5%. Hence, SPAD and DGCI technologies would not be able to diagnose N requirements above a corn leaf N concentration threshold for corn at R1 [15,38].
Assessing leaf N concentration becomes a difficult task when absolute SPAD values plateau. It might be an indication that we do not need to apply N to recover the corn yield potential since there is a strong relationship between yield and SPAD values [14,15,28]. The assumption that we do not need to apply N to achieve the maximum corn yield when SPAD values plateau should be validated through other experiments.
This study shows the importance of determining the greenness of corn leaf at early corn growth stage, which is in concordance with [39] who determined the accuracy of DGCI in determining N requirements for corn at V6, V8, V10, and V12.
Nitrogen management is effectively site-specific. There was a strong quadratic relationship between N rates and yield with an optimum N rate varying from 76 to 350 kg N ha−1 (Table 4) agreeing with the results of [4]. Also, the data showed that the lower the corn minimum yield, the higher the optimum N rate.
Our results showed the difficulty to conventionally manage N inputs for maximizing yield because of spatial soil variability from site to site. This is the reason we conducted a different experiment to determine optimal leaf N concentration at early corn growth stages. As yield is correlated to leaf N concentration [15,20], there is of great interest to define confidence intervals of optimum corn leaf N concentration at early corn growth stages.

3.2. Optimal Corn Leaf N Concentration

The experiment conducted at Fayetteville in 2014 to develop intervals of optimal leaf N concentration, was specifically rich in residual N due to application of 10 Mg ha−1 of poultry litter before planting. This high residual N environment was simulated to show impacts in deficient N situations as any N input potentially increased corn yield [34].
The residual-N would decline over the crop’s life cycle leading to lower yield [3]. Our experiment showed that yield was not statistically different (p > 0.05) between treatments with preplant N (67 kg N ha−1) and treatments without preplant N (Table 5; Table 6). However, within the group of treatments receiving preplant N, we noticed an increase of yield (p < 0.05) compared to the treatments without preplant N suggesting the benefit of applying a preplant N for corn (Table 6).
Table 7 gives an average and a confidence interval of optimal leaf N concentration at early corn growth stages (V6, V8, V10, and V12) using two preplant N doses (0 and 67 kg ha−1). These data might be used as a reference for corn N management to increase N use efficiency and avoid yield losses. The corn N management can be based on taking SPAD values and converting them to leaf N concentration using the algorithm based on the Figure 1 data. Table 7 can be used as reference to verify whether the predicted leaf N concentration is or not within the predefined confidence intervals.
Leaf N concentration could be predicted at any time within early corn growth stages. In fact, when leaf N concentration is below the recommended optimum (Table 7), the farm manager should immediately add N to avoid potential yield losses. Otherwise, no N is required when predicted leaf N concentration oscillates within the predefined confidence intervals. Further studies could be undertaken to decide about the quantity of N input in case the corn leaf is N deficient.

4. Conclusions

This study aimed to develop a decisional method for predicting leaf N concentration based on absolute SPAD values and optimal leaf N concentration, to rationally apply N at early corn growth stage. We determined a significant linear relationship between corn leaf N concentration and absolute SPAD values (R2 = 0.80, p < 0.05). Furthermore, the confidence interval for optimal leaf N concentration prediction was developed for consistent interpretation. Future research should focus on validating absolute SPAD values method developed in this study over a wide range of environmental conditions.

Author Contributions

Original draft preparation, A.R.; writing—review and editing, A.E.A. All authors have read and agreed to the published version of the manuscript.

Funding

This research was funded by Arkansas Corn Promotion Board.

Institutional Review Board Statement

Not applicable.

Informed Consent Statement

Not applicable.

Acknowledgments

We thank the University of Arkansas team for technical assistance. Also, we thank Laghrour Malika from the national institute of agricultural research for her valuable contribution.

Conflicts of Interest

The authors declare no conflict of interest.

References

  1. Ladha, J.K.; Pathak, H.; Krupnik, T.J.; Six, J.; van Kessel, C. Efficiency of fertilizer nitrogen in cereal production: Retrospects and prospects. Adv. Agron. 2005, 87, 85–156. [Google Scholar]
  2. Hallberg, G.R. Nitrogen Management and Ground Water Protection; Follett, R.F., Ed.; Elsevier Science: Amsterdam, The Netherlands, 1989; p. 74. [Google Scholar]
  3. Halvorson, A.D.; Schweissing, F.C.; Bartolo, M.E.; Reule, C.A. Corn response to nitrogen fertilization in a soil with high residual-Nitrogen. Agron. J. 2005, 97, 1222–1229. [Google Scholar] [CrossRef] [Green Version]
  4. Shapiro, C.A.; Wortmann, C.S. Corn Response to Nitrogen Rate, Row Spacing, and Plant Density in Eastern Nebraska. Agron. J. 2006, 98, 529–535. [Google Scholar] [CrossRef] [Green Version]
  5. Raun, W.R.; Johnson, G.V. Improving Nitrogen Use Efficiency for Cereal Production. Agron. J. 1999, 91, 357–363. [Google Scholar] [CrossRef] [Green Version]
  6. Hartz, T.K. Vegetable production best management practices to minimize nutrient loss. Horttechnology 2006, 16, 398–403. [Google Scholar] [CrossRef] [Green Version]
  7. Schenk, M.K. Nutrient efficiency of vegetable crops. Acta Hortic. 2006, 700, 21–33. [Google Scholar] [CrossRef]
  8. Bishnu, P.K. SPAD value varies with age and leaf of maize plant and its relationship with grain yield. BMC Res. Notes 2020, 13, 475. [Google Scholar]
  9. Edalat, M.; Naderi, R.; Egan, T.P. Corn nitrogen management using NDVI and SPAD sensor-based data under conventional vs. reduced tillage systems. J. Plant Nutr. 2019, 42, 2310–2322. [Google Scholar] [CrossRef]
  10. Friedman, J.M.; Raymond, E.H.; Mutters, R.G. Assessment of Leaf Color Chart Observations for Estimating Maize Chlorophyll Content by Analysis of Digital Photographs. Agron. J. 2016, 108, 822–829. [Google Scholar] [CrossRef] [Green Version]
  11. Silva, G. Corn Leaf Greenness Affected by Nitrogen Rate, Row Spacing and Population Density; Michigan State University Extension: East Lansing, Michigan, USA, 2015. [Google Scholar]
  12. Xiong, D.; Chen, J.; Yu, T.; Gao, W.; Ling, X.; Li, Y.; Peng, S.; Huang, J. SPAD-Based Leaf Nitrogen Estimation is Impacted by Environmental Factors and Crop Leaf Characteristics. Sci. Rep. 2015, 5, 13389. [Google Scholar] [CrossRef] [Green Version]
  13. Parry, C.; Blonquist, J.; Bugbee, B. In situ measurement of leaf chlorophyll concentration: Analysis of the optical/absolute relationship. Plant Cell Environ. 2014, 37, 2508–2520. [Google Scholar] [CrossRef] [PubMed]
  14. Shapiro, C.A.; Francis, D.; Ferguson, S.; Wortmann, C.S. Using a Chlorophyll Meter to Improve N Management; NebGuide; Soil Resource Management; University of Nebraska: Lincoln, NE, USA, 2013. [Google Scholar]
  15. Rorie, R.L.; Purcell, L.C.; Karcher, D.E.; King, C.A. The Assessment of Leaf Nitrogen in Corn from Digital Images. Crop. Sci. 2011, 51, 2174–2180. [Google Scholar] [CrossRef] [Green Version]
  16. Rorie, R.L.; Purcell, L.C.; Karcher, D.E.; King, C.H. Association of “greenness” in corn with yield and leaf nitrogen concentration. Agron. J. 2011, 103, 529–535. [Google Scholar] [CrossRef] [Green Version]
  17. Schmidt, J.; Beegle, D.; Zhu, Q.; Sripada, R. Improving in-season nitrogen recommendations for maize using an active sensor. Field Crop. Res. 2011, 120, 94–101. [Google Scholar] [CrossRef] [Green Version]
  18. Shaver, T.M.; Khosla, R.; Westfall, D.G. Evaluation of two crop canopy sensors for nitrogen variability determination in irrigated maize. Precis. Agric. 2011, 12, 892–904. [Google Scholar] [CrossRef]
  19. Yu, H.; Wu, S.; Wang, J. Evaluation of SPAD and Dualex for In-Season Corn Nitrogen Status Estimation. Acta Agron. Sin. 2010, 5, 840–847. [Google Scholar]
  20. Chen, P.; Haboudane, D.; Wang, L.; Vigneault, P. New spectral indicator assessing the efficiency of crop nitrogen treatment in corn and wheat. Remote Sens. Environ. 2010, 114, 1987–1997. [Google Scholar] [CrossRef]
  21. Bullock, D.G.; Anderson, D.S. Evaluation of the Minolta SPAD-502 chlorophyll meter for nitrogen management in corn. J. Plant Nutr. 2008, 21, 741–755. [Google Scholar] [CrossRef]
  22. Schepers, J.S.; Francis, D.D.; Vigil, M.; Below, F.E. Comparison of corn leaf nitrogen concentration and chlorophyll meter readings. Commun. Soil Sci. Plant Anal. 2008, 23, 17–20. [Google Scholar] [CrossRef]
  23. Miao, Y.; Mulla, D.J.; Randall, G.W.; Vetsch, J.A.; Vintila, R. Combining chlorophyll meter readings and high spatial resolution remote sensing images for in-season site-specific nitrogen management of corn. Precis. Agric. 2009, 10, 1573–1618. [Google Scholar] [CrossRef]
  24. Costa, C.; Dwyer, L.M.; Dutilleul, P.; Stewart, D.W.; Ma, B.L.; Smith, D.L. Inter-Relationships of applied Nitrogen, SPAD, And Yield of Leafy and non-leafy maize genotypes. J. Plant Nutr. 2006, 24, 1173–1194. [Google Scholar] [CrossRef]
  25. Martinez, D.; Guiamet, J. Distortion of the SPAD 502 chlorophyll meter readings by changes in irradiance and leaf water status. Agronomie 2004, 24, 41–46. [Google Scholar] [CrossRef] [Green Version]
  26. Murdock, L.; Jones, S.; Bowley, C. Using a Chlorophyll Meter to Make Nitrogen Recommendations on Wheat. Cooperative Extension Service; University of Kentucky-College of Agriculture: Lexington, KY, USA, 1997. [Google Scholar]
  27. Piekielek, W. The Early-Season Chlorophyll Meter Test for Corn; Agronomy Facts 53; Penstate University: State College, PA, USA, 1995. [Google Scholar]
  28. Blackmer, T.M.; Schepers, J.S.; Varvel, G.E. Light Reflectance Compared with Other Nitrogen Stress Measurements in Corn Leaves. Agron. J. 1994, 86, 934–938. [Google Scholar] [CrossRef]
  29. Piekielek, W.; Fox, R.H. Use of a Chlorophyll Meter to Predict Sidedress Nitrogen Requirements for Maize. Agron. J. 1992, 84, 59–65. [Google Scholar] [CrossRef]
  30. Dwyer, L.M.; Tollenaar, M.; Houwing, L. A nondestructive method to monitor leaf greenness in corn. Can. J. Plant Sci. 1991, 71, 505–509. [Google Scholar] [CrossRef]
  31. Abdendroth, L.J.; Elmore, R.W.; Marlay, S.R. Corn Growth and Development. PMR 1009; Iowa State University Extension: Ames, IA, USA, 2011. [Google Scholar]
  32. Zhang, J.; Blackmer, A.M. Monitoring nitrogen deficiencies in corn. Integrated Crop Manage. 1999. Available online: http://www.ipm.iastate.edu/ipm/icm/1999/5-5-1999/moncorn.html (accessed on 31 January 2008).
  33. Fox, R.H.; Piekielek, E.P.; Macneal, K.E. Comparison of late season diagnostic tests for predicting nitrogen status of corn. Agron. J. 2001, 93, 590–597. [Google Scholar] [CrossRef]
  34. Goodall, D.W.; Gregory, F.G. Chemical Composition of Plants as an Index of Their Nutritional Status; Imperial Bur. Hort. Plantation Crops. Tech. Commun. 17; IAB Central Branch: Wales, UK, 1947. [Google Scholar]
  35. Ju, X.T.; Xing, G.X.; Chen, X.P.; Zhang, S.L.; Zhang, L.J.; Liu, X.J. Reducing environmental risk by improving N management in intensive Chinese agricultural systems. Proc. Natl. Acad. Sci. USA 2009, 106, 3041–3046. [Google Scholar] [CrossRef] [PubMed] [Green Version]
  36. Slaton, N.A.; Mozaffari, M.; Espinoza, L.; Roberts, T.L.; Norman, R.J.; Kelley, J.R. Nitrogen rate recommendations for corn grown on clay and loamy soils. In Arkansas Soil Fertility Studies; Slaton, N.A., Ed.; Univiversity of Arkansas: Fayetteville, NC, USA, 2014; pp. 60–67. [Google Scholar]
  37. Padilla, F.M.; de Souza, R.; Peña-Fleitas, M.T.; Grasso, R.; Gallardo, M.; Thompson, R.B. Influence of time of day on measurement with chlorophyll meters and canopy reflectance sensors of different crop N status. Precis. Agric 2019, 20, 1087–1106. [Google Scholar] [CrossRef] [Green Version]
  38. Rhezali, A.; Rabii, M. Evaluation of a Digital Camera and a Smartphone Application, Using the Dark Green Color Index, in Assessing Maize Nitrogen Status. Commun. Soil Sci. Plant Anal. 2020, 51, 1–14. [Google Scholar] [CrossRef]
  39. Rhezali, A.; Purcell, L.C.; Roberts, T.L.; Greub, C.E. Predicting Nitrogen Requirements for Maize with the Dark Green Color Index under Experimental Conditions. Agron. J. 2018, 110, 1173–1179. [Google Scholar] [CrossRef]
Figure 1. Leaf N concentration (%) vs. absolute SPAD values at V6, V8, V10, and V12 corn growth stages (2014 and 2015).
Nitrogen 02 00020 g001
Table 1. Use of the soil–plant analysis development (SPAD) meter for corn N management (recapitulative from several authors).
AuthorsNature of SPAD ValuesTime of Sampling *Outputs
[8]AbsoluteR1 and R2
  • Positive correlation between SPAD values and grain yield.
  • SPAD values increase over corn growth stages.
[9]Not specifiedNot specified
  • SPAD was able to detect N deficiency at early corn growth stages.
  • SPAD measurements reflected plant N status regarding N application rates.
[10]AbsoluteR2 and R3
  • A strong relationship (R2 = 0.91) between SPAD values and the greenness of the leaf measured through leaf color chart.
[11]AbsoluteV7–V8
  • SPAD values increased with an increase of N doses.
  • An N-sufficiency index above 95% indicates an adequate leaf N concentration.
[12]AbsoluteNot specified
  • There is a linear relationship between SPAD values and leaf N concentration.
  • There is a close relationship between SPAD value and chlorophyll content per leaf area.
[13]AbsoluteMultiple growth stages of wheat
  • There is a quadratic relationship between SPAD values and chlorophyll concentration in wheat leaves.
  • Light intensity can affect absolute chlorophyll in the leaf.
[14]RelativeAfter V6
  • There is a strong linear relationship between relative yield and relative SPAD values.
  • There is a quadratic relationship between relative chlorophyll reading and N applied.
[15]RelativeTasseling
  • There is a strong relationship between relative corn yield and relative SPAD values (R2 = 0.76).
  • There is a strong relationship between relative corn greenness and relative SPAD values (R2 = 0.84).
[16]RelativeV3–V4
  • There is a strong relationship between relative greenness of the corn leaf and relative SPAD values (R2 = 0.91).
[17]RelativeV6–V7
  • SPAD values were not a good indicator to predict economic optimum N rate.
[18]RelativeV12–V14
  • Results of Normalized Difference Vegetation Index (NDVI) in predicting corn leaf N concentration were as good as SPAD values.
[19]Relative11–46 d after silking
  • SPAD values increased with more N applied and those values plateaued above an N quantity threshold.
[20]AbsoluteV6–V10
  • Significant correlations were determined between plant N concentration and SPAD for corn (no equation, no R2).
  • Plant N concentration decreases with an increase in plant biomass.
[21]AbsoluteV7, R1,and R4
  • The correlations of SPAD readings to N fertilizer rate were low but significant (R = 0.22 at V7 and R1, R = 0.11 at R4).
  • Chlorophyll readings can be useful in detecting N deficiencies in growing crops.
[22]AbsoluteV8, R1–R3
  • Leaf N concentrations declined at low fertilizer N rates, and remained constant at high N rates.
  • The relationship between SPAD values and N inputs is not consistent at silking.
  • The chlorophyll meter readings at anthesis were better correlated with yields than were leaf N concentrations.
[23]AbsoluteV9, V11,R1, R3
  • Multi-spectral broad- and hyper-spectral narrow-band could explain 71–86% and 73–88% of the variability in CM readings, respectively.
  • Using SPAD values and aerial hyperspectral remote sensing together can be a powerful tool to detect N deficiency.
  • The growth stage V9 is the key for optimal corn side-dress N applications.
[24]AbsoluteSilking
  • SPAD meter readings increased as N fertilization level increased.
  • The correlation coefficients between SPAD readings and grain yield were low.
[25]AbsoluteNot specified
  • Time of measurement, irradiance, and plant water status affect SPAD values.
[26]RelativeNot specified
  • Developed an algorithm that predicts the amount of N to apply for wheat based upon SPAD values.
[27]RelativeV6-V8
  • Chlorophyll meter readings of corn leaves are affected by the part and the position of the leaf.
  • Developed an algorithm that predicts the amount of N to apply based upon SPAD values.
  • Chlorophyll meter readings should not be done if the corn is not at the six-leaf stage or older.
[28]AbsoluteR1
  • There is a strong linear relationship between relative yield and SPAD values (R2 = 0.75).
  • There is a strong linear relationship between relative yield and leaf N concentration (R2 = 0.81).
[29]AbsoluteV6
  • SPAD value of the fifth leaf at V6 was an accurate predictor of the response of maize to side-dress N fertilizer.
  • A SPAD value of 43.4-m units was found to be the critical level to separate responsive and nonresponsive sites.
  • The chlorophyll meter test was not well correlated (R2 = 0.25) with soil N-supplying capability to determine side-dress N fertilizer rates for N-responsive sites.
[30]AbsoluteV10
  • The chlorophyll calibration for corn leaves was not significantly affected by hybrid or growth stage.
  • A strong relationship (R2 = 0.83) was determined between SPAD values and chlorophyll concentration in the corn leaves.
* Growth stages as described by [31].
Table 2. Information on field experiments (2014 and 2015).
YearLocationSoil SeriesPlanting DatesReplicationsN Rates (kg N ha−1)
2014Fay 3 *Captina silt loam §27 April40,72,144,216,288,360
2014Fay4 *Pickwick silt loam µ27 April40,72,144,216,288,360
2014Kibler #Roxanna sandy loam ×25 May40,72,144,216,288,360
2015Fay 3 *Captina silt loam §25 April40,72,144,216,288,360
2015Fay 4 *Captina silt loam §26 April40,72,144,216,288,360
2015PineTree £Calloway silt loam ^24 April40,72,144,216,288,360
* (36°5′54.8″ N; 94°10′15″ W); § fine-silty, siliceous, active, mesic Typic Fragiudults. # (35°25′31″ N; 94°14′11″ W); µ fine-silty, mixed, semiactive, thermic Typic Paleudults; £ (35°3′30.8″ N; 90°48′44.3″ W); ^ fine-silty, mixed, active, thermic Aquic Fraglossudalfs; × coarse-silty, mixed, superactive, nonacid, thermic Typic Udifluvents.
Table 3. Treatment layout of N application timing and rate of six experiments (2014 and 2015).
Treatments (kg N ha−1)
Application Times of NT1T2T3T4T5T6
Preplant03636363636
V60365490126162
V8005490126162
Table 4. Relationship between corn yield and N inputs.
YearSiteEquation *Optimum N Rate (kg ha−1)R2Yield Max (Mg ha−1)Yield Min (Mg ha−1)
2014Fay2y = −0.0001x2 + 0.01x + 10760.8411.89.8
2014Fay3y = −0.0001x2 + 0.02x + 4.71050.5310.54.5
2014Kiblery = −0.0001x2 + 0.06x + 3.83000.9912.33.62
2015Fay2y = −0.0001x2 + 0.05x + 5.42500.9812.95.2
2015Fay3y = −0.0001x2 + 0.06x + 5.43000.9913.45.1
2015PineTreey = −0.0001x2 + 0.07x + 2.93500.8412.62.7
* Relationship between yield and N inputs.
Table 5. Analysis of variance of yield as affected by the fixed effects of treatments and preplant N.
VariableSourceDfp-Values
YieldPreplant N1<0.0001
Treatments50.0075
Treatments × preplant N50.06
R2 0.74
Table 6. Average corn yield for different treatments under two preplant N doses of 0 and 67 kg ha−1 (ANOVA, Tukey’s HSD test). Different letters means the existence of a significant difference between treatments.
Corn Yield (Mg ha−1)
Treatments0 kg N ha−1 (Preplant)67 kg N ha−1 (Preplant)
0 kg N ha−111.0 b12.0 a
302 kg ha−110.9 b12.5 a
V6 Std Rec10.6 b12.0 a
V8 Std Rec10.7 b12.8 a
V10 Std Rec10.4 b12.5 a
V12 Std Rec10.3 b12.2 a
Table 7. Mean and confidence intervals (C.I.) of leaf N concentration at early corn growth stages (V6, V8, V10, and V12) using two preplant N doses (0 and 67 kg ha−1).
Leaf N Concentration (%)
Growth Stages0 kg N ha−1 (Preplant)67 kg N ha−1 (Preplant)
MeanC.I.MeanC.I.
V63.723.58–3.854.093.66–4.51
V83.292.90–3.673.282.90–3.65
V102.952.56–3.332.892.65–3.12
V122.632.21–3.042.972.59–3.34
Publisher’s Note: MDPI stays neutral with regard to jurisdictional claims in published maps and institutional affiliations.

