Article

Attempting to Determine the Relationship of Mandibular Third Molars to the Mandibular Canal on Digital Panoramic Radiography; Using CBCT as Gold Standard

1
Department of Oral and Maxillofacial Radiology, Gazi University Faculty of Dentistry, Ankara 06490, Turkey
2
Department of Oral and Maxillofacial Radiology, Yozgat Bozok University Faculty of Dentistry, Yozgat 66200, Turkey
*
Author to whom correspondence should be addressed.
Fractal Fract. 2025, 9(9), 612; https://doi.org/10.3390/fractalfract9090612
Submission received: 28 August 2025 / Revised: 11 September 2025 / Accepted: 18 September 2025 / Published: 22 September 2025

Abstract

(1) Background: It is important to know, radiologically, the relationship of Mandibular third molars (M3) to the mandibular canal to minimize postoperative complications by causing damage to the inferior alveolar vessels and nerve during extraction. This study aimed to evaluate the usability of various image analyses or high-risk radiographic findings in determining the relationship of M3s to the mandibular canal on Digital Panoramic Radiography (DPR). (2) Methods: DPRs of 60 patients with bilateral mandibular M3s in the dental arch, determined one of them to be related to the mandibular canal unilaterally by Cone Beam Computed Tomography (CBCT), were included. The high-risk radiological signs of M3s and Fractal Analysis (FA) and Histogram Analysis (HA) measurements of the trabecular bone around the M3s’ roots were compared. The Independent t-test, Kolmogorov–Smirnov, Mann–Whitney U, and Chi-Square tests were used for statistical analyses. (3) Results: DPR signs, such as radiolucency and bifurcation at the root apex, discontinuity of the mandibular canal cortex, and superimposition of the tooth root and mandibular canal, were observed statistically significantly more frequently for mandibular canal-related M3s (p < 0.05). As an objective image analysis, Lacunarity showed a statistically significant difference between related and unrelated M3s for measurements made inside and outside the mandibular canal (p < 0.05). (4) Conclusions: This study demonstrated that the discontinuity of the mandibular canal cortex and Lacunarity measured on DPR could help determine the relationship of the mandibular M3s to the mandibular canal.

1. Introduction

Surgical extraction of Mandibular third molars (M3) is a frequently performed operation in dentistry practice. The possibility of mandibular M3 being related to the mandibular canal may cause injury to the inferior alveolar vessel and nerve due to this surgery, resulting in excessive bleeding and numbness [1]. Therefore, an accurate radiographic diagnosis is vital to obtain precise information about the position of the tooth, the number and morphology of the roots, and its relationship with the surrounding anatomical tissues (especially the mandibular canal) [2,3,4].
Digital Panoramic Radiography (DPR), which has widespread use in the diagnosis phase in dentistry, is frequently preferred to determine the relationships and positions of the mandibular M3s to the mandibular canal due to its advantages, such as low cost, easy access, and relatively low radiation exposure [2,5]. Various radiographic signs identified on DPR are reported to pose a high risk for a close relationship between the mandibular canal and M3s [6]. However, DPR provides only two-dimensional and distorted images, which do not allow the examination of anatomical structures from every dimension. In high-risk cases, the position of the mandibular M3 and its relation to the mandibular canal can only be determined by Cone Beam Computed Tomography (CBCT) [2]. Although CBCT provides a more precise three-dimensional imaging than DPR, its difficulty in accessibility and use of a higher radiation dose are the disadvantages.
In addition to its direct harmful effects, radiation becomes a significant problem due to the Electromagnetic Field (EMF) it creates. Indoor EMF exposure levels depend on material composition, spatial arrangements, and the intensity of electromagnetic sources [7]. Prioritizing the use of DPR in certain cases will restrict the use of CBCT and contribute to reducing the intensity of electromagnetic radiation to which people will be exposed. In a study where the Specific Absorption Rate (SAR) and the frequency of temperature change (∆T) caused by the electromagnetic field in the human body were captured by an electronic monitoring device, objects exhibited higher temperature and SAR values when they remained stationary [8]. Since radiological imaging occurs in closed environments and the patient’s position is stationary, the need to minimize electromagnetic radiation becomes clearer.
Fractal Analysis (FA) is a mathematical method used in medicine and dentistry to investigate changes caused by different systemic or local factors, especially in trabecular bone [9]. Changes in trabecular bone microarchitecture caused by localized dental factors such as pathologies (periodontitis, pulpitis), treatments (endodontics, orthodontics, implant surgery), or impacted teeth were investigated with FA [9,10,11]. The fractal is a term used for fine or detailed shapes at small scales exhibiting self-similarity and repeatability, whose irregularity cannot be described by classical Euclidean geometry. Lacunarity and Fractal Dimension (FD) are the quantitative results of the FA. Because fractals with the same dimensions can have very different appearances, FD alone may be ineffective in distinguishing textures with different structures. Therefore, Lacunarity, where the dimensions of the gaps between textures are measured, is used to describe the properties of fractals with the same dimensions and different textural appearances by taking advantage of gaps between textures [12]. Lacunarity is a parameter used to quantify the irregularity and porosity of trabecular bone as a scale-dependent measure of tissue heterogeneity [13]. Briefly, FD measures how the bone fills a metric space, while Lacunarity measures the distribution of gaps in the bone [14]. Lower FD values indicate more complex textures, but fractal clusters with the same FDs may belong to various textures. Higher Lacunarity indicates that the bone is more irregular, more fragmented, and heterogeneous, while lower lacunarity indicates a more homogeneous and compact bone structure [10,15,16,17,18]. FA can be performed commonly using plain imaging modalities such as intraoral radiographs and DPR or, rarely, using advanced imaging modalities such as CBCT, micro CT, multislice CT, High-Resolution (HR) peripheral quantitative CT, and HR Magnetic Resonance Imaging (HR-MRI) [19,20].
Histogram Analysis (HA), which is based on converting gray values of pixels into numerical values, is used to investigate the relationship between the change in gray value in radiographic images and the structural change in the bone [21]. Mean Gray Value (MGV), which can be measured by HA, is the quantitative value of the pixels’ brightness level and color information of a region that is determined on an image.
This study aimed to evaluate the ability of FA/HA or high-risk radiographic signs to be used as diagnostic tools in determining the relationship of mandibular M3s to the mandibular canal on DPR by comparing the gold standard CBCT.

2. Materials and Methods

In this study, archived images of 60 patients who applied to the Gazi University Faculty of Dentistry, Department of Oral and Maxillofacial Radiology, were evaluated retrospectively. In this context, archived images of patients referred for CBCT imaging to assess the relationship of mandibular M3 teeth to the mandibular canal before surgical operation were scanned. No additional radiological requests were made for the study. As a routine procedure in the Oral and Maxillofacial Radiology Department, all patients are dressed in lead aprons. Informed consent was obtained from all subjects involved in the study. The sample size was calculated as at least 58 patients when the effect size was calculated as 0.47 at a 90% confidence interval. The primary inclusion criterion was that patients had a DPR available in the system six months before/after this CBCT imaging. Other inclusion criteria were that the patient was 18 years or older when the images were obtained, that bilateral mandibular M3s were in the dental arch, and that one M3 was determined to be related to the mandibular canal and the other was determined to be unrelated by CBCT. The contralateral sides of the patients, identified as unrelated by CBCT, were used as controls. All exclusion and inclusion criteria were based on radiological images and medical records.
Exclusion criteria are as follows:
  • Patients with any pathology related to the mandibular M3 teeth or the mandibular canal
  • Patients who have received any treatment to the mandibular M3 teeth and/or adjacent bone
  • Patients who have not completed the root development of the mandibular M3 teeth
  • Images with artifacts obscuring the mandibular M3 teeth and/or the mandibular canal
  • DPR and/or CBCT images with insufficient diagnostic quality
  • Patients who have/have received orthodontic treatment
  • Patients with congenital and/or developmental malformations affecting the maxillofacial region
  • Patients with fractures, trauma, and/or pathologies affecting the anatomy or integrity of the mandible
  • Patients who have a systemic disorder that may affect bone metabolism (hyperparathyroidism, hypoparathyroidism, Paget’s disease, rheumatoid arthritis, etc.) and/or who are using a medication that may cause this
All DPR images consist of archive records obtained by the same Sirona ORTHOPHOS XG device (Sirona, Bensheim, Germany), 60 to 80 kVp, 8 to 10 mA, 12.5 to 13 s acquisition parameters, and positioning and irradiation settings in accordance with the manufacturer’s instructions. Due to the study’s retrospective nature, all images were obtained using the same device and imaging protocols to ensure standardization of evaluation and analysis. DPRs were transferred to a personal computer in Tag Image File Format (TIFF) for radiological examination and analysis to obtain higher resolution.
The status of the mandibular M3s on DPR images was examined for eight high-risk radiological signs defined by Rood and Shehab [22] and Patel et al. [2], which represent the appearance of the tooth root or mandibular canal or the relationship of these two structures to each other (Figure 1):
a)
Radiolucency at the root
b)
Narrowing of the root
c)
Radiolucency and bifurcation at the root apex
d)
Discontinuity of the mandibular canal cortex
e)
Narrowing of the mandibular canal
f)
Deviation of the root
g)
Deviation of the mandibular canal
h)
Superimposition of the root and the mandibular canal (overlapping)
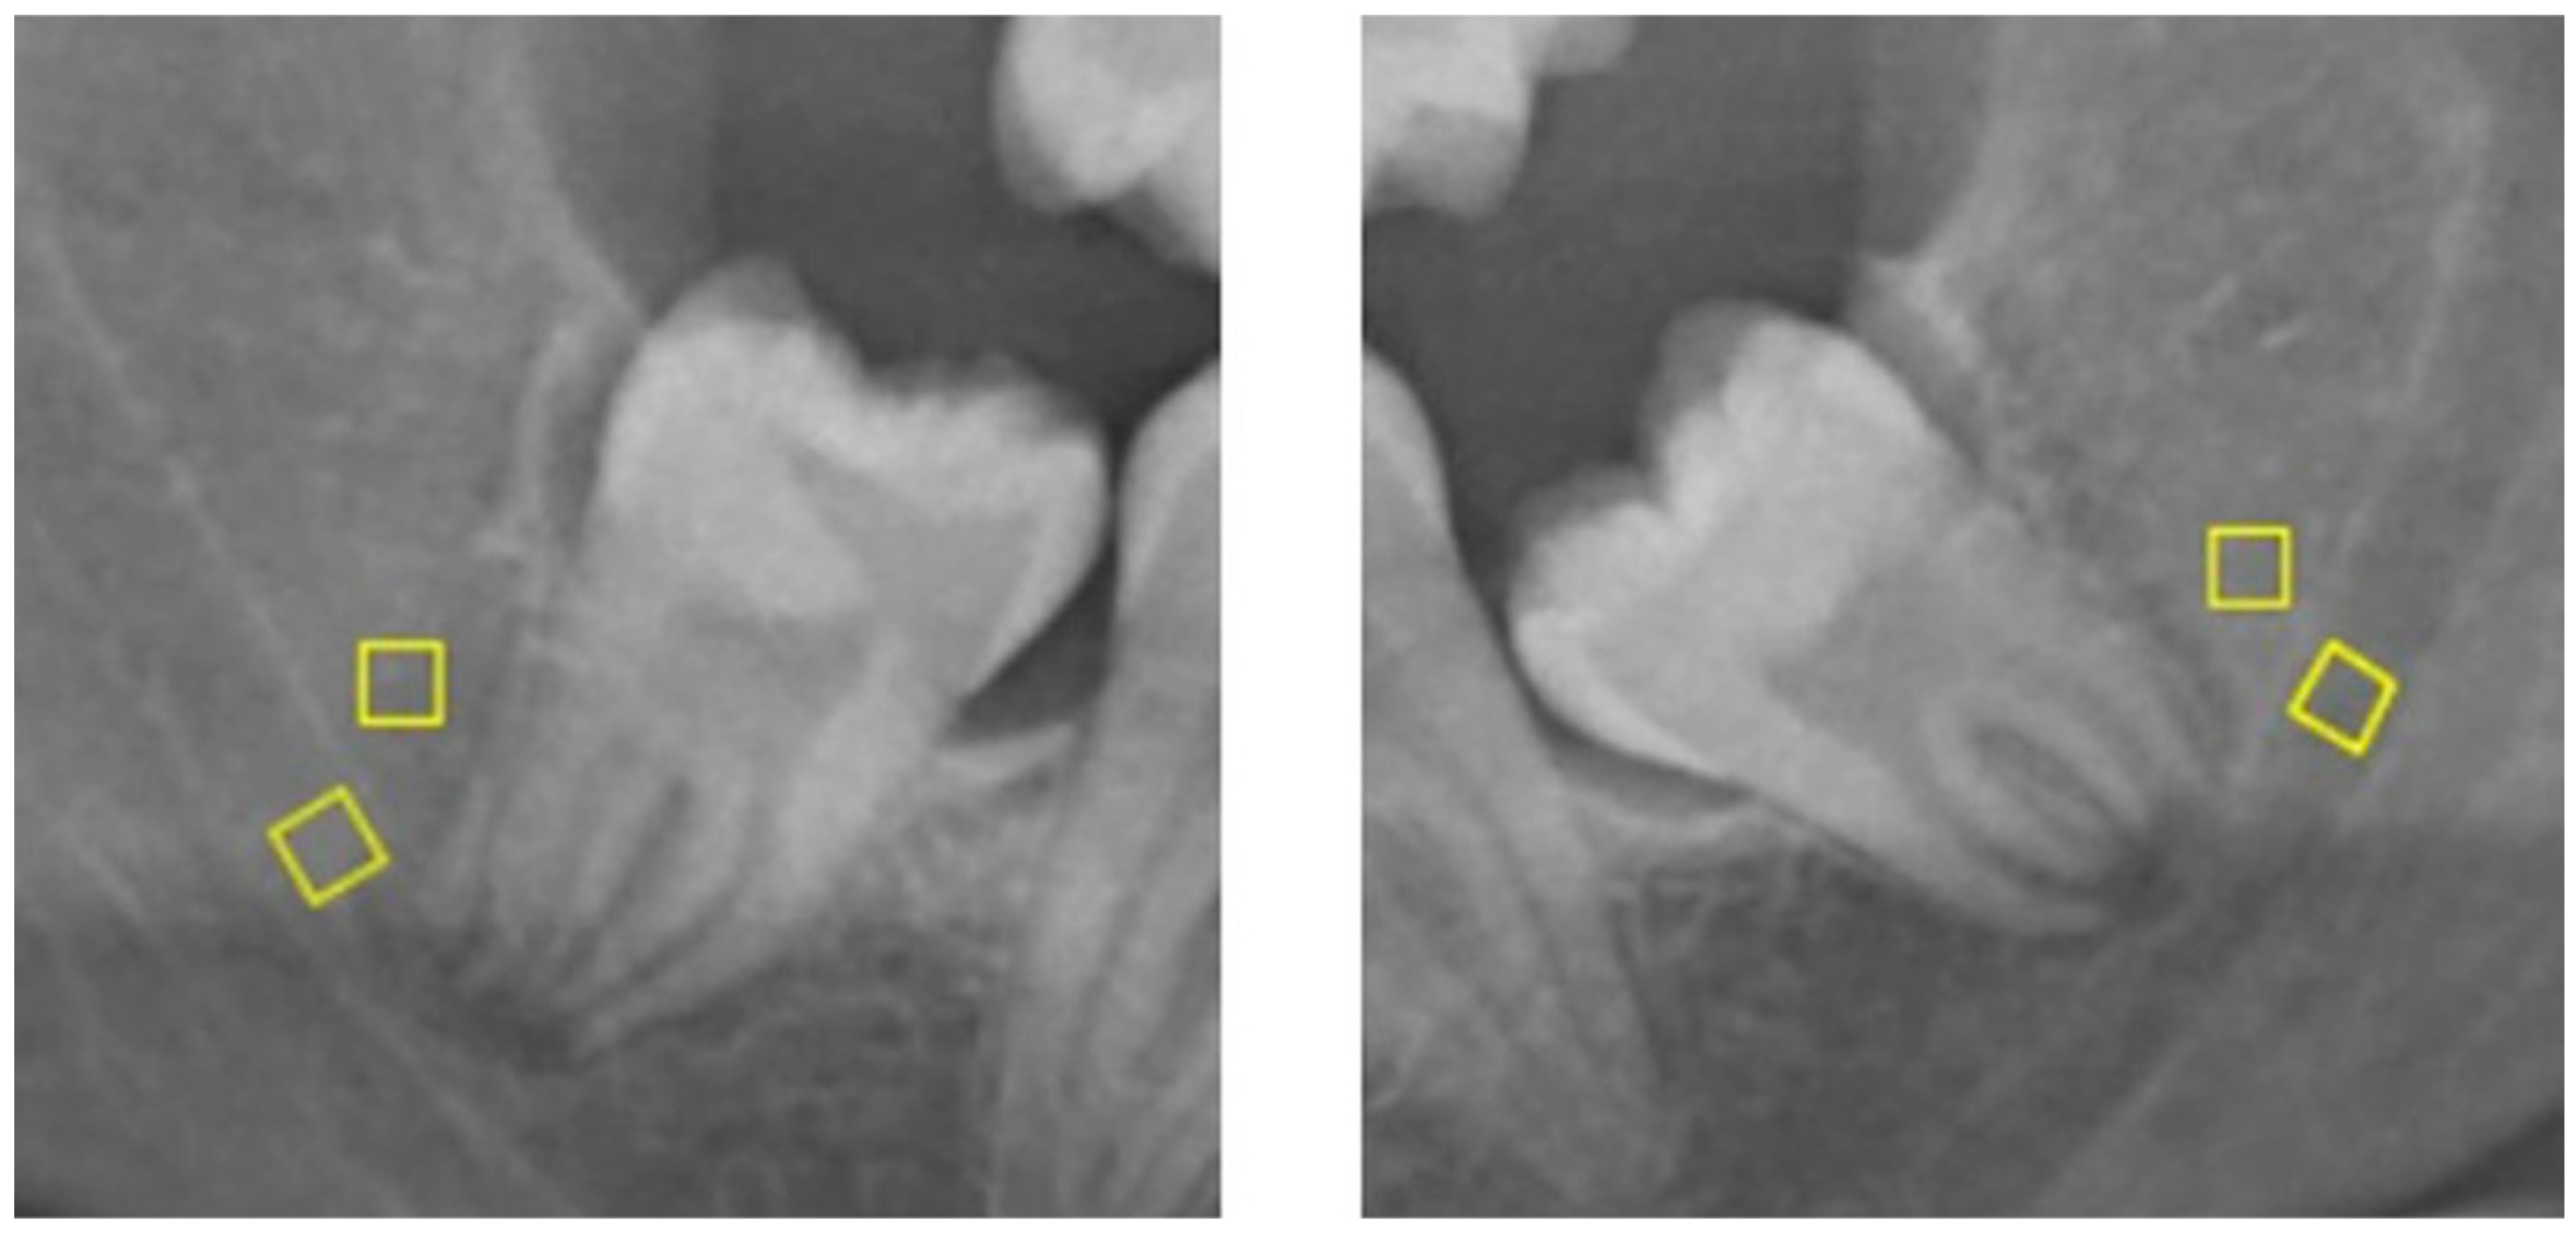
The radiological image analyses (FA and HA) were performed using Image J version 1.3 software program (National Institutes of Health, Bethesda, MD, USA), which is publicly available for free download (https://imagej.net/ij/download.html, accessed on 28 June 2025) on DPR images. On DPR images, two 20 × 20-pixel Regions of Interest (ROIs) were selected around the roots (distal to the tooth root) of each mandibular M3 (both related and unrelated to the mandibular canal, according to CBCT data) on both sides of the same patient. Thus, four ROIs were selected for each patient, two around the root of each tooth. The localization of the ROIs was as follows: inside the mandibular canal, distal to the root and within the canal; outside the mandibular canal, distal to the root, superior and external to the canal. ROIs were selected from inside and outside the mandibular canal, containing only trabecular bone and excluding the cortical bone, root, periodontal space, and lamina dura (Figure 2). Fractal dimension and Lacunarity were measured with FA applied to ROIs, and MGV was measured with HA on the same ROIs. The fractal dimension was measured according to the box counting method suggested by White and Rudolph [8]. Lacunarity and MGV were measured using the relevant tabs in ImageJ software (FracLac, Analysis; HA).
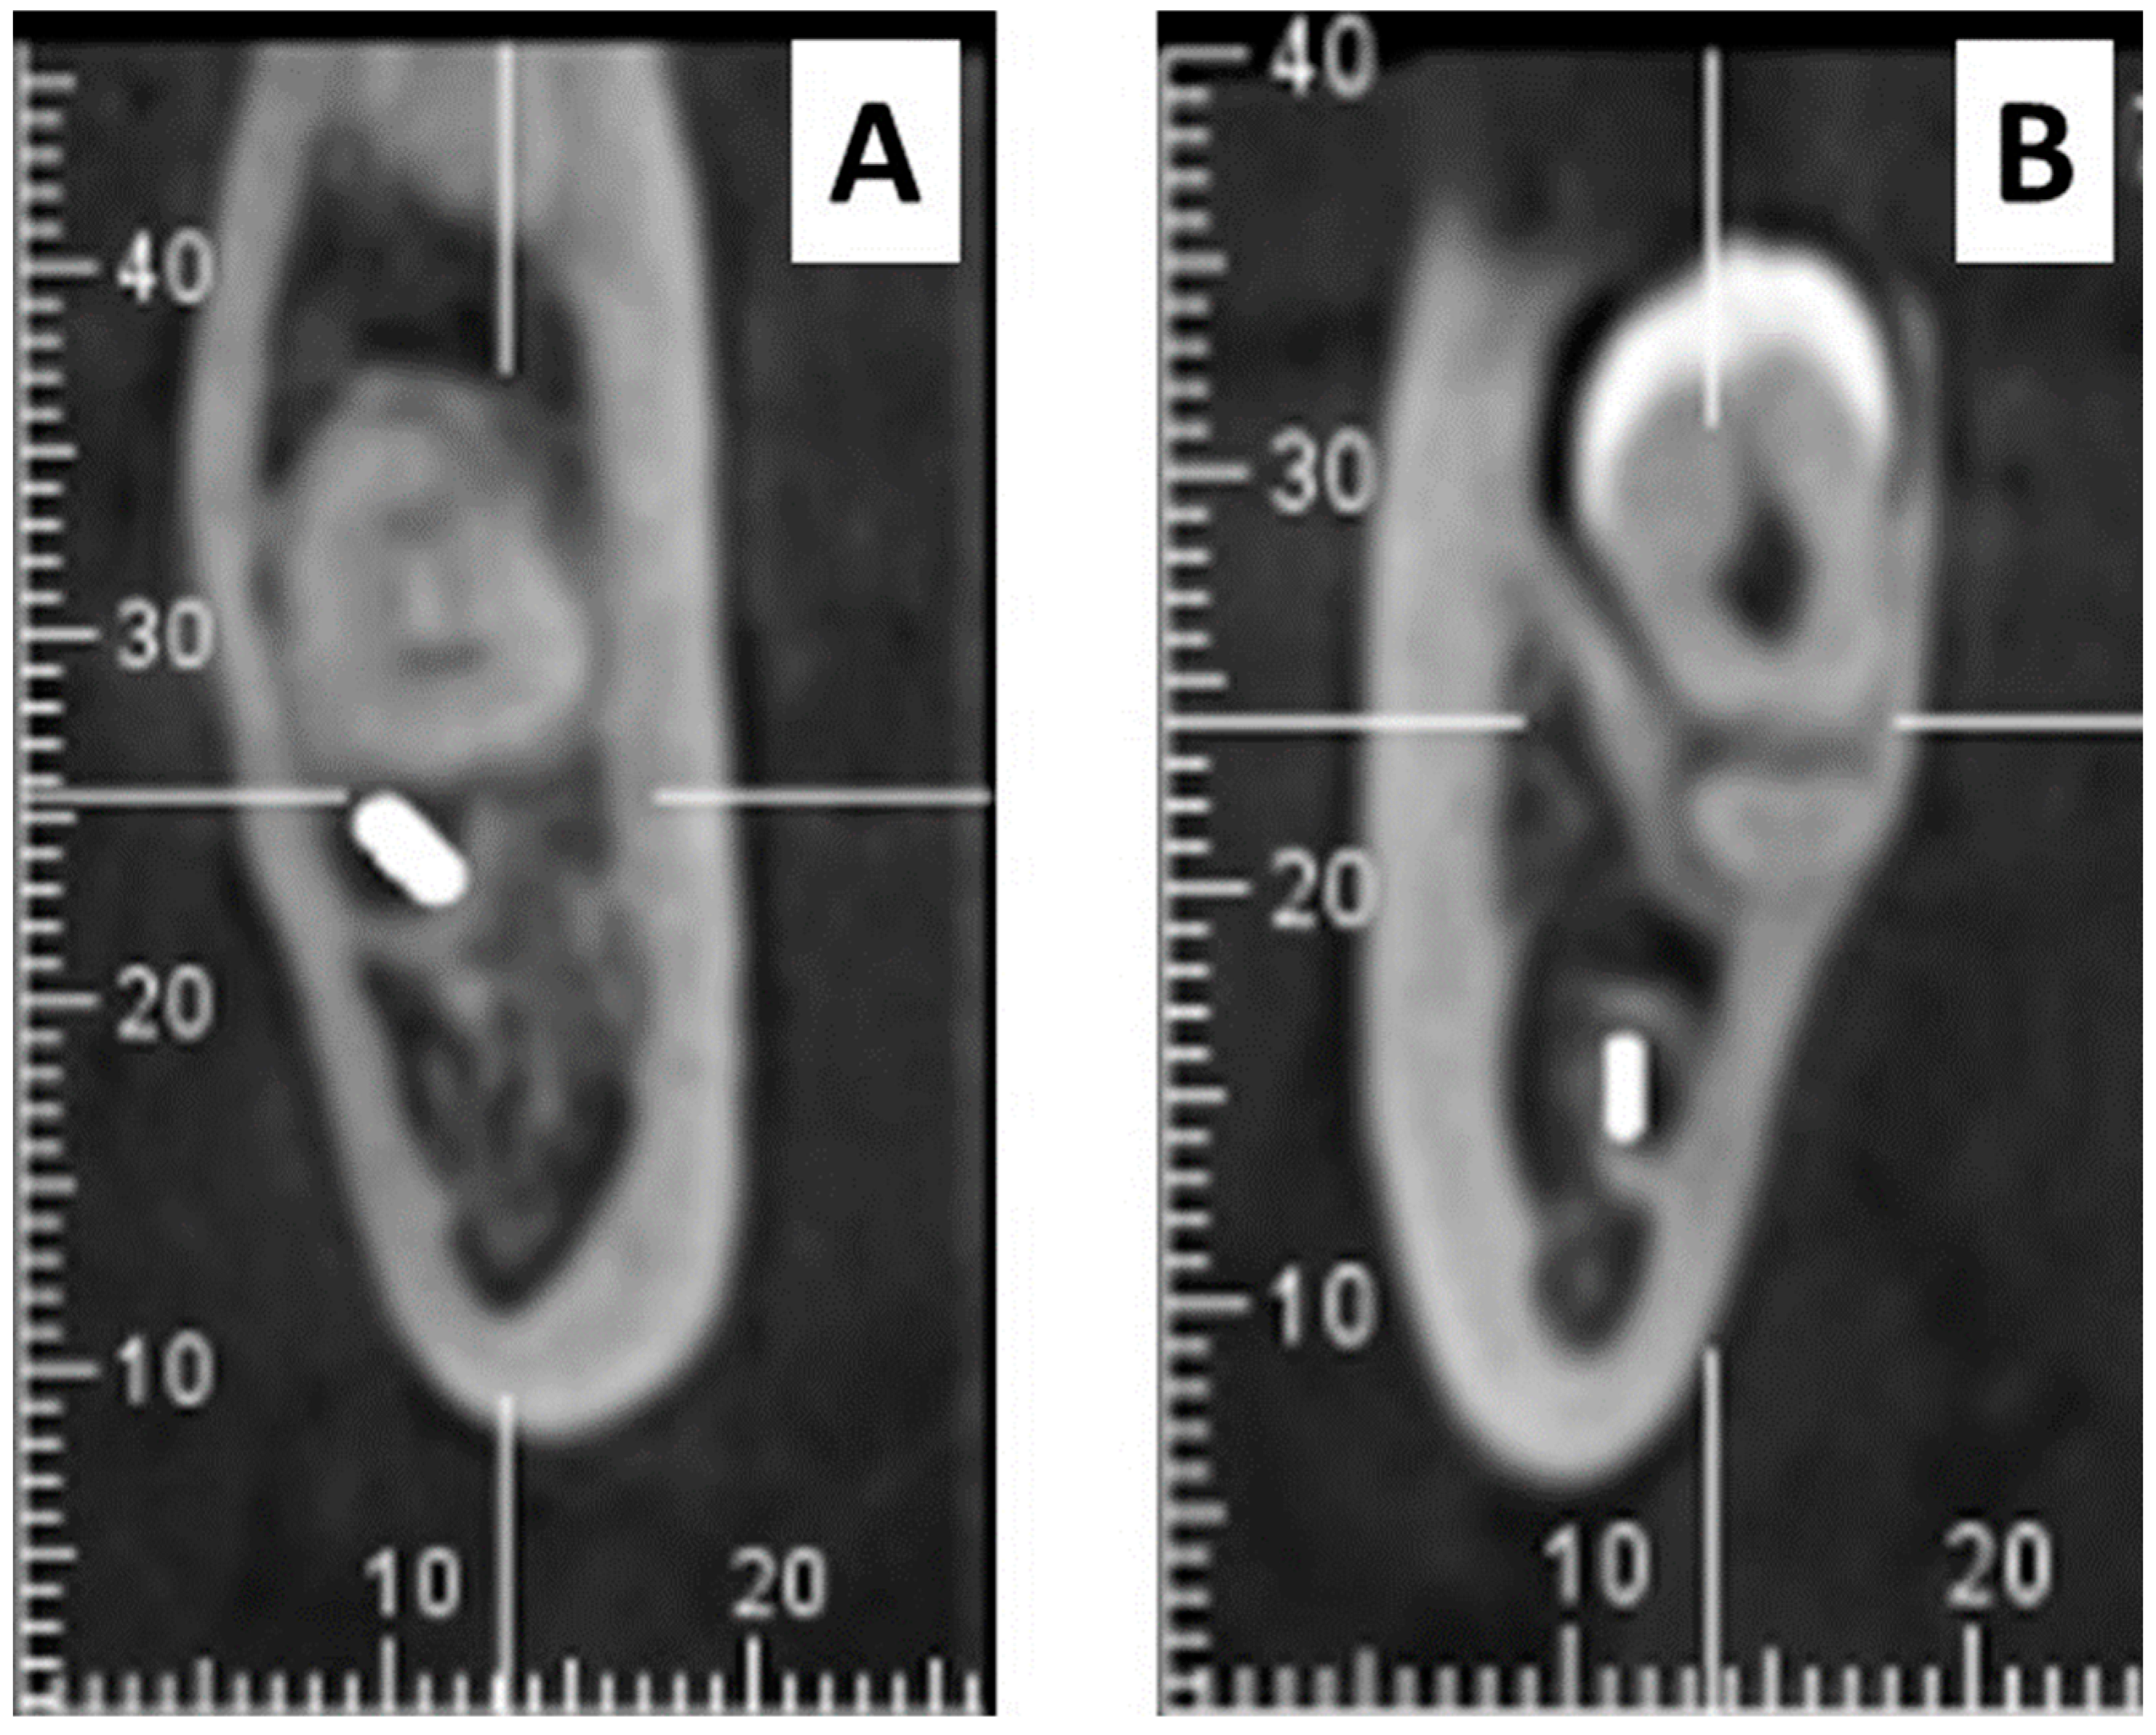
CBCT images were acquired by the Planmeca Promax 3D Mid (Planmeca, Helsinki, Finland) device. Acquisition parameters were 140 × 92 mm2 FOV, 90 kVp, 8 mA, 13.5 s, 0.4 mm3 voxel or 140 × 52 mm2 FOV, 90 kVp, 8 mA, 13.5 s, 0.4 mm3 voxel. The original software program of the CBCT device, Romexis 4.6.2.R (Planmeca, Helsinki, Finland), was used for imaging. To determine the relationship of M3s to the mandibular canal, images of three main plane slices of CBCT (axial, coronal, sagittal) or cross-sectional slices of the reconstructed images were used. The precise relationship/non-relationship situation of the roots of M3s to the mandibular canal was determined by CBCT images as the gold standard (Figure 3).
Evaluation of the images and measurements was performed by a single researcher with five years of experience in Oral and Maxillofacial Radiology.
The obtained data was transferred to the Excel program. Statistical analyses were performed using the IBM-SPSS (International Business Machines Software Package for Social Sciences) Statistics software (version 23.0; IBM, Armonk, NY, USA). The Independent t-test was used to compare two independent groups. The Lacunarity difference in the outside and inside did not show a normal distribution according to the Kolmogorov–Smirnov test. Therefore, the Mann–Whitney U test was used to compare the Lacunarity difference in the outside and inside of the mandibular canal of related and unrelated M3s. An independent t-test was used to compare the FD and MGV differences between the outside and inside of the mandibular canal of related and unrelated M3s. The Chi-Square test determined the relationship between two qualitative variables. Descriptive statistics for quantitative and qualitative variables were also given. The significance level was set to 0.05.

3. Results

A total of 60 patients, 39 female (65%) and 21 male (35%) aged between 18 and 74, with a mean age of 25.06, were included in the study.
The number and percentage of eight high-risk radiological signs detected on DPR images of mandibular M3s, based on their relationship to the mandibular canal detected by CBCT, are given in Table 1.
Radiolucency and bifurcation at the root apex, discontinuity of the mandibular canal cortex, and superimposition of the tooth root and mandibular canal on DPR were statistically significantly more frequent for M3s determined to be related to the mandibular canal by CBCT (p < 0.05).
The measurements of FD, Lacunarity, and MGV around the M3s at the level of the root apex, inside the mandibular canal, based on their relationship to the mandibular canal detected by CBCT, are given in Table 2.
According to Table 2, the Lacunarity at the level of the root apex inside the mandibular canal was statistically significantly higher for related mandibular M3s than those unrelated (p < 0.05). However, there was no statistically significant difference for FD and MGV (p > 0.05).
ROC analysis was performed for Lacunarity measurements of the outside and inside the mandibular canal. The ROC curves for both regions’ Lacunarity were statistically significant (p < 0.001). The cut-off point for Lacunarity outside the mandibular canal was 0.421, and for Lacunarity inside the mandibular canal was 0.433.
The measurements of FD, Lacunarity, and MGV around the M3s at the distal of the root, outside the mandibular canal, based on their relationship to the mandibular canal detected by CBCT, are given in Table 3.
According to Table 3, the Lacunarity at the distal of the root, outside the mandibular canal, was statistically significantly higher for unrelated mandibular M3s than those related (p < 0.05). However, there was no statistically significant difference for FD and MGV (p > 0.05).
The measurements of FD, Lacunarity, and MGV of the inside and outside of the mandibular canal around the M3s, based on their relationship to the mandibular canal detected by CBCT, are given in Table 4.
According to Table 4, the difference between FD, Lacunarity, and MGV of the inside and outside of the mandibular canal, both for related and unrelated M3, was statistically significant (p < 0.05). Except for the Lacunarity of the inside of the mandibular canal of related M3s, which was higher than the outside, FD, Lacunarity, and MGV of the outside of the mandibular canal were higher than the inside for both related and unrelated M3s.
The numerical differences in the measurements of FD, Lacunarity, and MGV of the inside and outside of the mandibular canal around the M3s, based on their relationship to the mandibular canal detected by CBCT, are given in Table 5.

4. Discussion

This study evaluated the effectiveness of FD, Lacunarity, and MGV measurements around the root and specific radiographic signs on DPR in determining the relationship of M3s to the mandibular canal. Some results of this study suggest that parameters such as discontinuity of the mandibular canal cortex (high-risk radiological sign) and Lacunarity (objective quantitative image analysis), determined on DPR, showed significant differences between related and unrelated M3s. In the literature, studies investigate the effectiveness of some high-risk radiological signs detected on DPR in determining the relationship of M3s to the mandibular canal and the risk in surgical operations. However, no study was found in which these relationships were determined by performing any image analysis in the bone around the root of M3s.
In their study examining the relationship between the mandibular M3s and the mandibular canal, Patel et al. observed a significant association between signs, such as no relation and superimposition signs on DPR, and unrelated M3s detected by CBCT [2]. Al Ali and Jaber reported a significant correlation between related M3s detected by CBCT and DPR signs, such as mandibular canal deviation and discontinuity of the mandibular canal cortex [6]. In their study with a small sample size (24 teeth), de Melo Albert et al. reported that mandibular M3s with the DPR signs, such as darkening of the roots, narrowing of the apexes, deviation of the mandibular canal, narrowing of the mandibular canal, and island-shaped apex, were frequently found closely related to the mandibular canal by CT [23]. Nayak et al. reported that the most frequently observed DPR signs of related M3s detected by CBCT were darkening at the apex and narrowing the mandibular canal [24]. Deppe et al. reported that M3s observed on DPR, in superimposition of tooth apex and mandibular canal, in contact of tooth apex and mandibular canal, and no contact of tooth apex and mandibular canal, were detected related to mandibular canal on CBCT, respectively, as 91.7%, 92.3%, and 57.1% [25]. Khan et al. found a mandibular canal-M3 relationship by spiral CT with a rate of 43.4% for superimposition, 50% for mandibular canal narrowing, 30% for root radiolucency, 30.8% for interruption of the radiopaque border of the mandibular canal, and 50% for mandibular canal deviation/diversion detected on DPR [26]. Tofangchiha et al. reported that the two DPR signs (Root apex darkening, interference with the white line of the mandibular canal) could reliably predict the relationship between the mandibular M3s and the mandibular canal, as confirmed by CBCT [27]. Monaco et al. stated that DPR signs, such as narrowing of the canal, increased radiolucency, and interruption of the radiopaque border of the mandibular canal, had a high predictive value in identifying the relationship between the lower third-molar root and the mandibular canal, as determined by CBCT [28]. Neves et al. reported that darkening of the roots and interruption of the white line of the mandibular canal observed on DPR were significant signs of the relationship between the mandibular M3s and the mandibular canal determined by CBCT [4]. Elkhateeb et al. reported a significant association between DPR signs, such as interruption of the mandibular canal, darkening in roots, and narrowing of the mandibular canal, and related M3s to the mandibular canal determined by CBCT [29]. Tantanapornkul et al. investigated only one DPR sign, mandibular M3 root darkening, for the relationship of M3 to the mandibular canal. They reported that CBCT findings, such as cortical thinning or perforation, were significantly correlated with this DPR sign [30]. Peker et al. reported that the darkening of the roots of M3s and interruption of the white line of the mandibular canal observed on DPR were significantly correlated with the presence of a relationship between the M3s and the mandibular canal determined by CBCT [31]. In their study comparing DPR signs with surgical findings to accurately diagnose the relationship between the mandibular M3 roots and the inferior alveolar neurovascular bundle, Bell et al. found the overall mean sensitivity and specificity values to be 66% and 74%, respectively [32]. Because the radiographic assessment was very different from that used in this study, it is not discussed here. Janovics et al. tried to determine the relationship between inferior alveolar nerve entrapment and root conformations by comparing DPR signs and CBCT findings. They reported that upward diversion of the mandibular canal, root darkening, interruption of the mandibular canal cortical lines, and rotated tooth position DPR signs, especially their multiplex combinations, predict nerve entrapment [33]. In the present study, the related M3s to the mandibular canal detected by CBCT were found to be significantly higher in cases with DPR signs of radiolucency and bifurcation at the root apex, discontinuity of the mandibular canal cortex, and superimposition of the root and the mandibular canal, consistent with most of the studies presented above. Although high-risk radiological findings examined on DPR were determined by an experienced oral and maxillofacial radiologist, they can be considered subjective findings due to the two-dimensional nature of DPR, distortions, and superpositions in certain regions of the images.
Fractal dimension and Lacunarity used in the evaluation of microarchitectural structure of the bone and MGV, which allow monitoring of changes in an image’s density, are among this study’s original contributions. Since numerical and experimental Electrical Conductivity (EC) maps are affected by uncertainties and/or inaccuracies, proposed defect removal methods based on fuzzy similarity calculations have been presented in the literature [34]. However, there is no literature information that FA and HA methods can be extended with soft computing approaches to improve classification accuracy. These analyses applied to the trabecular bone inside and outside the mandibular canal around the mandibular M3s root on the DPR were evaluated according to the relationship status of the relevant tooth to the mandibular canal determined by CBCT. There are studies in the literature in which the microarchitecture of the bone around impacted canine teeth is evaluated with FA. Arvind et al. compared the FD measurements around the impacted and non-impacted canine teeth in patients with unilateral impacted canine teeth. They determined that bone FD was higher on the impacted side, while bone marrow FD was higher on the non-impacted side on CBCT slices [35]. Akturk et al. reported that in patients with unilateral impacted canine teeth, the FD of the bone around the impacted tooth was significantly higher than that on the non-impacted side [36]. Eid et al. reported that the FD around both buccal and palatal impacted canine teeth was greater than the unimpacted control side measured on CBCT slices of patients with unilateral impacted canine teeth [37]. In contrast, Servais et al. reported that the FD of the bone around impacted and non-impacted canine teeth showed no significant difference [38]. Although there was no study investigating the microarchitectural change around the bone caused by the relationship of teeth to a vital tissue, such as the mandibular canal, as in the current study, there was mention of the change (usually an increase) of the FD around the bone of impacted canine teeth compared to those that were non-impacted.
In their study evaluating the relationship between the Pederson Difficulty Index, which classifies surgical extraction difficulty, and FD around impacted M3s, Çakan and İpek stated that FD showed a non-significant increase in the distal and apical regions with increasing surgical difficulty, while decreasing in the mesial region [39]. Balkan et al. compared the FD of the distal of the first and second molars of the patients with impacted mandibular M3s. They could not detect a significant difference between the FDs of these two regions’ bone and bone marrow [40]. The effects of surgical extraction difficulty and impaction on microarchitectural changes in the bone around M3s, particularly increases in FD of the distal and apical regions, have been reported. However, these studies’ findings were not directly comparable to the current study.
In their study comparing the dentate and edentulous areas in the posterior mandible, Yasar and Akgünlü found significantly higher FD and lower Lacunarity in the edentulous area [41]. In a similar study, Bhoraskar et al. reported that FD and Lacunarity in the edentulous area were greater than in the dentate area. However, the difference was significant only for FD [12]. Although not directly similar, in the current study, consistent with these studies, the FD and Lacunarity of the outside the canal (at the distal of the root) of unrelated M3s, which can be said to simulate the edentulous area better, were found to be higher. However, the difference was significant only for Lacunarity.
There are also studies examining the bone around impacted canine teeth with HA and FA. In their study, conducted by CBCT, Seçgin et al. reported that the MGV around impacted canine teeth was significantly higher than that of non-impacted ones on images with a 40 × 40 FOV, but not for 60 × 60 and 100 × 50 FOVs [42]. In another similar study using CBCT, Adiwinarno et al. reported that the MGV of the trabecular bone around unilaterally impacted canine teeth was significantly higher than that of non-impacted ones in the mesial, distal, buccal, and palatal regions [43]. No study was found that could compare the MGV findings of the current study. In the current study, both inside and outside the mandibular canal, MGVs around the unrelated ones were measured as higher than those around the related ones, but the difference was insignificant. This situation may be due to decreased radiopacity around the root of canal-related M3s because of the radiolucency caused by the mandibular canal.
In this study, the fact that the positions and impaction status of M3s in the dental arch were not examined constitutes a limitation. Additionally, the fact that clinical conditions that may cause radiological changes, such as pericoronitis, could not be included due to the study’s retrospective nature may be considered a limitation. Of course, a larger sample size would have provided more robust results and helped detect subtle differences. Methods such as Finite Element Modeling (FEM) and Artificial Intelligence (AI)-enhanced monitoring are increasingly being used as medical aids in treatment phases such as rehabilitation or in radiological diagnosis [44,45]. Considering the applications of these new innovative approaches in healthcare, new studies can be conducted to evaluate the relationship of the M3s with the mandibular canal using these methods. Also, the studies emphasizing that Electrical Impedance Tomography (EIT), a non-invasive imaging method that uses the variable electrical impedance properties of biological tissues, is a feasible technique for carcinoma detection, future studies can evaluate the relation of M3s with the mandibular canal using this method [46]. In recent years, the development of biomedical sensor technology has demonstrated the potential for monitoring abnormal changes in bone mineral density [47]. Studies evaluating the correlation between FA and biomedical sensors, which have been shown to detect changes in bone mineral density in bone diseases such as osteoporosis, bone cancer, and osteomyelitis, would be particularly valuable.

5. Conclusions

This study suggests that the discontinuity of the mandibular canal cortex as a DPR radiological sign highlighted in previous studies may help determine the relationship of the mandibular M3s to the mandibular canal. Furthermore, unlike previous approaches, the Lacunarity measured by FA, which provides an objective quantitative assessment, may also effectively determine this relationship. Indeed, further studies on the usability of the discontinuity of the mandibular canal cortex (high-risk radiological sign) and Lacunarity (objective quantitative image analysis) parameters as diagnostic tools in determining the relationship of the mandibular M3s to the mandibular canal on DPR will be beneficial.

Author Contributions

Conceptualization, H.I.E. and U.P.; methodology, H.I.E., U.P. and O.Y.; formal analysis, U.P. and O.Y.; investigation, H.I.E. and O.Y.; resources, H.I.E., U.P. and O.Y.; data curation, U.P.; writing—original draft preparation, H.I.E. and U.P.; writing—review, U.P. and K.G.; editing, U.P.; supervision, K.G. All authors have read and agreed to the published version of the manuscript.

Funding

This research received no external funding.

Institutional Review Board Statement

This study was started after the approval of the Gazi University Ethics Commission (Date: 26 November 2024; No:19; Research Code No: 2024-1783). The study was conducted in accordance with the Declaration of Helsinki, including all regulations and revisions.

Informed Consent Statement

Informed consent was obtained from all subjects involved in the study.

Data Availability Statement

Data are available upon reasonable request.

Conflicts of Interest

The authors declare no conflicts of interest.

Abbreviations

The following abbreviations are used in this manuscript:
M3Mandibular third molars
DPRDigital Panoramic Radiography
CBCTCone Beam Computed Tomography
FAFractal Analysis
HAHistogram Analysis
FDFractal Dimension
HRHigh-Resolution
MRIMagnetic Resonance Imaging
MGVMean Gray Value
TIFFTag Image File Format
ROIRegions of Interest
EMFElectromagnetic Field
SARSpecific Absorption Rate
∆TTemperature Change
ECElectrical Conductivity
FEMFinite Element Modeling
AIArtificial Intelligence
EITElectrical Impedance Tomography

References

  1. Lopes, V.; Mumenya, R.; Feinmann, C.; Harris, M. Third molar surgery: An audit of the indications for surgery, post-operative complaints and patient satisfaction. Br. J. Oral Maxillofac. Surg. 1995, 33, 33–35. [Google Scholar] [CrossRef] [PubMed]
  2. Patel, P.S.; Shah, J.S.; Dudhia, B.B.; Butala, P.B.; Jani, Y.V.; Macwan, R.S. Comparison of panoramic radiograph and cone beam computed tomography findings for impacted mandibular third molar root and inferior alveolar nerve canal relation. Indian J. Dent. Res. 2020, 31, 91–102. [Google Scholar] [CrossRef]
  3. Al-Haj Husain, A.; Stadlinger, B.; Winklhofer, S.; Bosshard, F.A.; Schmidt, V.; Valdec, S. Imaging in Third Molar Surgery: A Clinical Update. J. Clin. Med. 2023, 12, 7688. [Google Scholar] [CrossRef]
  4. Neves, F.S.; Souza, T.C.; Almeida, S.M.; Haiter-Neto, F.; Freitas, D.Q.; Bóscolo, F.N. Correlation of panoramic radiography and cone beam CT findings in the assessment of the relationship between impacted mandibular third molars and the mandibular canal. Dentomaxillofac. Radiol. 2012, 41, 553–557. [Google Scholar] [CrossRef]
  5. Moreira-Souza, L.; Butini Oliveira, L.; Gaêta-Araujo, H.; Almeida-Marques, M.; Asprino, L.; Oenning, A.C. Comparison of CBCT and panoramic radiography for the assessment of bone loss and root resorption on the second molar associated with third molar impaction: A systematic review. Dentomaxillofac. Radiol. 2022, 51, 20210217. [Google Scholar] [CrossRef]
  6. Al Ali, S.; Jaber, M. Correlation of panoramic high-risk markers with the cone beam CT findings in the preoperative assessment of the mandibular third molars. J. Dent. Sci. 2020, 15, 75–83. [Google Scholar] [CrossRef]
  7. Davis, D.; Birnbaum, L.; Ben-Ishai, P.; Taylor, H.; Sears, M.; Butler, T.; Scarato, T. Wireless technologies, non-ionizing electromagnetic fields and children: Identifying and reducing health risks. Curr. Probl. Pediatr. Adolesc. Health Care 2023, 53, 101374. [Google Scholar] [CrossRef] [PubMed]
  8. Laganà, F.; Bibbò, L.; Calcagno, S.; De Carlo, D.; Pullano, S.A.; Pratticò, D.; Angiulli, G. Smart electronic device-based monitoring of SAR and temperature variations in indoor human tissue interaction. Appl. Sci. 2025, 15, 2439. [Google Scholar] [CrossRef]
  9. Kato, C.N.; Barra, S.G.; Tavares, N.P.; Amaral, T.M.; Brasileiro, C.B.; Mesquita, R.A.; Abreu, L.G. Use of fractal analysis in dental images: A systematic review. Dentomaxillofac. Radiol. 2020, 49, 20180457. [Google Scholar] [CrossRef]
  10. White, S.C.; Rudolph, D.J. Alterations of the trabecular pattern of the jaws in patients with osteoporosis. Oral Surg. Oral Med. Oral Pathol. Oral Radiol. Endod. 1999, 88, 628–635. [Google Scholar] [CrossRef]
  11. Lopes, R.; Betrouni, N. Fractal and multifractal analysis: A review. Med. Image Anal. 2009, 13, 634–649. [Google Scholar] [CrossRef]
  12. Bhoraskar, M.; Denny, C.; Srikant, N.; Ongole, R.; Archana, M.; Sampath, P. Fractal Dimension and Lacunarity Analysis in the Dentulous and Edentulous Mandibular Posterior Region Using Cone-beam Computed Tomography: A Cross-sectional Retrospective Study. J. Contemp. Dent. Pract. 2024, 25, 581–587. [Google Scholar]
  13. Plotnick, R.E.; Gardner, R.H.; O’Neill, R.V. Lacunarity indices as measures of landscape texture. Landsc. Ecol. 1993, 8, 201–211. [Google Scholar] [CrossRef]
  14. Santos, I.G.; Ramos de Faria, F.; da Silva Campos, M.J.; de Barros, B.Á.C.; Rabelo, G.D.; Devito, K.L. Fractal dimension, lacunarity, and cortical thickness in the mandible: Analyzing differences between healthy men and women with cone-beam computed tomography. Imaging Sci. Dent. 2023, 53, 153–159. [Google Scholar] [CrossRef] [PubMed]
  15. Önem, E.; Baksı, B.G.; Sogur, E. Changes in the fractal dimension, feret diameter, and lacunarity of mandibular alveolar bone during initial healing of dental implants. Int. J. Oral Maxillofac. Implant. 2012, 27, 1009–1013. [Google Scholar]
  16. Shrout, M.K.; Potter, B.J.; Hildebolt, C.F. The effect of image variations on fractal dimension calculations. Oral Surg. Oral Med. Oral Pathol. Oral Radiol. Endod. 1997, 84, 96–100. [Google Scholar] [CrossRef] [PubMed]
  17. Dougherty, G.; Henebry, G.M. Lacunarity analysis of spatial pattern in CT images of vertebral trabecular bone for assessing osteoporosis. Med. Eng. Phys. 2002, 24, 129–138. [Google Scholar] [CrossRef]
  18. Heo, M.S.; Park, K.S.; Lee, S.S.; Choi, S.C.; Koak, J.Y.; Heo, S.J.; Han, C.H.; Kim, J.D. Fractal analysis of mandibular bony healing after orthognathic surgery. Oral Surg. Oral Med. Oral Pathol. Oral Radiol. Endod. 2002, 94, 763–767. [Google Scholar] [CrossRef]
  19. Parsa, A.; Ibrahim, N.; Hassan, B.; van der Stelt, P.; Wismeijer, D. Bone quality evaluation at dental implant site using multislice CT, micro-CT, and cone beam CT. Clin. Oral Implant. Res. 2015, 26, e1–e7. [Google Scholar] [CrossRef]
  20. Patsch, J.M.; Burghardt, A.J.; Kazakia, G.; Majumdar, S. Noninvasive imaging of bone microarchitecture. Ann. N. Y. Acad. Sci. 2011, 1240, 77–87. [Google Scholar] [CrossRef]
  21. Sogur, E.; Baksi, B.G.; Mert, A. The effect of delayed scanning of storage phosphor plates on occlusal caries detection. Dentomaxillofac. Radiol. 2012, 41, 309–315. [Google Scholar] [CrossRef]
  22. Rood, J.P.; Shehab, B.A. The radiological prediction of inferior alveolar nerve injury during third molar surgery. Br. J. Oral Maxillofac. Surg. 1990, 28, 20–25. [Google Scholar] [CrossRef]
  23. de Melo Albert, D.G.; Gomes, A.C.; do Egito Vasconcelos, B.C.; de Oliveira e Silva, E.D.; Holanda, G.Z. Comparison of orthopantomographs and conventional tomography images for assessing the relationship between impacted lower third molars and the mandibular canal. J. Oral Maxillofac. Surg. 2006, 64, 1030–1037. [Google Scholar] [CrossRef]
  24. Nayak, D.S.; Raghavan, S.A.; Birur, P.; Gurudath, S.; Keerthi, G. Determination of proximity of mandibular third molar to mandibular canal using panoramic radiography and cone-beam computed tomography. J. Indian Acad. Oral Med. Radiol. 2017, 29, 273–277. [Google Scholar] [CrossRef]
  25. Deppe, H.; Ritschl, L.M.; Kleinschmidt, J.; Wagenpfeil, S.; Sculean, A. Contiguity between the mandibular canal and the mandibular third molar in panoramic tomography compared with cone beam computed tomography: A topographic analysis. Quintessence Int. 2019, 50, 470–477. [Google Scholar]
  26. Khan, I.; Halli, R.; Gadre, P.; Gadre, K.S. Correlation of panoramic radiographs and spiral CT scan in the preoperative assessment of intimacy of the inferior alveolar canal to impacted mandibular third molars. J. Craniofac. Surg. 2011, 22, 566–570. [Google Scholar] [CrossRef] [PubMed]
  27. Tofangchiha, M.; Koushaei, S.; Mortazavi, M.; Souri, Z.; Alizadeh, A.; Patini, R. Positive Predictive Value of Panoramic Radiography for Assessment of the Relationship of Impacted Mandibular Third Molars with the Mandibular Canal Based on Cone-Beam Computed Tomography: A Cross-Sectional Study. Diagnostics 2021, 11, 1578. [Google Scholar] [CrossRef]
  28. Monaco, G.; Montevecchi, M.; Bonetti, G.A.; Gatto, M.R.; Checchi, L. Reliability of panoramic radiography in evaluating the topographic relationship between the mandibular canal and impacted third molars. J. Am. Dent. Assoc. 2004, 135, 312–318. [Google Scholar] [CrossRef] [PubMed]
  29. Elkhateeb, S.M.; Awad, S.S. Accuracy of panoramic radiographic predictor signs in the assessment of proximity of impacted third molars with the mandibular canal. J. Taibah Univ. Med. Sci. 2018, 13, 254–261. [Google Scholar] [CrossRef] [PubMed]
  30. Tantanapornkul, W.; Okochi, K.; Bhakdinaronk, A.; Ohbayashi, N.; Kurabayashi, T. Correlation of darkening of impacted mandibular third molar root on digital panoramic images with cone beam computed tomography findings. Dentomaxillofac. Radiol. 2009, 38, 11–16. [Google Scholar] [CrossRef]
  31. Peker, I.; Sarikir, C.; Alkurt, M.T.; Zor, Z.F. Panoramic radiography and cone-beam computed tomography findings in preoperative examination of impacted mandibular third molars. BMC Oral Health 2014, 14, 71. [Google Scholar] [CrossRef]
  32. Bell, G.W.; Rodgers, J.M.; Grime, R.J.; Edwards, K.L.; Hahn, M.R.; Dorman, M.L.; Keen, W.D.; Stewart, D.J.; Hampton, N. The accuracy of dental panoramic tomographs in determining the root morphology of mandibular third molar teeth before surgery. Oral Surg. Oral Med. Oral Pathol. Oral Radiol. Endod. 2003, 95, 119–125. [Google Scholar] [CrossRef]
  33. Janovics, K.; Soós, B.; Tóth, Á.; Szalma, J. Is it possible to filter third molar cases with panoramic radiography in which roots surround the inferior alveolar canal? A comparison using cone-beam computed tomography. J. Craniomaxillofac. Surg. 2021, 49, 971–979. [Google Scholar] [CrossRef]
  34. Versaci, M.; Laganà, F.; Manin, L.; Angiulli, G. Soft computing and eddy currents to estimate and classify delaminations in biomedical device CFRP plates. J. Electr. Eng. 2025, 76, 72–79. [Google Scholar] [CrossRef]
  35. Arvind, T.R.P.; Jain, R.K.; Nagi, R.; Tiwari, A. Evaluation of Alveolar Bone Microstructure around Impacted Maxillary Canines Using Fractal Analysis in Dravidian Population: A Retrospective CBCT Study. J. Contemp. Dent. Pract. 2022, 23, 593–600. [Google Scholar] [CrossRef] [PubMed]
  36. Sunal Akturk, E.; Toktas, A.I.; Can, E.; Kosen, E.; Sarica, I. Assessment of the Trabecular Bone Microstructure Surrounding Impacted Maxillary Canines Using Fractal Analysis on Cone-Beam Computed Tomography Images. Diagnostics 2024, 14, 2143. [Google Scholar] [CrossRef] [PubMed]
  37. Eid, F.Y.; Ghaleb, S.I.; Badr, F.F.; Marzouk, E.S. Three-dimensional assessment of the skeletal characteristics accompanying unilateral maxillary canine impaction: A retrospective cone-beam computed tomography study. BMC Oral Health 2024, 24, 1249. [Google Scholar] [CrossRef] [PubMed]
  38. Servais, J.A.; Gaalaas, L.; Lunos, S.; Beiraghi, S.; Larson, B.E.; Leon-Salazar, V. Alternative cone-beam computed tomography method for the analysis of bone density around impacted maxillary canines. Am. J. Orthod. Dentofac. Orthop. 2018, 154, 442–449. [Google Scholar] [CrossRef]
  39. Çakan, K.N.; İpek, İ. A dual approach to third molar complexity: Correlating fractal analysis with the pederson difficulty index—non-clinical research article. BMC Oral Health 2025, 25, 1073. [Google Scholar] [CrossRef]
  40. Balkan, E.P.; Deniz, H.A.; Kurt, M.H.; Samunahmetoğlu, E.; Karahan, S. Application of fractal analysis in detecting trabecular bone characteristics around mandibular impacted third molars on dental panoramic radiographs. Eur. Ann. Dent. Sci. 2024, 51, 67–73. [Google Scholar] [CrossRef]
  41. Yasar, F.; Akgünlü, F. Fractal dimension and lacunarity analysis of dental radiographs. Dentomaxillofac. Radiol. 2005, 34, 261–267. [Google Scholar] [CrossRef]
  42. Köseoğlu Seçgin, C.; Karslıoğlu, H.; Özemre, M.; Orhan, K. Gray value measurement for the evaluation of local alveolar bone density around impacted maxillary canine teeth using cone beam computed tomography. Med. Oral Patol. Oral Cir. Bucal 2021, 26, e669–e675. [Google Scholar] [CrossRef]
  43. Adiwinarno, B.; Narmada, I.B.; Hamid, T.A. Comparison of Trabecular Bone in Impacted and Normal Erupted Unilateral Maxillary Canine Teeth Using Cone-Beam Computed Tomography in Patients Scheduled for Orthodontic Treatment at the Universitas Airlangga Dental and Oral Hospital. Acta Med. Philipp. 2023, 57, 51–56. [Google Scholar]
  44. Laganà, F.; Pellicanò, D.; Arruzzo, M.; Pratticò, D.; Pullano, S.A.; Fiorillo, A.S. FEM-Based Modelling and AI-Enhanced Monitoring System for Upper Limb Rehabilitation. Electronics 2025, 14, 2268. [Google Scholar] [CrossRef]
  45. Langlotz, C.P. The future of AI and informatics in radiology: 10 predictions. Radiology 2023, 309, e231114. [Google Scholar] [CrossRef] [PubMed]
  46. Laganà, F.; Prattico, D.; De Carlo, D.; Oliva, G.; Pullano, S.A.; Calcagno, S. Engineering Biomedical Problems to Detect Carcinomas: A Tomographic Impedance Approach. Eng 2024, 5, 1594–1614. [Google Scholar] [CrossRef]
  47. Rani, S.; Bandyopadhyay-Ghosh, S.; Ghosh, S.B.; Liu, G. Advances in sensing technologies for monitoring of bone health. Biosensors 2020, 10, 42. [Google Scholar] [CrossRef] [PubMed]
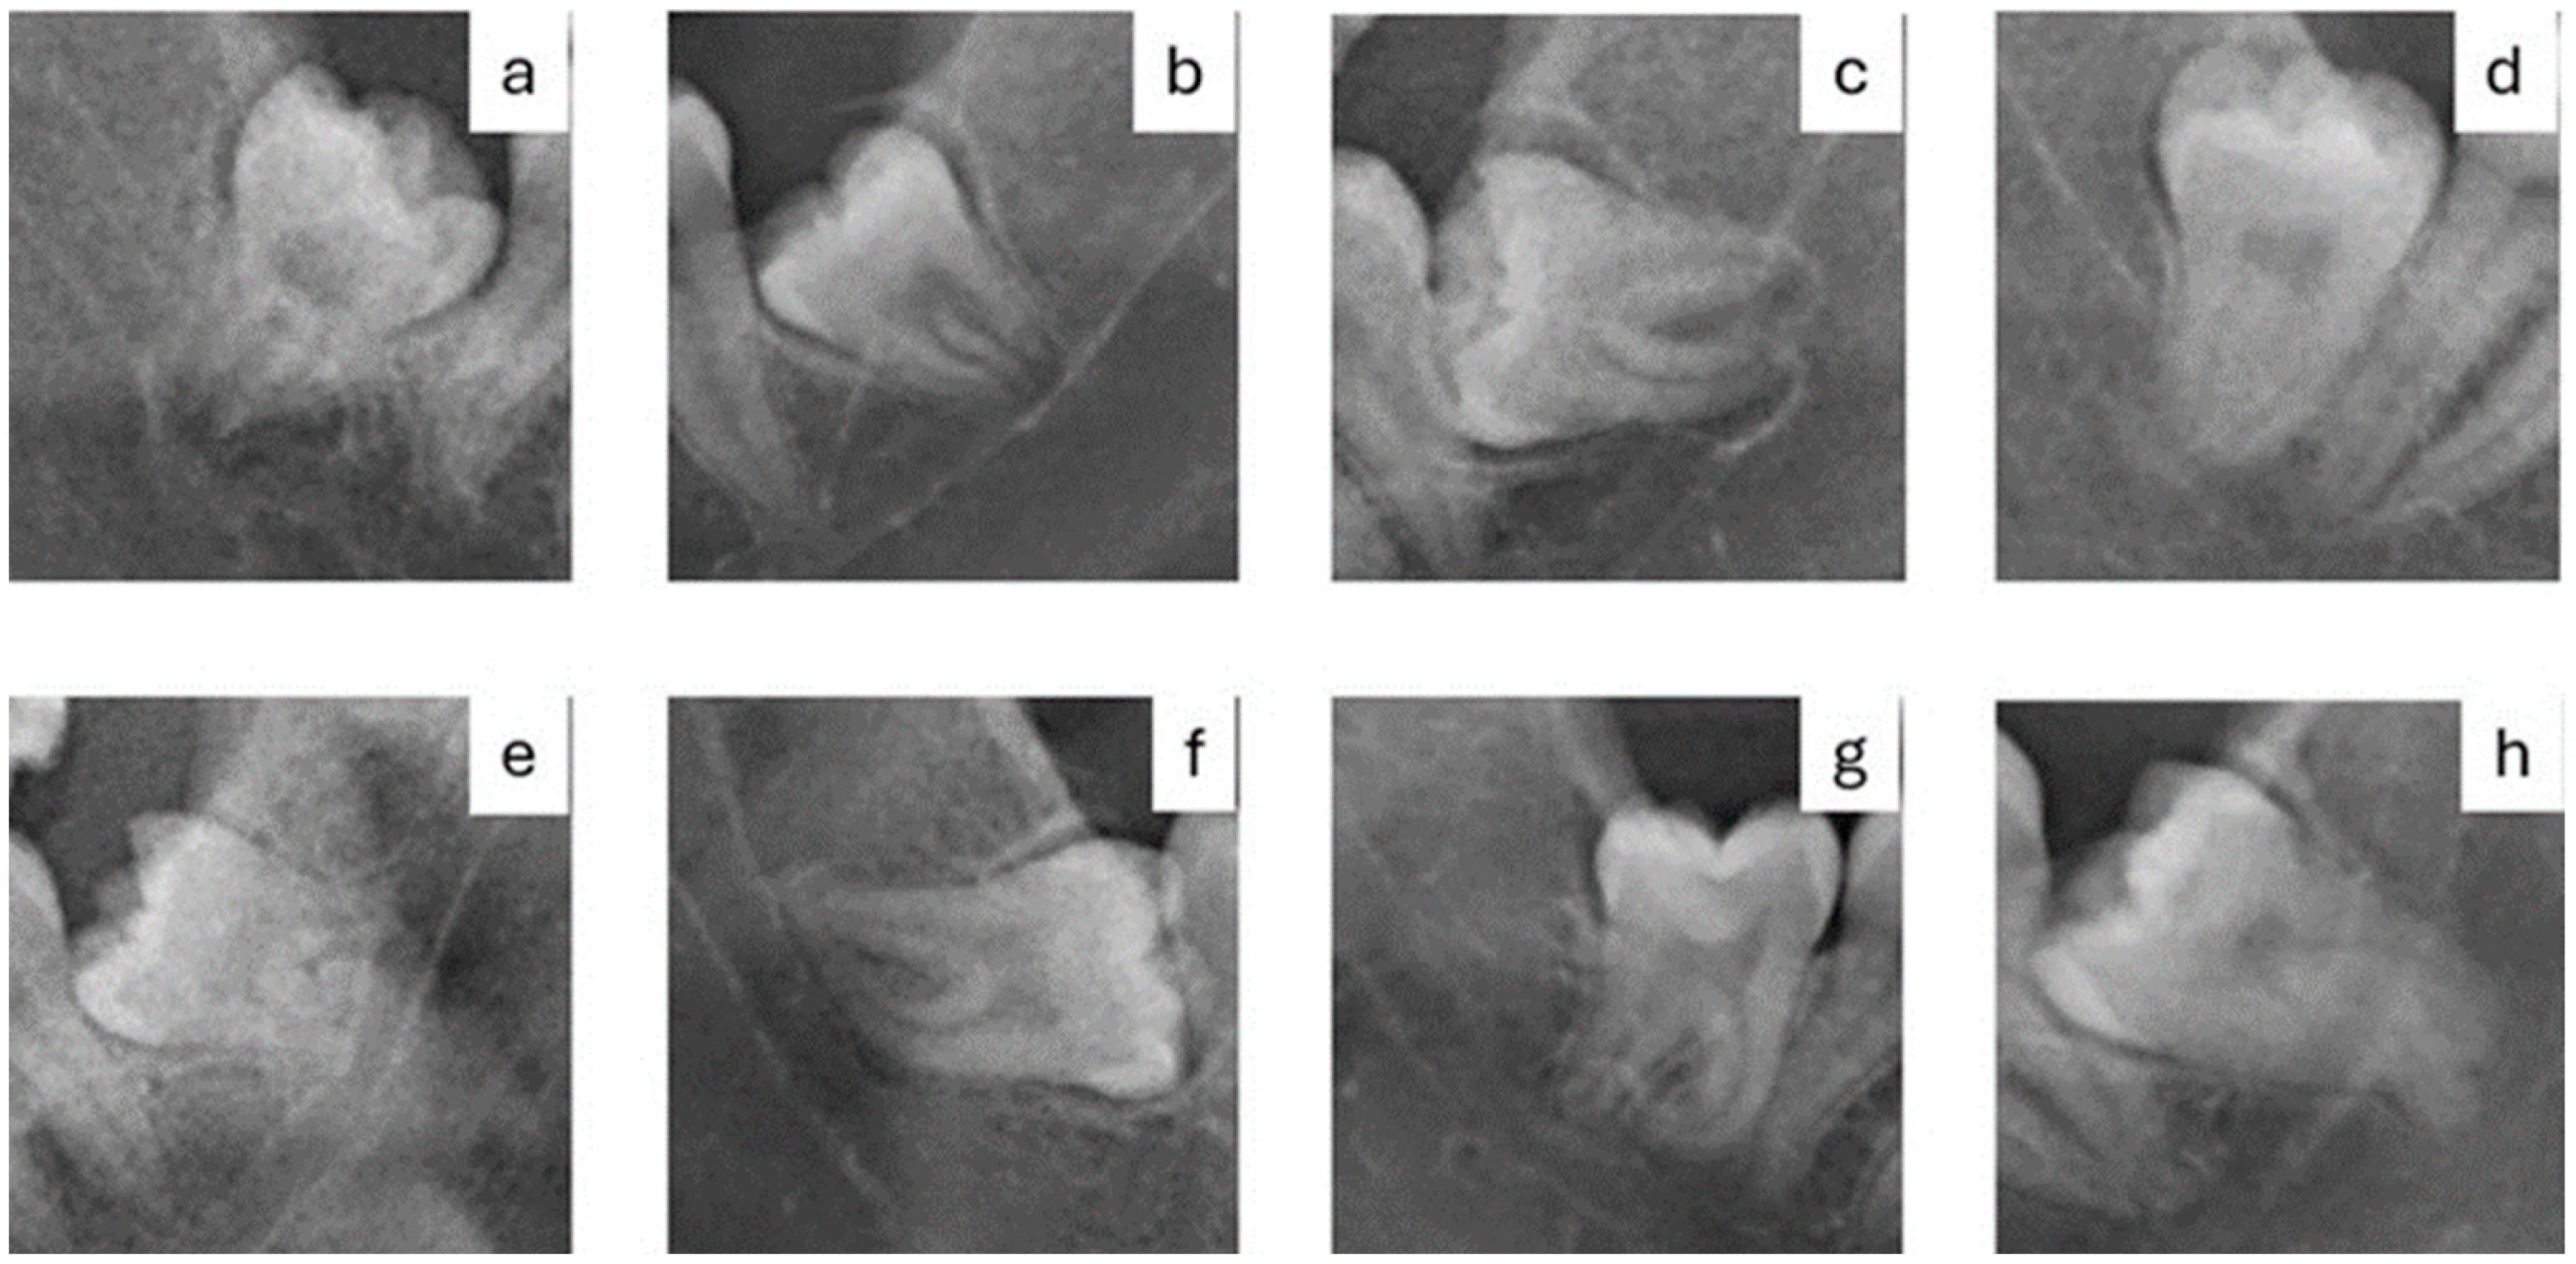
Figure 1. Cropped DPR images showing high-risk radiological signs: (a) Radiolucency at the root, (b) Narrowing of the root, (c) Radiolucency and bifurcation at the root apex, (d) Discontinuity of the mandibular canal cortex, (e) Narrowing of the mandibular canal, (f) Deviation at the root, (g) Deviation of the mandibular canal, (h) Superimposition of the root and the mandibular canal.
Fractalfract 09 00612 g001
Figure 2. Cropped DPR images containing two square-shaped 20 × 20-pixel Region of Interest (ROI) selected around the apex of bilateral mandibular M3 roots, inside and outside the mandibular canal.
Fractalfract 09 00612 g002
Figure 3. CBCT images of mandibular M3s: (A) Cross-sectional slices of the mandibular M3 related to the mandibular canal (white line), (B) Cross-sectional slices of the mandibular M3 unrelated to the mandibular canal (white line).
Fractalfract 09 00612 g003
Table 1. Comparison of DPR signs and CBCT findings of M3s, and statistical analysis of the Chi-Square test results.
Relationship of M3-Mandibular Canal Determined by CBCTp-Value
Related (N = 60)Unrelated (N = 60)
N (%)N (%)
High-risk radiological signs on DPRRadiolucency at the root26 (43.3)17 (28.3)0.128
Narrowing of the root10 (16.6)6 (10)0.42
Radiolucency and bifurcation at the root apex10 (16.6)2 (3.3)0.03 *
Discontinuity of the mandibular canal cortex27 (45)7 (11.6)0.00012 *
Narrowing of the mandibular canal20 (33.3)19 (31.6)0.845
Deviation of the root13 (21.6)14 (23.3)0.920
Deviation of the mandibular canal4 (6.6)4 (6.6)1.0
Superimposition of the root and the mandibular canal (overlapping)47 (78.3)32 (53.3)0.007 *
*, p < 0.05.
Table 2. Comparison of FD, Lacunarity, and MGV measurements inside the mandibular canal and CBCT findings of M3s, and statistical analysis results of the independent sample t-test.
Relationship of M3-Mandibular Canal Determined by CBCTp-Value
Related (N = 60)Unrelated (N = 60)
Mean ± SD
Inside the mandibular canalFD1.136 ± 0.0171.124 ± 0.0220.677
Lacunarity0.457 ± 0.0150.403 ± 0.0180.027 *
MGV101.313 ± 2.065104.347 ± 1.9730.290
*, p < 0.05. SD, Standard deviation.
Table 3. Comparison of FD, Lacunarity, and MGV measurements outside the mandibular canal and CBCT findings of M3s, and statistical analysis results of the independent sample t-test.
Relationship of M3-Mandibular Canal Determined by CBCTp-Value
Related (N = 60)Unrelated (N = 60)
Mean ± SD
Outside the mandibular canalFD1.194 ± 0.0171.211 ± 0.0200.523
Lacunarity0.407 ± 0.0120.458 ± 0.0140.008 *
MGV109.814 ± 1.943111.693 ± 1.8490.485
*, p < 0.05. SD, Standard deviation.
Table 4. Comparison of FD, Lacunarity, and MGV inside and outside of the mandibular canal of related and unrelated M3s, and statistical analysis results of the independent sample t-test.
Inside the Mandibular Canal Outside the Mandibular Canalp-Value
Mean ± SD
Relationship of M3-mandibular canal determined by CBCTUnrelated (N = 60)FD1.124 ± 0.0221.211 ± 0.0200.004 *
Lacunarity0.403± 0.0180.458 ± 0.0140.020 *
MGV104.347 ± 1.973111.693 ± 1.8490.008 *
Related (N = 60)FD1.136 ± 0.0171.194 ± 0.0170.018 *
Lacunarity0.457 ± 0.0150.407 ± 0.0120.012 *
MGV101.313 ± 2.065109.814 ± 1.9420.003 *
*, p < 0.05. SD, Standard deviation.
Table 5. Comparison of FD, Lacunarity, and MGV numerical difference in the outside and inside of the mandibular canal of related and unrelated M3s, and statistical analysis results of the independent sample t and Mann–Whitney U tests.
Relationship of M3-Mandibular Canal Determined by CBCTp-Value
Related (N = 60)Unrelated (N = 60)
Mean ± SD
The difference between the outside and inside measurementsFD0.059 ± 0.0210.088 ± 0.0270.398
Lacunarity−0.050 ± 0.0170.055 ± 0.025 0.001 **
MGV8.5 ± 1.97.3 ± 1.90.666
**, p < 0.01. SD, Standard deviation.
Disclaimer/Publisher’s Note: The statements, opinions and data contained in all publications are solely those of the individual author(s) and contributor(s) and not of MDPI and/or the editor(s). MDPI and/or the editor(s) disclaim responsibility for any injury to people or property resulting from any ideas, methods, instructions or products referred to in the content.