Article

Multifractal Characterization of Pore Structure of Coals Using Gas Adsorption Experiment and Mercury Intrusion Porosimetry (MIP)

1
The Key Laboratory of Orogenic Belts and Crustal Evolution, Beijing Key Laboratory of Mineral Environmental Function, School of Earth and Space Sciences, Peking University, Beijing 100871, China
2
Research Institute of Petroleum Engineering and Technology, SINOPEC Shengli Oilfield Company, Dongying 257000, China
*
Author to whom correspondence should be addressed.
These authors contributed equally to this work.
Fractal Fract. 2025, 9(3), 183; https://doi.org/10.3390/fractalfract9030183
Submission received: 25 February 2025 / Revised: 13 March 2025 / Accepted: 14 March 2025 / Published: 16 March 2025

Abstract

Efficient and safe extraction of coalbed methane is essential for reshaping China’s energy composition. This study integrates CO2 adsorption, N2 adsorption, and corrected mercury intrusion porosimetry (MIP) data to analyze the full pore size distribution (PSD) of six coal samples from the Qinshui and Tiefa Basins. By applying multifractal theory, we identified key heterogeneity features across different coal ranks, followed by a discussion of the factors influencing these parameters. The results indicate the following: (1) Coal matrix compressibility significantly impacts MIP results when mercury intrusion pressure exceeds 10 MPa, with corrected mesopore and macropore volume reductions ranging from 59.85–96.31% and 3.11–15.53%, respectively. (2) Pore volume distribution varies with coal rank, as macropores dominate in low-rank coal, while micropores contribute most in medium- and high-rank coal, accounting for over 90% of the total specific surface area. Multifractal analysis of CO2, N2, and corrected MIP data confirms notable multifractal characteristics across the full pore size range. (3) As the degree of coalification increases, as indicated by the rise in the Ro,max value, there is a notable negative correlation observed among the multifractal parameters Dmin-D0, D0-Dmax, Δα, and H. A positive correlation exists between moisture content and volatile matter content with Dmin-D0, Δα, and H, while a significant negative correlation is shown between the concentration of minerals and Dmin-D0, Δα, and H. There exists a favorable correlation between inertinite concentration and D0-Dmax. This work presents a theoretical foundation and empirical proof for the secure and effective extraction of coalbed methane in the researched region.

1. Introduction

As a significant component of unconventional natural gas, Coalbed methane (CBM) has garnered interest in numerous countries [1,2]. The pore structure of coal significantly influences the transportation of CBM. The pore structures of coal in various coal ranks exhibit substantial variation due to coalification [3,4]. Consequently, comprehending the distribution characteristics of pore structures across multiple coal ranks is a fundamental foundation for investigating the occurrence features and migration mechanisms of CBM.
Micropores (<2 nm), mesopores (2–50 nm), and macropores (>50 nm) are the three types of pores that exist in coal, as classified by the International Union of Pure and Applied Chemistry (IUPAC) classification standard [5]. The approaches for classifying the pore and crack features of coal are primarily defined as fluid intrusion methods and photoelectric radiation techniques. Using gas adsorption techniques, the pore structure of micropores and mesopores can be better examined [6,7]. Two-dimensional morphology observation and three-dimensional reconstruction in designated areas can be accomplished with nanometer precision using Field Emission Scanning Electron Microscopy (FIB-SEM) [8,9] and X-ray Computed Tomography (CT) [10,11] techniques. Nevertheless, they are constrained by a relatively limited field of view. Nuclear Magnetic Resonance (NMR) technology [12], as a non-destructive testing method, can identify information about the pore size distribution (PSD) and fluid distribution properties. Nevertheless, its precision in measuring nanopores is relatively low. Among the various approaches for analyzing the pore structure of coal, the MIP experiment is among the most effective. Pores larger than 3 nm can be theoretically identified through the MIP experiment. Nevertheless, the coal matrix may compress under high pressure if the pressure exceeds 10 MPa, destroying micropore structures and consequently affecting the test results. Consequently, it is imperative to rectify the high-pressure segment data of the MIP experiment to enhance its precision. The integration of LPN2GA with MIP data has been demonstrated in prior studies to enhance the accuracy of characterization results and enable the evaluation of coal matrix compressibility [13,14]. Guo et al. [15] employed this method to ascertain the compressibility factor of the coal matrix, which displayed a “U-shaped” dependence with increasing coal rank. Cai et al. determined the compressibility coefficient of the coal matrix to vary between 0.24 and 13.56 × 10⁺10 m2/N [16]. Additionally, the elements that affect the compressibility coefficient were identified across various coal ranks.
The theory of fractal geometry, which mathematician Benoît Mandelbrot introduced, has been widely employed to evaluate the heterogeneity of complex porous materials. Numerous researchers who have combined fractal theory with pore structure characterization methods, including gas adsorption, MIP, and SEM, have achieved a series of research outcomes [17,18,19,20,21,22,23]. Krohn and Thompson [17] conducted a scan electron microscopy analysis of the fractal features of sandstone and discovered an advantageous connection between porosity and fractal dimension. Yao et al. [18] analyzed the impact of mesopore fractal dimensions upon the adsorption capacity of coal employing N2 adsorption experiments and the Frenkel–Halsey–Hill fractal model. Zhang et al. [19] employed multivariate statistical methods to develop a predictive model for fractal dimensions, combining fractal theory with NMR experiments to identify the multifractal dimensions of adsorption and seepage pores. Peng et al. [20] discovered that rock pore diameters can be estimated by combining fractal theory with CT imaging. Nevertheless, a singular fractal theory cannot describe an object’s local heterogeneity distribution properties. As an extension of single fractal theory, multifractal theory has a broader applicability in defining the fractal features of complex pore structures in reservoir rocks, such as coal, and overcomes its limitations. Zheng et al. [21] introduced a novel approach to determining the coal NMR T2 cutoff value by applying multifractal theory. Li et al. [22] employed MIP measurements and multifractal theory to investigate the evolution features of tectonically deformed coal. They revealed that multifractal theory can effectively describe the fractal properties of PSD. Zhang et al. [23] examined the heterogeneity features of Longmaxi shale using NMR technology in conjunction with multifractal theory, which disclosed the influencing factors of multifractal parameters. Currently, the combined classification method of N2 adsorption and MIP is frequently employed. This method involves the correction of MIP data to achieve an accurate characterization of macropore and mesopore structures. However, the micropore scale is not incorporated into this method due to the constraints of the analysis principles. Furthermore, the heterogeneity characteristics of coal were typically described in previous studies using uncorrected MIP raw pore size distribution data and single fractal methods. Only a few studies have employed corrected MIP pore size distribution data in conjunction with multifractal theory [22,24]. Existing research is constrained by the principles of traditional N2-MIP combined techniques, which often exclude the ultramicropore system from the analysis, despite these pores being critical sites for gas adsorption. Most studies directly use uncorrected raw MIP data combined with a single fractal model for heterogeneity analysis. However, this approach can lead to distortions in pore size distribution data due to the mercury compression effect in micropores and mesopores. Additionally, a single fractal dimension is insufficient to characterize the multiscale fractal features of the pore system. Furthermore, there is still a lack of systematic quantitative research on the intrinsic correlations between fractal parameters and key physical properties of coal-bearing rocks. In this study, six coal samples of various coal ranks were selected from the Qinshui and the Tiefa Basin. Initially, the N2 adsorption method was employed to rectify the high-pressure segment data from the MIP experiment, and the compressibility of the coal matrix was determined. To accurately describe the full pore size distribution of the coal, CO2 adsorption experiments were implemented by the corrected MIP data and the combined characterization of N2 adsorption. This successfully overcomes the limitations of the traditional N2-MIP method in characterizing ultramicropores below 2 nm, significantly improving the measurement accuracy of pore volume parameters across the full pore size range. By employing the complete pore size distribution characterization results, the multifractal theory was implemented to compute the multifractal features throughout the full pore size range. Correlation analysis was then implemented to examine the factors that impact the multifractal characteristics. A theoretical basis and experimental proof are established in this work for the secure and efficient extraction of coalbed methane in the studied area.

2. Materials and Methods
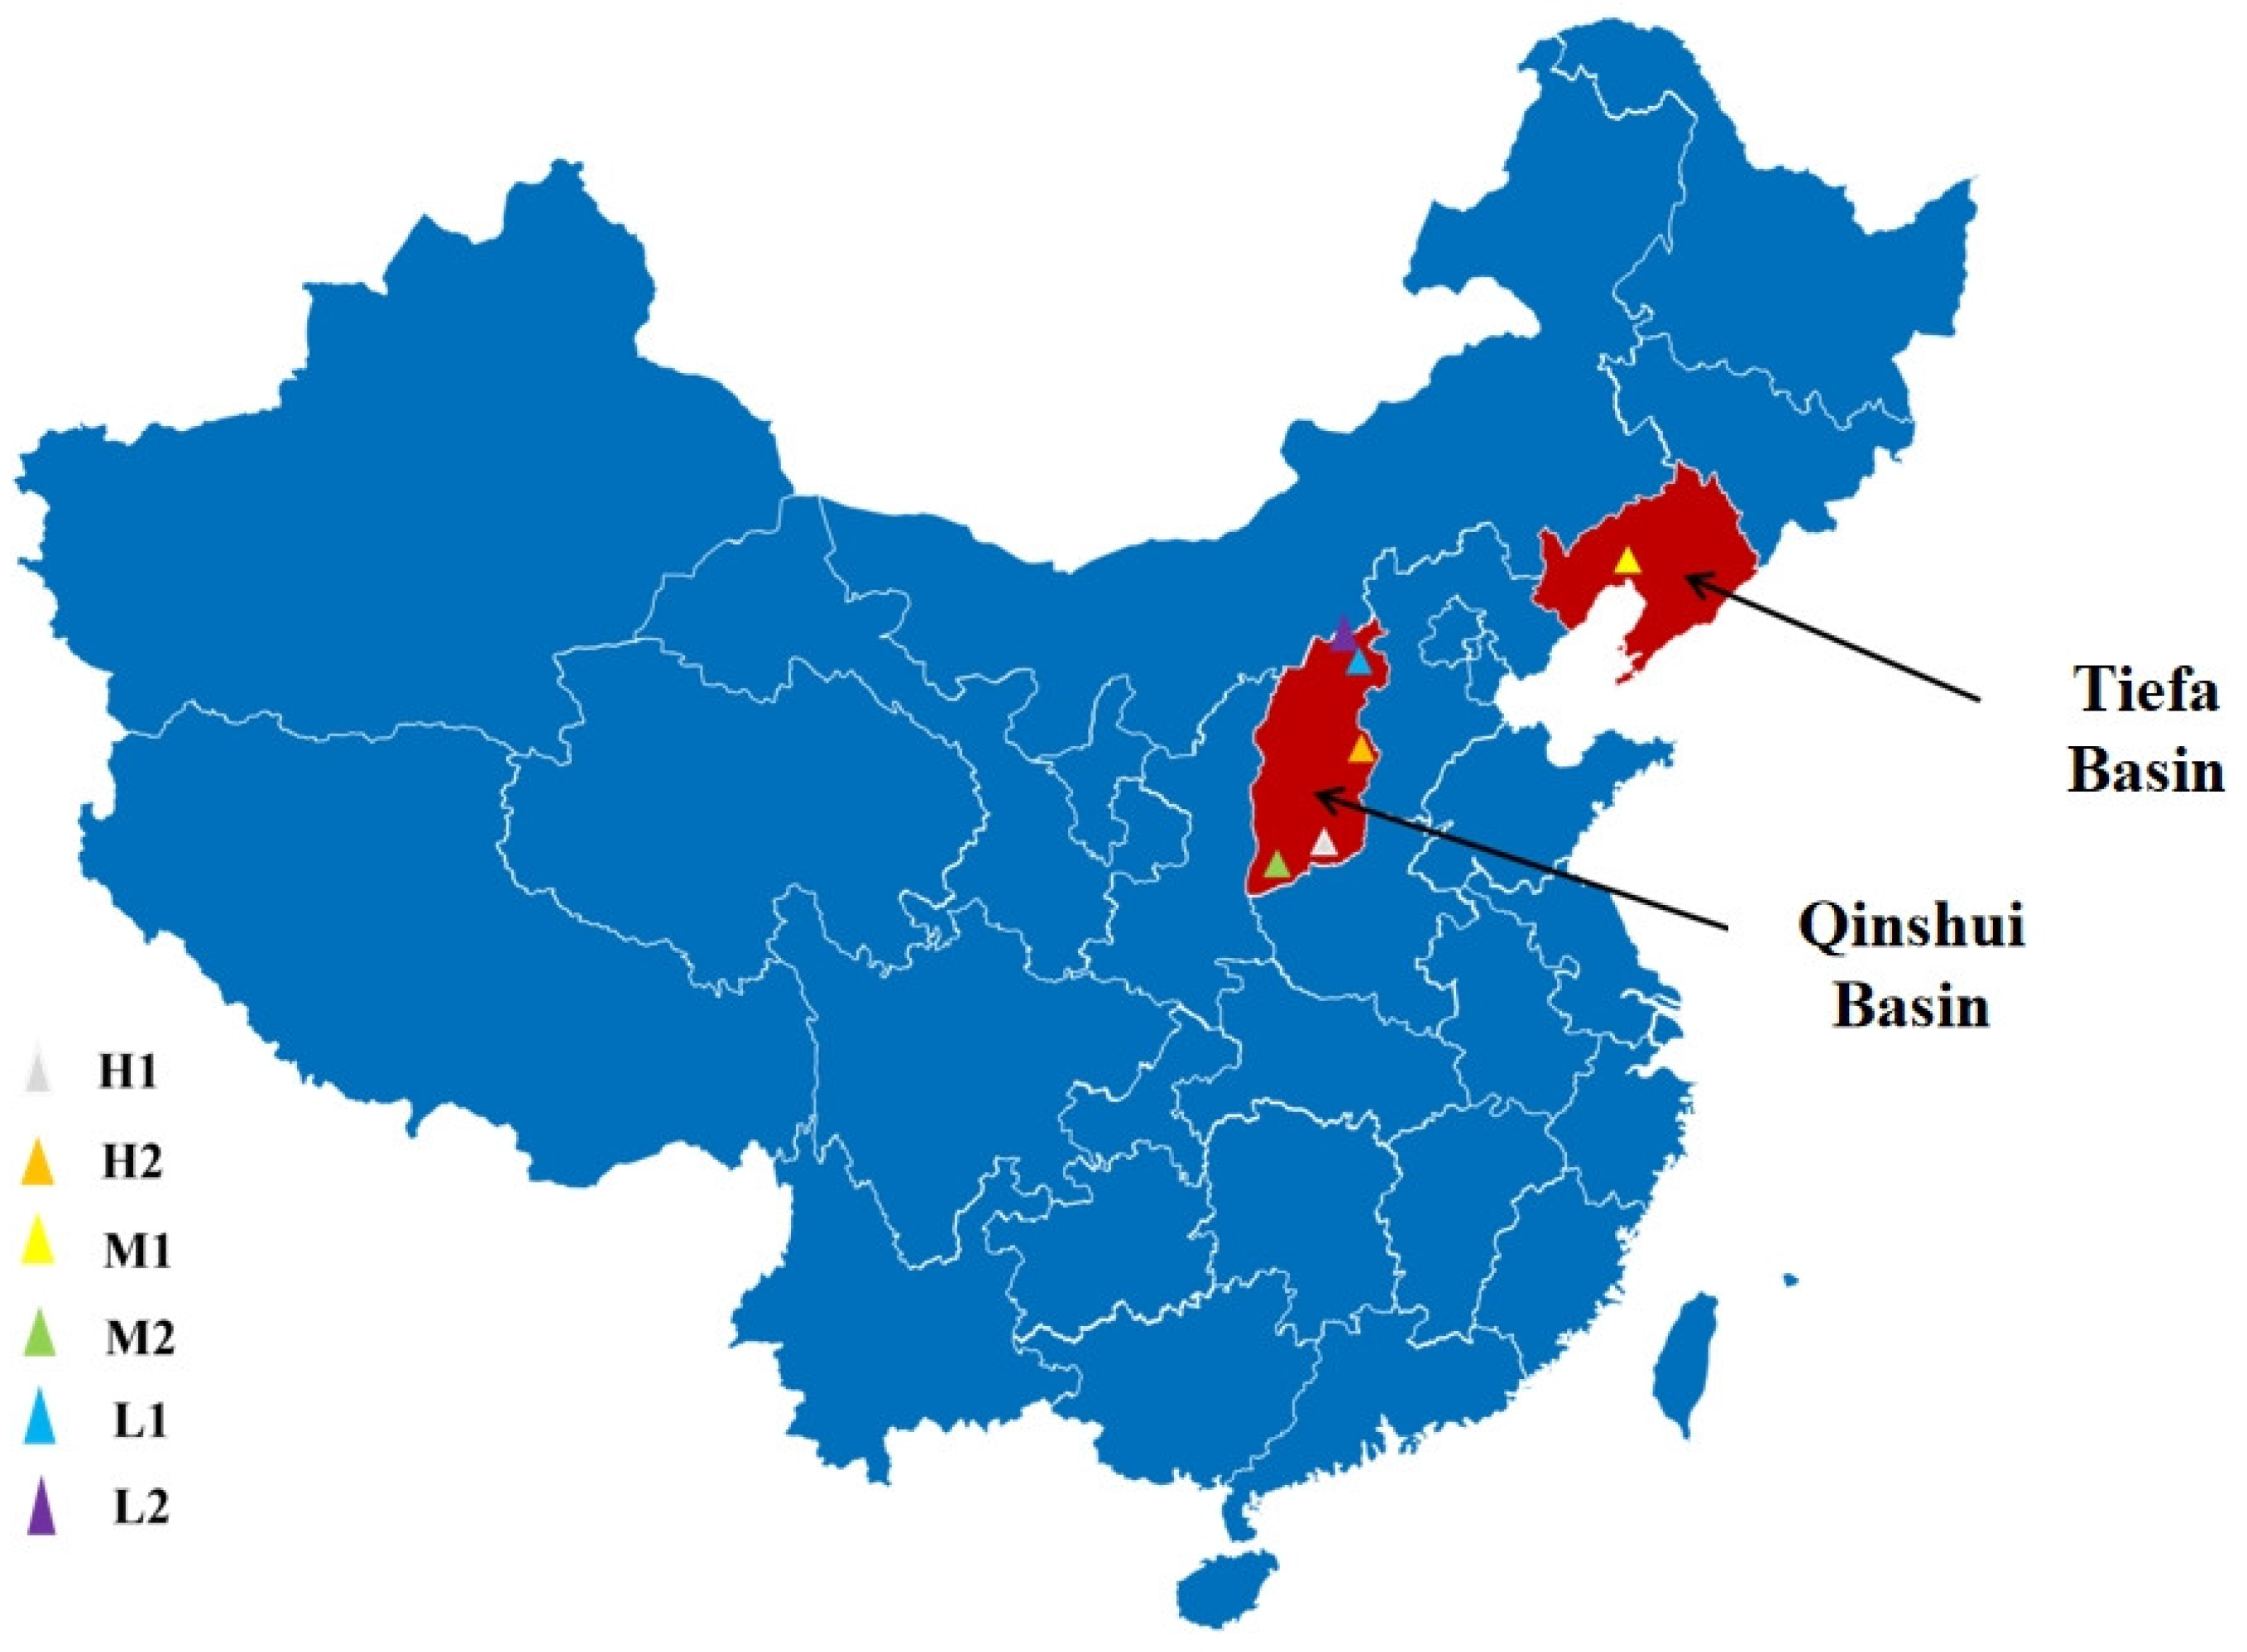
2.1. Sampling

The coal samples were collected from the Tiefa Basin (Liaoning Province, China) and the Qinshui Basin (Shanxi Province, China), where coal seams range in thickness from 1.5 to 3.2 m. The mineralogical composition includes quartz, calcite, clay minerals, and pyrite. Chemical analysis indicates trace amounts of sulfur (1.24–2.24%). These factors influence pore structure evolution and coalbed methane retention characteristics. Fresh coal specimens were extracted from the working face of the mine and transported to the laboratory following the Chinese national standard GB/T 23561.1-2009 [25]. Using a standard sieve, samples with a 1 to 3 mm particle size were selected, stored in a vacuum drying furnace at 45 °C, and dried for 8 h. Upon completion of the drying process, the samples were reduced to room temperature. A quantity of 500 g of each sample was weighed and stored in a sealed container. The coal was categorized according to the maximal vitrinite reflectance, and the samples were numbered according to their degree of metamorphism as H1, H2, M1, M2, L1, and L2. Figure 1 illustrates the sampling sites.
In accordance with the Chinese national standard GB/T 6948-2008 [26], the vitrinite reflectance (Ro, max, %) of the coal samples was evaluated utilizing a Leitz MPV-3 scanning microscope (Leica Microsystems, Wetzlar, Germany). The coal samples were analyzed for their industrial composition using a TGA 2000 automated industrial analyzer (LECO Corporation, St. Joseph, MI, USA) in accordance with the Chinese national standard GB/T 212-2008 [27]. An analysis of the microscopic content of the coal samples was conducted corresponding to the Chinese national standard GB/T 8899-2013 [28] using a Zeiss Axioskop 40A (Carl Zeiss Microscopy GmbH, Jena, Germany.) reflected polarized light microscope. In accordance with the Chinese national standard GB/T 29172-2012 [29], the coal samples were heated to a consistent weight at 105 °C prior to measurement for porosity and permeability tests. The specimens were enclosed in a Hassler core holder with a 200 psi confining pressure, and the permeability was measured using a CAT112 high-low permeability meter (Coretest Systems, Nashville, TX, USA). The permeability was measured through the core samples using high-purity nitrogen gas. Based on Boyle’s law, the porosity was measured using a PHI220 helium porosimeter (Heliumtech, Beijing, China). The experiments were conducted at a room temperature of approximately 25 °C to ensure consistency in sample preparation and measurement conditions. Table 1 illustrates the experimental coal samples’ coal petrology and pore-permeability characteristics.

2.2. CO2 Adsorption, N2 Adsorption/Desorption and MIP Measurements

Analyzing the geometry of the gas adsorption isotherms—which is subsequently integrated with suitable models—allows one to determine the surface characteristics and pore structure parameters of the adsorbent using the principle of gas adsorption (CO2/N2 adsorption). This technique is relevant for measuring micropores and mesopores with relatively small pore diameters. Specifically, CO2 adsorption experiments are frequently employed to ascertain micropores’ morphological characteristics and complexity. The ASAP 2460 surface area and porosity analyzer were used to conduct CO2 adsorption experiments following the GB/T 21650.3-2011 [30] standard. The experimental conditions were maintained at 273 K and pressures below 3039.75 Pa. This enables the measurement of pores within the 0.35–1.5 nanometer size range. The sample particle diameters were 0.20 to 0.25 mm, and the N2 adsorption experiment was conducted at a temperature of 77 K. The samples were desiccated prior to the experiment, and the gravimetric method was employed to calculate the adsorption amount at various pressures. The stepwise static method was employed to obtain the weight equilibrium values, which enabled the measurement of pores within the 2 to 100-nanometer size range. The Barrett–Joyner–Halenda (BJH) and Brunauer–Emmett–Teller (BET) models were applied to gas adsorption data obtained using an ASAP 2460 surface area analyzer (Micromeritics, Norcross, GA, USA).
MIP is a commonly used method for characterizing pore structures, capable of obtaining PSD curves, total pore volume/specific surface area, and throat radius, among other pore structure parameters. Before testing, samples were dried to a constant weight at 105 °C based on the Chinese national standard GB/T 29171-2012 [31] and GB/T 29172-2012 [29]. The MIP test was performed using the AutoPore IV 9505 porosimeter (Micromeritics Instrument Corporation, Norcross, GA, USA.), throughout a range of mercury intrusion pressures from 0.5 to 60,000 psia (corresponding to pore sizes of 3 nm to 365 μm).
Capillary pressure curves were generated by directly adjusting the mercury injection pressure, and these curves were subsequently transformed into pore distribution curves. Equation (1) illustrates the equation, as follows [19].
P c = 2 σ cos θ r
where Pc denotes the capillary pressure (MPa), θ indicates the contact angle (°), r stands for the pore radius (μm), and σ refers to the surface tension.
Each experiment, including CO2 adsorption, N2 adsorption, and MIP, was conducted in triplicate to ensure reproducibility and accuracy of the results.

2.3. Multifractal Theory

In contrast to the single exponent fractal model, the multifractal model provides an additional comprehensive representation of rock pore properties, enabling a more precise evaluation of reservoir storage capacity [32,33,34]. In this part, the box-counting technique was used to analyze the multifractal features that define the distribution of full-size pores. The distribution of pore dimensions is analyzed as the dataset length H. Using a scale ε, the dataset H is partitioned into N(ε) segments, where N(ε) is the total number of units. The value of H is calculated using interpolation, where the number of packages, denoted as N(ε) = 2k, is equivalent to the dimension of any box, ε = 2-kH, provided that k = 0, 1, 2, …
A probability density distribution Pi(ε) is derived for the ith box in a heterogeneously porous material at a constant size ε [35].
P i ε = v i ε i = 1 N ε v i ε
The cumulative porosity or pore volume of the ith box is denoted by vi(ε), where i is a positive integer.
In multifractal analysis, the probability distribution Pi(ε) is linked to the scale ε and can be expressed as follows [35]:
P i ε ε α i
The singularity strength of the ith partition set is represented by αi.
Therefore, different partition sets may have the same α. The set of partitions Nα(ε) that share the same α is linked to the ε and can be expressed as follows [35]:
N α ε ε f α
The multifractal spectrum or singular spectrum, denoted by f(α), represents the fractal dimension computed for sets of identical α values.
Defining the partition function is essential for precisely determining multifractal distributional properties [36]:
X q , ε = i = 1 N ε P i ε q ε τ q
The matrix q covers a value range from −∞ to +∞, while τ(q) represents the mass function and is given by the following equation [36]:
τ q = lim ε 0 lg X q , ε lg ε = lim ε 0 lg i = 1 N ε P i ε q lg ε
The following equation defines the generalized fractal dimension D(q) [36]:
D q = τ q q 1 = 1 q 1 lg i = 1 N ε P i ε q lg ε , q 1 i = 1 N ε P i ε lg P i ε lg ε , q = 1
Both α(q) and f(α) can be derived from the Legendre transform, with the corresponding formulas, as follows [36]:
α q = d τ q d q
f α = q α q τ q
The spectral width Δα is characterized as follows [24]:
Δ α = α m a x α m i n
Integrating the multifractal theory with the NMR T2 spectrum, the q range is selected as (−10, 10) with a step size of 1.

3. Results

3.1. Coal Characteristics

The key physical properties of various coal ranks is shown in Table 1. The analyzed samples exhibited a maximum vitrinite reflectance (Ro,max) within the range of 0.51 to 3.28, with porosity varying between 1.58% and 25.95%, and permeability spanning 0.76 to 4.61 mD. Low-rank coals demonstrated considerably higher porosity and permeability in comparison to middle- and high-rank coals. Moisture content (Mad) in the samples was observed between 0.80% and 4.24%, while ash content (Aad) ranged from 3.44% to 19.25%, with L2 coal showing an Aad value below 5%. The volatile matter (VMad) content varied from 5.41% to 36.22%, and the fixed carbon (FCad) content within the range of 40.29% to 87.09%. The vitrinite content in the samples was recorded between 39.4% and 81.2%. Additionally, minor quantities of inertinite, exinite, and minerals were identified, with inertinite content ranging from 12.3% to 50.6%, exinite from 1.8% to 8.9%, and mineral content between 2.1% and 4.6%. The identified minerals include quartz, calcite, clay minerals, and pyrite, while the sulfur content of the coal samples ranged from 1.24% to 2.24%, with no other metallic elements detected.

3.2. Pores Structure Property Identified by CO2 Adsorption

The CO2 adsorption curves of the experimental coal samples are depicted in Figure 2a. Analysis shows statistically significant variations in the ability of different coal ranks to adsorb CO2 as the relative pressure rises. High-rank coal H1 exhibits a much greater adsorption capacity than low-rank coal L1 and medium-rank coal M1. This suggests that the micropore structure of high-rank coal is more advanced, leading to a larger specific surface area. Conversely, the medium-rank coal M1 has the lowest adsorption capacity, indicating that its micropore structure is rather less extensively formed.
The CO2 adsorption data were examined using the DFT model to identify the micropore volume and specific surface area distribution, as depicted in Figure 2b,c. High-rank coal H1 has a distribution of pore volume growth throughout a broader range of pore sizes, with a significant rise, especially in the pore size region of 0.4 to 0.6 nm, reaching its peak at around 0.6 nm. Conversely, the pore volume of samples L1 and M1 exhibit milder increases, reaching their highest point at a pore size of 0.55 nm. As pore volume increases, so does the profile of specific surface area. Sample H1 substantially increases specific surface area throughout the micropore size range. Still, samples L1 and M1 have comparatively lesser increases, with peak positions close to those of the pore volume increases.

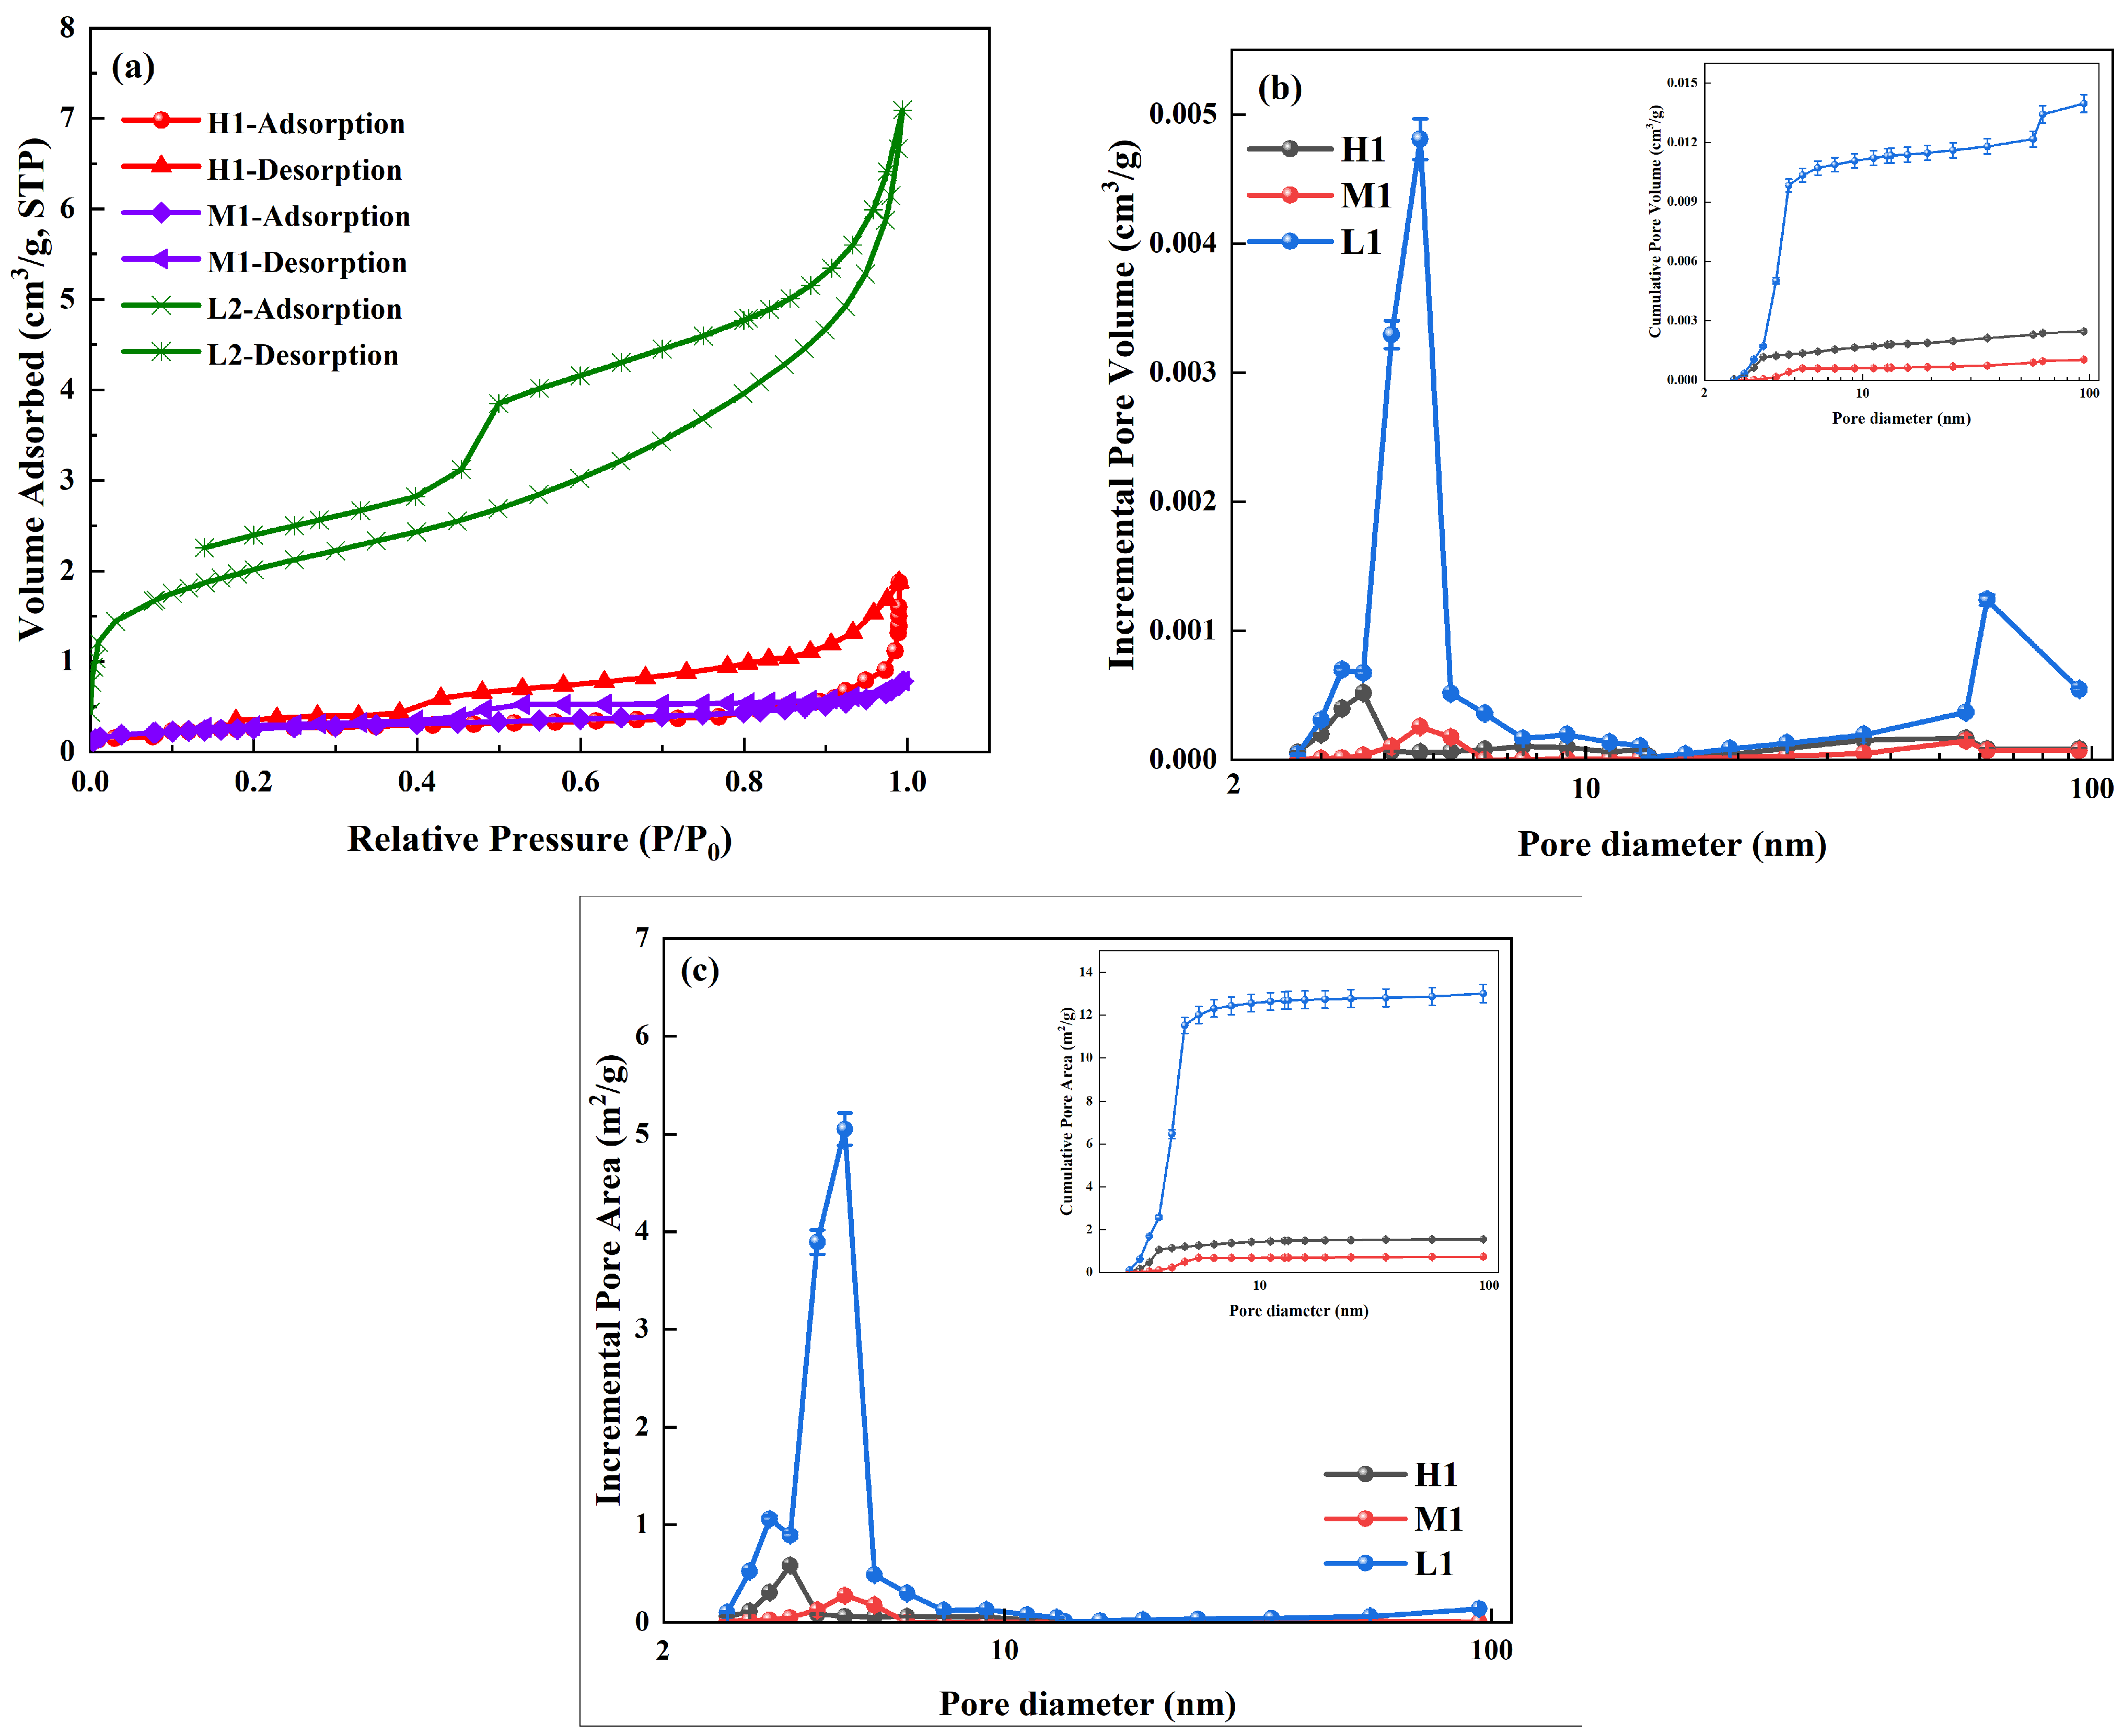
3.3. Pores Structure Property Identified by N2 Adsorption

Figure 3a illustrates the N2 adsorption/desorption curves for the coal samples that were used in the experiment. They fall into two separate groups according to the IUPAC system [5]. Type I coal sample L1 has well-formed ink-bottle-shaped pores, as seen by its strong hysteresis loop in the relative pressure ranging from 0.4–1 MPa. On the other hand, Type II coal samples are M1 and H1. At relative pressures under 0.8, the adsorption curves show a slight increase, and they then show a significant rising trend as the relative pressure gets closer to 1. The pore shape is clearly plate-like, as demonstrated by comparing the desorption and adsorption curves.
The N2 adsorption data were analyzed using the BJH and BET models to estimate the PSDs of mesopores, as depicted in Figure 3b,c. The tested coal samples typically exhibit a mesopore distribution that is predominantly focused between 2 nm and 6 nm. Within the group, low-rank coal L1 displays the most notable rise in pore volume, with the most remarkable growth observed at a pore size of 3 nm. Additionally, some pores exist throughout the range of 50–100 nm. Porosity increases for M1 and H1 samples are somewhat smaller. The distribution of the increase in specific surface area is comparable to the increase in pore volume. L1 coal substantially increases specific surface area between 2 nm and 6 nm. M1 coal and H1 coal have modestly smaller increases, with peak locations similar to pore volume increments.

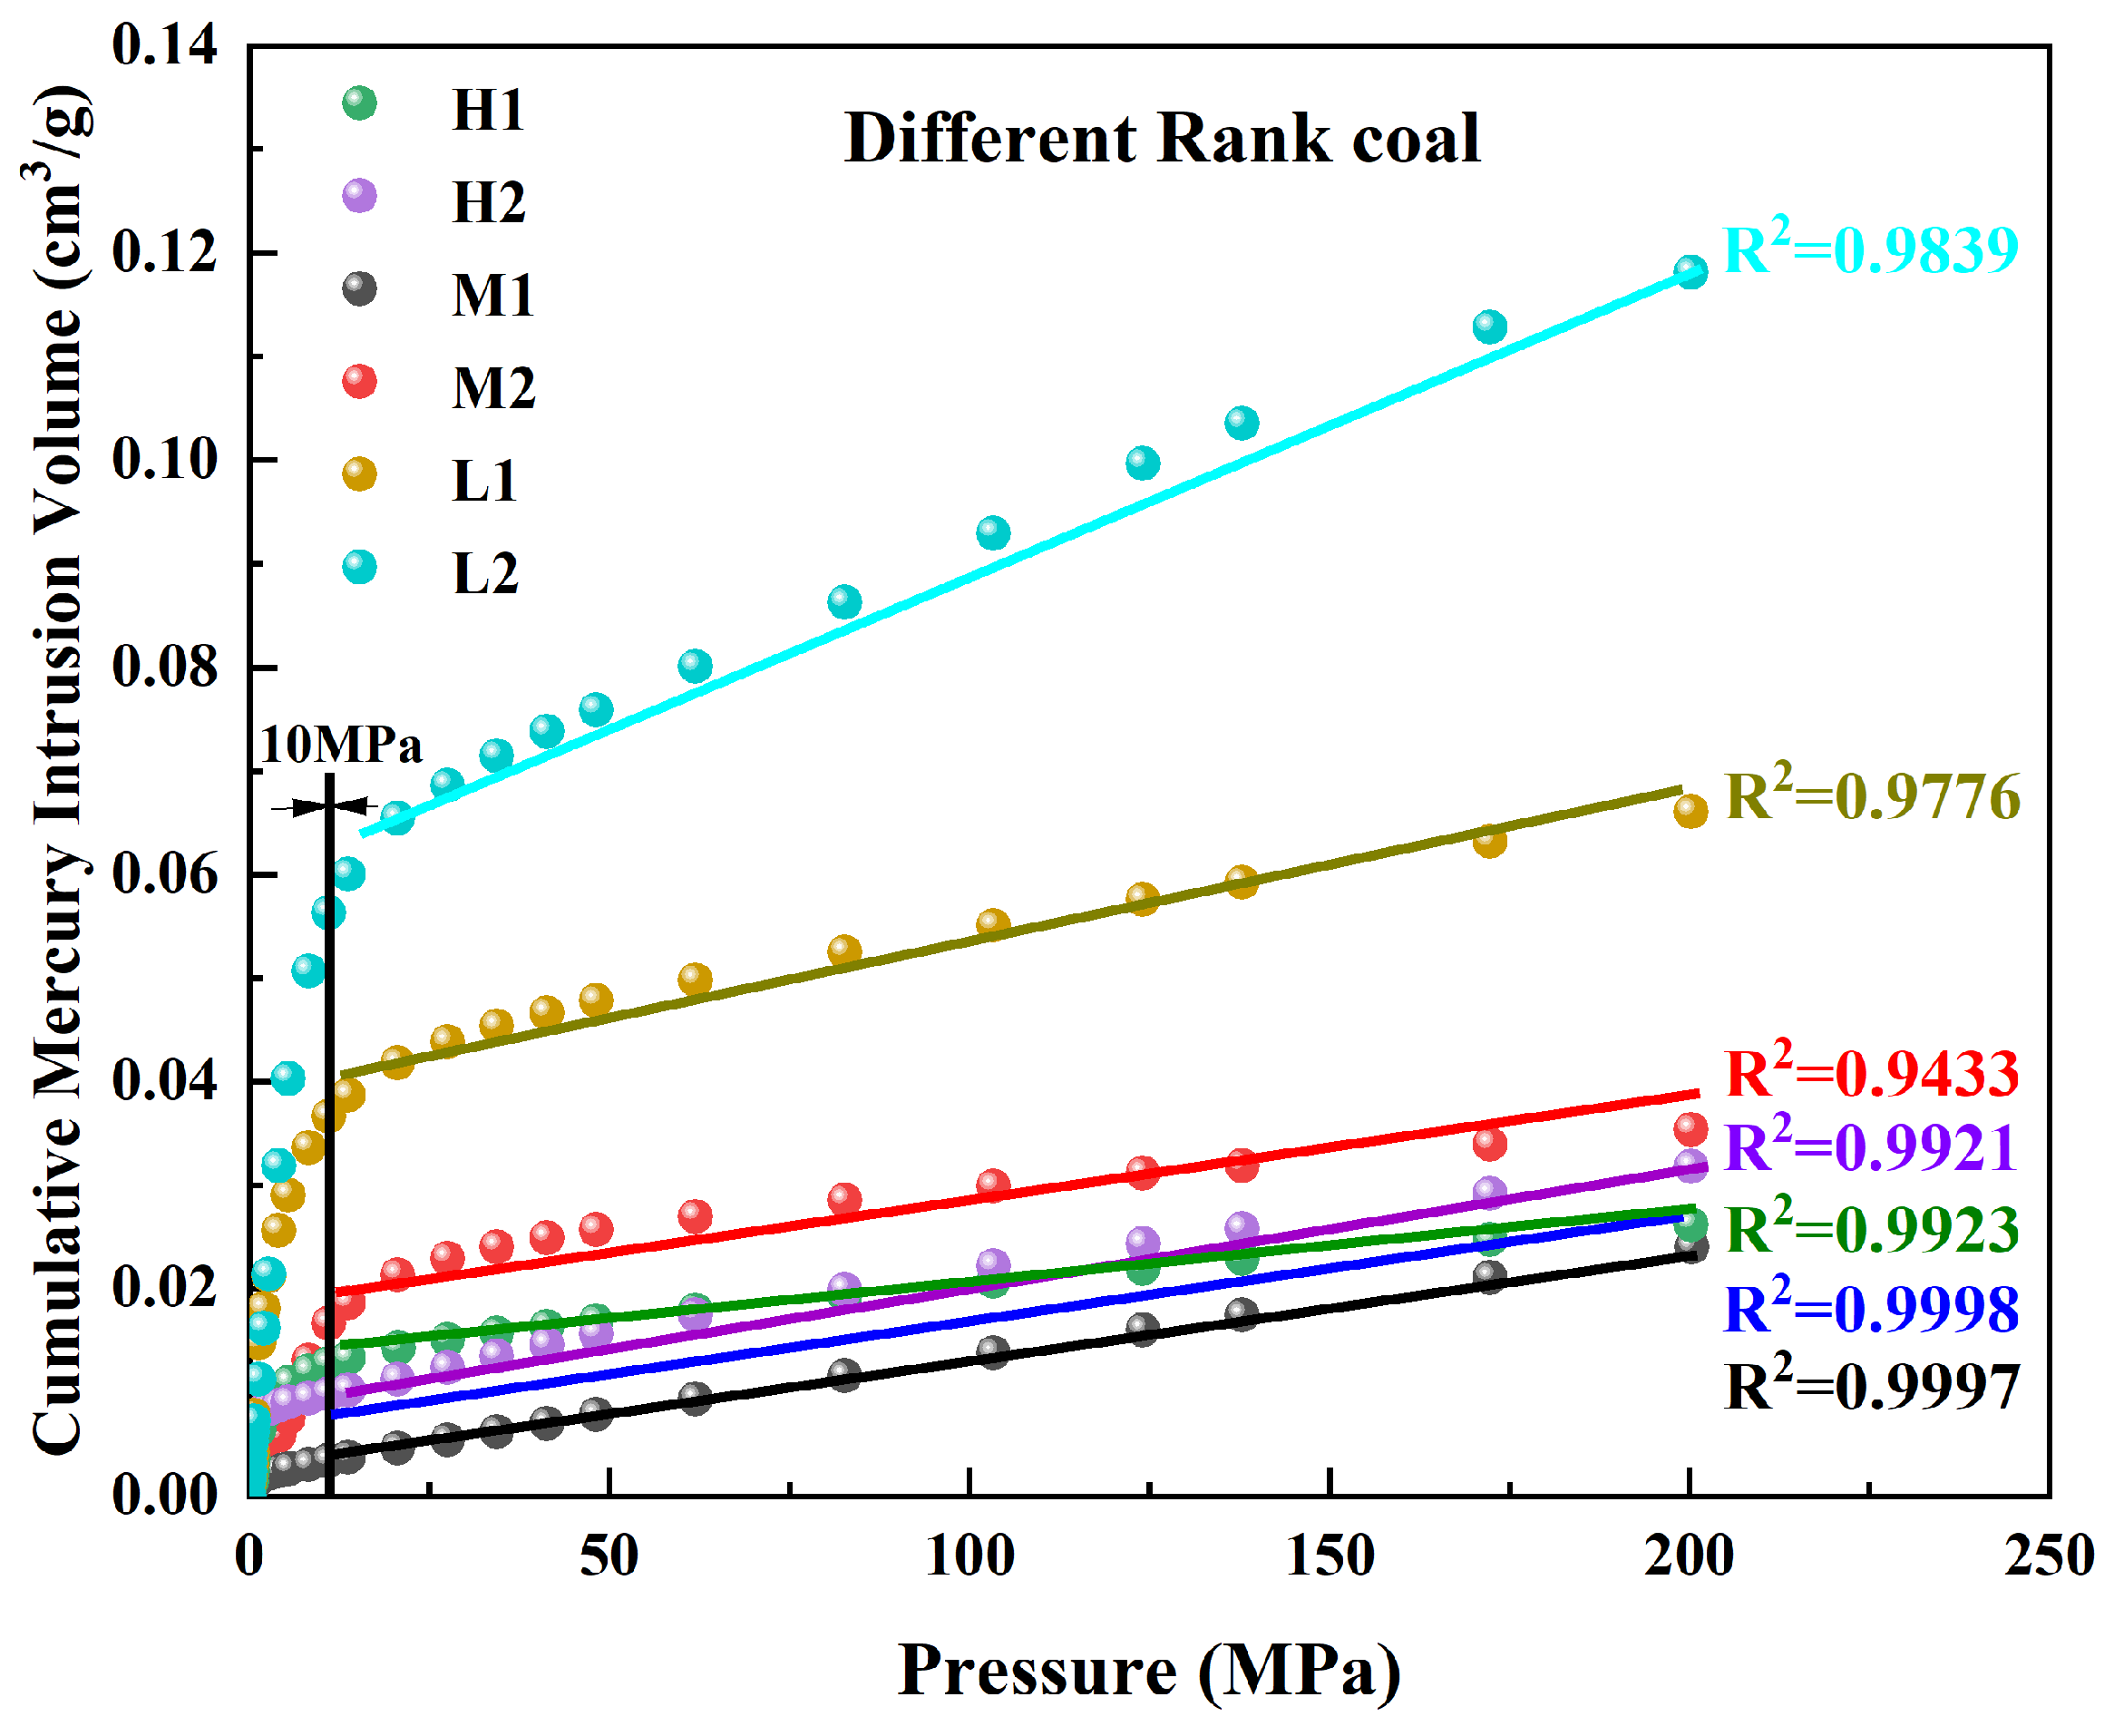
3.4. Pore Structure Properties Identified by MIP

Mercury intrusion/extrusion curves derived from the MIP experiment are depicted in Figure 4a and can be classified into two distinct categories. Coal sample L1 is classified as the first kind, which is distinguished by a significant hysteresis loop. This observed pattern suggests the presence of well-developed cracks and macropores in the low-rank coal. Conversely, coal samples M1 and H1 are classified as the second category, characterized by reduced incursion volumes, indicating a significant lack of connectivity between macropores and micropores.
Figure 4b,c illustrate the PSD of mesopore and macropore acquired from the MIP experiment. The L1 coal exhibits a tremendous increase in pore volume throughout the entire range of pore sizes, with two distinct peaks observed at pore measurements of 5 nm and 100 nm. The increment in the cumulative pore volume of sample L1 is much greater than that of samples M1 and H1, implying that the pore structure of sample L1 is the most advanced and possesses the highest level of interconnection. Conversely, the increases in pore volume for sample M1 and sample H1 are comparatively lower, chiefly focused in the range from 2 to 10 nm. Within the 2–10 nm range, micropores and mesopores account for most of the specific surface area increase. At a pore size of about 4 nm, the specific surface area of all the coal samples studied increased significantly.

4. Discussion

4.1. Estimation of Compression Coefficient for Coal Matrix

Prior studies have demonstrated that when the mercury intrusion pressure exceeds 10 MPa, the coal matrix becomes compressed, and the pore structure is damaged, which can invalidate the accuracy of the PSD data collected through MIP tests [16,37]. At pressures exceeding 10 MPa, the overall volume and pressure observed in this study exhibit a strong linear correlation, illustrated in Figure 5. The results indicate that the coal matrix demonstrates compressibility when subjected to a pressure of 10 MPa. By excluding the influence of mercury on compression, the compression factor ( k c ) of the coal matrix may be mathematically represented as follows:
k c = d V c V c d P
In the equation, k c is the compression factor, d V c is the volume change under the comparable pressure increase d P , and V c is the volume of the coal matrix, defined as the following:
V c = 1 ρ V B
where ρ is the true density of the coal, g/cm3; V B is the coal pore volume obtained from the N2 experiment, cm3/g.
During MIP measurement, the abundance of mesopores and micropores in the coal prevents accurate penetration of some pores by mercury, even under the most intense pressure. Thus, V c includes some unfilled pores. Consequently, the volume change measured by MIP typically consists of both the pore-filling volume ( V P ) and the percentage change resulting from the compaction of the coal matrix ( V c ), expressed as follows:
V o b s = V P + V c
This can be further transformed into the following:
V o b s P = V P P + V c P
This study covers a high-pressure range (P > 10 MPa) starting from 10 MPa and extending to 200 MPa, corresponding to pore radii with ranges of 6~135 nm. The total pore volume for this range of pore sizes can be derived from the N2 data. A linear regression analysis was conducted on the volume and pressure inside the high-pressure region. The R2 values obtained were about 1, suggesting a robust linear correlation in the variation curve. Hence, V o b s / P can be considered a constant β, calculated from the linear regression of mercury intrusion volume and pressure.
Since V o b s / P is an average value over a certain pressure range and independent of pressure changes during mercury intrusion, β can be used in place of d V o b s / d P [38,39].
d V c d P = V c P = V o b s P V P P = β 6 n m 135 n m V P P
Thus, the compression factor k c can be obtained utilizing the equation, with values listed in the table. The coal matrix compression factor ranges from 0.78 × 10⁻¹⁰~3.56 × 10⁻³ m2/N, which aligns with prior research findings.
As indicated in Table 2, the coal matrix’s mean compression factors for low, medium, and high-rank coals are 2.84 × 10⁻¹⁰ m2/N, 1.25 × 10⁻¹⁰ m2/N, and 1.17 × 10⁻¹⁰ m2/N, respectively. Among them, low-rank coal has the greatest compressibility. The compression of the coal matrix arises from alterations in the microscopic constituents and spatial arrangement during coalification and is influenced by several parameters, such as the extent of coalification, microscopic composition, the presence of trace metals, and pore structure. By modifying the mechanical characteristics of coal, the coalification process affects the development of coal matrix compressibility as coal rank increases. Low-rank coal is characterized by a greater concentration of tiny functional groups, which renders it more responsive to pressure. Therefore, coal compression causes a change in the pore volume. The increased moisture content in low-rank coal weakens the bonds between molecular particles, resulting in the highest compressibility in low-rank coal. As the level of metamorphism intensifies, phenomena such as compaction, dehydration, and degassing during coalification augment the coal’s density, yielding heightened strength and resistance to deformation. Consequently, this leads to reduced compressibility in high-rank coal. Moreover, Fe- and Mn-bearing minerals, such as pyrite and siderite, contribute to the mechanical strength of the coal matrix. Their presence may reduce compressibility by reinforcing the coal structure.

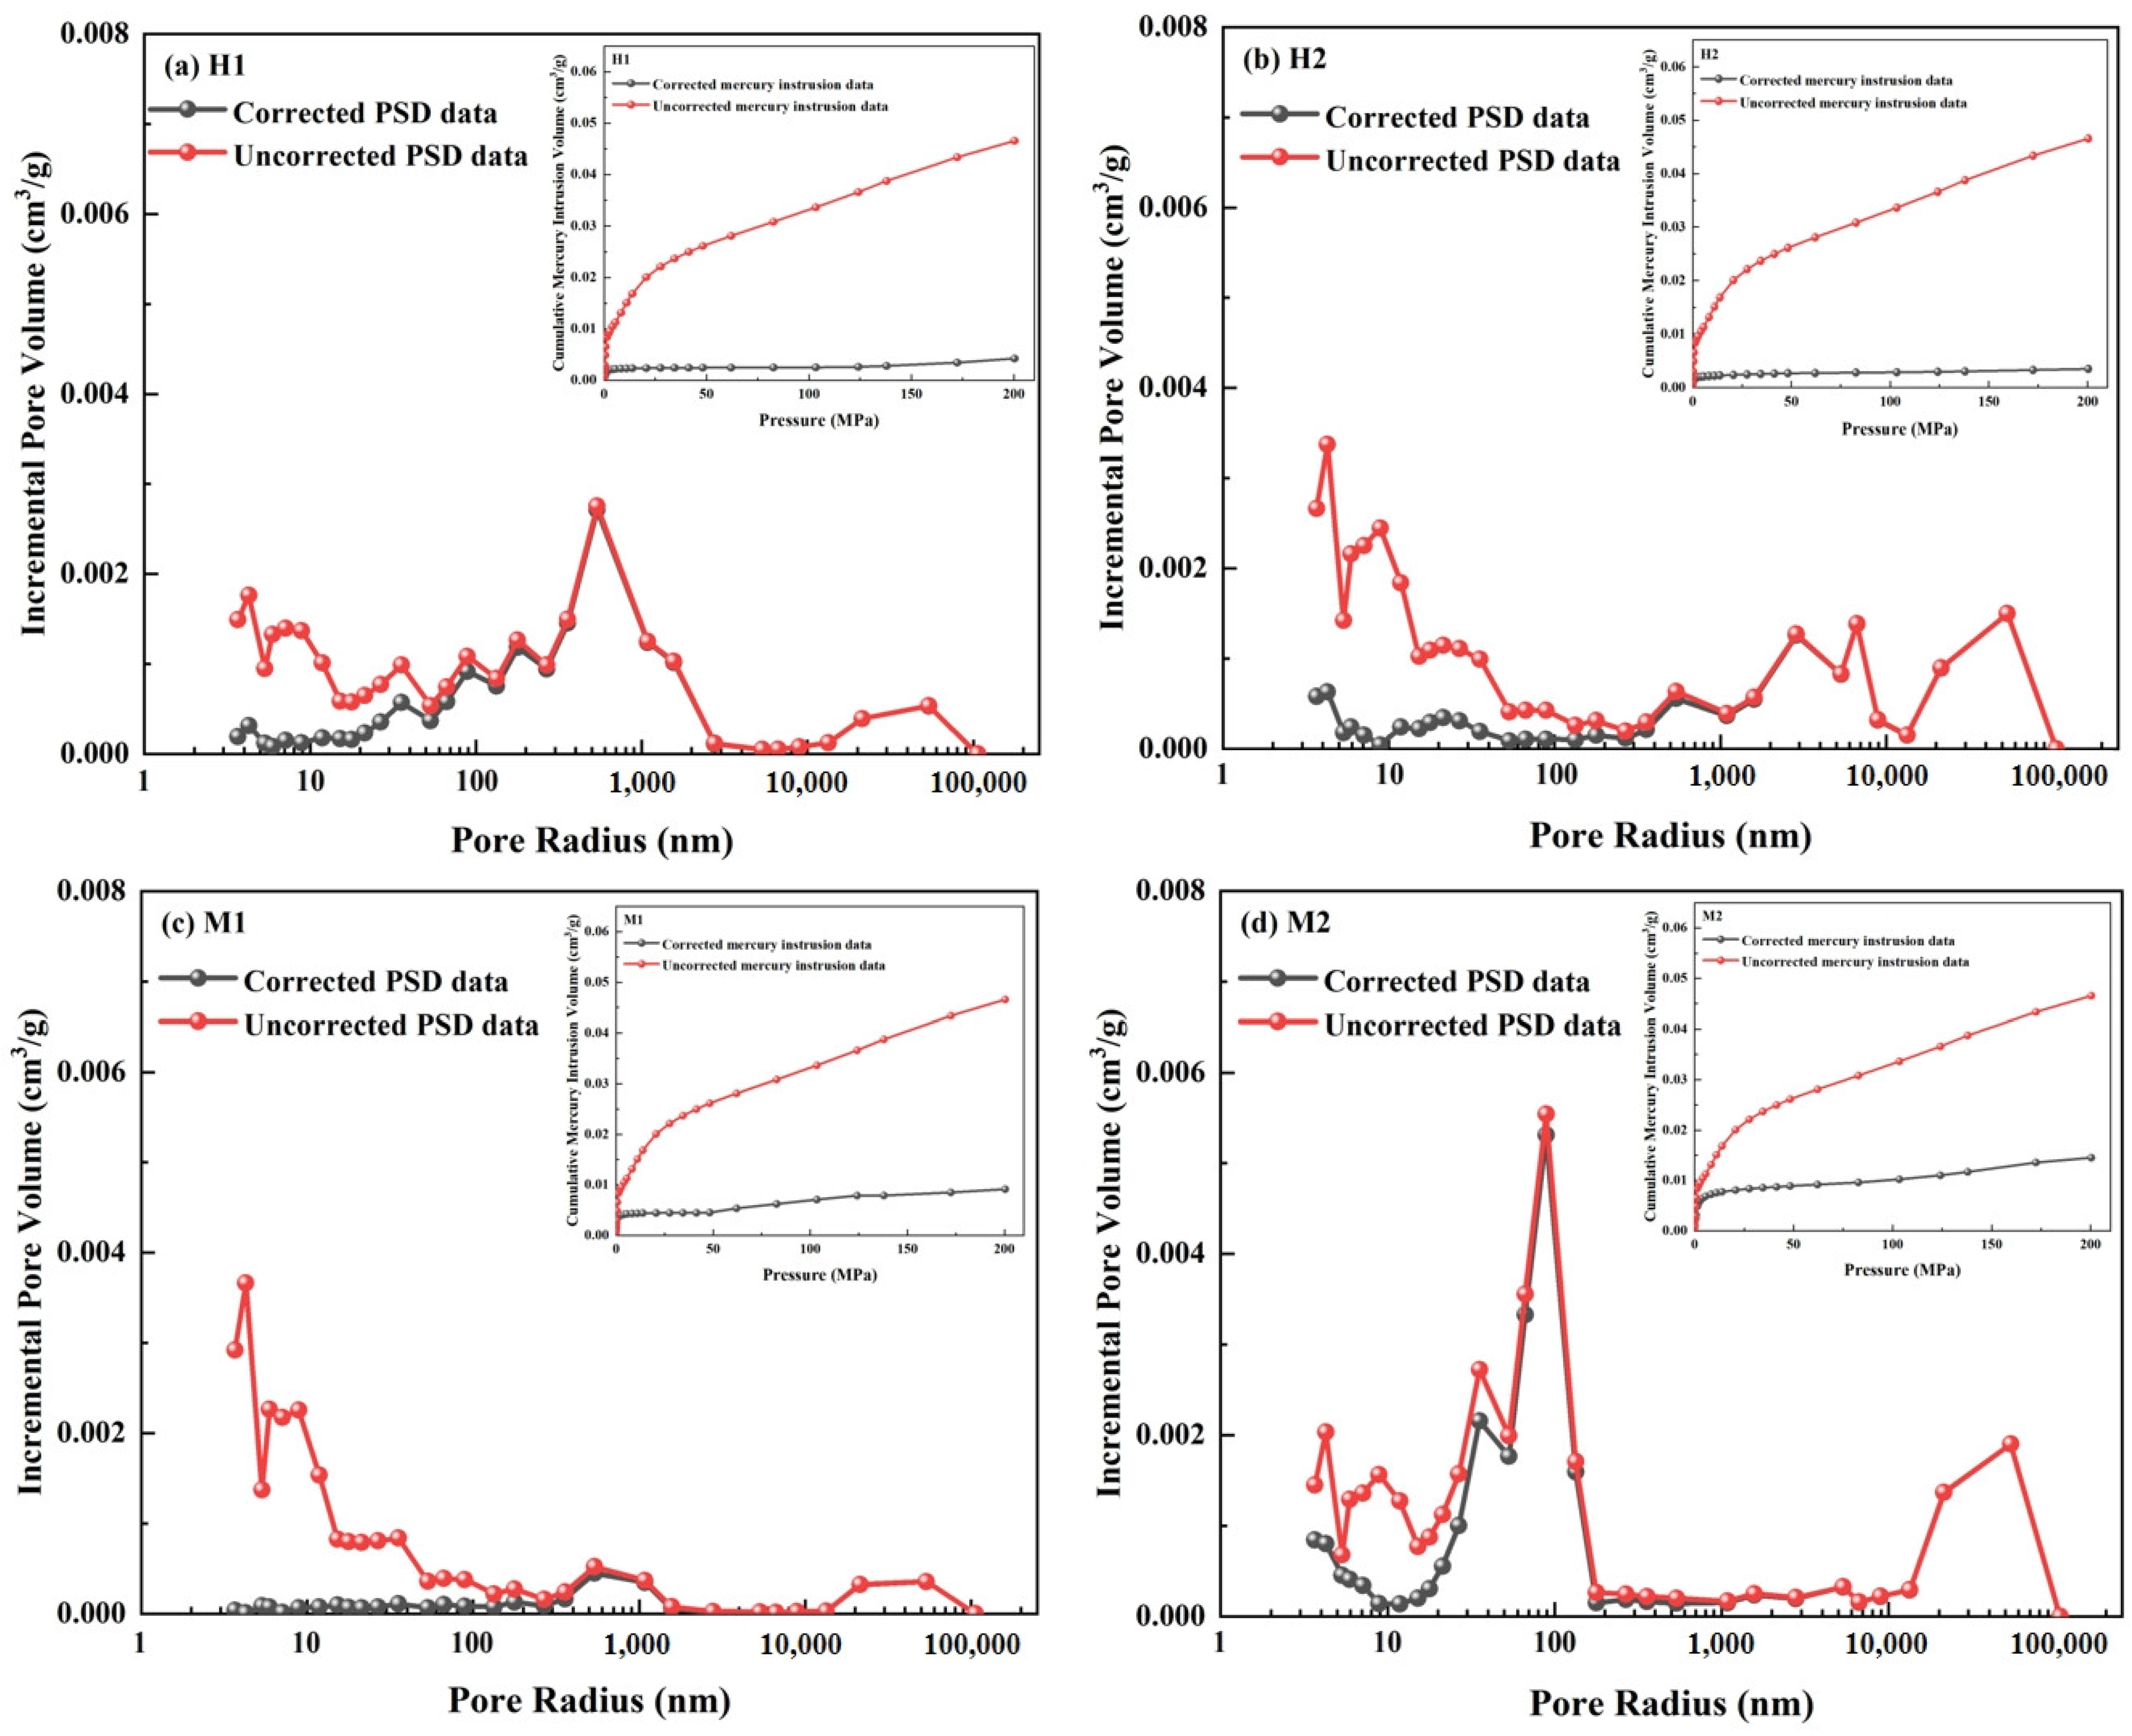
4.2. Correction of MIP PSDs

Prior research indicates that the original pore size distribution curve from MIP can be corrected by combining it with N2 data. As mentioned in Section 4.1, the compression of the coal matrix starts when the pressure reaches 10 MPa. Therefore, this work’s pressure spectrum for MIP data correction is from 10 to 200 MPa. The corrected pore volume in the high-pressure range can be expressed as follows:
V p i = V o b s ( P i ) V o b s P 0 k c V c P i ( P i P 0 )
where V p i , V o b s ( P i ) , and V m ( P i ) represent the variations in pore volume, mercury intrusion volume, and matrix compression volume, respectively, as the pressure rises from P 0 to P i ; V o b s ( P i ) is the measured volume at pressure P i ; V c P i is the volume of the coal matrix at pressure P i , defined as follows:
V c P i = V c V P P ( P i P 0 )
Combining Equations (16) and (17) allows for derivation of the adjusted mercury intrusion volume and PSD curves for the coal samples. Figure 6 compares the percentage increases in pore size and volume before and after rectification. Analysis reveals that the compression and deformation of the coal matrix have a substantial impact on the mesopores, although the alterations in macropores before and after rectification are relatively insignificant. Following correction, mesopore volume decreases by a value between 59.85% and 96.31%, whereas macropore volume decreases by a value between 3.11% and 15.53%. Compared to the uncorrected volume, when the mercury intrusion pressure exceeds 10 MPa, the coal matrix undergoes compression, significantly reducing the intruded mercury volume and affecting the accuracy of pore structure measurements. This indicates that the compression and deformation of the coal matrix significantly impact the characterization of the pore size distribution (PSD) obtained from MIP [22,24]. Subsequently, the adjusted PSDs obtained from MIP measurements will be integrated with CO2 and N2 adsorption data to investigate the variability of coal by applying multifractal theory [22,24].

4.3. Full-Size Pore Structure Analysis

Porosity in coal extends throughout various sizes, encompassing a broad range from micropores to macropores. Implementing a solitary testing technique, such as MIP or gas adsorption, only enables the examination of pore sizes within a defined range, posing challenges in accurately describing the full pore structure across all size ranges in coal. The comprehensive characterization of the pore structure across the full pore size range in coal can be accomplished by combining MIP, low-temperature N2 adsorption, and CO2 adsorption techniques. From the standpoint of testing principles and computational models, each approach possesses distinct advantages within specific pore size ranges, therefore facilitating precise definition of the pore structure within those boundaries. As previously indicated, CO2 gas is well-suited for examining micropores and can precisely quantify the dispersion of micropores smaller than 2 nm. High precision is achieved by the low-temperature N2 adsorption technique for mesopores ranging from 2 to 50 nm. The MIP technique can theoretically examine pores ranging from 3.5 to 106 nm, encompassing both mesopores and macropores. Nevertheless, suppose that the mercury intrusion pressure surpasses 10 MPa (corresponding to a pore size of around 140 nm), and the compressibility of coal is exceeded. In that case, compression deformation of the coal matrix and pore damage might result, hence introducing anomalies. Thus, this section statistically analyzes the PSD of coal samples across the full pore size range using the corrected mercury intrusion data and the CO2 and N2 adsorption method characterization results. Connections were established at 2 nm and 50 nm units. Full-size PSD curves are displayed in Table 3 and Figure 7.
Substantial variations are observed in the pore volume distribution of the experimental coal samples. The pore volume of sample L1 is predominantly concentrated in the macropore range, with modest dispersion in both the micropore and mesopore phases. By contrast, the majority of the pore volume in samples M1 and H1 is found at the micropore stage. As the pore size rises, the distribution density function of pore volume typically exhibits a sequential pattern of “increase-then-decrease”. A substantial increase in pore volume occurs within the 0.3–1 nm region, with a peak at approximately 0.6 nm. Beyond this threshold, the density function for pore volume distribution steadily declines, exhibiting certain local variations. Samples M1 and H1 have fewer mesopores and a particular pore volume distribution within the macropore range. As shown in Table 3, the pore volume in sample L1 is predominantly attributed to macropores. In contrast, the pore volume in samples M1 and H1 is mostly dispersed throughout the micropore stage. The coal samples have a characteristic surface area distribution that initially rises and then declines with increasing pore size. This distribution peaks at around 0.6 nm, after which the rate of increase gradually halts. Based on Table 3, the primary source of specific surface area in the experimental coal samples is micropores, encompassing over 90% of the overall specific surface area. Mesopores follow closely behind, while macropores make the most negligible contribution.
The pore volume distribution varies significantly across coal samples due to differences in coal rank, petrographic composition, and volatile content. Low-rank coals (L1, L2) exhibit dominant macroporosity, whereas middle- and high-rank coals (M1, M2, H1, H2) primarily consist of micropores. Vitrinite-rich samples demonstrate a higher micropore proportion, contributing to increased gas adsorption potential. In contrast, samples with high inertinite content display a more heterogeneous pore structure. These variations highlight the complex nature of coal pore networks and their implications for fluid transport properties.

4.4. Multifractal Features of the Corrected PSDs

Figure 8a displays the double logarithmic correlation between X (q, ε) and ε for the representative specimen L1. The clear linearity between log X (q, ε) and log (ε) indicates that the porous structure across the full pore size range of this sample possesses multifractal properties. Figure 8b depicts the association between τ(q) and q; as shown, when q < 0, τ(q) shows a marked upward trend as q increases. For q > 0, the increase is more gradual. The variation of τ(q) is much weaker for q < 0 compared to q > 0. Figure 8c depicts the relationship of the matrix q and the generalized dimension D(q). Within the range of −10 to 10, Dmin denotes the generalized dimension at the lowest q, whereas Dmax represents it at the highest q. D0 corresponds to the capacity dimension, D1 to the information dimension, and D2 to the correlation dimension [40]. The examination of the data in Table 4 indicates a persistent pattern across the coal specimens, with D0 > D1 > D2, confirming that all samples exhibit multifractal characteristics.
The generalized dimension spectrum centers around q = 0, with Dmin-D0 indicating the left branch’s breadth and D0-Dmax reflecting the right branch’s breadth. Dmin and Dmin-D0 provide a more profound assessment evaluation of porous structure in the low-probability zone, typically associated with macropore heterogeneity. Conversely, Dmax and D0-Dmax provide a detailed assessment of porous structure in the high-probability zone, frequently associated with micropore heterogeneity. Table 4 demonstrates that the ratios of Dmin-D0 for each sample exceed those of D0-Dmax values, indicating a more pronounced dominance of macropore heterogeneity over micropore heterogeneity in the specimens. The generalized fractal dimensions Dq exhibit an inverse S-curve. With q < 0, Dq rapidly reduces as q rises, while with q > 0, Dq diminishes more gently as q rises.
The particular variables that define the multifractal catastrophe spectrum for every coal sample can be obtained from Table 4. Figure 8d demonstrates the correlation among singularity strength α and the multifractal spectrum f(α). The spectrum of multifractals exhibits a characteristic concave parabolic form. On the leftmost side of the parabola, f(α) grows with rising α(q), while on the right side, f(α) decreases as α(q) increases. The singularity strength range (Δα) ranges between 2.397 and 3.218 (Table 4), highlighting the diversity and heterogeneity of the adjusted PSDs. The Hurst (H) index [41], a measure of pore connectivity, typically ranges from 0.5 to 1.0, where greater values indicate superior connectivity. Table 4 demonstrates that sample L1 has the highest H index, followed by sample L2, with sample M1 having the lowest H index. This indicates that low-rank coal exhibits the best connectivity while medium-rank coal is weakest. These results align with the findings from the MIP experiments.

4.5. Petrophysical Characteristics and Multifractal Parameters

Figure 9 presents the correlation matrix between the coal petrological properties of the experimental coal samples (such as Ro,max, Aad, Mad, etc.) and the multifractal parameters (Dmin-D0, D0-Dmax, Δα, H). The figure illustrates that the squares’ dimensions and color correspond to the correlation coefficients’ amount and direction. A positive correlation is indicated by red, while a negative correlation is indicated by blue. A correlation coefficient of higher magnitude suggests a more robust association between the two variables.
The analysis results show that as the level of coalification rises (i.e., as Ro,max values increase), the multifractal parameters Dmin-D0, D0-Dmax, Δα, and H exhibit a significant negative correlation. This suggests that high-rank coal samples have a more uniform pore structure, with reduced heterogeneity and weakened pore connectivity. This is due to the higher temperatures and pressures experienced during the coalification process of high-rank coal, leading to the compaction or transformation of micropores and mesopores into macropores. This simplifies the intricacy of the pore topology and results in a more closed pore network with lower connectivity. Coal samples with higher Mad and VMad show significant pore heterogeneity, with moisture and volatile content positively correlated with Dmin-D0, Δα, and H. This is because moisture and volatiles enhance gas adsorption and desorption behaviors across different scales within the pores, making the pore structure more complex. Additionally, the uniform water distribution and volatiles within the coal samples help form a more interconnected pore network, thereby improving pore connectivity. An important inverse relationship exists between mineral concentration and Dmin-D0, Δα, and H, indicating that minerals’ filling and cementation effects tend to homogenize the pore structure, decreasing the complexity. However, the presence of minerals, through multiple mechanisms such as physical blockage, water absorption and swelling, and cementation-induced obstruction, not only reduces the connectivity of the pore network but also dynamically alters the pore structure, leading to the isolation and increased complexity of effective flow channels. Furthermore, inertinite content positively correlates with D0-Dmax, suggesting that an increase in inertinite promotes the formation and connectivity of macropores, making the pore structure more complex at the macropore scale.
This study provides valuable insights into the multifractal characterization of coal pore structures; however, it has several limitations. First, the correction of MIP data assumes coal matrix compressibility to be uniform; second, the analysis is based on laboratory conditions and does not account for stress-dependent in situ variations in coal pores. Future studies should consider integrating high-pressure experimental conditions and numerical simulations to refine the analysis.

5. Conclusions

This study characterizes the full PSD of coals at various ranks according to the correction of high-pressure MIP data using nitrogen adsorption and MIP methods combined with CO2 adsorption experiments. The corrected data, multifractal theory, and correlation analysis are used to explore the full pore size multifractal parameters and their influencing factors. Conclusions were derived as follows:
(1)
The compressibility of the coal matrix significantly impacts MIP data if pressure exceeds 10 MPa. By incorporating low-temperature nitrogen adsorption data, the MIP pore size distribution in the 6 to 135 nm range can be corrected. After correction, the reduction in mesopore volume ranged from 59.85% to 96.31%, and the reduction in macropore volume ranged from 3.11% to 15.53%, with a substantial decrease in mercury intrusion volume compared to uncorrected volumes. The coal matrix compressibility coefficient ranged between 0.78 × 10⁻¹⁰~3.56 × 10⁻¹⁰ m2/N.
(2)
The full PSD characterization reveals that in sample L1, pore volume is primarily contributed by macropores, with distributions across both micropore and mesopore ranges. In contrast, in samples M1 and H1, pore volume is mainly distributed within the micropore range, with fewer mesopores and some macropore distribution. Approximately 90% of the total specific surface area of the experimental coal specimens is derived from micropores. In general, the distribution of specific surface area exhibits fluctuations with pore size, reaching its maximum value at 0.6 nm.
(3)
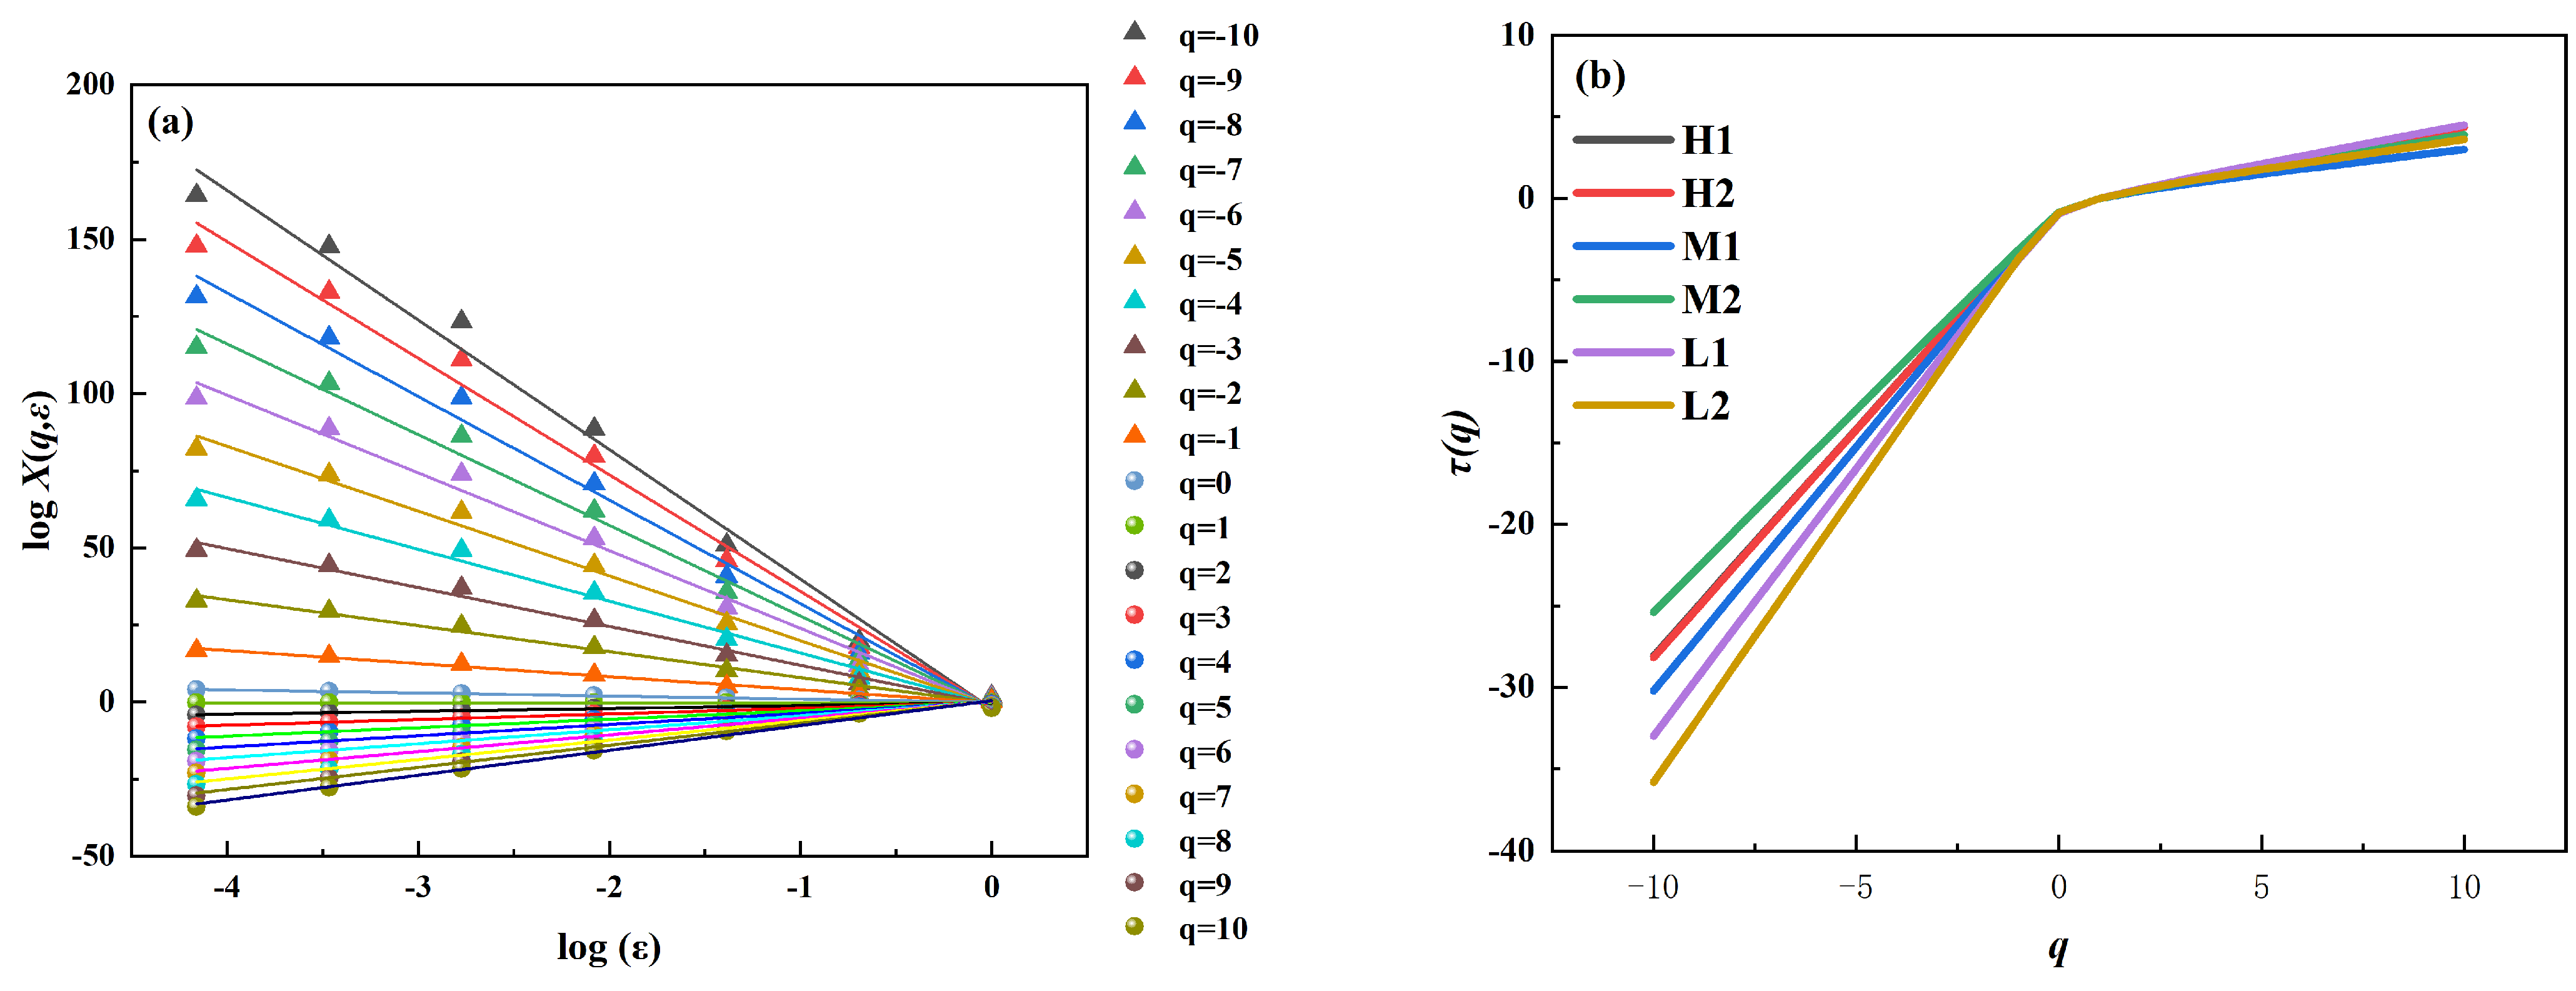
Multifractal analysis of CO2 data, N2 data, and corrected MIP data indicates that the full pore size distribution exhibits significant multifractal characteristics. The multifractal spectrum exhibits a distinctive convex parabolic form. When q < 0, τ (q) exhibits a noticeable upward trend as q increases, while the growth is more gradual when q > 0. The singularity strength range Δα is between 2.397 and 3.218, and the Hurst index ranges from 0.724 to 0.791.
(4)
As the level of coalification rises (i.e., with higher Ro,max values), the multifractal parameters Dmin-D0, D0-Dmax, Δα, and H show a significant negative correlation. Moisture content and volatile matter content are positively correlated with Dmin-D0, Δα, and H, while mineral content has a significant negative correlation with Dmin-D0, Δα, and H. Inertinite content shows a positive correlation with D0-Dmax.

Author Contributions

S.W.: Writing—original draft preparation, Conceptualization. F.C.: Investigation, Data curation. S.Y.: Investigation, Data curation. J.H.: Investigation, Data curation. H.D.: Visualization, Investigation, Conceptualization. A.L.: Writing—review and editing, Supervision, Funding acquisition. All authors have read and agreed to the published version of the manuscript.

Funding

Funding for this study was provided by the National Key Research and Development Program of China (2022YFC2105200).

Data Availability Statement

The data presented in this study are available on request from the corresponding author.

Conflicts of Interest

Authors Shenghui Yue and Jing Hu were employed by the company Research Institute of Petroleum Engineering and Technology, SINOPEC Shengli Oilfield Company. The remaining authors declare that the research was conducted in the absence of any commercial or financial relationships that could be construed as a potential conflict of interest.

Nomenclature

rThe radius of the pore, nm
HThe Hurst index
N(ε)The segmentation of data set
εThe division scale
Pi(ε)The probability density distribution
kThe number of boxes
iA positive integer
vi(ε)The cumulative porosity or pore volume of the ith box
αThe singularity strength
f(α)The multifractal spectrum or singular spectrum
qThe matrix
τ(q)The mass function
X(q,ε)The partition function
αSingularity strength
α(q)Singular strength of the q value
ΔαThe spectral width
αmaxThe maximum values of singularity strength
αminThe minimum values of singularity strength

References

  1. Moore, T.A. Coalbed methane: A review. Int. J. Coal. Geol. 2012, 101, 36–81. [Google Scholar] [CrossRef]
  2. Cai, Y.; Liu, D.; Pan, Z.; Yao, Y.; Li, J.; Qiu, Y. Pore structure and its impact on CH4 adsorption capacity and flow capability of bituminous and subbituminous coals from Northeast China. Fuel 2013, 103, 258–268. [Google Scholar] [CrossRef]
  3. Cai, Y.; Liu, D.; Yao, Y.; Li, J.; Qiu, Y. Geological controls on prediction of coalbed methane of No. 3 coal seam in Southern Qinshui Basin, North China. Int. J. Coal Geol. 2011, 88, 101–112. [Google Scholar] [CrossRef]
  4. Zheng, S.; Yao, Y.; Liu, D.; Cai, Y.; Liu, Y. Characterizations of full-scale pore size distribution, porosity and permeability of coals: A novel methodology by nuclear magnetic resonance and fractal analysis theory. Int. J. Coal. Geol. 2018, 196, 148–158. [Google Scholar] [CrossRef]
  5. Thommes, M.; Kaneko, K.; Neimark, A.V.; Olivier, J.P.; Rodriguez-Reinoso, F.; Rouquerol, J.; Sing, K.S.W. Physisorption of gases, with special reference to the evaluation of surface area and pore size distribution (IUPAC Technical Report). Pure Appl. Chem. 2015, 87, 1051–1069. [Google Scholar] [CrossRef]
  6. Pajdak, A.; Kudasik, M.; Skoczylas, N.; Wierzbicki, M.; Teixeira Palla Braga, L. Studies on the competitive sorption of CO2 and CH4 on hard coal. Int. J. Greenh. Gas Control 2019, 90, 102789. [Google Scholar] [CrossRef]
  7. Lu, F.; Liu, C.; Zhang, X.; Jia, B.; Wang, Y.; Liu, S.; Tang, Y.; Liu, J.; Lin, P. Study on full-scale pores characterization and heterogeneity of coal based on low-temperature nitrogen adsorption and low-field nuclear magnetic resonance experiments. Sci. Rep. 2024, 14, 16910. [Google Scholar] [CrossRef]
  8. Yuan, J.; Chen, J.; Wang, Y.; Xia, J.; Chen, M. Evolution characteristics of pore structure of coal under freeze-thaw cycles combined with scanning electron microscope instrument and nitrogen adsorption experiment. Energy Source Part A 2023, 46, 424–438. [Google Scholar] [CrossRef]
  9. Chen, L.; Yuan, M.; Li, B.; Zhang, C.; Lv, Q.; Xu, S.; Geng, J. Effect of hydrofluoric acid on Guizhou anthracite structure modification and response to enhanced hydrolysis and permeability of coal. Energy Sources Part A Recovery Util. Environ. Eff. 2024, 46, 5306–5323. [Google Scholar] [CrossRef]
  10. Liu, P.; Zhao, Y.; Zhao, Z.; Yang, H.; Nie, B.; He, H.; Li, Q.; Bao, G. Image-based quantitative probing of 3D heterogeneous pore structure in CBM reservoir and permeability estimation with pore network modeling. Int. J. Coal Sci. Technol. 2024, 11, 72. [Google Scholar] [CrossRef]
  11. Jiang, P.; Cheng, Z.; Huang, J.; Li, G. Analysis of pore-fracture structure evolution and permeability in tar-rich coal under high-temperature pyrolysis using μCT technology. Geomech. Geophys. Geo-Energy Geo-Resour. 2024, 10, 104. [Google Scholar] [CrossRef]
  12. Zhang, N.; Wang, S.; Li, Z.; Guo, S.; Wang, R. Application of Multifractal Theory for Determination of Fluid Movability of Coal-Measure Sedimentary Rocks Using Nuclear Magnetic Resonance (NMR). Fractal Fract. 2023, 7, 503. [Google Scholar] [CrossRef]
  13. Lin, W.; Zhao, X.; Li, M.; Zhuang, Y. Pore Structure Characterization and Fractal Characteristics of Tight Limestone Based on Low-Temperature Nitrogen Adsorption and Nuclear Magnetic Resonance. Fractal Fract. 2024, 8, 371. [Google Scholar] [CrossRef]
  14. Zhang, N.; Wang, S.; Wu, J.; Li, Z.; Wang, X. Full-Scale Pore Structure Characterization and Its Impact on Methane Adsorption Capacity and Seepage Capability: Differences between Shallow and Deep Coal from the Tiefa Basin in Northeastern China. Fractal Fract. 2024, 8, 48. [Google Scholar] [CrossRef]
  15. Guo, X.; Yao, Y.; Liu, D. Characteristics of Coal Matrix Compressibility: An Investigation by Mercury Intrusion Porosimetry. Energy Fuels 2014, 28, 3673–3678. [Google Scholar] [CrossRef]
  16. Cai, Y.; Li, Q.; Liu, D.; Zhou, Y.; Lv, D. Insights into matrix compressibility of coals by mercury intrusion porosimetry and N2 adsorption. Int. J. Coal Geol. 2018, 200, 199–212. [Google Scholar] [CrossRef]
  17. Krohn, C.E.; Thompson, A.H. Fractal sandstone pores: Automated measurements using scanning-electron-microscope images. Phys. Rev. B 1986, 33, 6366–6374. [Google Scholar] [CrossRef]
  18. Yao, Y.; Liu, D.; Tang, D.; Tang, S.; Huang, W. Fractal characterization of adsorption-pores of coals from North China: An investigation on CH4 adsorption capacity of coals. Int. J. Coal. Geol. 2008, 73, 27–42. [Google Scholar] [CrossRef]
  19. Zhang, N.; Wang, S.; Xun, X.; Wang, H.; Sun, X.; He, M. Pore Structure and Fractal Characteristics of Coal-Measure Sedimentary Rocks Using Nuclear Magnetic Resonance (NMR) and Mercury Intrusion Porosimetry (MIP). Energies 2023, 16, 3812. [Google Scholar] [CrossRef]
  20. Peng, R.; Yang, Y.; Ju, Y.; Mao, L.; Yang, Y. Computation of fractal dimension of rock pores based on gray CT images. Chin. Sci. Bull. 2011, 56, 3346–3357. [Google Scholar] [CrossRef]
  21. Zheng, S.; Sang, S.; Yao, Y.; Liu, D.; Liu, S.; Wang, M.; Feng, G. A multifractal-based method for determination NMR dual T2 cutoffs in coals. J. Pet. Sci. Eng. 2022, 214, 110488. [Google Scholar] [CrossRef]
  22. Li, W.; Liu, H.; Song, X. Multifractal analysis of Hg pore size distributions of tectonically deformed coals. Int. J. Coal Geol. 2015, 144–145, 138–152. [Google Scholar] [CrossRef]
  23. Zhang, N.; Wang, X.; Wang, S.; Wang, R.; Wu, J.; Li, Z.; Song, Y. Multifractal characteristics on pore structure of Longmaxi shale using nuclear magnetic resonance (NMR). Geoenergy Sci. Eng. 2024, 241, 213176. [Google Scholar] [CrossRef]
  24. Zheng, S.; Yao, Y.; Zhang, S.; Liu, Y.; Yang, J. Insights into Multifractal Characterization of Coals by Mercury Intrusion Porosimetry. Energies 2019, 12, 4743. [Google Scholar] [CrossRef]
  25. GB/T 23561.1-2009; Determination of Coal Rock Physical and Mechanical Properties—Part 1: General Requirements. Standardization Administration of China: Beijing, China, 2009.
  26. GB/T 6948-2008; Method for Determination of Vitrinite Reflectance of Coal. Standardization Administration of China: Beijing, China, 2008.
  27. GB/T 212-2008; Proximate Analysis of Coal. Standardization Administration of China: Beijing, China, 2008.
  28. GB/T 8899-2013; Method for Determination of Maceral Composition and Minerals in Coal. Standardization Administration of China: Beijing, China, 2013.
  29. GB/T 29172-2012; Method for Determination of Permeability of Coal Reservoir. Standardization Administration of China: Beijing, China, 2012.
  30. GB/T 21650.3-2011; Evaluation Method of Specific Surface Area and Pore Size Distribution in Low Temperature Physical Adsorption—Part 3: BJH Method for Mesopore Distribution. Standardization Administration of China: Beijing, China, 2011.
  31. GB/T 29171-2012; Method for Determination of Adsorption Constant of Coal Reservoir. Standardization Administration of China: Beijing, China, 2012.
  32. Chen, Y.; Qin, Y.; Wei, C.; Huang, L.; Shi, Q.; Wu, C.; Zhang, X. Porosity changes in progressively pulverized anthracite subsamples: Implications for the study of closed pore distribution in coals. Fuel 2018, 225, 612–622. [Google Scholar] [CrossRef]
  33. Ge, X.; Fan, Y.; Li, J.; Aleem Zahid, M. Pore structure characterization and classification using multifractal theory—An application in Santanghu basin of western China. J. Pet. Sci. Eng. 2015, 127, 297–304. [Google Scholar] [CrossRef]
  34. Bu, H.; Ju, Y.; Tan, J.; Wang, G.; Li, X. Fractal characteristics of pores in non-marine shales from the Huainan coalfield, eastern China. J. Nat. Gas Sci. Eng. 2015, 24, 166–177. [Google Scholar] [CrossRef]
  35. Halsey, T.C.; Jensen, M.H.; Kadanoff, L.P.; Procaccia, I.I.; Shraiman, B.I. Fractal measures and their singularities: The characterization of strange sets. Phys. Rev. A Gen. Phys. 1986, 33, 1141–1151. [Google Scholar] [CrossRef]
  36. Chhabra, A.; Jensen, R.V. Direct determination of the f(alpha) singularity spectrum. Phys. Rev. Lett. 1989, 62, 1327–1330. [Google Scholar] [CrossRef]
  37. Li, Y.-H.; Lu, G.Q.; Rudolph, V. Compressibility and Fractal Dimension of Fine Coal Particles in Relation to Pore Structure Characterisation Using Mercury Porosimetry. Part. Part. Syst. Charact. 1999, 16, 25–31. [Google Scholar] [CrossRef]
  38. Debelak, K.; Schrodt, J. Comparison of Pore Structure In Kentucky Coals by Mercury Penetration and Carbon-Dioxide Adsorption. Fuel 1979, 58, 732–736. [Google Scholar] [CrossRef]
  39. Xu, L.; Liu, C.; Xian, X.; Zhang, D. Compressibility of coal matter and coal pore. Colloids Surf. A-Physicochem. Eng. Asp. 1999, 157, 219–222. [Google Scholar] [CrossRef]
  40. Caniego, F.; Martín, M.; San José, F. Singularity features of pore-size soil distribution:: Singularity strength analysis and entropy spectrum. Fractals 2001, 9, 305–316. [Google Scholar] [CrossRef]
  41. Wang, D.; Hu, H.; Wang, T.; Tang, T.; Li, W.; Zhu, G.; Chen, X. Difference between of coal and shale pore structural characters based on gas adsorption experiment and multifractal analysis. Fuel 2024, 371, 132044. [Google Scholar] [CrossRef]
Figure 1. Distribution map of coal samples.
Fractalfract 09 00183 g001
Figure 2. CO2 adsorption isotherm and pore size distribution curves. (a) CO2 adsorption curve; (b) Pore volume distribution curve of micropore; (c) Pore Area distribution curve of micropore.
Fractalfract 09 00183 g002
Figure 3. N2 adsorption isotherm and pore size distribution curves. (a) N2 adsorption curve; (b) Pore volume distribution curve of mesopore; (c) Pore Area distribution curve of mesopore.
Fractalfract 09 00183 g003
Figure 4. Mercury intrusion–extrusion and pore size distribution curves. (a) Mercury intrusion–extrusion curves; (b) Pore volume distribution curve of macropore; (c) Pore Area distribution curve of macropore.
Fractalfract 09 00183 g004aFractalfract 09 00183 g004b
Figure 5. Linear regression of high pressure segment of mercury injection curves.
Fractalfract 09 00183 g005
Figure 6. Comparisons between the uncorrected and corrected PSDs of the coals from MIP measurements. (a) H1; (b) H2; (c) M1; (d) M2; (e) L1; (f) L2.
Fractalfract 09 00183 g006aFractalfract 09 00183 g006b
Figure 7. Pore volumes and specific surface areas distribution characteristics of full-size pore diameter section of coal samples. (a) Full-size pore volume distribution curve; (b) Full-size pore Area distribution curve of macropore.
Fractalfract 09 00183 g007
Figure 8. Multiple analyses of coal based on the corrected full size pore distributions: (a) partition function versus scaling; (b) mass index function versus statistical moments; (c) generalized fractal dimension versus statistical moments; (d) multifractal spectrum.
Fractalfract 09 00183 g008aFractalfract 09 00183 g008b
Figure 9. Heat map of correlation between coal petrographic parameters and multiple fractal parameters.
Fractalfract 09 00183 g009
Table 1. Statistical table of the test data of the coal samples.
No.Ro, Max
(%)
Porosity
φ (%)
Permeability
K (mD)
Proximate Analysis (%)Coal Composition (%)
MadAadVMadFCadVitrinite/
Huminite
InertiniteExiniteMineral
H13.288.680.761.945.565.4187.0981.212.32.22.6
H22.405.890.931.8717.709.4371.0040.350.62.84
M11.962.552.570.8917.3915.8865.8451.640.23.62.7
M21.901.581.260.8013.1717.1868.8539.447.56.73.6
L10.6321.744.614.2419.2536.2240.2947.445.82.32.4
L20.5125.953.573.503.4431.8361.2344.748.21.82.1
Mad = Moisture content (air-drying basis), Aad = Ash yield (air-drying basis), VMad = volatile matter (air-drying basis), FCad = fixed carbon content (air-drying basis).
Table 2. Compression correction of mercury pressure data.
Sample No.MIPLTNAMesopore Volume
(cm3/g)
Macropore Volume
(cm3/g)
β k c (m2/N)Before
Correction
After
Correction
Before
Correction
After
Correction
Before
Correction
After
Correction
H111.67 × 10−51.56 × 10−100.112 × 10−30.099 × 10−30.02150.00160.01030.0087
H26.93 × 10−50.78 × 10−102.518 × 10−31.702 × 10−30.01290.00210.01330.0125
M18.84 × 10−51.19 × 10−100.976 × 10−30.298 × 10−30.01630.00060.00850.0073
M28.63 × 10−51.31 × 10−100.872 × 10−30.749 × 10−30.01670.00440.01860.0175
L131.53 × 10−53.56 × 10−1014.349 × 10−32.675 × 10−30.05810.00650.06000.0559
L214.38 × 10−52.11 × 10−108.826 × 10−32.794 × 10−30.02740.01100.03860.0374
β = d V o b s / d P , k c = compression factor
Table 3. Pore structure characteristics of full-size pore diameter section of coal samples.
Sample No.Vtotal/
(cm3·g−1)
V1
(cm3·g−1)
V2
(cm3·g−1)
V3
(cm3·g−1)
Stotal/
(m2·g−1)
S1
(m2·g−1)
S2
(m2·g−1)
S3
(m2·g−1)
H10.06260.05180.00220.0086161.67160.091.540.04
H20.03970.02480.00280.012183.0981.551.430.10
M10.02610.01780.00100.007357.9557.170.740.04
M20.02310.01570.00230.005151.5651.120.170.27
L10.09590.02780.01380.0543107.2092.6013.860.73
L20.06350.01940.00770.036471.6065.545.690.37
Vtotal: total pore volume, Stotal: total specific surface area, V1: pore volume (r ≤ 2 nm), V2: pore volume (2 nm < r ≤ 50 nm), V3: pore volume (r > 50 nm), S1: specific surface area (r ≤ 2 nm), S2: specific surface area(2 nm < r ≤ 50 nm), S3: specific surface area (r > 50 nm).
Table 4. Characteristic parameters of the generalized fractional dimensional spectrum.
Sample No.DmaxDminD0D1D2Dmin-D0D0-DmaxΔαH
H10.4832.5530.8570.6950.5331.6960.3742.3970.767
H20.4832.5620.8820.7120.5411.6800.3992.3420.770
M10.3332.7480.8480.6480.4481.9000.5152.7050.724
M20.4322.3090.8660.6850.5051.4440.4332.0820.752
L10.4992.9980.9480.7650.5832.0510.4492.8240.791
L20.4013.2570.8870.7080.5682.3700.4863.2180.784
Disclaimer/Publisher’s Note: The statements, opinions and data contained in all publications are solely those of the individual author(s) and contributor(s) and not of MDPI and/or the editor(s). MDPI and/or the editor(s) disclaim responsibility for any injury to people or property resulting from any ideas, methods, instructions or products referred to in the content.

