Article

Effect of Particle Size on Pore Structure and Fractal Characteristics of Deep Siliceous Shales in Southern Sichuan, China, Measured Using Small-Angle Neutron Scattering and Low-Pressure Nitrogen Adsorption

1
Research Institute of Petroleum Exploration & Development, Beijing 100083, China
2
School of Engineering Science, University of Chinese Academy of Sciences, Beijing 100049, China
3
Shale Gas Research Institute, PetroChina Southwest Oil & Gas Field Company, Chengdu 610051, China
4
Institute of Mechanics, Chinese Academy of Sciences, Beijing 100190, China
*
Authors to whom correspondence should be addressed.
Fractal Fract. 2025, 9(3), 165; https://doi.org/10.3390/fractalfract9030165
Submission received: 15 January 2025 / Revised: 4 March 2025 / Accepted: 7 March 2025 / Published: 10 March 2025

Abstract

Granular samples are often used to characterize the pore structure of shale. To systematically analyze the influence of particle size on pore characteristics, case studies were performed on two groups of organic-rich deep shale samples. Multiple methods, including small-angle neutron scattering (SANS), low-pressure nitrogen gas adsorption (LP-N2GA), low-pressure carbon dioxide gas adsorption (LP-CO2GA), and XRD analysis, were adopted to investigate how the crushing process would affect pore structure parameters and the fractal features of deep shale samples. The research indicates that with the decrease in particle size, the measurements from nitrogen adsorption and SANS experiments significantly increase, with relative effects reaching 95.09% and 51.27%, respectively. However, the impact on carbon dioxide adsorption measurements is minor, with a maximum of only 8.97%. This suggests that the comminution process primarily alters the macropore structure, with limited influence on the micropores. Since micropores contribute the majority of the specific surface area in deep shale, the effect of particle size variation on the specific surface area is negligible, averaging only 16.52%. Shales exhibit dual-fractal characteristics. The distribution range of the mass fractal dimension of the experimental samples is 2.658–2.961, which increases as the particle size decreases. The distribution range of the surface fractal dimension is 2.777–2.834, which decreases with the decrease in particle size.

1. Introduction

Natural gas has a low carbon emission coefficient and is an important clean fossil fuel. With the improvement of key development technologies such as hydraulic fracturing, shale gas has become an important component of natural gas production [1]. China, following this revolutionary upsurge, started its forays into the domain of shale gas in 2012. In 2022, the numerous commercial gas development projects in Sichuan Basin reached an output of 24 × 109 m3, ranking second in the world after the United States [2]. Pore structure is a critical parameter for evaluating geological samples, encompassing multiple factors such as fractal characteristics, porosity, pore size distribution, and specific surface area. Different from conventional oil and gas reservoirs, shales generally develop nanoscale pores [3,4]. The development of organic and inorganic networks leads to a complex pore structure of shales. Popular methods for the characterization of the pore structure include fluid injection, LP-N2GA, LP-CO2GA [5], helium gas injection [6], nuclear magnetic resonance [7,8], and mercury injection [9].
In order to characterize the pore structure in shale, crushed shale samples are often used. But no universal standards for the identification of the crushing degree of shales are available at present. As the particle size differs, the crushing strength varies. Crushing can significantly affect the pore structure of shale, leading to changes in the fractal characteristics of the sample. Many scholars have given their recommended particle sizes for the characterization of different pore structures. Li et al. [10] performed an eight-group N2/CO2 low-pressure adsorption experiment with different particle sizes, taking three ultra-high and ultra-mature shale samples as research subjects. A particle size of 10–40 meshes was recommended to analyze the pore structures. Mastalerz et al. [11], by analyzing how particle sizes affected the test results of shale samples with different maturity, found that the poor reproducibility of samples with a large particle size was mainly attributed to the equilibrium conditions, and a 200-mesh particle size was recommended for experiments. Wei et al. [12] compared the isothermal adsorption results at a particle size of 60–80, 80–100, 100–120, 120–140, and 140–200 meshes, and found that 60–140 mesh fractions were suitable for low-pressure N2 isothermal adsorption experiments. Under similar conditions, Li et al. [13] recommended a size of 20–80 meshes for these experiments. Han et al. [14] considered 130-mesh samples suitable for nitrogen adsorption experiments for the Longmaxi Formation shale samples located in the southern Sichuan Basin of China. Hazra et al. [15] proposed that an extremely small particle size would change or destroy the pore structure. The water vapor adsorption experiment carried out by Yang et al. [16] showed that at a relative humidity (RH) of 95%, the total adsorption of large-size samples was low due to the less-connected pores. It was reported that crushing has two main effects on pore structure, namely, the connection of originally closed pores and the generation of new artificial pores, which are induced by the decrease in particle sizes. However, previous studies have primarily focused on the impact of shale fragmentation on the connectivity of different types of shale pores. Due to limitations in experimental methods, the newly generated artificial pores have not been quantitatively analyzed. Therefore, it is necessary to introduce new methodologies to investigate the quantitative relationship between connected closed pores and newly formed artificial pores.
SANS has been a popular approach for the analysis of tight shale reservoirs [17,18], boasting many advantages over fluid injection. First, it has high accuracy, reaching up to 1 nm; second, it can characterize a large sample size of up to 1011 μm3 with high precision; third, it can achieve full characterization of both open and closed pores. Radlinski first analyzed the porosity, pore size distribution (PSD), and other pore structure parameters of shale through SANS [19]. Liu analyzed the specific surface area (SSA), fractal dimension, and other pore structure parameters of Bakken samples through SANS and nitrogen adsorption experiments [20]. Therefore, SANS scattering experiments can be used to quantify the impact of artificially generated pores from the crushing process on the overall pore structure of the sample. Furthermore, the influence of changes in conventional pore structure parameters on fractal characteristics was analyzed.
To investigate the effect of particle size on the pore structure (porosity, pore size distribution, specific surface area, and fractal dimension) of deep organic-rich siliceous shale, this study selected two shale samples from Luzhou, southern Sichuan, characterized by high TOC and high siliceous content. These samples were further ground into different mesh sizes (20–40, 60–80, 120–160, and 200–400). Based on SANS, LP-N2GA, and LP-CO2GA experiments, we first analyzed the impact of the crushing process on fundamental pore structure parameters, including porosity, pore size distribution, and specific surface area. Subsequently, we conducted a detailed analysis of how changes in the fundamental pore structure due to the crushing process affect the fractal dimension.

2. Shale Samples and Methods

2.1. Samples

Two sets of samples, labelled as L1 and L2, were selected from the Longmaxi Formation shale in Luzhou, located in southern Sichuan Basin, China. Fresh shale samples weighing 100 g were divided into four groups, with particle sizes of 20–40 meshes, 60–80 meshes, 120–160 meshes, and 200–400 meshes, respectively. The samples were first dried at 105 °C for 24 h and then cooled in a drying dish to 25 °C. The experimental samples were prepared for SANS and low-pressure gas adsorption (LPGA) experiments.

2.2. Methods

2.2.1. SANS Experiment

The SANS experiment was carried out at the China Spallation Neutron Source (CSNS). The scattering vector (Q) of 0.005 < Q < 0.6 Å−1 was covered. The pore diameter range, which can be detected in the experiment, was calculated to be 1~100 nm. The crushed shale samples placed in a 1-mm-thick quartz sample pool resulted in high neutron transmittance, making multiple scattering of most samples less than 10%. In advance, the samples were dried at 105 °C for more than 24 h until constant mass was achieved; then, the SANS experiment was started. The scattering data of the samples on the two-dimensional detector were isotropic. The radial averages, including those obtained from different camera lengths, were then combined. The original 2D data were corrected through the deduction of the empty cells of the same number and the scattering number of pickled quartz sand to remove the impact of the void space between particles on the experiment’s result.

2.2.2. LP-N2GA Experiment

The LP-N2GA experiment was carried out on a Micromeritics ASAP 2420 specific surface area and porosity analyzer. The instrument was operated at a test temperature of −196 °C, and the test pressure range was 0.15–0.2 MPa. The minimum specific surface area could be measured to 0.005 m2/g, and the minimum pore volume could be measured to 0.0001 cm3/g. High-purity nitrogen (purity > 99.999%) was used as the adsorbate. In this paper, the Brunauer Emmett Teller (BET) model was selected to calculate the aperture distribution [21], and the effective aperture range was 1.978–220.2 nm.

2.2.3. LP-CO2GA Experiment

The LP-CO2GA experiment was performed using the Micromeritics ASAP 2420 specific surface area and porosity analyzer. The instrument was operated at a test temperature of 0 °C, with a test pressure range of 0.15–0.2 MPa. High-purity carbon dioxide with a temperature lower than the temperature of the ice–water mixture (273 K) was used as the adsorbate to obtain the adsorption isotherm curve. The carbon dioxide can enter small-diameter pores that nitrogen cannot. In the present work, the pore size of the LP-CO2GA experiment ranges from 0.36 to 1.10 nm. The density functional theory (DFT) [22] and adsorption curve were used to calculate pore structure parameters like the PSD and SSA.

3. Results

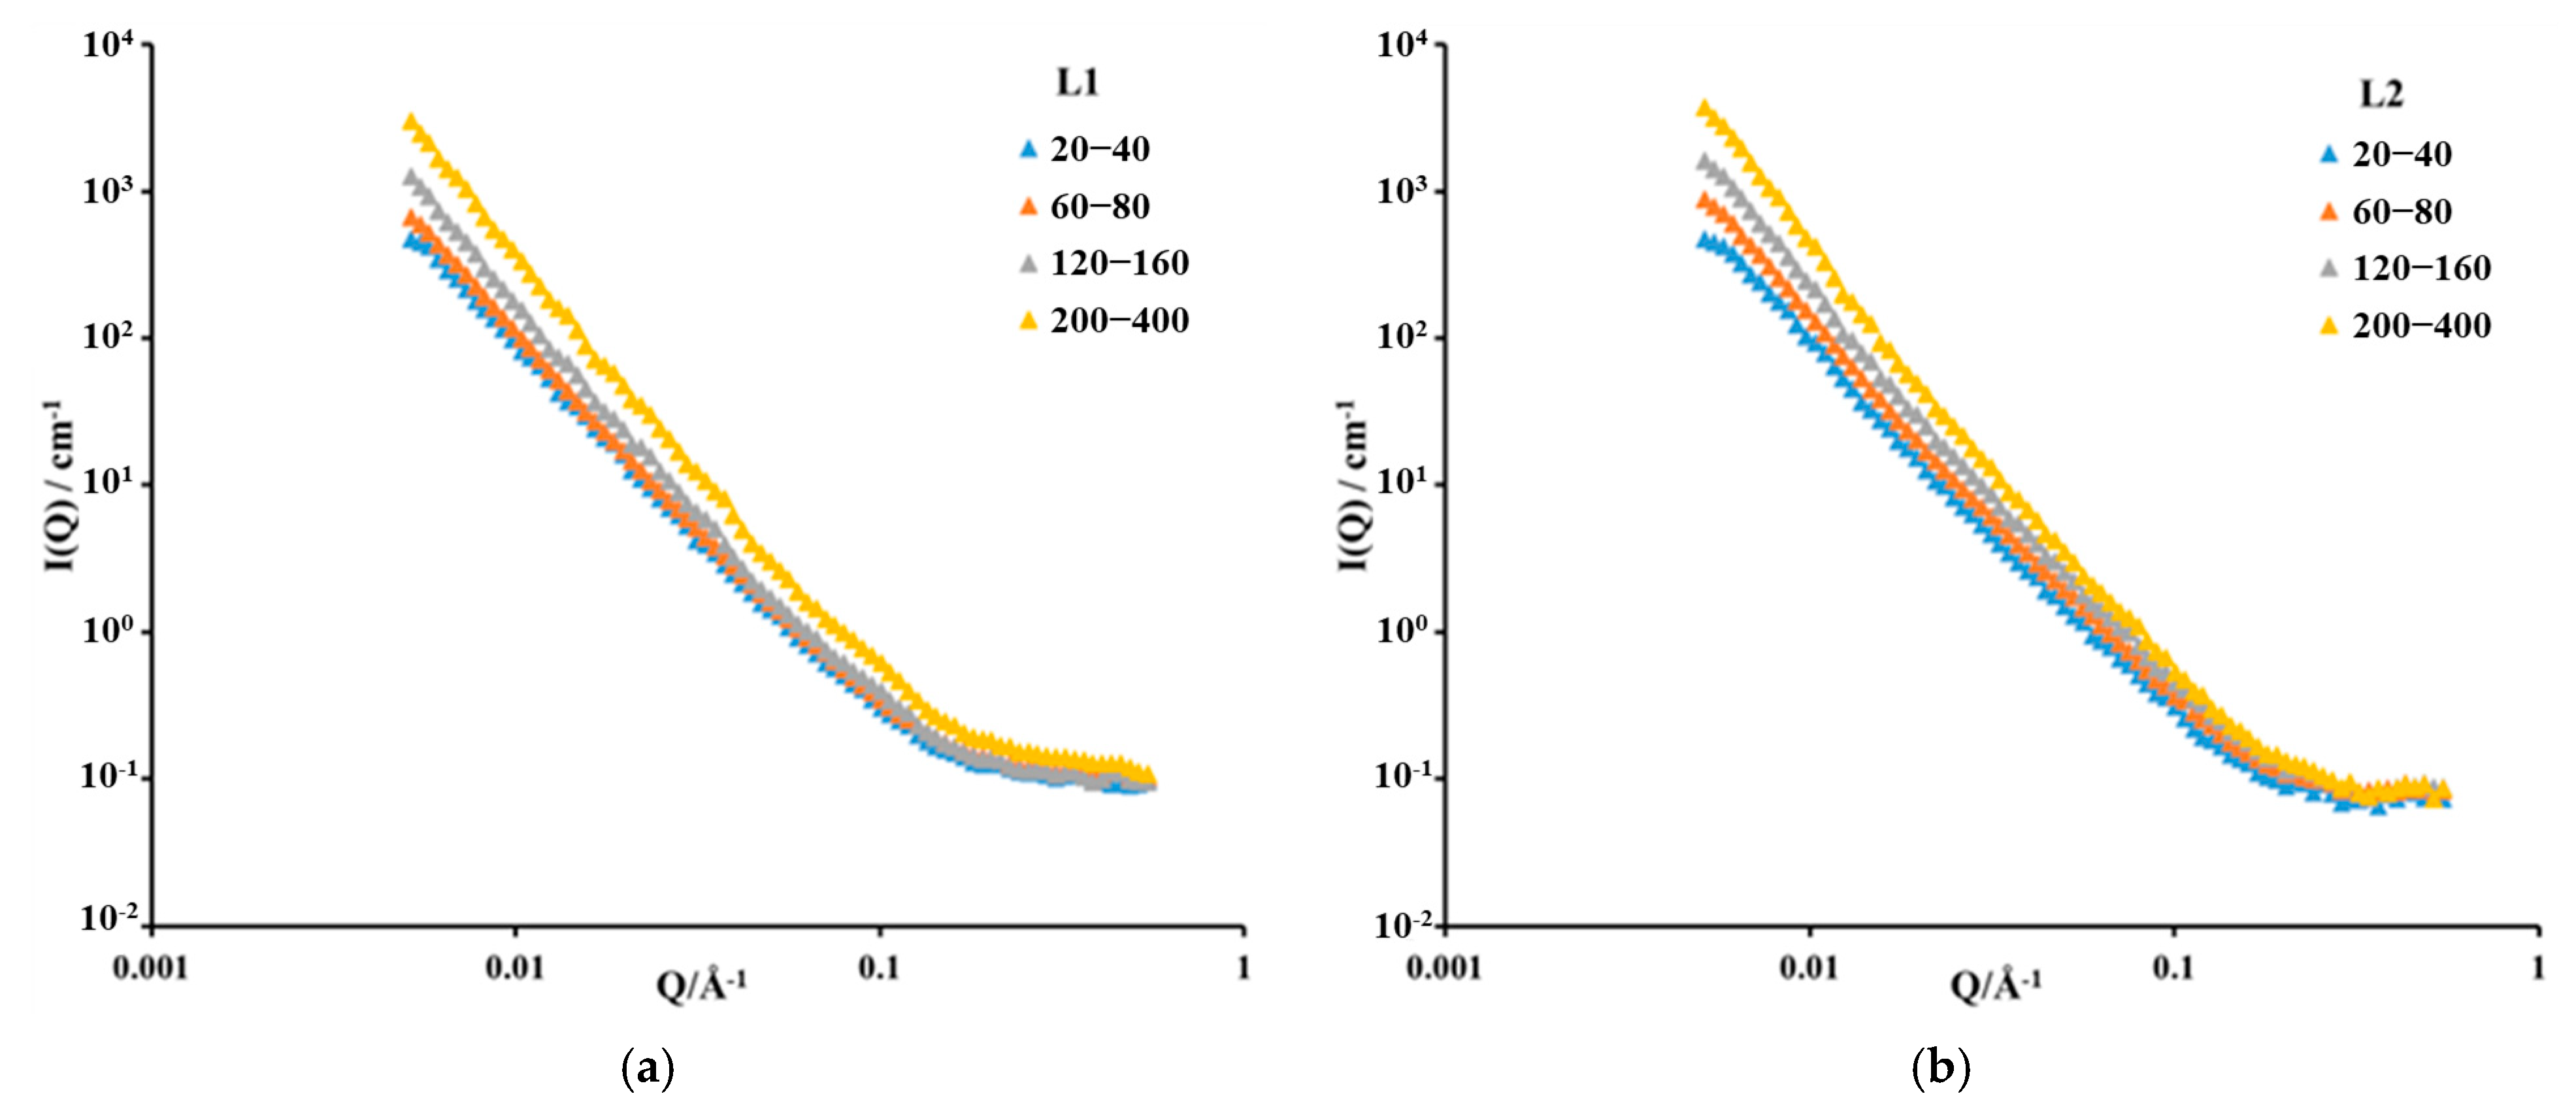
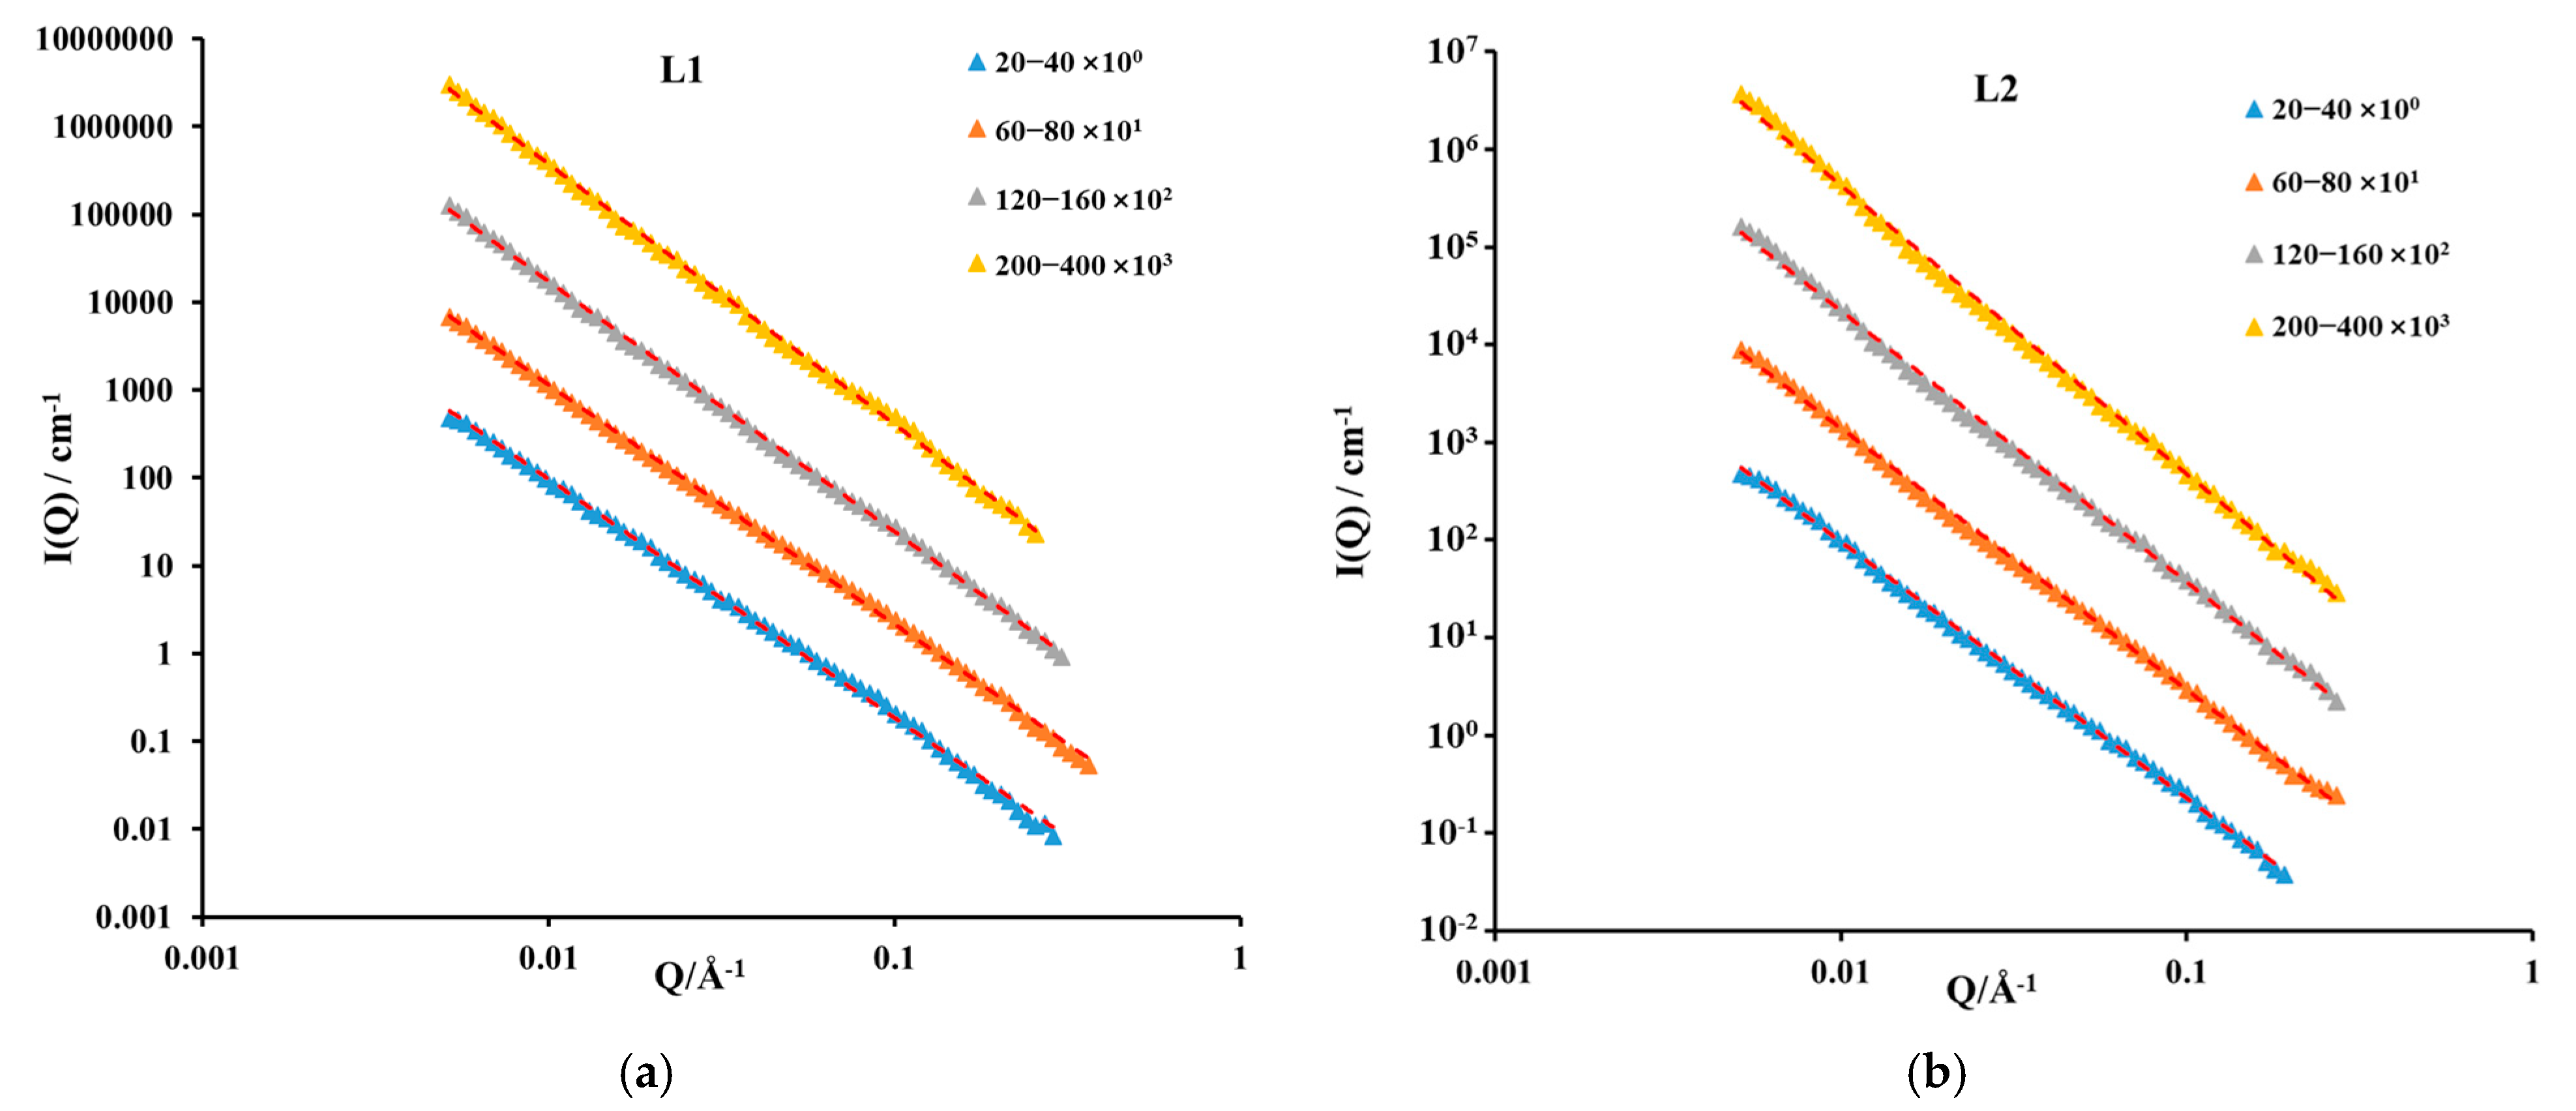
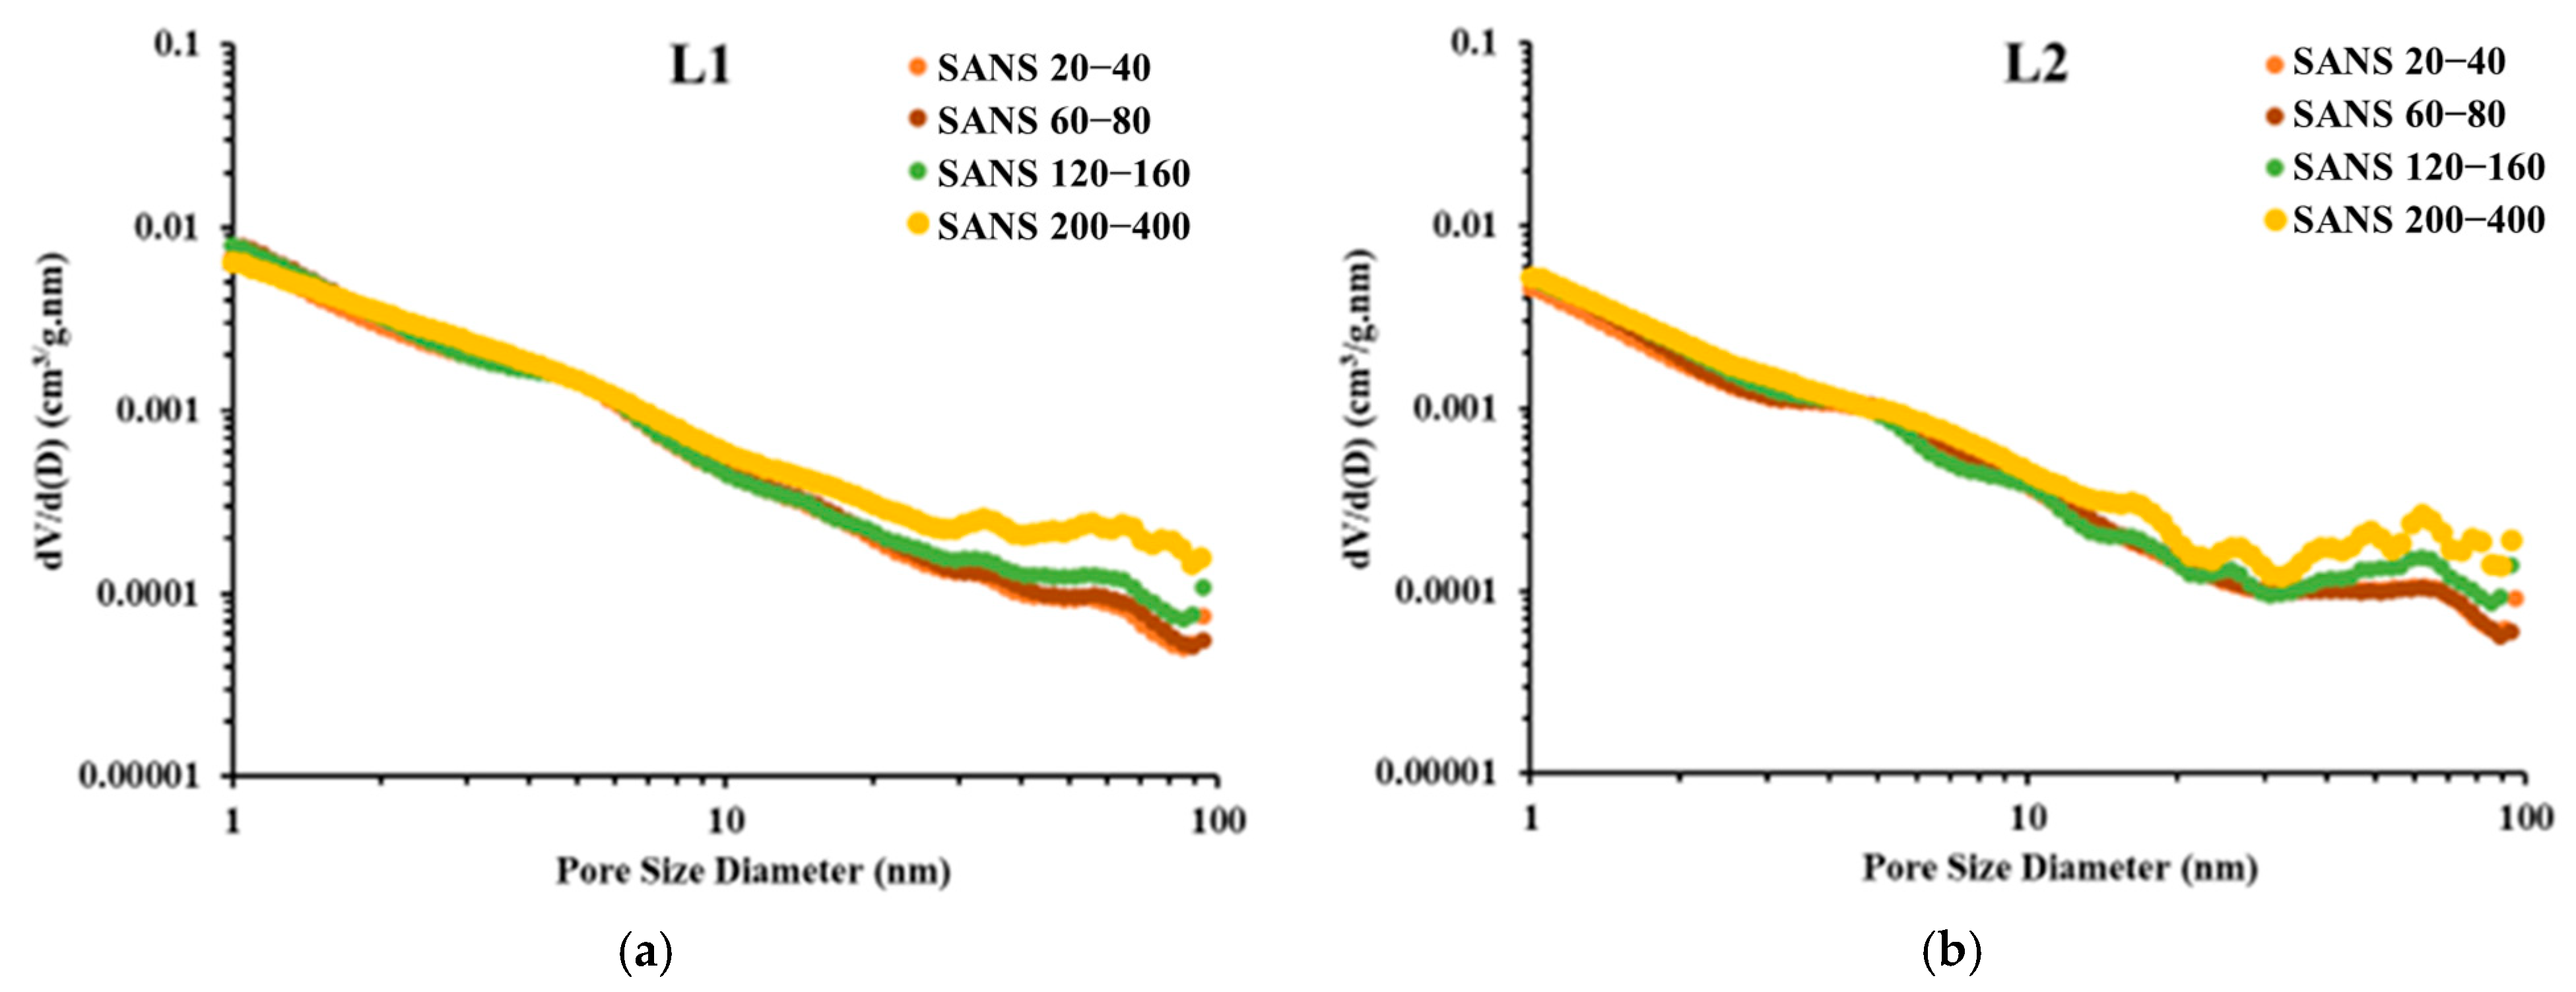
3.1. Experimental Results of SANS

Table 1 shows the composition information of the sample, including total organic carbon (TOC), mineral composition, density, and scattering length density.
The average scattering length density (SLD) of shale can be further calculated using the following formula [23]:
SLD shale = i n vol % i SLD i 100
where i represents the component, and n represents the total number of components.
In the present work, the SLD of each shale sample was calculated, as shown in Table 1.
Figure 1 shows the original data curve of crushed shale samples measured using SANS. Due to the influence of hydrogen atoms in shale, I(Q) data will be significantly distorted when the Q value is high. The size of the background signal can be quantitatively calculated based on the shale composition. Figure 2 shows the SANS curves of samples after the subtraction of the scattering background, which approximately follow the power law correlation.
Due to the fact that fractal characteristics should have good linearity in a specific Q (Å−1) range under double logarithmic coordinates, data that do not conform to fractal characteristics are removed based on the characteristics of different sample scattering intensity curves to determine the correctness of the study, as shown in Table 2. After subtracting the non-compliant data, the SANS curve of the sample approximately follows a power–law correlation (I(Q)~Q−p, where p is the Porod index). Due to the strong fractal characteristics caused by the size of the pore diameter, the standard correlation coefficient (R2) of all sample fitting curves is as high as 0.997 on average. Among them, the Porod index (P) can characterize the fractal characteristics of shale. The Porod index (P) in this study is less than 3, indicating that deep shale samples conform to mass fractal (pore fractal) and the mass fractal dimension (Dm) can quantify the way in which the mass of an object increases with length. This number represents the compactness of the mass fractal and the unevenness of the mass distribution. The fractal dimension is equal to P, and the larger Dm is, the more uneven the system’s mass or density is. For shale pore systems, the mass fractal dimension can be considered as the uniformity of shale pore development. The larger the Dm, the more uneven the distribution of shale pores. The results of the mass fractal dimension of all shale samples in this article are reported in Table 2.
The porosity calculation formula is as follows [24]:
0 Q 2 I Q dQ = 2 π 2 Δ ρ 2 ϕ 1 ϕ
where ρ represents the scattering contrast.
The SANS curves of shale samples were fitted by the non-negative least squares method, and then the PSD and SSA were obtained using the polydisperse size distribution model (PSDM) [25,26]. This study was conducted using the Irena SAS macro function in IGOR PRO software version 6.37. It should be noted that the fractal model for SANS data is contradictory to the PSD model. Therefore, when analyzing the relationship between the mass fractal dimension and pore structure, this study uses pore structure parameters characterized by LP-N2GA.

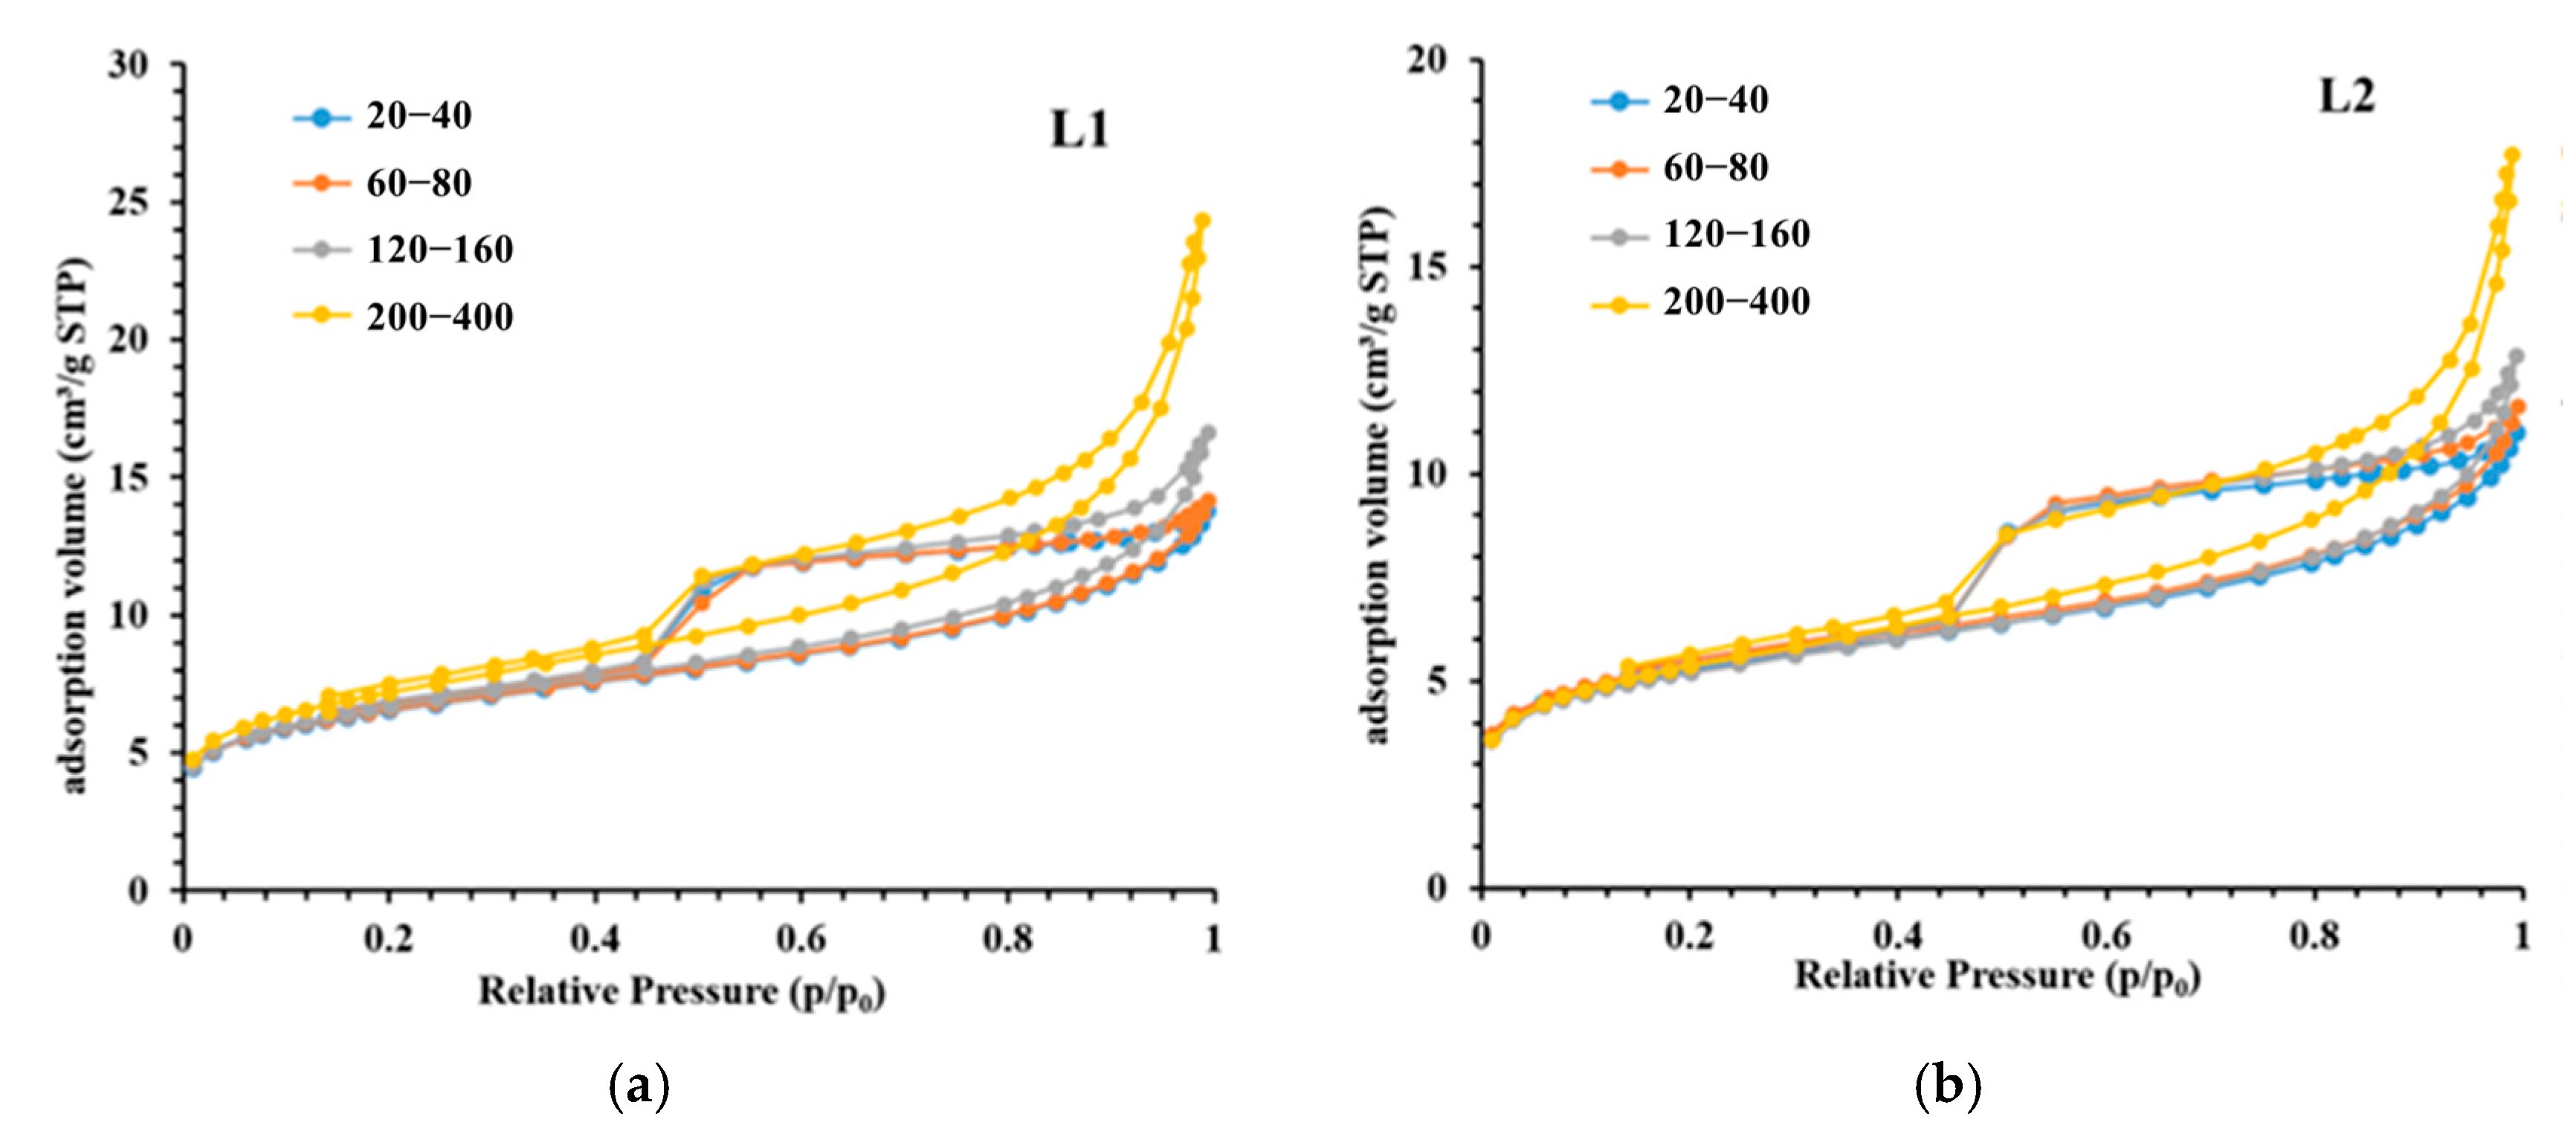
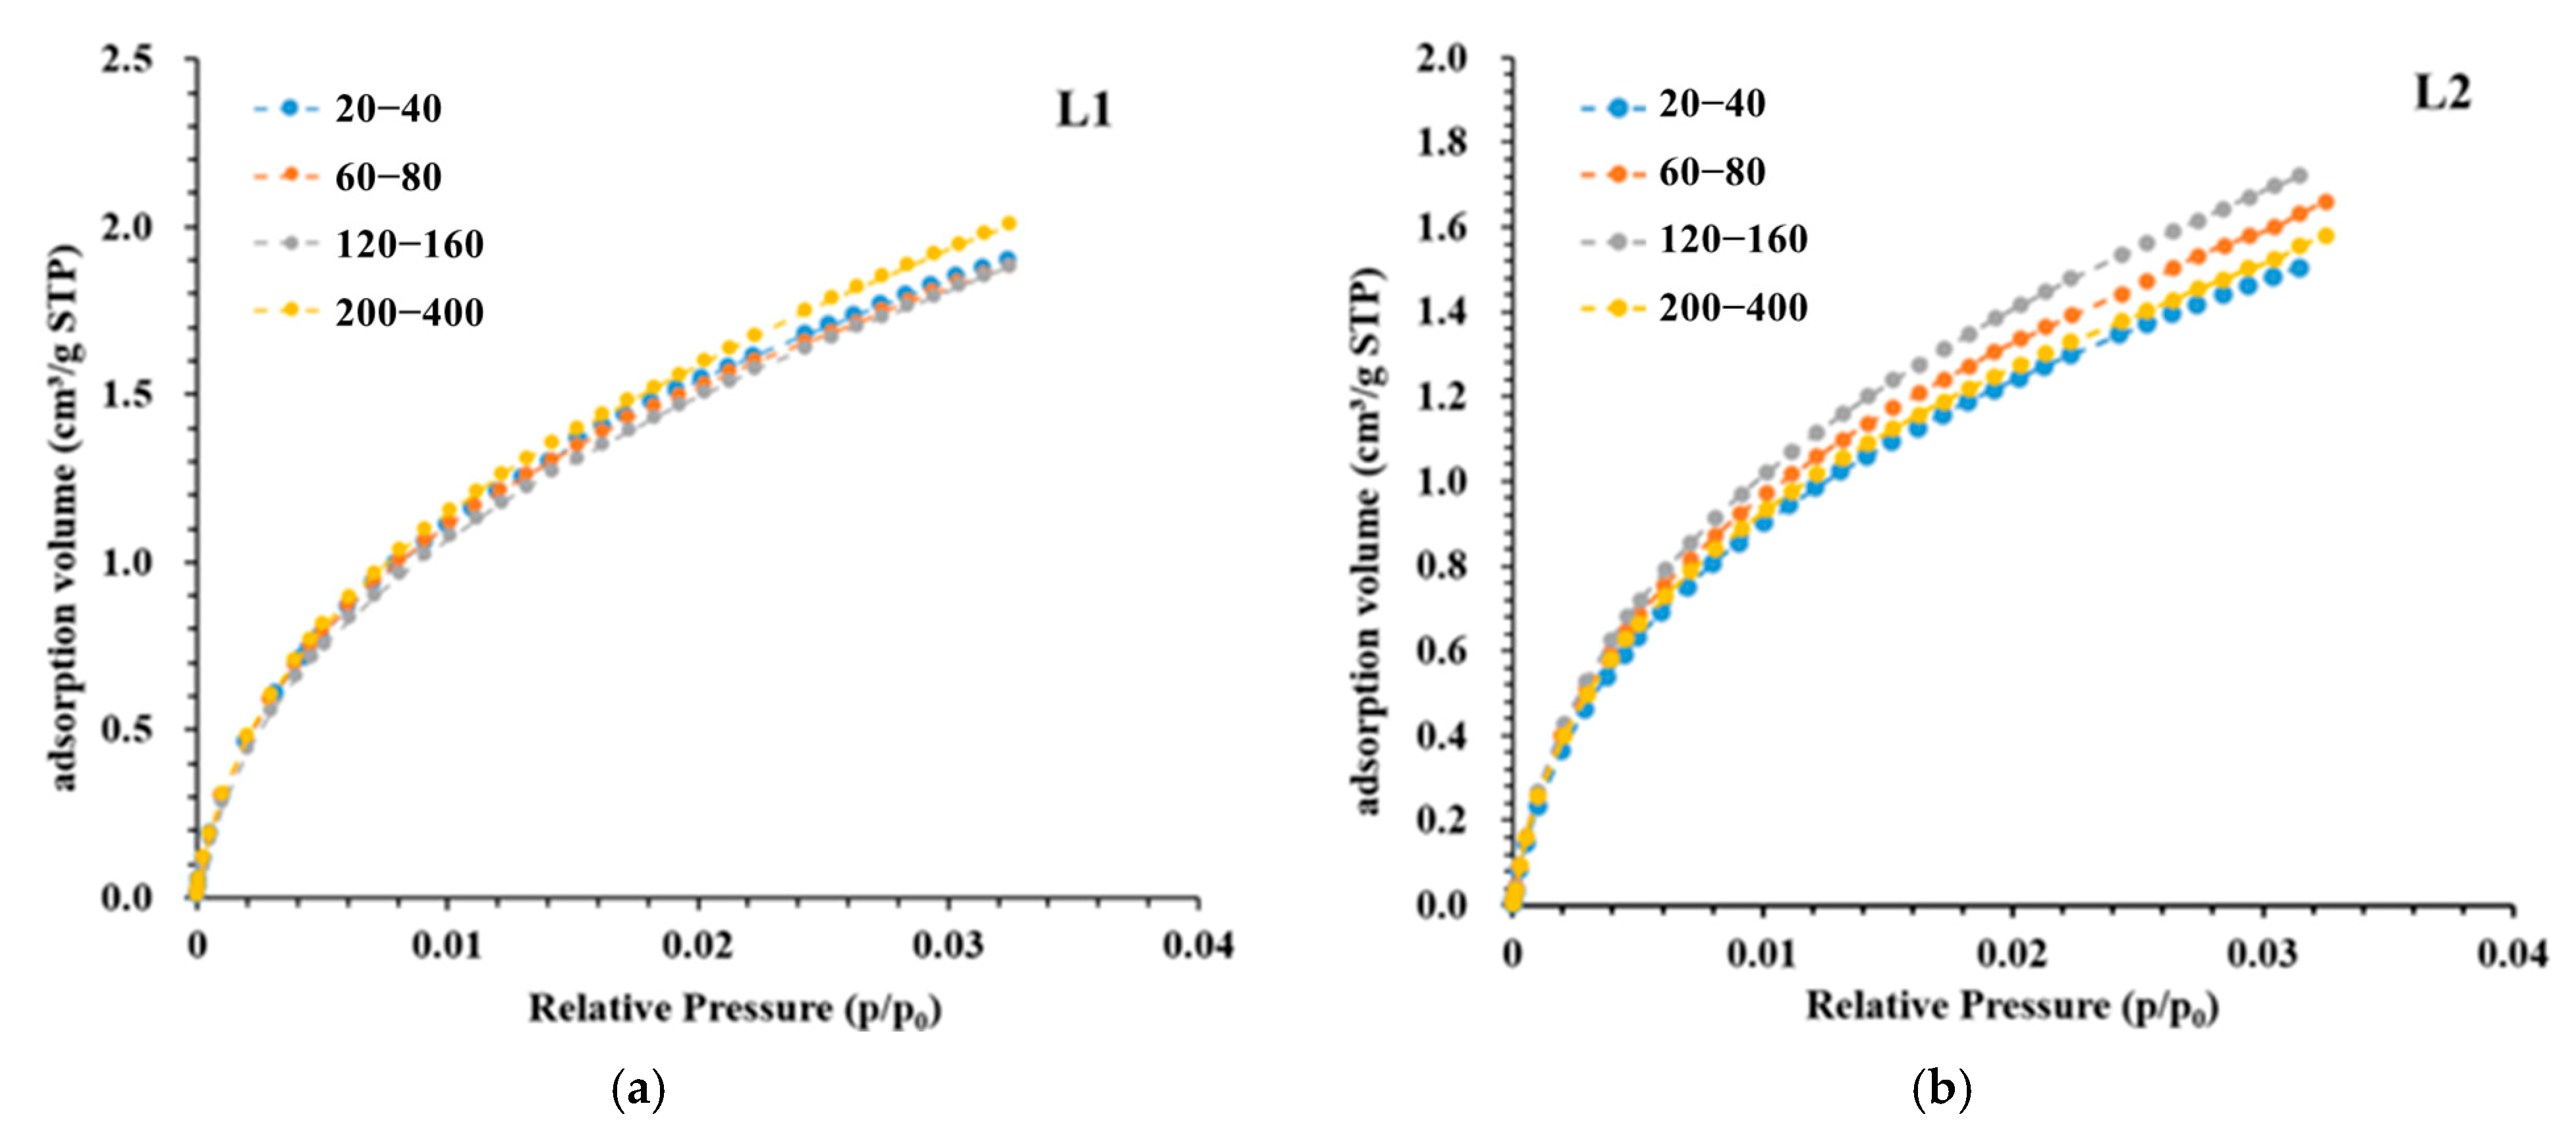
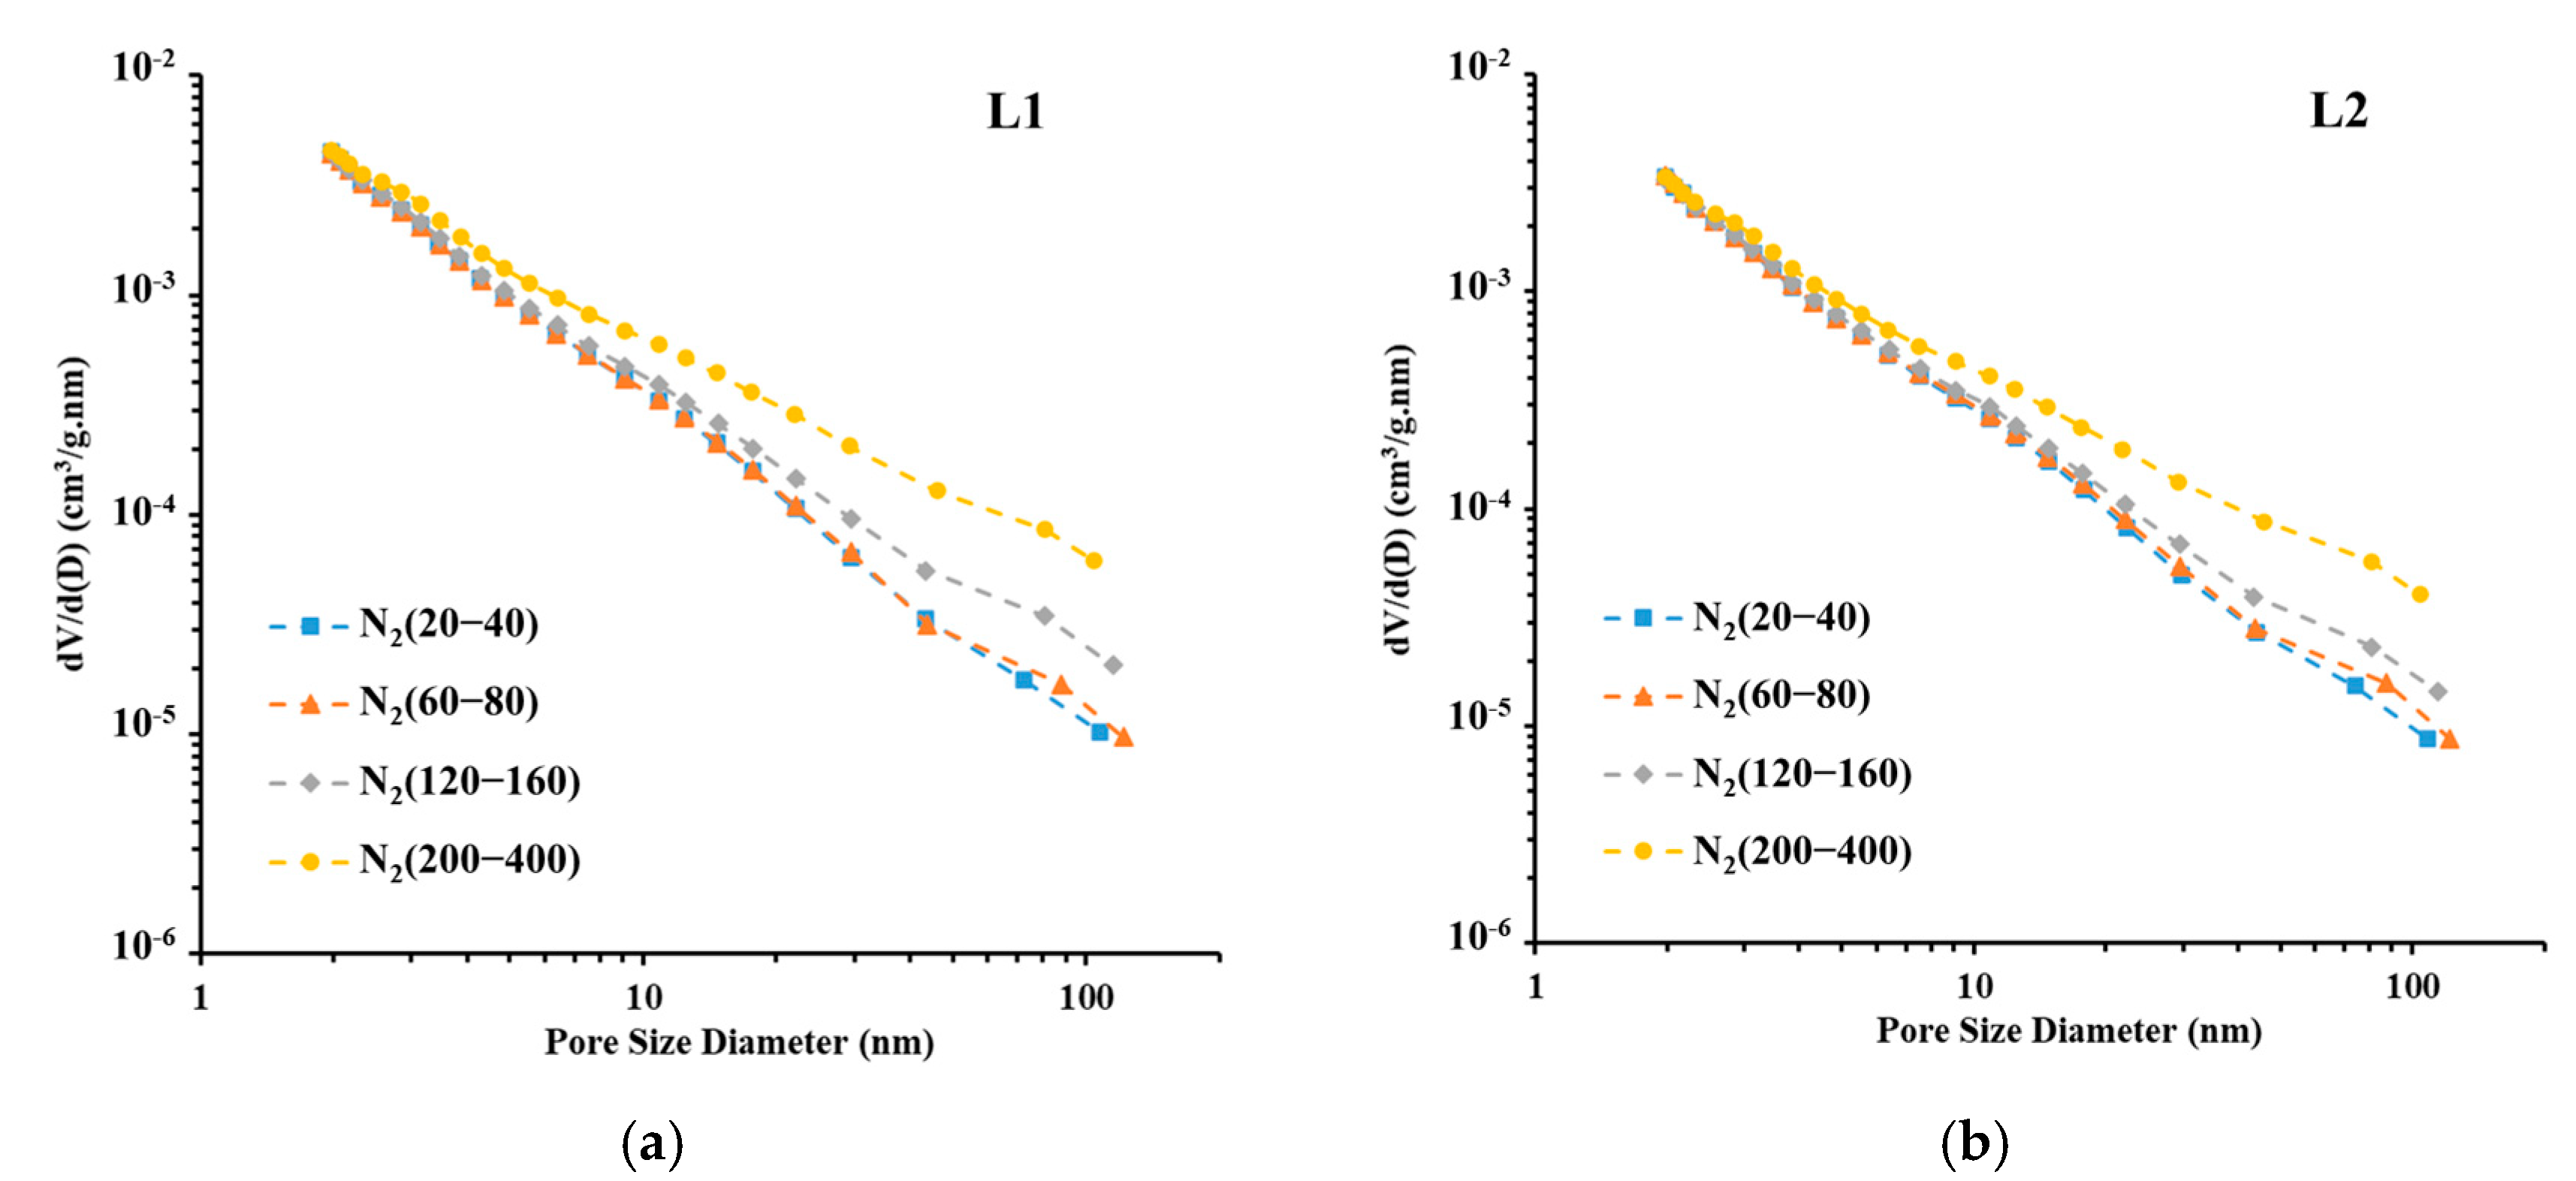
3.2. Experimental Results of LPGA

Figure 3 shows the nitrogen adsorption–desorption isotherms of Samples L1 and L2 under four different particle sizes. It can be seen that it forms an obvious hysteresis loop. Sing [27] divides the hysteresis types into four types, H1–H4, which, respectively, represent the end open pore, ink-bottle pore, slit pore, and narrow slit pore shapes. In this study, with the decrease in particle size, the hysteresis loop type of the two groups of samples changed from H2 to H3. Therefore, the overall pore morphology of the samples gradually changed from ink bottle type to slit type. This means that with the decrease in particle size, the newly generated pores and the original closed pores connected are dominated by slit pores.
The adsorption–desorption volume of the four particle sizes differs substantially as the relative pressure approaches 1, suggesting that they failed to reach saturation. This indicates that there are still macropores with a pore size greater than 200 nm in all the samples. The maximum adsorption capacity of Sample L1 (200–400 mesh) is 72% higher than that of the 20–40-mesh sample. The maximum adsorption capacity of Sample L2 (200–400 mesh) is 87% higher than that of the 20–40-mesh sample. It can be seen that the maximum adsorption capacity decreases with the increase in particle size, and the adsorption point of this surface increases significantly with the decrease in sample size. This increased adsorption point may be provided by the artificial secondary pores generated during shale crushing and the original closed pores communicated.
Based on nitrogen adsorption data, the surface fractal dimension of shale was calculated using Pfeifer’s Frenkel–Halsey–Hill (FHH) model [28,29]. The model assumes that the film of the fluid absorbed on the sample surface can be regarded as a monolayer composed of a number of spheres with radius z. Consequently, the volume of the absorbed film equates to the number of spheres, n(z), multiplied by the volume of a single sphere. Thus, the fractal dimension can be defined by postulating that n(z) is proportional to z−D. Subsequently, the quantity of fluid adsorbed as a function of the film thickness z on a fractal surface is given in the following expression:
N z 3 D
In the equation, N = V/V0, the relative volume, V is the adsorption volume of the sample at equilibrium pressure P, V0 is the monolayer coverage volume, D is the fractal dimension, and z is the radius. Based on the condensation state, the average radius curvature of the interface is as follows:
z ln X 1
In the equation, X = P/P0, the relative pressure, P0 is the saturated vapor pressure of the adsorbed gas. The expression for predicting surface fractal dimension was obtained in a log–log format by substituting Formula (4) with Formula (3):
ln V V 0 = D 3 ln ln P P 0 + C
In the equation, C is a constant.
The surface fractal dimension typically ranges from 2 to 3. When the surface fractal dimension approaches 2, the solid surface is smooth and uniform. Conversely, when the surface fractal dimension approaches 3, it indicates a complex pore structure with highly irregular and rough pore surfaces, leading to increased fluid flow resistance. Fit the nitrogen adsorption data of this study based on Formula (5), as shown in Figure 4
Figure 5 shows the carbon dioxide adsorption curve of deep siliceous shales with different particle sizes. As the curves show, the carbon dioxide adsorption capacity of the siliceous shale has no significant correlation to the particle size. Sample L1 reaches the maximum carbon dioxide adsorption volume at a particle size of 200–400 meshes, whereas Sample L2 reaches the maximum adsorption volume at a particle size of 120–160 meshes, suggesting that there are no pore structures that change the micropores when the silicon-rich shale is crushed to a particle size of 400 meshes.
The porosity calculated using the LP-N2GA and LP-CO2GA experiments is included in Table 3.

4. Discussion

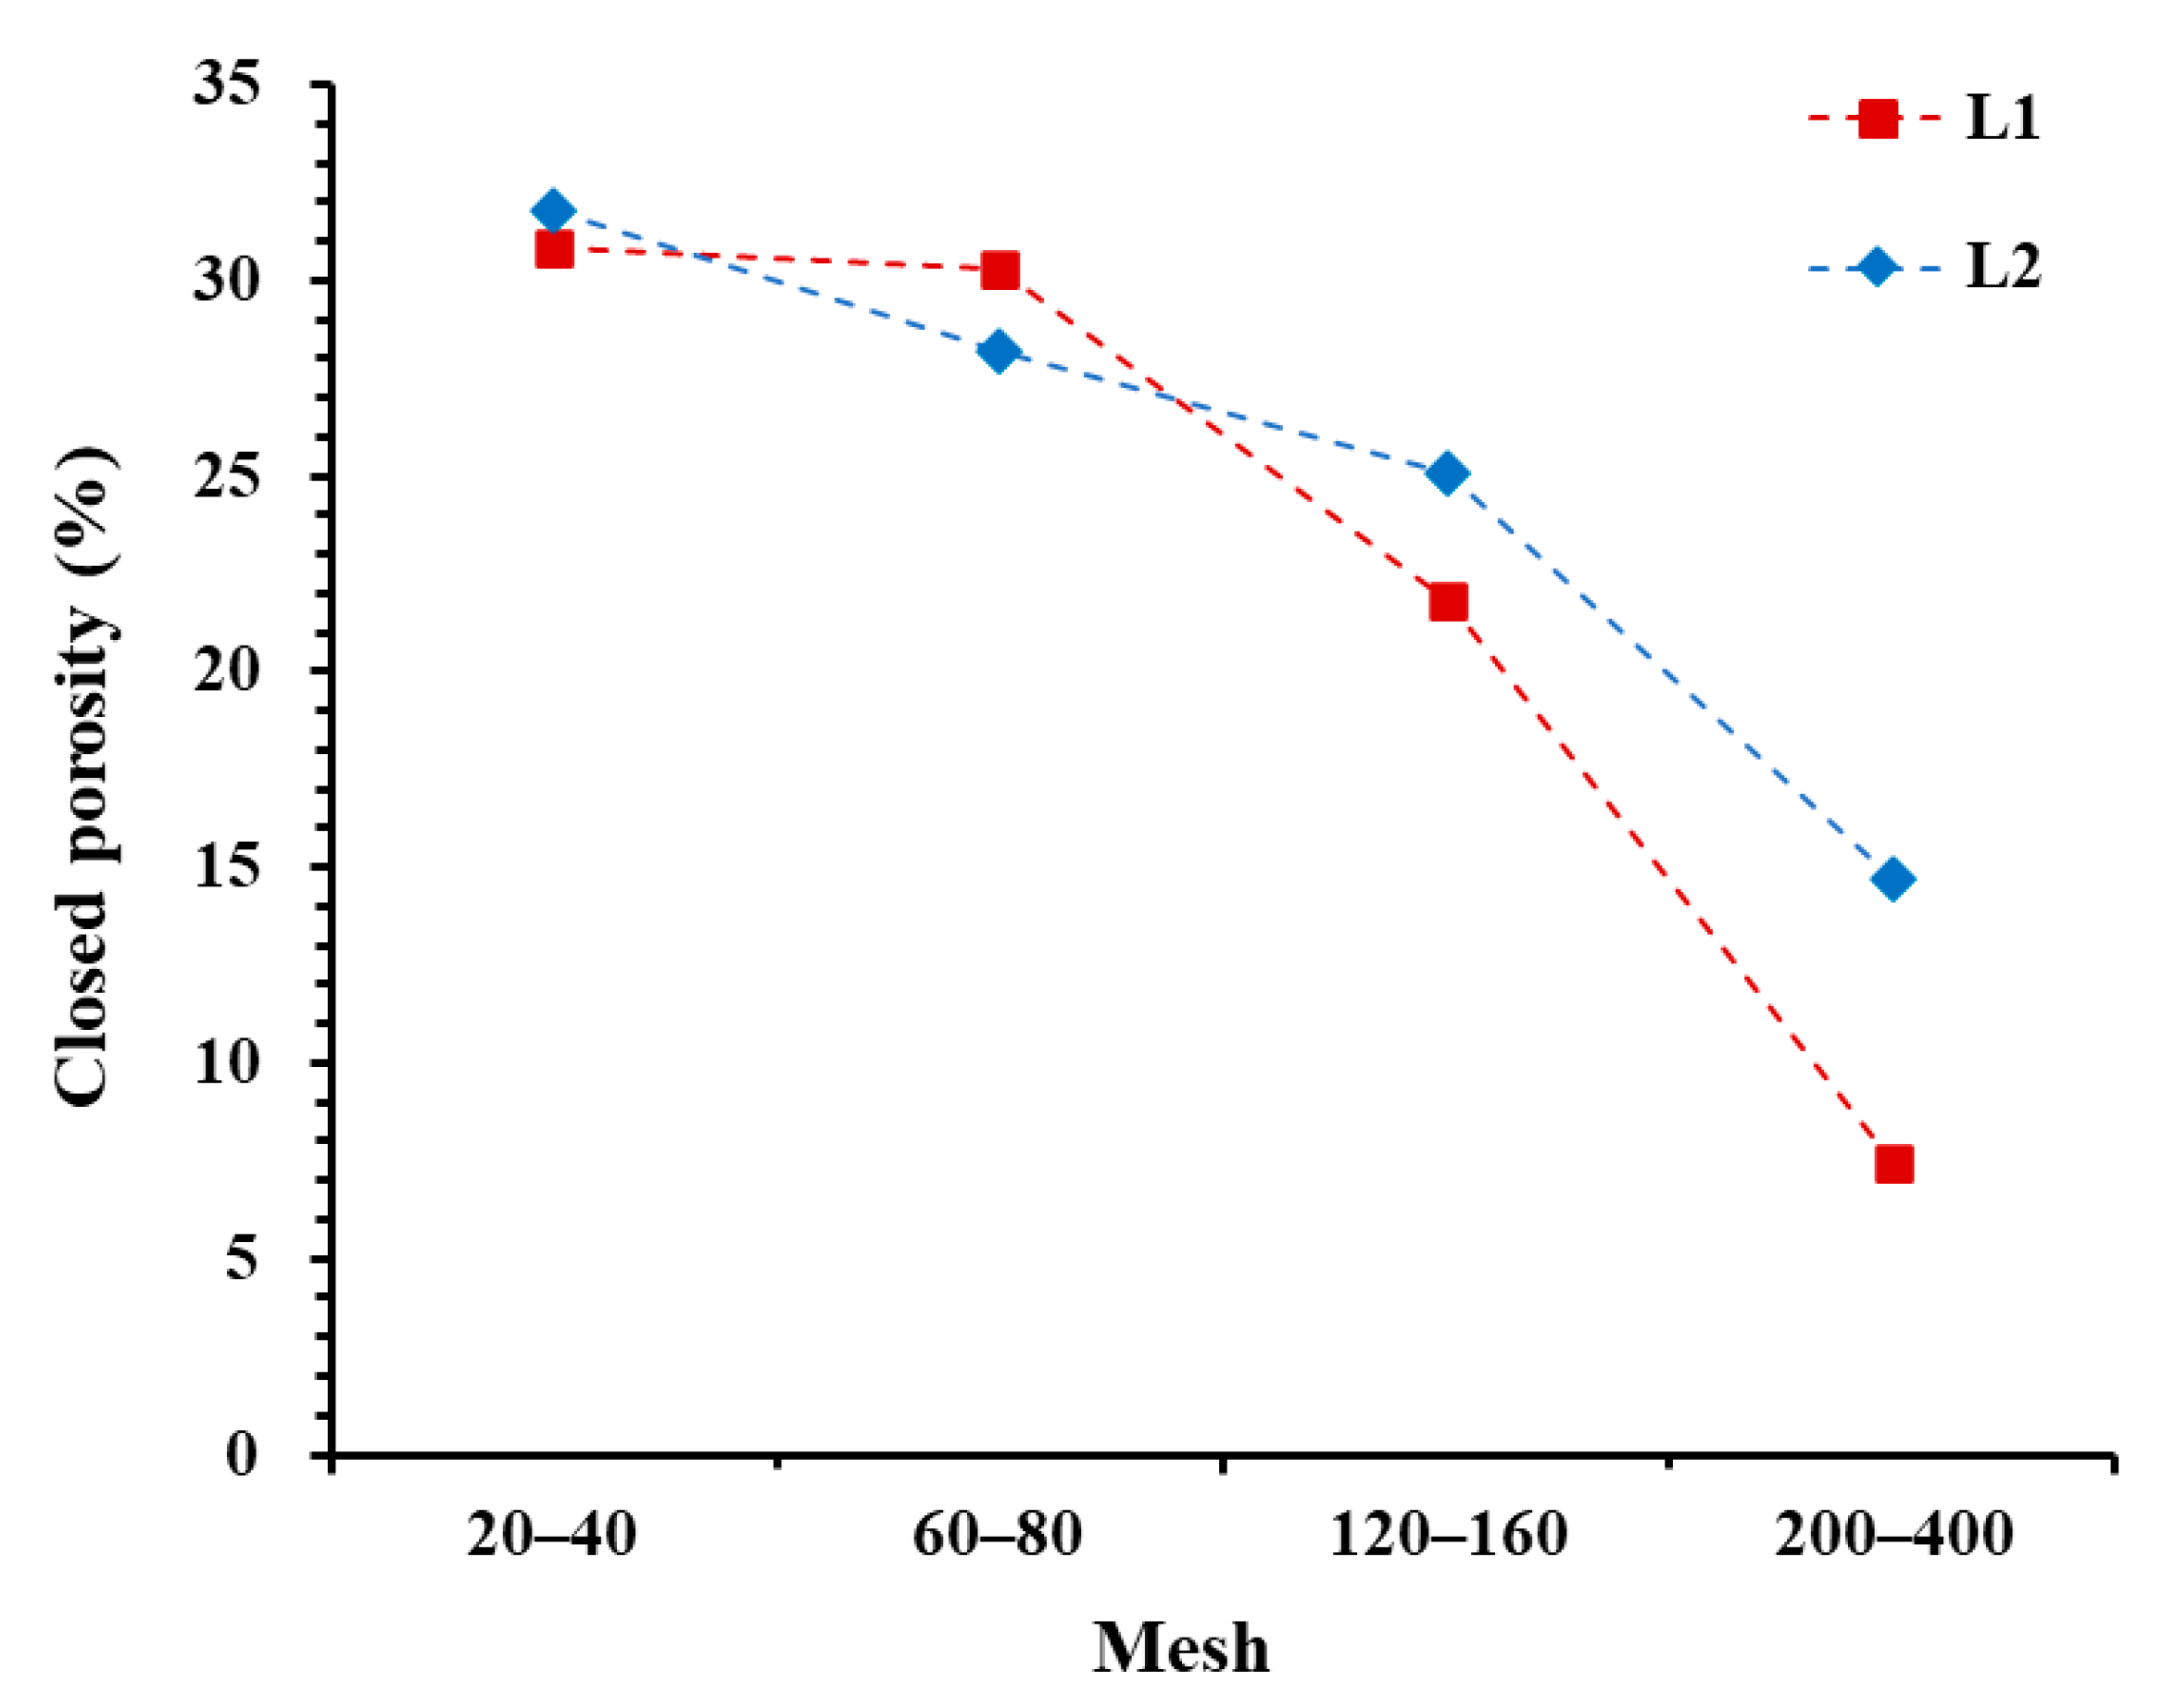
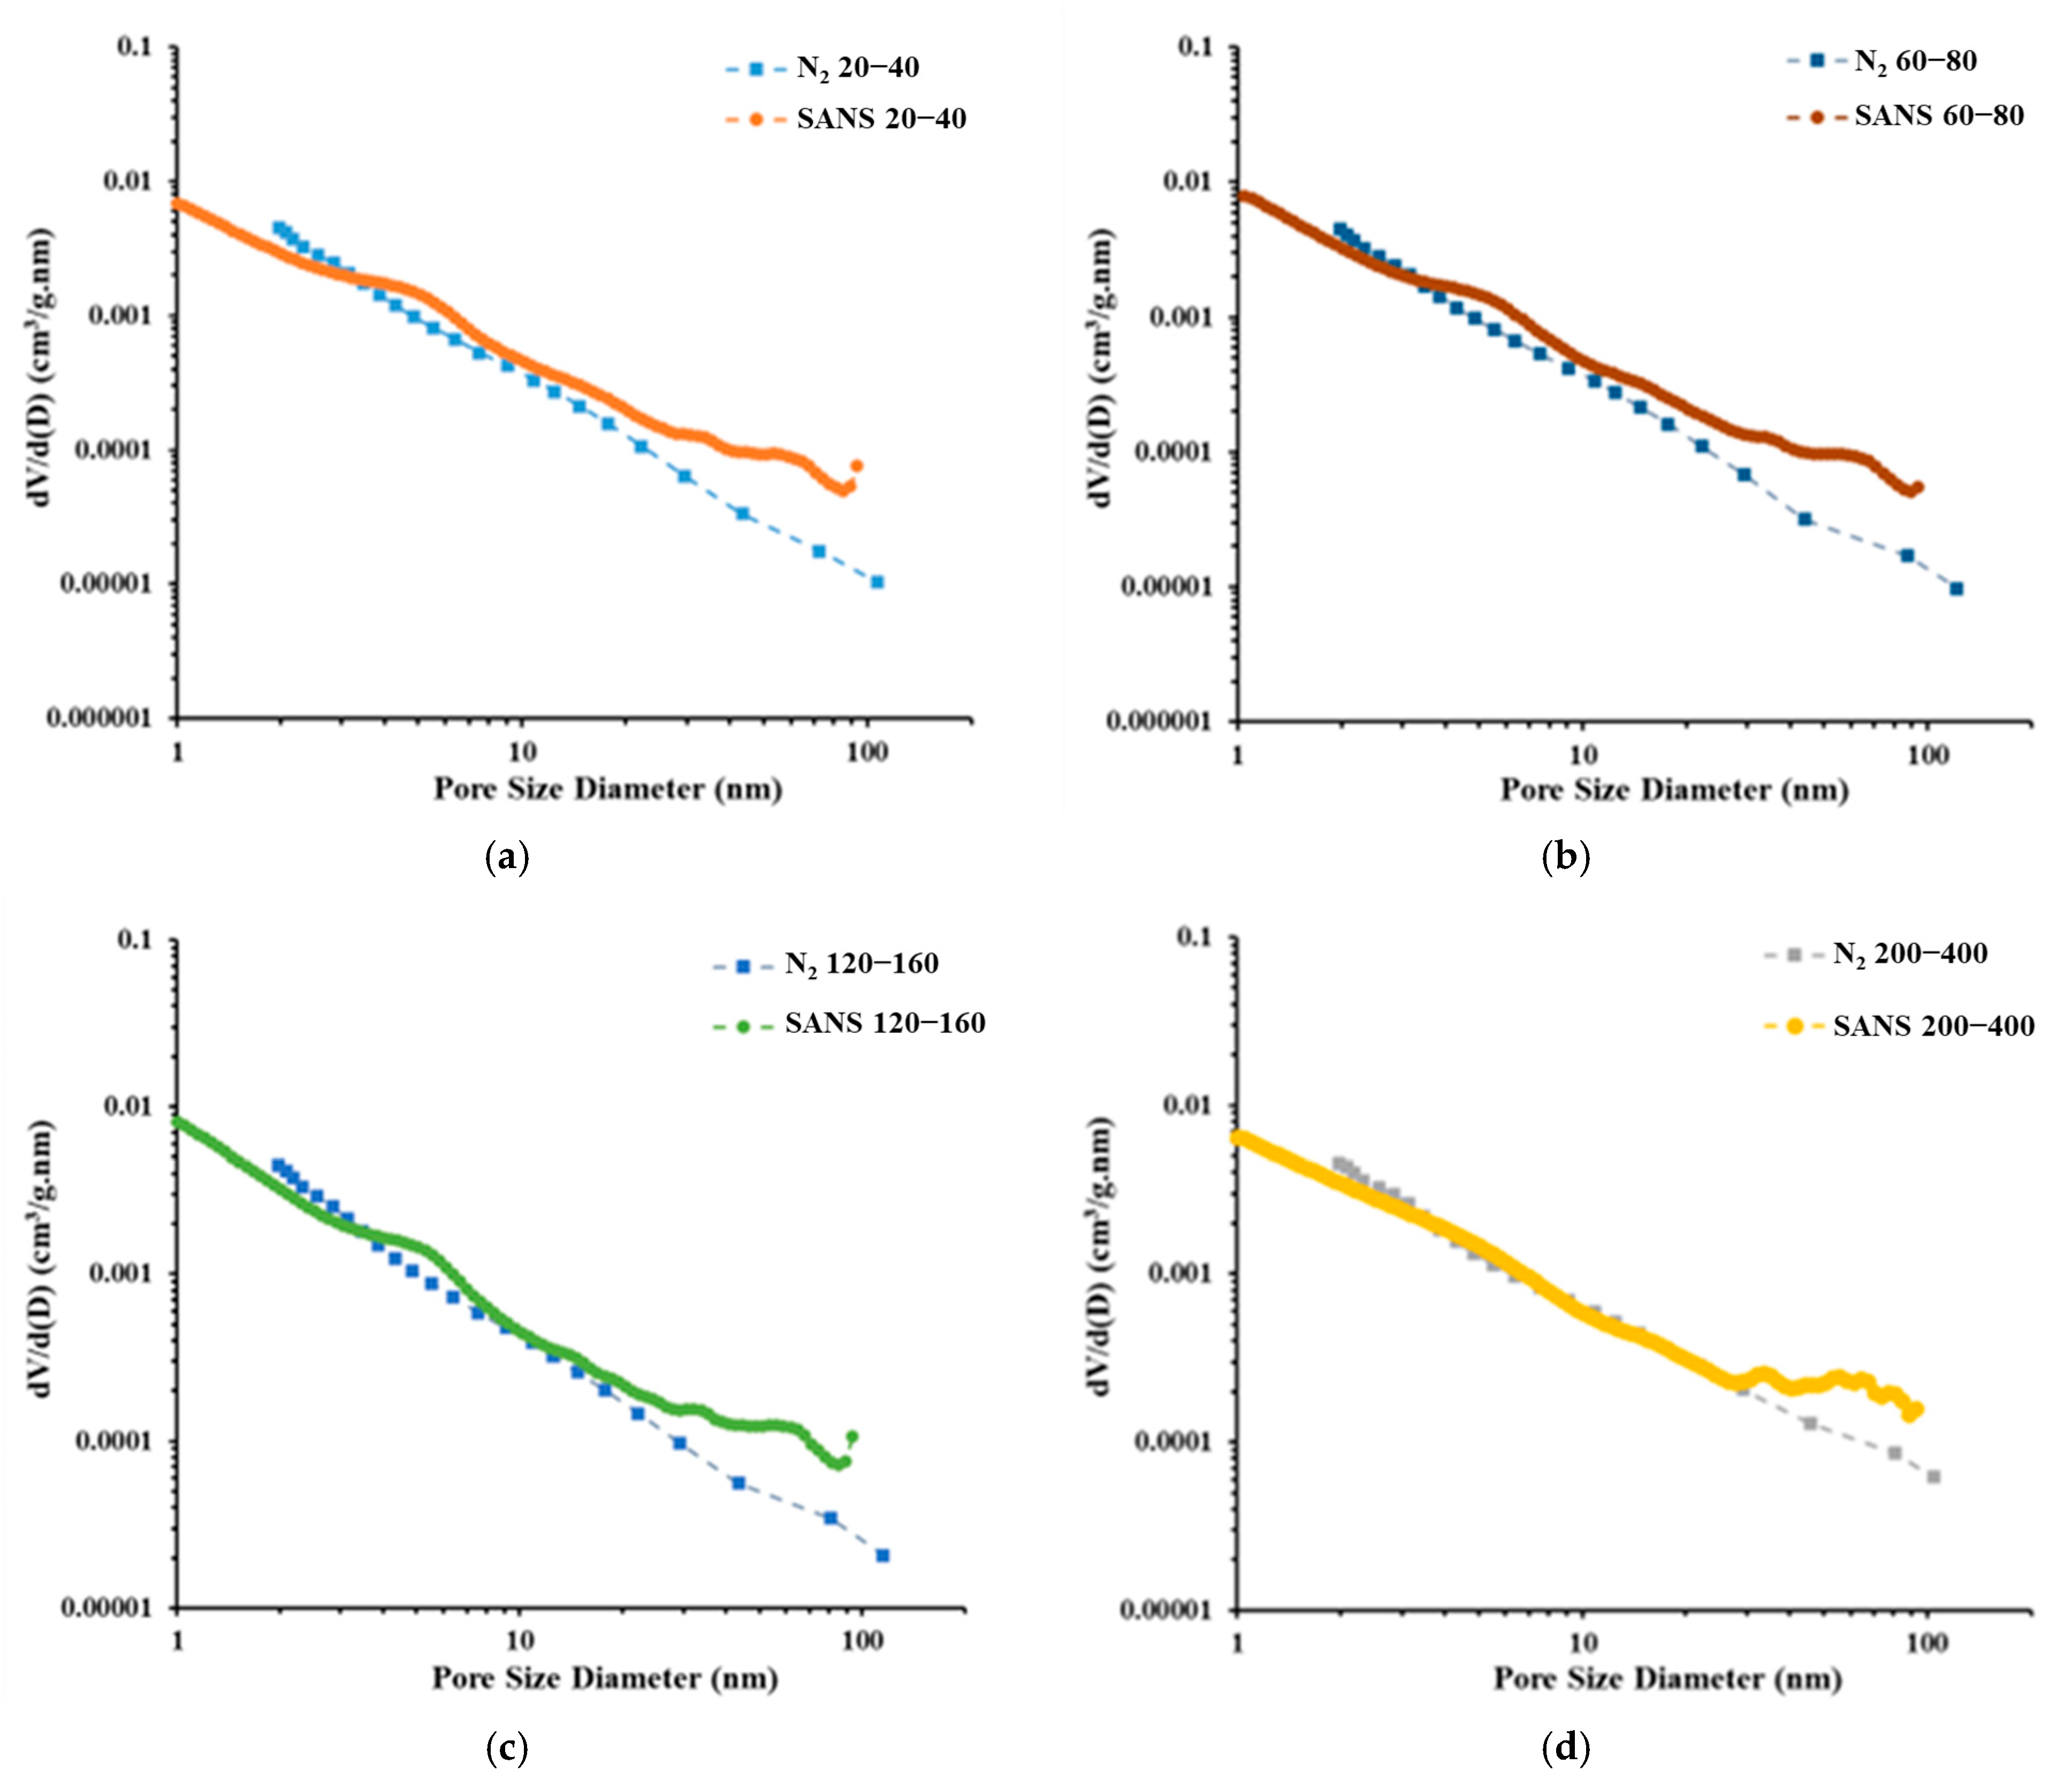
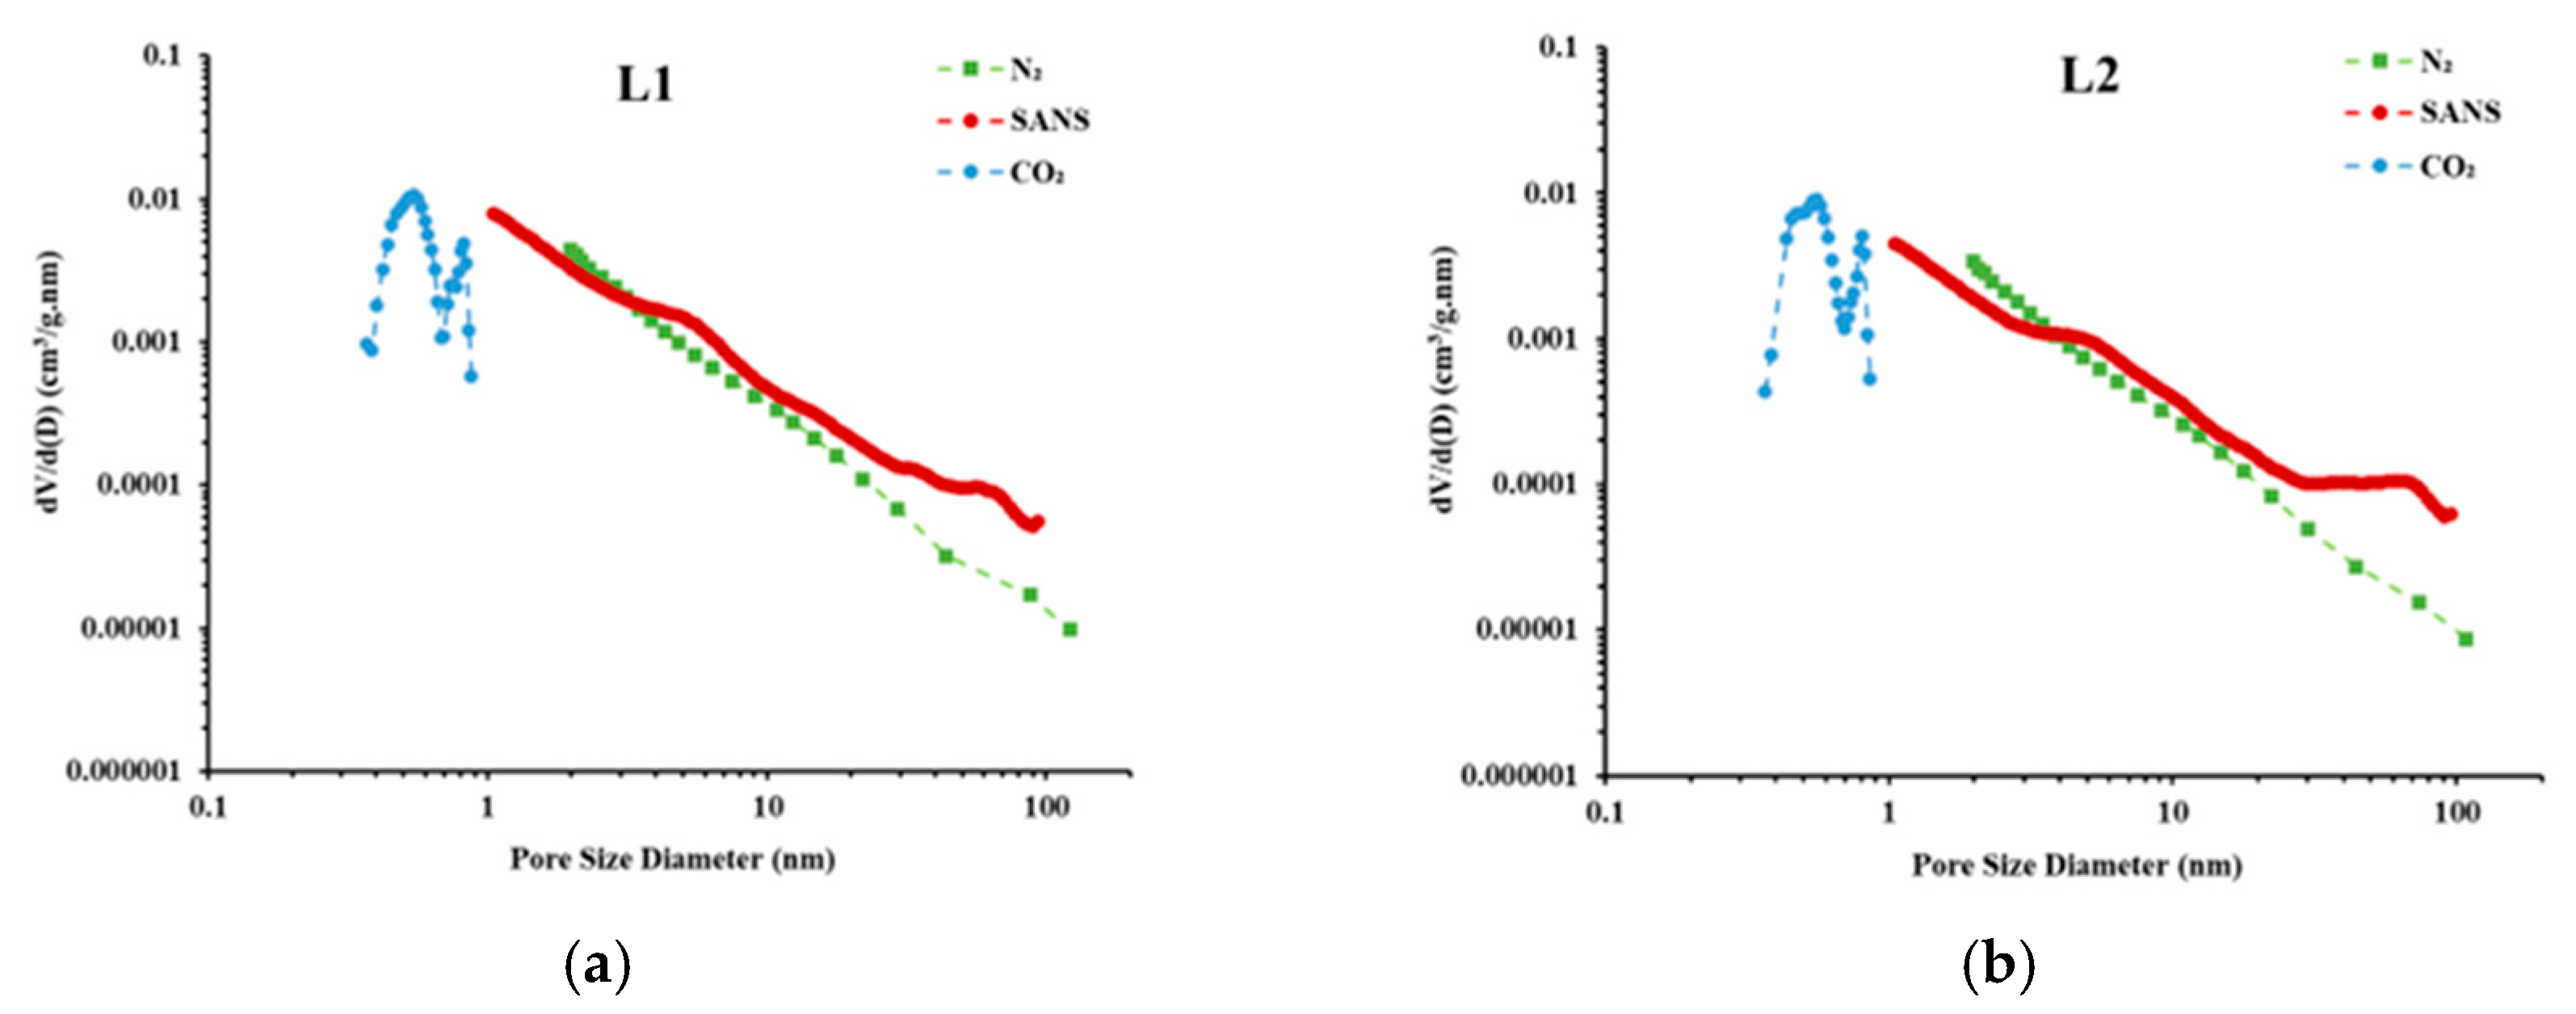
4.1. Porosity and PSD Analysis

The PSD of Samples L1 and L2 measured using LP-N2GA experiments are shown in Figure 6.
The pore volumes of Samples L1 and L2 with a particle size of 20–40 meshes and 60–80 meshes are almost the same, and the variation range of the two samples is only 3.20% and 6.85%, respectively. This indicates that the pore structure characteristics of the 60–80-mesh samples differ from those of the 20–40-mesh samples but that a smaller particle size will effectively reduce the equilibrium time of LP-N2GA. Compared with the 60–80-mesh samples, the pore volume of the 120–160-mesh samples has increased by 19.4% for L1 and 12.1% for L2, while the pore volume of the 200–400-mesh samples increased significantly compared with the 120–160-mesh samples, by 58.2% and 48% for L1 and L2, respectively. In summary, the pore volume of the 200–400-mesh samples in both the L1 and L2 groups has increased by an average of 86.2% than that of the 20–40-mesh samples.
Further analysis of the PSD curve shows that the L1 and L2 samples share similar PSD patterns, with the main pore volume being mesoporous; moreover, the PSD curves of the 20–40-mesh and 60–80-mesh samples basically overlap. Compared with the 60–80-mesh samples, the growth of pore space of the 120–160-mesh samples is mainly concentrated in the pores with a pore diameter above 20 nm. Compared with the 120–160-mesh samples, the increase in pore volume of the 200–400-mesh samples is mainly concentrated in pores with a pore diameter above 5 nm. This suggests that with the decrease in particle size, closed pores with a smaller pore size are connected or artificial pores with a smaller pore size are generated. Establishing a specific proportional relationship between the two types of pores requires a comparative analysis of the results obtained using SANS and LP-N2GA.
Table 2 shows the porosity of micropores measured using LP-CO2GA under different particle sizes. The statistics in the table show that the pore volume of all mesh siliceous shale samples measured using LP-CO2GA remains basically the same. The average carbon dioxide porosity of the L1 samples is 0.61%, where the maximum porosity measured at a particle size of 20–40 meshes is only 15.51% higher than the minimum porosity measured at a particle size of 120–160 meshes. In the case of the L2 samples, the average porosity measured using LP-CO2GA is 0.54%, where the maximum porosity measured using the 120–160-mesh samples is only 13.46% higher than the minimum porosity measured using the 200–400-mesh samples. It indicates that there is no significant correlation between sample particle size and the micropore volume, which means the micropore structure will not be affected when the deep siliceous shale is crushed to 400 meshes.
Table 2 also shows the porosity measured using the SANS experiment and the LP-N2GA experiment at different particle sizes. The pore volume of shale measured using SANS experiments for the L1 and L2 samples also increases with the decreased particle size. This indicates that new artificial pores or microcracks are produced due to shear and compression forces during crushing, which is aligned to the conclusions reached by Hazra et al. (2012) and Chen et al. [15,30]. The growth law of porosity of the L1 and L2 samples with the decrease in particle size measured using SANS was further analyzed, and it was found that there are differences between the L1 and L2 samples. The pore volume growth rate of the L1 samples distributed between 60–80 meshes and 120–160 meshes is only 2.53% and 10.18%, respectively, while that of the 200–400-mesh samples is 34.57%. The pore volume of the L2 samples at each particle size grows by 2.12%, 11.87%, and 31.67% compared to that of the samples with a larger particle size. This can be attributed to the presence of brittle minerals in the samples. The mechanical properties of rocks are closely related not only to the overall content of brittle minerals but to the mechanical performance of single mineral components. Among the components of shales, quartz, feldspar, calcite, dolomite, and pyrite are brittle minerals, with quartz and pyrite having a high brittleness index; non-brittle minerals in shales include illite, montmorillonite, chlorite, and other clay minerals, which have a significantly smaller brittleness index than the brittle minerals. The two samples used in the present work are siliceous shale samples: the overall content of quartz and pyrite in L1 and L2 samples reaches 65.45% and 60.00%, respectively, whereas the content of clay minerals is 22.00% and 17.81%, respectively. Using this logic, the samples used here are defined to have a high brittleness index. Consequently, many artificial pores are generated in the crushing process. Thus, the pore volume of the 200–400-mesh samples is 51.23% higher than that of the 20–40-mesh samples, where the growth rate of the L1 samples is 52.02% and that of the L2 samples is 50.44%. The two samples have a similar growth rate of pore volume. The reason for this is that, although L1 has a higher content of brittle minerals than L2, their content of clay minerals is also higher than L2’s. As a result, the overall brittleness of the two samples remains largely the same, and, hence, they have a similar pore–volume growth rate.
Figure 7 shows the closed porosity of the L1 and L2 samples. The closed porosity is the ratio of the effective porosity to the total porosity of the shale. Here, the porosity measured using LP-N2GA is divided by the porosity measured using SANS. The value of the closed porosity can reflect the connectivity of pores in shale to a certain extent. It is generally believed that a smaller closed porosity corresponds to the stronger connectivity of pores. When the mesh number of samples is 20–160, the porosity of shale samples shows no significant changes, with an average of 27.48%. This shows that the number of the newly generated pores of shale samples within this range of particle sizes is proportional to the number of newly connected closed pores. Therefore, when the mesh number is lower than 160, the crushing does not effectively connect the original closed pores but characterizes the newly generated artificial pores or cracks instead. When the mesh number is 200–400, the closed porosity of the L1 and L2 samples decreases sharply to 7.43% and 13.61%, respectively. This proves that when the samples are highly crushed, the crushing can effectively connect the closed pores.
Figure 8 represents the PSD curves obtained through the SANS experiments. Since the overall porosity is measured using SANS, the new pore space is comprised of artificially new pores produced by crushing new pores. As Figure 8 shows, for Sample L1, within the measurement range of SANS experiments, the pore volume increases significantly with the decrease in the particle size. For Sample L2, on the other hand, with the decrease in the particle size, the pore volume with a diameter greater than 10 nm increases significantly, while that of pores with a particle size of 5–11 nm decreases. This may be attributed to the fact that, in the crushing process, fractures occur along the inherent weak parts of the shale samples, resulting in the disappearance of some micro-fracture pores or connection of adjacent pores to form larger pores. Therefore, as fragmentation intensifies, the pore size of artificial pores gradually decreases. When the shale sample is crushed to a particle size of 60–80 meshes, the crushing has basically no effect on the pore structure of shale. When the shale is crushed to 120–160 meshes, only pores with a pore size larger than 30 nm can be significantly changed. When the shale is crushed to 200–400 meshes, the full-scale pores are changed to varying degrees. Therefore, with the increase in the crushing degree, the crushing effect will change the pore structure of smaller pores, in which the sample broken to 60–80 meshes is basically affected, and the sample broken to 120–160 meshes will affect the pore structure of pores with a pore diameter greater than 30 nm. When the sample is crushed to 200–400 meshes, artificial pores with a pore diameter of 10 nm are generated.
Take Sample L1, for example. Figure 9 shows the PSD of shale samples under different particle sizes measured using LP-N2GA and SANS. As the particle size differs, both the pore closure rates and pore closure distributions of samples vary. The 20–40-mesh samples develop a large number of closed pores, and the closed pores are distributed in pores with a pore diameter more than 3 nm. Both samples of the 60–80 meshes and those of 120–160 meshes develop closed pores mainly in the pores with a pore diameter greater than 4 nm. The PSD of the 200–400-mesh samples measured using SANS are consistent with the nitrogen adsorption measurement result, with only a few closed pores developed in pores with a pore size greater than 30 nm. Obviously, as the fragmentation intensifies, the number of closed pores in shale continues to decrease. This means that the connectivity of shale is increasing.
With the increase in fragmentation, small-aperture pores are effectively interconnected, whereas large-aperture pores remain incompletely connected. This phenomenon may be attributed to the differences in pore types within shale. The shale matrix predominantly develops small-aperture organic pores, along with larger-aperture intraparticle and interparticle pores [31]. Enhanced fragmentation causes the rock skeleton to break along weak planes between different minerals, thereby connecting larger-aperture interparticle pores with smaller-aperture organic pores. However, the larger-aperture intraparticle pores are difficult to interconnect. Consequently, even when the sample reaches 200–400 mesh, a portion of the large-aperture pores remains unconnected, resulting in a closed porosity rate of 7.43% in the sample.
Given the analyses above, in studies on the pore structure, the original pore structure of shales should be preserved as much as possible, and shale samples with large grains should be selected.
When the pore volume is studied through nitrogen adsorption, experimental errors may occur due to incomplete equilibrium caused by the large particle size of samples and insufficient equilibration time. Therefore, it is recommended to use 60–80-mesh shale samples in nitrogen adsorption experiments. For SANS experiments, it is recommended to choose lamellar shale samples to ensure integrity of the pore structure. If crushed shale samples are required, then 60–80-mesh shale samples are recommended. The results of this study were obtained by comparing four groups of samples with different particle sizes. Although our experiments covered 20–400 meshes, it would be better if the experimental samples could be further divided into more groups. In future studies, it is recommended to refine the classification of shale meshes.
As the particle size of 60–80 meshes is the optimal mesh number for studying pore volume, 60–80-mesh shale samples are used in the present work to analyze the PSD characteristics of deep siliceous shale. Marine shales in this region have been subjected to the influences of complex geological formation movements, and the PSD characteristics of the deep shale there remain largely unknown due to the effects of deep burying, temperature, and formation pressure [32]. Figure 10 compares the PSD curves of Samples L1 and L2 obtained using SANS, LP-N2GA, and LP-CO2GA. Deep shale samples, due to dual impacts from strong compaction and overpressure, have fully developed micropores and small mesopores and hence display a PSD pattern dominated by micropores and mesopores. The experiments revealed that micropores and mesopores in deep siliceous shale can provide a pore volume of 0.0153 cm3/g, accounting for 84.36% of the total pore volume, far higher than 45.44%, which is the value in the middle and shallow layer of shale. The development of micropores will lead to the poor connectivity of deep shales; therefore, the deep shale reservoir often produces less gas than middle and shallow shale reservoirs even with the same gas-bearing capacity.
Therefore, in the extraction of deep shale gas, it is essential to sufficiently modify the shale matrix through hydraulic fracturing. Based on the above analysis, it is recommended to adopt a fracturing method characterized by multiple clusters per stage and low flow rate per cluster in the development of deep shale gas. This approach aims to effectively avoid the occurrence of complex situations such as casing deformation, while simultaneously enhancing the connectivity of the shale matrix. Consequently, this method is expected to achieve a higher recovery rate of shale gas per unit reservoir volume.

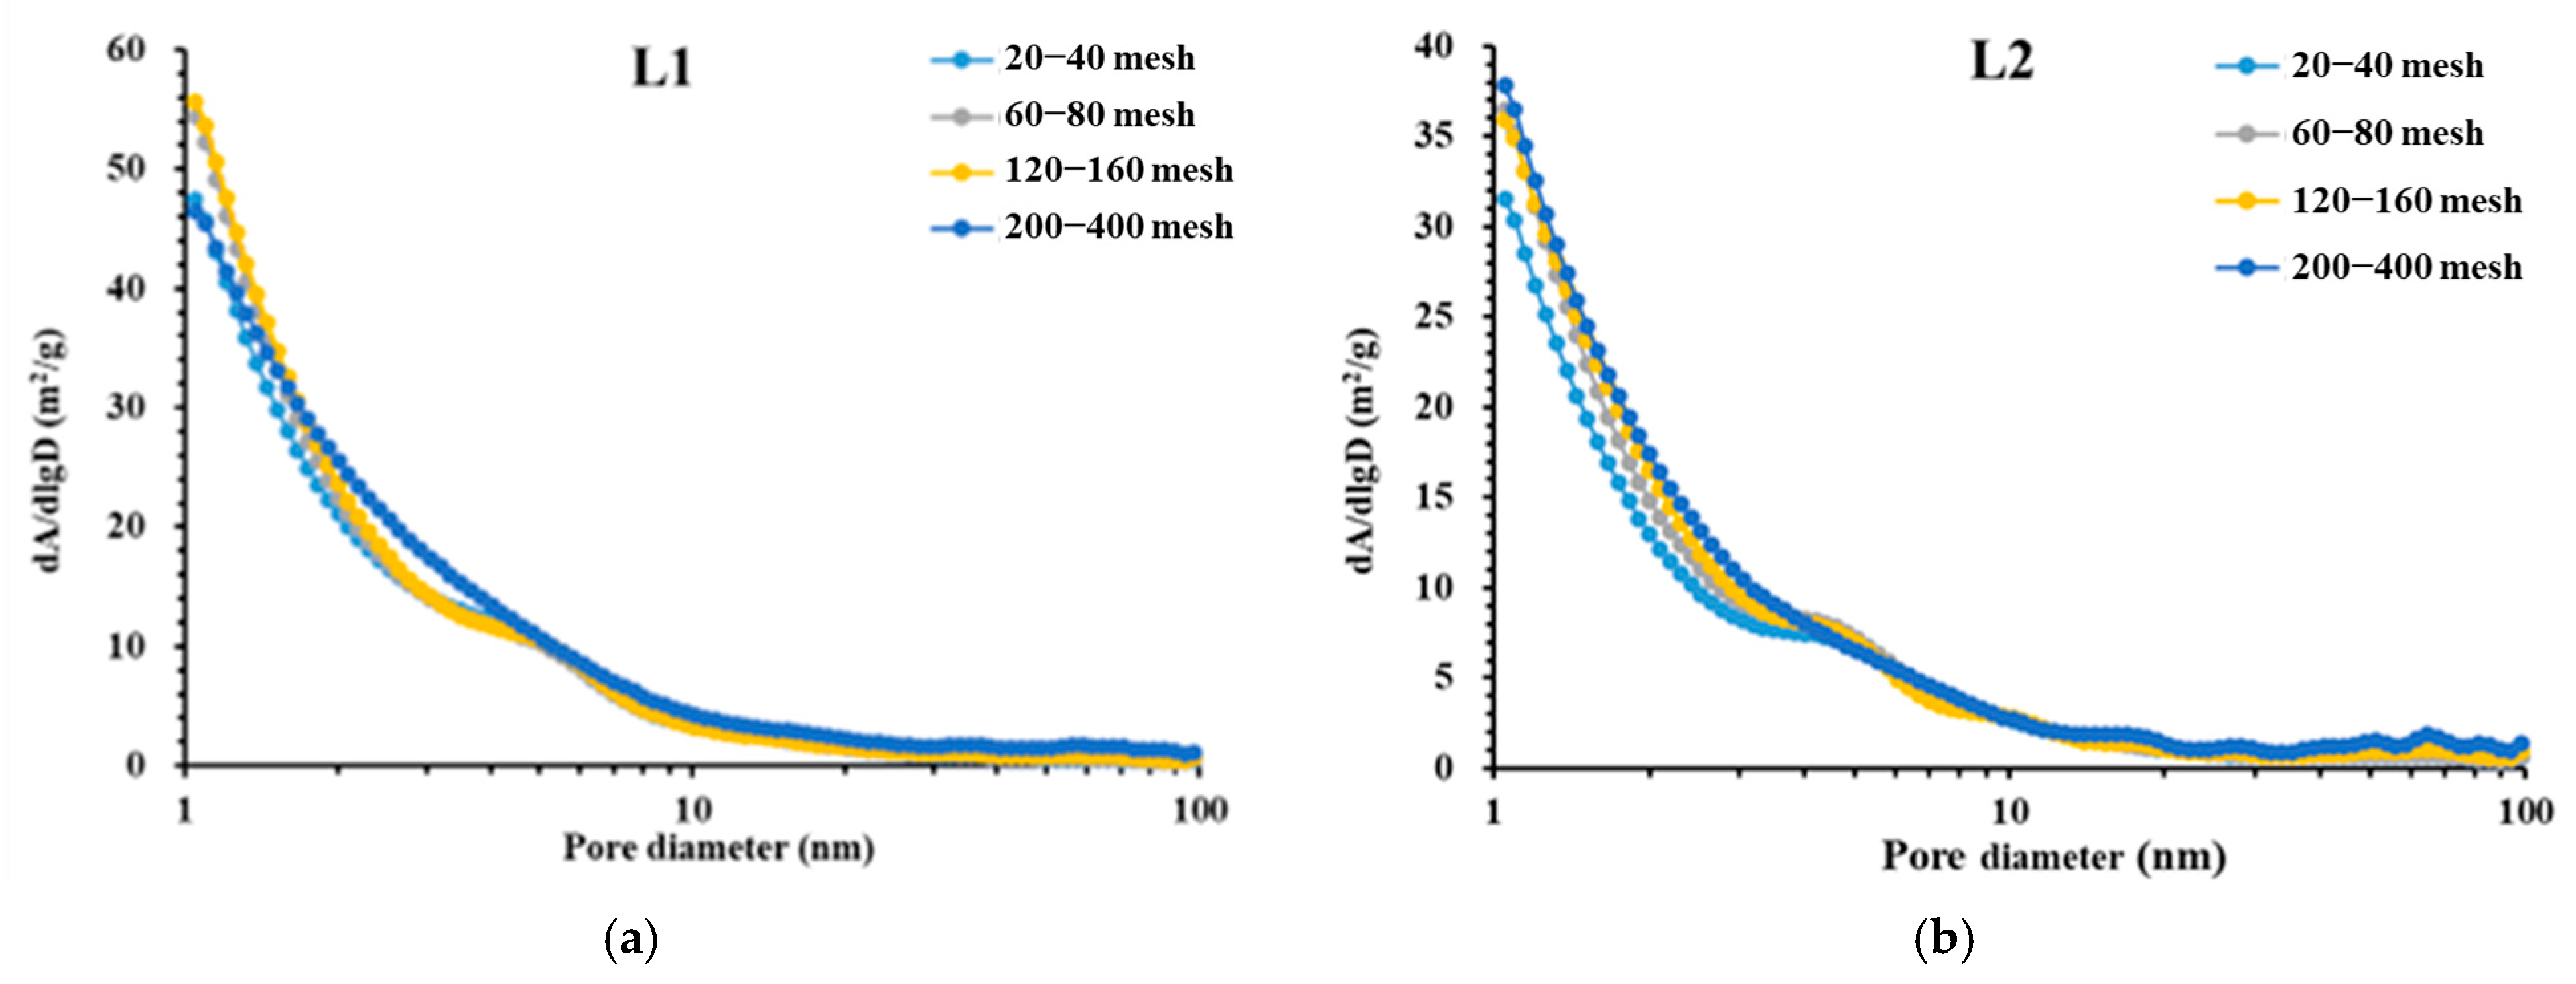
4.2. Specific Surface Area Analysis

Shale gas in the reservoir mainly exists in two states: free state and adsorbed state. A larger specific surface in shale reservoirs means more adsorption points in the shale gas so that there is more adsorbed gas under the same temperature and pressure. It has been reported that the adsorption gas content of shale is proportional to the SSA; therefore, it is also important to identify the SSA of shale gas. As with the measurement of PSD, the measurement of SSA mainly relies on LP-N2GA and LP-CO2GA. Therefore, SANS experiments were introduced in this study to explore the influence of the particle size on the SSA of shale.
Figure 11 displays the specific surface distribution curve of two shale samples measured using SANS. As the curves show, there is no significant difference in the total specific surface area between shale samples with different mesh sizes. The total SSA of the 200–400-mesh L1 samples is only 15.4% higher than that of the 20–40-mesh samples, and the total SSA of the 200–400-mesh L2 samples is only 17.59% higher than that of the 20–40-mesh samples. This means that changes in the mesh size will not significantly affect the total SSA of shale. The effective SSA measured by nitrogen adsorption had relatively obvious changes. The effective SSA of the 200–400-mesh L1 samples is 34.19% higher than that of the 20–40-mesh samples, and the effective SSA of the 200–400-mesh L2 sample increased by 25.90% compared with that of the 20–40-mesh samples. Overall, the total SSA changes little despite the strengthened crushing effect. The reason for this is that the SSA of deep shale is mainly provided by small-aperture pores. An analysis of PSD of shale revealed that, with the strengthening of crushing, artificial pores with a pore size greater than 10 nm increase, and these pores can provide 8.13% of the overall SSA of the shale. Therefore, the specific surface of shale will not change significantly with the increase in fracture.
Table 4 shows the SSA of all samples measured using SANS and LP-N2GA. The average SSA measured using SANS is 325.18% of that measured using LP-N2GA, which indicates that there are a large number of closed pores in deep shale, and the nitrogen adsorption experiment underestimates the adsorption capacity of deep shale and hence cannot effectively characterize the SSA. Moreover, the SSA of deep shale is mainly provided by micropores (pore size less than 2 nm), which contribute 55.35% to the total SSA on average. Therefore, different from shallow shale gas reservoirs, deep shale gas reservoirs experience a significant increase in the content of adsorbed gas. Consequently, the deep share gas reservoirs can maintain a continued production by sufficient adsorption gas after the initial supply of free gas.

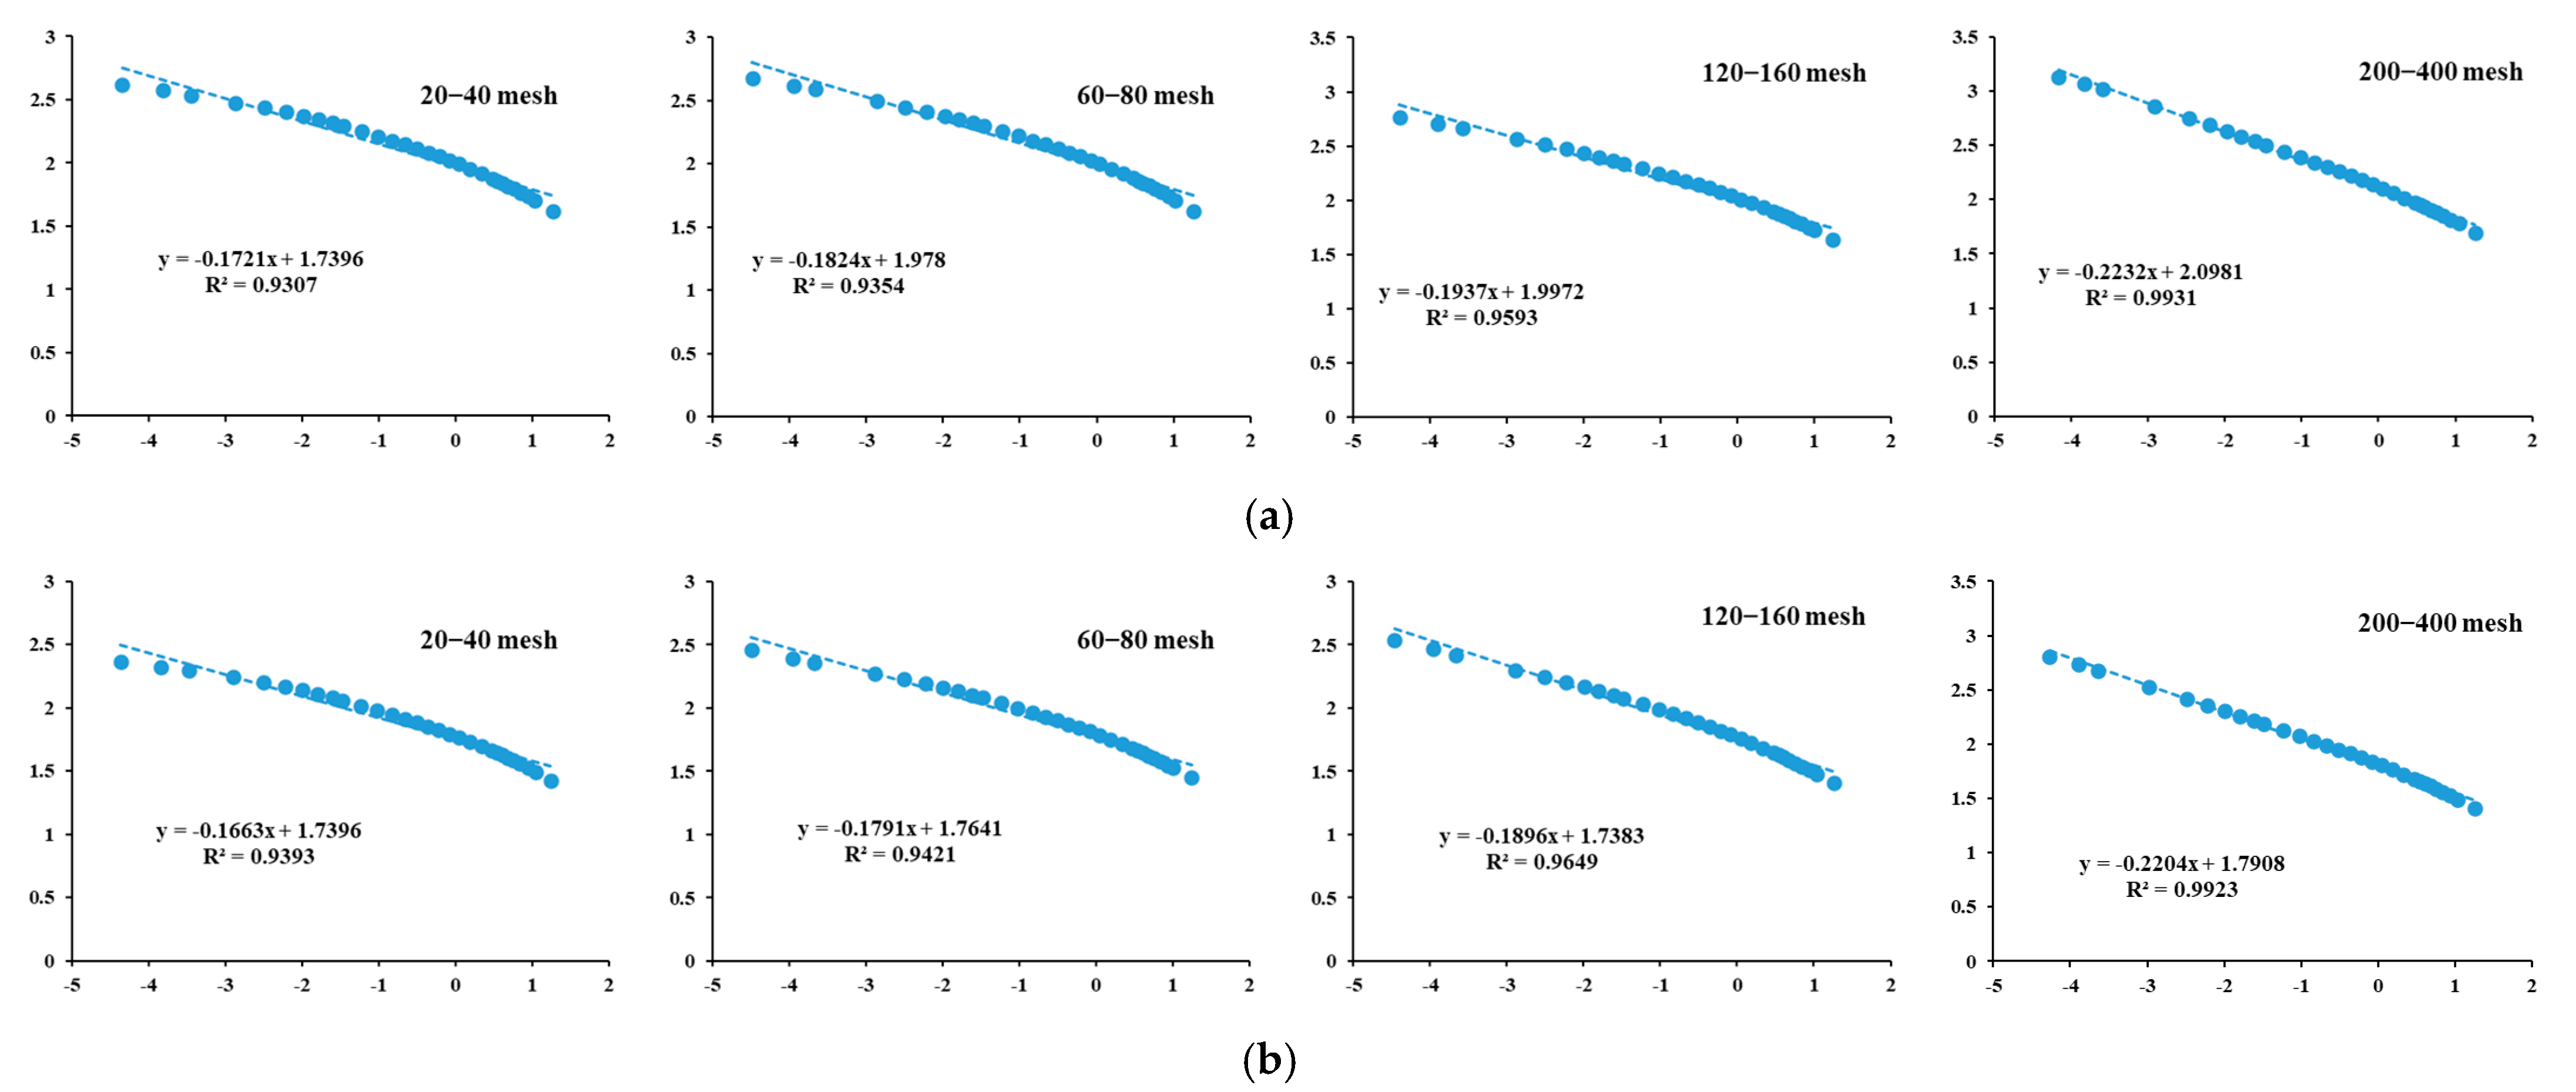
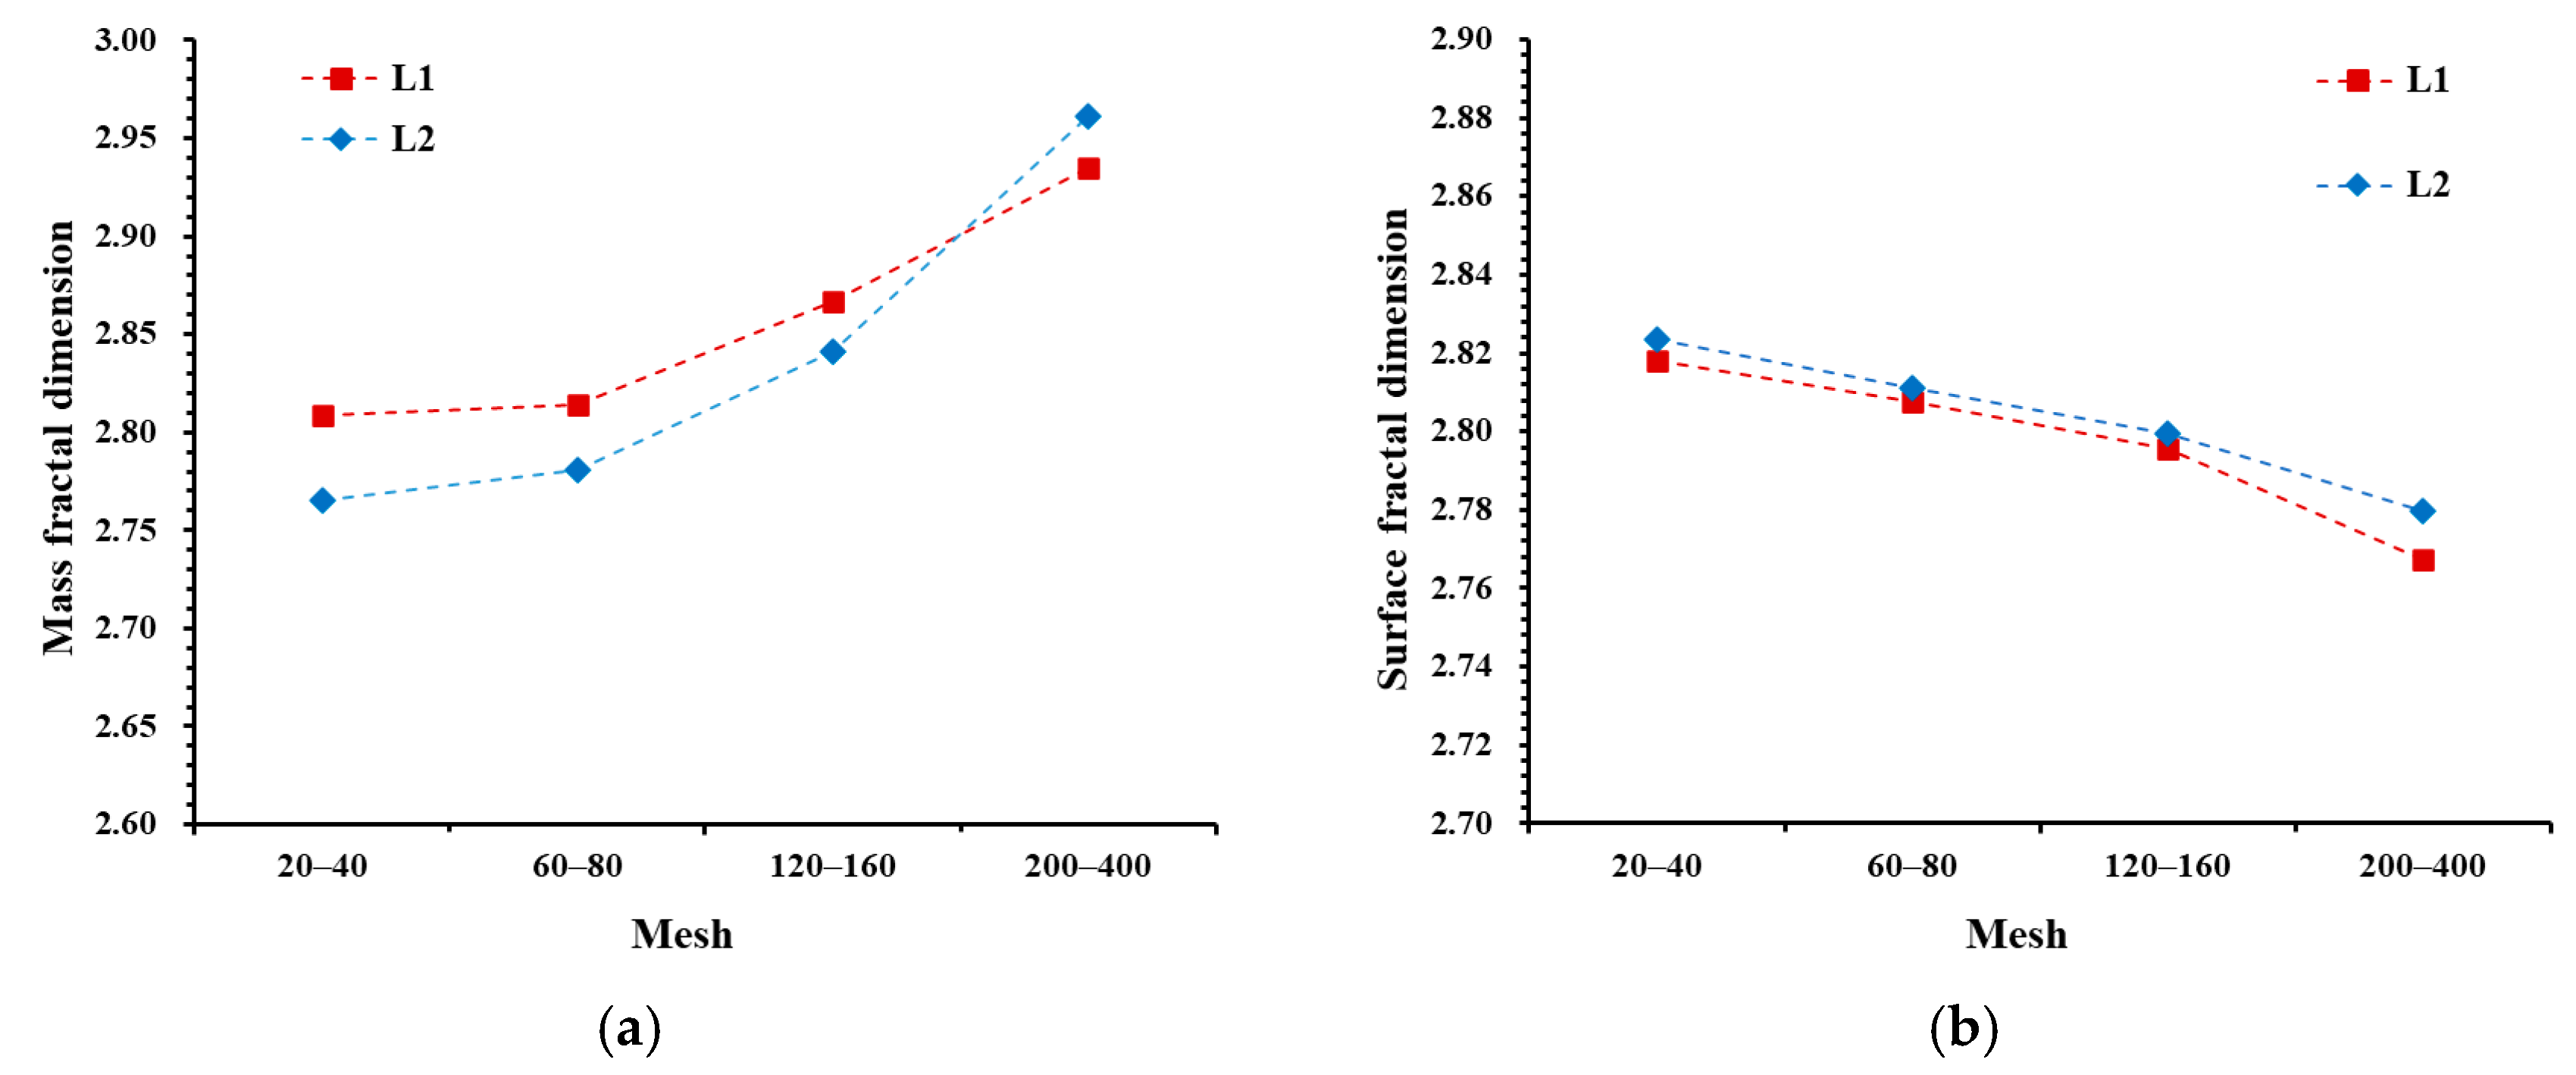
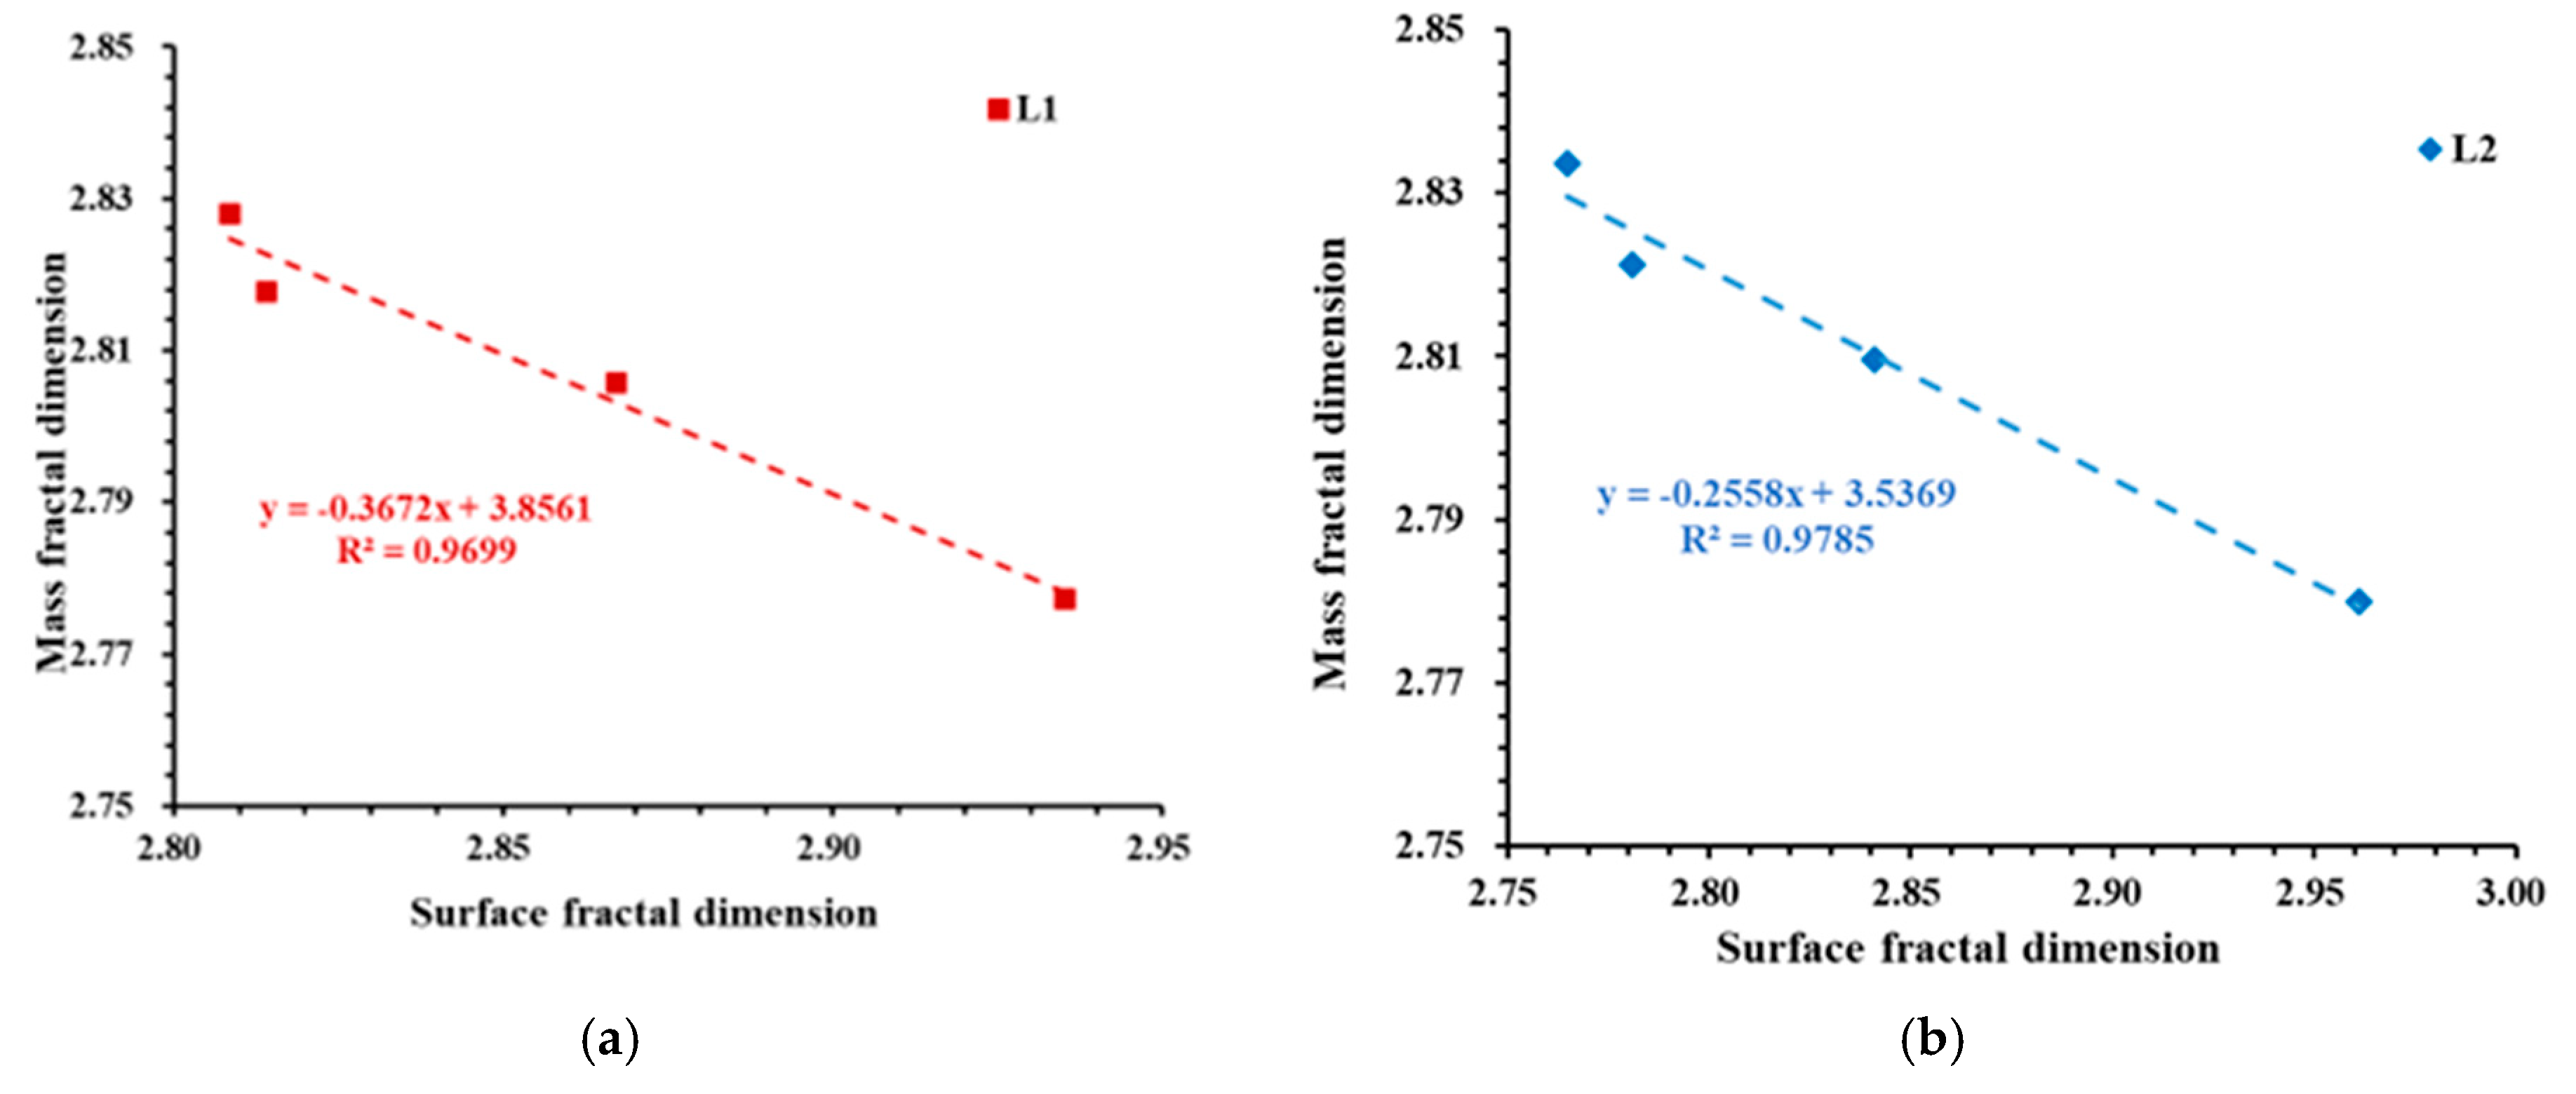
4.3. Fractal Dimension Analysis

Shale samples exhibit dual fractal characteristics, encompassing both surface fractal and mass fractal properties. Traditionally, the fractal dimension calculated from the LP-N2GA experiments represents the surface fractal dimension. In the shale pore structure system, a larger surface fractal dimension corresponds to a higher roughness of the pore structure.
In this study, we employed the Frenkel–Halsey–Hill (FHH) model proposed by Pfeifer to calculate the surface fractal dimension. Additionally, the power–law exponent (DD) of the fitted scattering intensity curve, after background signal removal, was used as the mass fractal dimension. Figure 12 illustrates the computed mass and surface fractal dimensions in our study.
This research investigates the effect of crushing on the fractal characteristics of shale and the underlying reasons for these changes in fractal features. It is important to note that in neutron scattering data analysis, the fractal model and the PSD model are mutually contradictory. Therefore, when analyzing the relationship between mass fractal dimension and pore structure parameters such as PSD distribution and specific surface area distribution, only data obtained from nitrogen adsorption experiments were considered.
As shown in Table 3, the average mass fractal dimensions of all 20–40-mesh, 60–80-mesh, 120–160-mesh, and 200–400-mesh samples are 2.682, 2.711, 2.801, and 2.953, respectively. The mass fractal dimension of both samples increases as particle size decreases. Specifically, the mass fractal dimension of the 200–400-mesh samples is, on average, 10.12% higher than that of the 20–40-mesh samples. This indicates that the heterogeneity of the pore distribution of deep organic-rich siliceous shale increases with the decrease in particle size. The reason for this is that the samples used in our experiments are deep siliceous shale. As mentioned before, the deep siliceous shale has developed a large number of small pores comprised of micropores and mesopores; therefore, it has a concentrated PSD pattern, a lower level of heterogeneity, and, hence, a lower mass fractal dimension. As the particle size reduces, more macropores develop in the shale pore structure, leading to a higher level of heterogeneity, and, hence, a larger mass fractal dimension. Therefore, analysis based on shale samples with an excessively large mesh size is likely to overestimate the shale’s mass fractal dimension and hence overestimate the heterogeneity of the shale PSD.
For the L1 sample, the mass fractal dimension of the 200–400-mesh sample increased by 11.4% compared to the 20–40-mesh sample, which is greater than the 8.84% increase observed in the L2 sample. This indicates that with increased crushing, the heterogeneity variation in the pore distribution of the L1 sample is higher than that of the L2 sample. The reason for this trend is similar to the previously analyzed porosity changes and can be attributed to the higher brittle mineral index of the L1 sample compared to the L2 sample.
The analysis of the surface fractal dimension of samples with different mesh sizes reveals that the average surface fractal dimension of samples with 20–40 meshes, 60–80 meshes, 120–160 meshes, and 200–400 meshes are 2.821, 2.810, 2.798, and 2.769, respectively. The fractal dimension of all samples decreases as the particle size decreases, indicating that the surface of the pores of deep siliceous shale reduces as the particle size decreases. The reason behind this is similar to that for the changes in the mass fractal dimension: more macropores are generated as the particle size reduces, and the surface of macropores is less rough than that of micropores and mesopores. Thus, as more macropores are generated, the surface of the pore structure of the shale reduces; hence, a smaller surface fractal dimension is obtained. However, the maximum difference in the average surface fractal dimension between samples is 0.052, which is smaller than the difference of mass fractal dimension, i.e., 0.0161, indicating that the surface fractal dimension shows less changes than the mass fractal dimension with the decreasing particle size. The reason for this is that the surface fractal dimension characterizes the surface roughness, which is affected by the SSA of the shale sample, whereas the mass fractal dimension characterizes the homogeneity of the PSD of the shale, which is mainly affected by the PSD of the shale. The analysis of PSD and SSA distribution in the present work shows that the PSD presents more changes than the SSA as the particle size of deep siliceous shale decreases. Therefore, the changes in the surface fractal dimension are less than those in the mass fractal dimension.
Figure 13 shows the correlation between surface fractal dimension and mass fractal dimension. The quality fractal dimension and surface fractal dimension are strongly negatively correlated (R2 = 0.97). This is because the deep shale samples used in this experiment mainly develop micropores and mesopores with small pore diameters. The fractal dimension of the quality of the sample increases as the particle size decreases, which is due to the formation of larger pores during the process. As the proportion of large pores increases, the pore surface roughness of the core decreases, leading to a reduction in the surface fractal dimension. Therefore, there is a negative correlation between the quality fractal dimension and the surface fractal dimension of deep shale.
The calculation of the fractal characteristics entails highly linear correlations in the fitting process. In the calculation of the mass fractal dimension, the samples of all mesh sizes maintain a high correlation coefficient, reaching 0.996, and the mass fractal dimension obtained using SANS has a high accuracy. Different from the case of mass fractal dimension, the correlation coefficient of the calculation of the surface fractal dimension significantly increases as the particle size decreases, and the fitting correlation coefficient reaches 0.995 only when the mesh size is 200–400 but stays below 0.97 at other mesh sizes.

4.4. Experimental Errors and Prospects

This article investigates the impact of fragmentation on the fractal characteristics and pore structure parameters of shale. In nitrogen adsorption experiments using a sample located in southern Sichuan, China, the small-scale spaces between shale particles may be partially filled with nitrogen, leading to an overestimation of the pore space volume of the shale. This effect becomes more pronounced as the particle size of the experimental samples decreases. However, the overall impact is relatively minor, as the minimum particle size of the experimental samples is 38 μm (400 mesh), which is still more than 200 times larger than the measurable pore diameter. The study employs two sets of experimental samples, leading to relevant research, and the results from both sets exhibit good consistency. Nevertheless, attention should be paid to the potential limitations of the experimental results, and it is anticipated that future researchers will conduct more replications.
This article systematically explores the pore structure of granular earth science samples and provides the optimal shale sample morphology for neutron scattering and nitrogen adsorption. Based on this foundation, researchers can, in the future, conduct combined measurements using small-angle neutron scattering and ultra-small-angle neutron scattering to investigate the effects of fragmentation on the pore structure of shale. This approach aims to characterize changes in the pore structure of macropores with sizes ranging from 100 nm to 10 μm.
At the same time, the accurate evaluation of pore structure has important academic and industrial significance. For instance, the magnitude of the surface fractal dimension is positively correlated with the specific surface area, which determines the content of adsorbed gas in shale gas extraction, thereby influencing resource assessment and development efficacy. A profound understanding of fractal characteristics also holds significant implications for carbon neutrality. Under the high-temperature and high-pressure conditions of deep shale, CO2 may exist in a supercritical state, and research on fractal pore structures can assess its impact on the adsorption capacity and sequestration stability of supercritical CO2. In terms of geology, we can also explore how fractal characteristics evolve under different thermal maturity conditions, and so on. Consequently, based on the research presented in this article, we will conduct further additional related studies based on appropriate geoscientific samples.

5. Conclusions

In the present work, SANS, LP-N2GA, and LP-CO2GA are combined to investigate the pore characteristics of shales. The effect of particle size on pore volume and SSA is quantitatively analyzed. Furthermore, the effect of changes in the structure of relevant basic holes on fractal characteristics is analyzed. The following conclusions are reached:
(1)
Particle size significantly influences the pore volume measured using LP-N2GA. The pore volume of the 200–400-mesh shale samples is 1.86 times that of the 20–40-mesh samples, primarily due to the increase in mesopores and macropores. However, particle size has no significant effect on the pore volume measured using LP-CO2GA. This indicates that when the sample is crushed to 400 mesh, the crushing process does not alter the micropore structure.
(2)
Increased crushing leads to the continuous generation of new artificial pores. Compared to the 20–40-mesh samples, the 200–400-mesh shale samples with high brittle mineral content generate 58% more artificial pores. However, connectivity does not improve in the early stages of crushing. The closed porosity of the 120–160-mesh samples is only reduced by an average of 7.86% compared to the 20–40-mesh samples. When the particle size reaches 200–400 mesh, the closed porosity decreases significantly, leading to an effective improvement in connectivity. Therefore, to ensure the accuracy of shale pore structure, it is recommended to use 60–80-mesh samples for experiments using powder samples.
(3)
Crushing has a minor impact on the SSA of deep shale. The total SSA of the 200–400-mesh samples is only 16.5% higher on average than that of the 20–40-mesh samples. The SSA of deep shale is mainly contributed by micropores (pore diameter < 2 nm), which account for an average of 55.35% of the total SSA.
(4)
The mass fractal dimension of deep shale samples increases as particle size decreases. Compared to the 20–40-mesh samples, the mass fractal dimension of the 200–400-mesh samples increases by an average of 10.12%. Therefore, analyses based on small-particle shale samples may overestimate the mass fractal dimension of shale, thereby overestimating the heterogeneity of the shale PSD.
(5)
As particle size decreases, more macropores are generated, and the surface of macropores is smoother than that of micropores and mesopores. Consequently, the surface fractal dimension of deep shale samples decreases with decreasing particle size.

Author Contributions

Conceptualization, H.Z. and X.L. methodology, H.Z.; software, Z.H.; validation, L.C. and W.S.; formal analysis, W.G.; investigation, Y.Z.; resources, W.H.; data curation, H.Z.; writing—original draft preparation, Z.H. and W.S.; writing—review and editing, H.Z.; visualization, X.L.; supervision, Z.H.; project administration, L.C.; funding acquisition, X.L. All authors have read and agreed to the published version of the manuscript.

Funding

This research was funded by the 14th Five-Year Plan of the Ministry of Science and Technology of PetroChina (No. 2021DJ1901) and the Demonstration Project of the National Science and Technology Major Project of the Ministry of Science and Technology of China (No. 2016ZX05062-002-001).

Data Availability Statement

Due to privacy concerns, data are unavailable.

Conflicts of Interest

All authors declare that the research was conducted in the absence of any commercial or financial relationships that could be construed as a potential conflict of interest.

Abbreviations

The following abbreviations are used in this manuscript:
SANSsmall-angle neutron scattering
LP-N2GAlow-pressure nitrogen gas adsorption
LP-CO2GAlow-pressure carbon dioxide gas adsorption
LPGAlow-pressure gas adsorption
CSNSChina Spallation Neutron Source
BETBrunauer–Emmett–Teller
DFTdensity functional theory
SLDscattering length density
TOCtotal organic carbon
PSDMpolydisperse size distribution model
PSDpore size distribution
SSAspecific surface area
XRDX-ray diffraction

References

  1. Vidic, R.D.; Brantley, S.L.; Vandenbossche, J.M.; Yoxtheimer, D.; Abad, J.D. Impact of shale gas development on regional water quality. Science 2013, 340, 1235009. [Google Scholar] [CrossRef] [PubMed]
  2. Ma, X.H.; Zhang, X.W.; Xiong, W.; Liu, Y.Y.; Gao, J.L.; Yu, R.Z.; Sun, Y.P.; Wu, J.; Kang, L.X.; Zhao, S.P. Prospects and challenges of shale gas development in China. Pet. Sci. Bulletin 2023, 4, 491–501. [Google Scholar] [CrossRef]
  3. Liu, Z.; Pan, Z.; Li, S.; Zhang, L.; Wang, F.; Han, L.; Zhang, J.; Ma, Y.; Li, H.; Li, W. Study on the effect of cemented natural fractures on hydraulic fracture propagation in volcanic reservoirs. Energy 2022, 241, 122845. [Google Scholar] [CrossRef]
  4. Zou, X.; Li, X.; Zhang, J.; Li, H.; Guo, M.; Zhao, P. Characteristics of pore structure and gas content of the lower Paleozoic shale from the Upper Yangtze plate, south China. Energies 2021, 14, 7603. [Google Scholar] [CrossRef]
  5. Hu, H.; Zhang, T.; Wiggins-Camacho, J.D.; Ellis, G.S.; Lewan, M.D.; Zhang, X. Experimental investigation of changes in methane adsorption of bitumen-free Woodford Shale with thermal maturation induced by hydrous pyrolysis. Mar. Pet. Geol. 2015, 59, 114–128. [Google Scholar] [CrossRef]
  6. Liang, L.; Xiong, J.; Liu, X. An investigation of the fractal characteristics of the Upper Ordovician Wufeng Formation shale using nitrogen adsorption analysis. J. Nat. Gas Sci. Eng. 2015, 27, 402–409. [Google Scholar] [CrossRef]
  7. Sun, J.; Dong, X.; Wang, J.; Schmitt, D.R.; Xu, C.; Mohammed, T.; Chen, D. Measurement of total porosity for gas shales by gas injection porosimetry (GIP) method. Fuel 2016, 186, 694–707. [Google Scholar] [CrossRef]
  8. Xu, H.; Tang, D.; Zhao, J.; Li, S. A precise measurement method for shale porosity with low-field nuclear magnetic resonance: A case study of the Carboniferous–Permian strata in the Linxing area, eastern Ordos Basin, China. Fuel 2015, 143, 47–54. [Google Scholar] [CrossRef]
  9. Yang, F.; Ning, Z.; Kong, D.; Liu, H. Pore structure of shales from high pressure mercury injection and nitrogen adsorption method. Nat. Gas Geosci. 2013, 24, 450–455. [Google Scholar]
  10. Li, T.; Tian, H.; Xiao, X.; Cheng, P.; Wang, X.; Wu, Y.; Wu, Z. The effect of particle size on low-pressure gas adsorption experiments for high-maturity shale. Nat. Gas Geosci. 2020, 31, 1271–1284. [Google Scholar]
  11. Mastalerz, M.; Hampton, L.; Drobniak, A.; Loope, H. Significance of analytical particle size in low-pressure N2 and CO2 adsorption of coal and shale. Int. J. Coal Geol. 2017, 178, 122–131. [Google Scholar] [CrossRef]
  12. Wei, M.; Xiong, Y.; Zhang, L.; Li, J.; Peng, P.A. The effect of sample particle size on the determination of pore structure parameters in shales. Int. J. Coal Geol. 2016, 163, 177–185. [Google Scholar] [CrossRef]
  13. Li, J.; Zhou, S.; Fu, D.; Li, Y.; Ma, Y.; Yang, Y.; Li, C. Changes in the pore characteristics of shale during comminution. Energy Explor. Exploit. 2016, 34, 676–688. [Google Scholar] [CrossRef]
  14. Han, H.; Cao, Y.; Chen, S.J.; Lu, J.G.; Huang, C.X.; Zhu, H.H.; Zhan, P.; Gao, Y. Influence of particle size on gas-adsorption experiments of shales: An example from a Longmaxi shale sample from the Sichuan Basin, China. Fuel 2016, 186, 750–757. [Google Scholar] [CrossRef]
  15. Hazra, B.; Wood, D.A.; Vishal, V.; Singh, A.K. Pore characteristics of distinct thermally mature shales: Influence of particle size on low-pressure CO2 and N2 adsorption. Energy Fuels 2018, 32, 8175–8186. [Google Scholar] [CrossRef]
  16. Yang, R.; Jia, A.; He, S.; Hu, Q.; Dong, T.; Hou, Y.; Yan, J. Water adsorption characteristics of organic-rich Wufeng and Longmaxi shales, Sichuan Basin (China). J. Pet. Sci. Eng. 2020, 193, 107387. [Google Scholar] [CrossRef]
  17. Yang, R.; He, S.; Hu, Q.; Sun, M.; Hu, D.; Yi, J. Applying SANS technique to characterize nano-scale pore structure of Longmaxi shale, Sichuan Basin (China). Fuel 2017, 197, 91–99. [Google Scholar] [CrossRef]
  18. Zhang, J.; Cheng, G. Technical aspects of the pore structure in shale measured by small-angle and ultrasmall-angle neutron scattering: A mini review. Energy Fuels 2021, 35, 1957–1965. [Google Scholar] [CrossRef]
  19. Radliński, A.P.; Boreham, C.J.; Lindner, P.; Randl, O.; Wignall, G.D.; Hinde, A.; Hope, J.M. Small angle neutron scattering signature of oil generation in artificially and naturally matured hydrocarbon source rocks. Org. Geochem. 2000, 31, 1–14. [Google Scholar] [CrossRef]
  20. Liu, Z.; Liu, D.; Cai, Y.; Yao, Y.; Pan, Z.; Zhou, Y. Application of nuclear magnetic resonance (NMR) in coalbed methane and shale reservoirs: A review. Int. J. Coal Geol. 2020, 218, 103261. [Google Scholar] [CrossRef]
  21. Hazra, B.; Vishal, V.; Singh, D.P. Applicability of low-pressure CO2 and N2 adsorption in determining pore attributes of organic-rich shales and coals. Energy Fuels 2021, 35, 456–464. [Google Scholar] [CrossRef]
  22. Zhang, L.; Xiong, Y.; Li, Y.; Wei, M.; Jiang, W.; Lei, R.; Wu, Z. DFT modeling of CO2 and Ar low-pressure adsorption for accurate nanopore structure characterization in organic-rich shales. Fuel 2017, 204, 1–11. [Google Scholar] [CrossRef]
  23. Ruppert, L.F.; Sakurovs, R.; Blach, T.P.; He, L.; Melnichenko, Y.B.; Mildner, D.F.R.; Alcantar-Lopez, L. A USANS/SANS Study of the Accessibility of Pores in the Barnett Shale to Methane and Water. Energy Fuels 2013, 27, 772–779. [Google Scholar] [CrossRef]
  24. Clarkson, C.R.; Freeman, M.; He, L.; Agamalian, M.; Melnichenko, Y.B.; Mastalerz, M.; Bustin, R.M.; Radliński, A.P.; Blach, T.P. Characterization of tight gas reservoir pore structure using USANS/SANS and gas adsorption analysis. Fuel 2012, 95, 371–385. [Google Scholar] [CrossRef]
  25. Bahadur, J.; Melnichenko, Y.B.; Mastalerz, M.; Furmann, A.; Clarkson, C.R. Hierarchical pore morphology of Cretaceous shale: A small-angle neutron scattering and ultrasmall-angle neutron scattering study. Energy Fuels 2014, 28, 6336–6344. [Google Scholar] [CrossRef]
  26. Sun, M.; Yu, B.; Hu, Q.; Zhang, Y.; Li, B.; Yang, R.; Melnichenko, Y.B.; Cheng, G. Pore characteristics of Longmaxi shale gas reservoir in the northwest of Guizhou, China: Investigations using small-angle neutron scattering (SANS), helium pycnometry, and gas sorption isotherm. Int. J. Coal Geol. 2017, 171, 61–68. [Google Scholar] [CrossRef]
  27. Sing, K.S.W.; Everett, D.H.; Haul, R.a.W.; Moscou, L.; Pierotti, R.A.; Rouquerol, J.; Siemieniewska, T. Reporting physisorption data for gas/solid systems with special reference to the determination of surface area and porosity (Recommendations 1984). Pure Appl. Chem. 1985, 57, 603–619. [Google Scholar] [CrossRef]
  28. Liu, K.; Ostadhassan, M.; Jang, H.W.; Zakharova, N.V.; Shokouhimehr, M. Comparison of fractal dimensions from nitrogen adsorption data in shale via different models. RSC Adv. 2021, 11, 2298–2306. [Google Scholar] [CrossRef]
  29. Pfeifer, P.; Avnir, D. Chemistry in non-integer dimensions between two and three. I. Fractal theory of heterogeneous surfaces. J. Chem. Phys. 1983, 79, 3558–3565. [Google Scholar] [CrossRef]
  30. Chen, Y.; Wei, L.; Mastalerz, M.; Schimmelmann, A. The effect of analytical particle size on gas adsorption porosimetry of shale. Int. J. Coal Geol. 2015, 138, 103–112. [Google Scholar] [CrossRef]
  31. Yang, F.; Zheng, F.; Hu, C.; Wang, B.; Peng, K.; Liu, H. Characterization of microscopic pore structures in shale reservoirs. Acta Petrolei Sinica 2013, 34, 301–311. [Google Scholar]
  32. Han, L.; Li, X.; Guo, W.; Ju, W.; Cui, Y.; Liu, Z.; Qian, C.; Shen, W. Characteristics and dominant factors for natural fractures in deep shale gas reservoirs: A case study of the Wufeng-Longmaxi Formations in Luzhou block, southern China. Lithosphere 2022, 2022, 9662175. [Google Scholar] [CrossRef]
Figure 1. SANS intensity curve of samples L1 and L2 under different particle sizes: (a) Sample L1; (b) Sample L2.
Fractalfract 09 00165 g001
Figure 2. SANS intensity curve of samples L1 and L2 under different particle sizes after removing background signals. The red dashed line is the fitting line. The scattering intensity of samples with different mesh sizes has been multiplied by coefficients for ease of observation: (a) Sample L1; (b) Sample L2.
Fractalfract 09 00165 g002
Figure 3. LP-N2GA curves of Samples L1 and L2 under different particle sizes: (a) Sample L1; (b) Sample L2.
Fractalfract 09 00165 g003
Figure 4. Surface fractal dimension fitting curve of shale samples with different mesh numbers in the same group. The blue dashed line is the fitting line: (a) Sample L1; (b) Sample L2.
Fractalfract 09 00165 g004
Figure 5. LP-CO2GA curves of Samples L1 and L2 under different particle sizes: (a) Sample L1; (b) Sample L2.
Fractalfract 09 00165 g005
Figure 6. PSD curves of Samples L1 and L2 under different pore sizes measured using LP-N2GA experiments: (a) Sample L1; (b) Sample L2.
Fractalfract 09 00165 g006
Figure 7. Closed porosity of all shale samples.
Fractalfract 09 00165 g007
Figure 8. The PSD curves in SANS experiments under different mesh sizes: (a) Sample L1; (b) Sample L2.
Fractalfract 09 00165 g008
Figure 9. PSD curves measured using SANS and LP-N2GA for Sample L2 with different mesh numbers: (a) 20–40 mesh; (b) 60–80 mesh; (c) 120–160 mesh; (d) 200–400 mesh.
Fractalfract 09 00165 g009
Figure 10. Comparison of PSD curves measured using SANS and LPGA for Sample L2 with different mesh numbers: (a) Sample L1; (b) Sample L2.
Fractalfract 09 00165 g010
Figure 11. SSA distribution curves of samples with different mesh sizes based on SANS: (a) Sample L1; (b) Sample L2.
Fractalfract 09 00165 g011
Figure 12. Fractal dimension of shale samples with different mesh numbers: (a) mass fractal dimension; (b) surface fractal dimension.
Fractalfract 09 00165 g012
Figure 13. The relationship between fractal dimension of shale sample quality and surface fractal dimension: (a) L1; (b) L2.
Fractalfract 09 00165 g013
Table 1. Shale composition (wt.%) analysis results and SLD.
Sample No.TOCQuartzCalciteDolomitePlagioclasePyriteIlliteMontmorilloniteChloriteDensity
(g/cm3)
SLD
(1010·cm−2)
L13.8161.342.523.696.344.1116.042.823.142.454.08
L24.3756.987.5712.12.523.0214.722.50.592.534.22
Table 2. Main parameters calculated based on SANS.
Sample No.MeshMass Fractal DimensionFractal Fitting EquationR2QminQmaxPorod Porosity (%)
L120–402.706 Y = 0.00035 X 2.706 0.9980.005150.287025.94
60–802.720 Y = 0.0004 0 X 2.720 0.9980.005150.3623566.09
120–1602.810 Y = 0.00035 X 2.810 0.9980.005150.3042416.71
200–4002.945 Y = 0.00044 X 2.945 0.9990.005150.2554479.03
L220–402.658 Y = 0.00054 X 2.658 0.9960.005150.1908854.75
60–802.680 Y = 0.00061 X 2.680 0.9960.005150.2707734.85
120–1602.791 Y = 0.00062 X 2.791 0.9940.005150.2707735.43
200–4002.961 Y = 0.00052 X 2.961 0.9970.005150.2707737.15
Table 3. Main parameters calculated based on LPGA.
Sample No.MeshSurface Fractal DimensionFractal Fitting EquationR2Nitrogen Porosity
(%)
Carbon Dioxide
Porosity (%)
Closed Porosity (%)
L120–402.828 Y = 0.1721 X + 1.7396 0.9314.120.6730.67
60–802.818 Y = 0.1824 X + 1.9780 0.9354.240.6230.37
120–1602.806 Y = 0.1937 X + 1.9972 0.9595.250.5821.82
200–4002.777 Y = 0.2232 X + 2.0981 0.9938.360.597.43
L220–402.834 Y = 0.1663 X + 1.7396 0.9393.300.5331.81
60–802.821 Y = 0.1791 X + 1.7641 0.9423.530.5328.16
120–1602.810 Y = 0.1896 X + 1.7383 0.9654.120.5925.10
200–4002.780 Y = 0.2204 X + 1.7908 0.9926.180.5214.68
Table 4. SSA of all samples.
Sample No.MeshSANS SSA (m2/g)LP-N2GA SAS (m2/g)
L120–4041.5012.19
60–8044.1212.15
120–16045.8113.01
200–40047.9116.36
L220–4028.479.13
60–8030.369.33
120–16031.299.63
200–40033.4811.50
Disclaimer/Publisher’s Note: The statements, opinions and data contained in all publications are solely those of the individual author(s) and contributor(s) and not of MDPI and/or the editor(s). MDPI and/or the editor(s) disclaim responsibility for any injury to people or property resulting from any ideas, methods, instructions or products referred to in the content.

