1. Introduction
Due to various geological processes such as tectonic movements, volcanic activity, weathering, and erosion, rock masses in the crust produce various scales of randomly distributed defects (discontinuities), including microcracks, fissures, pores, joints, and faults [
1,
2,
3] (
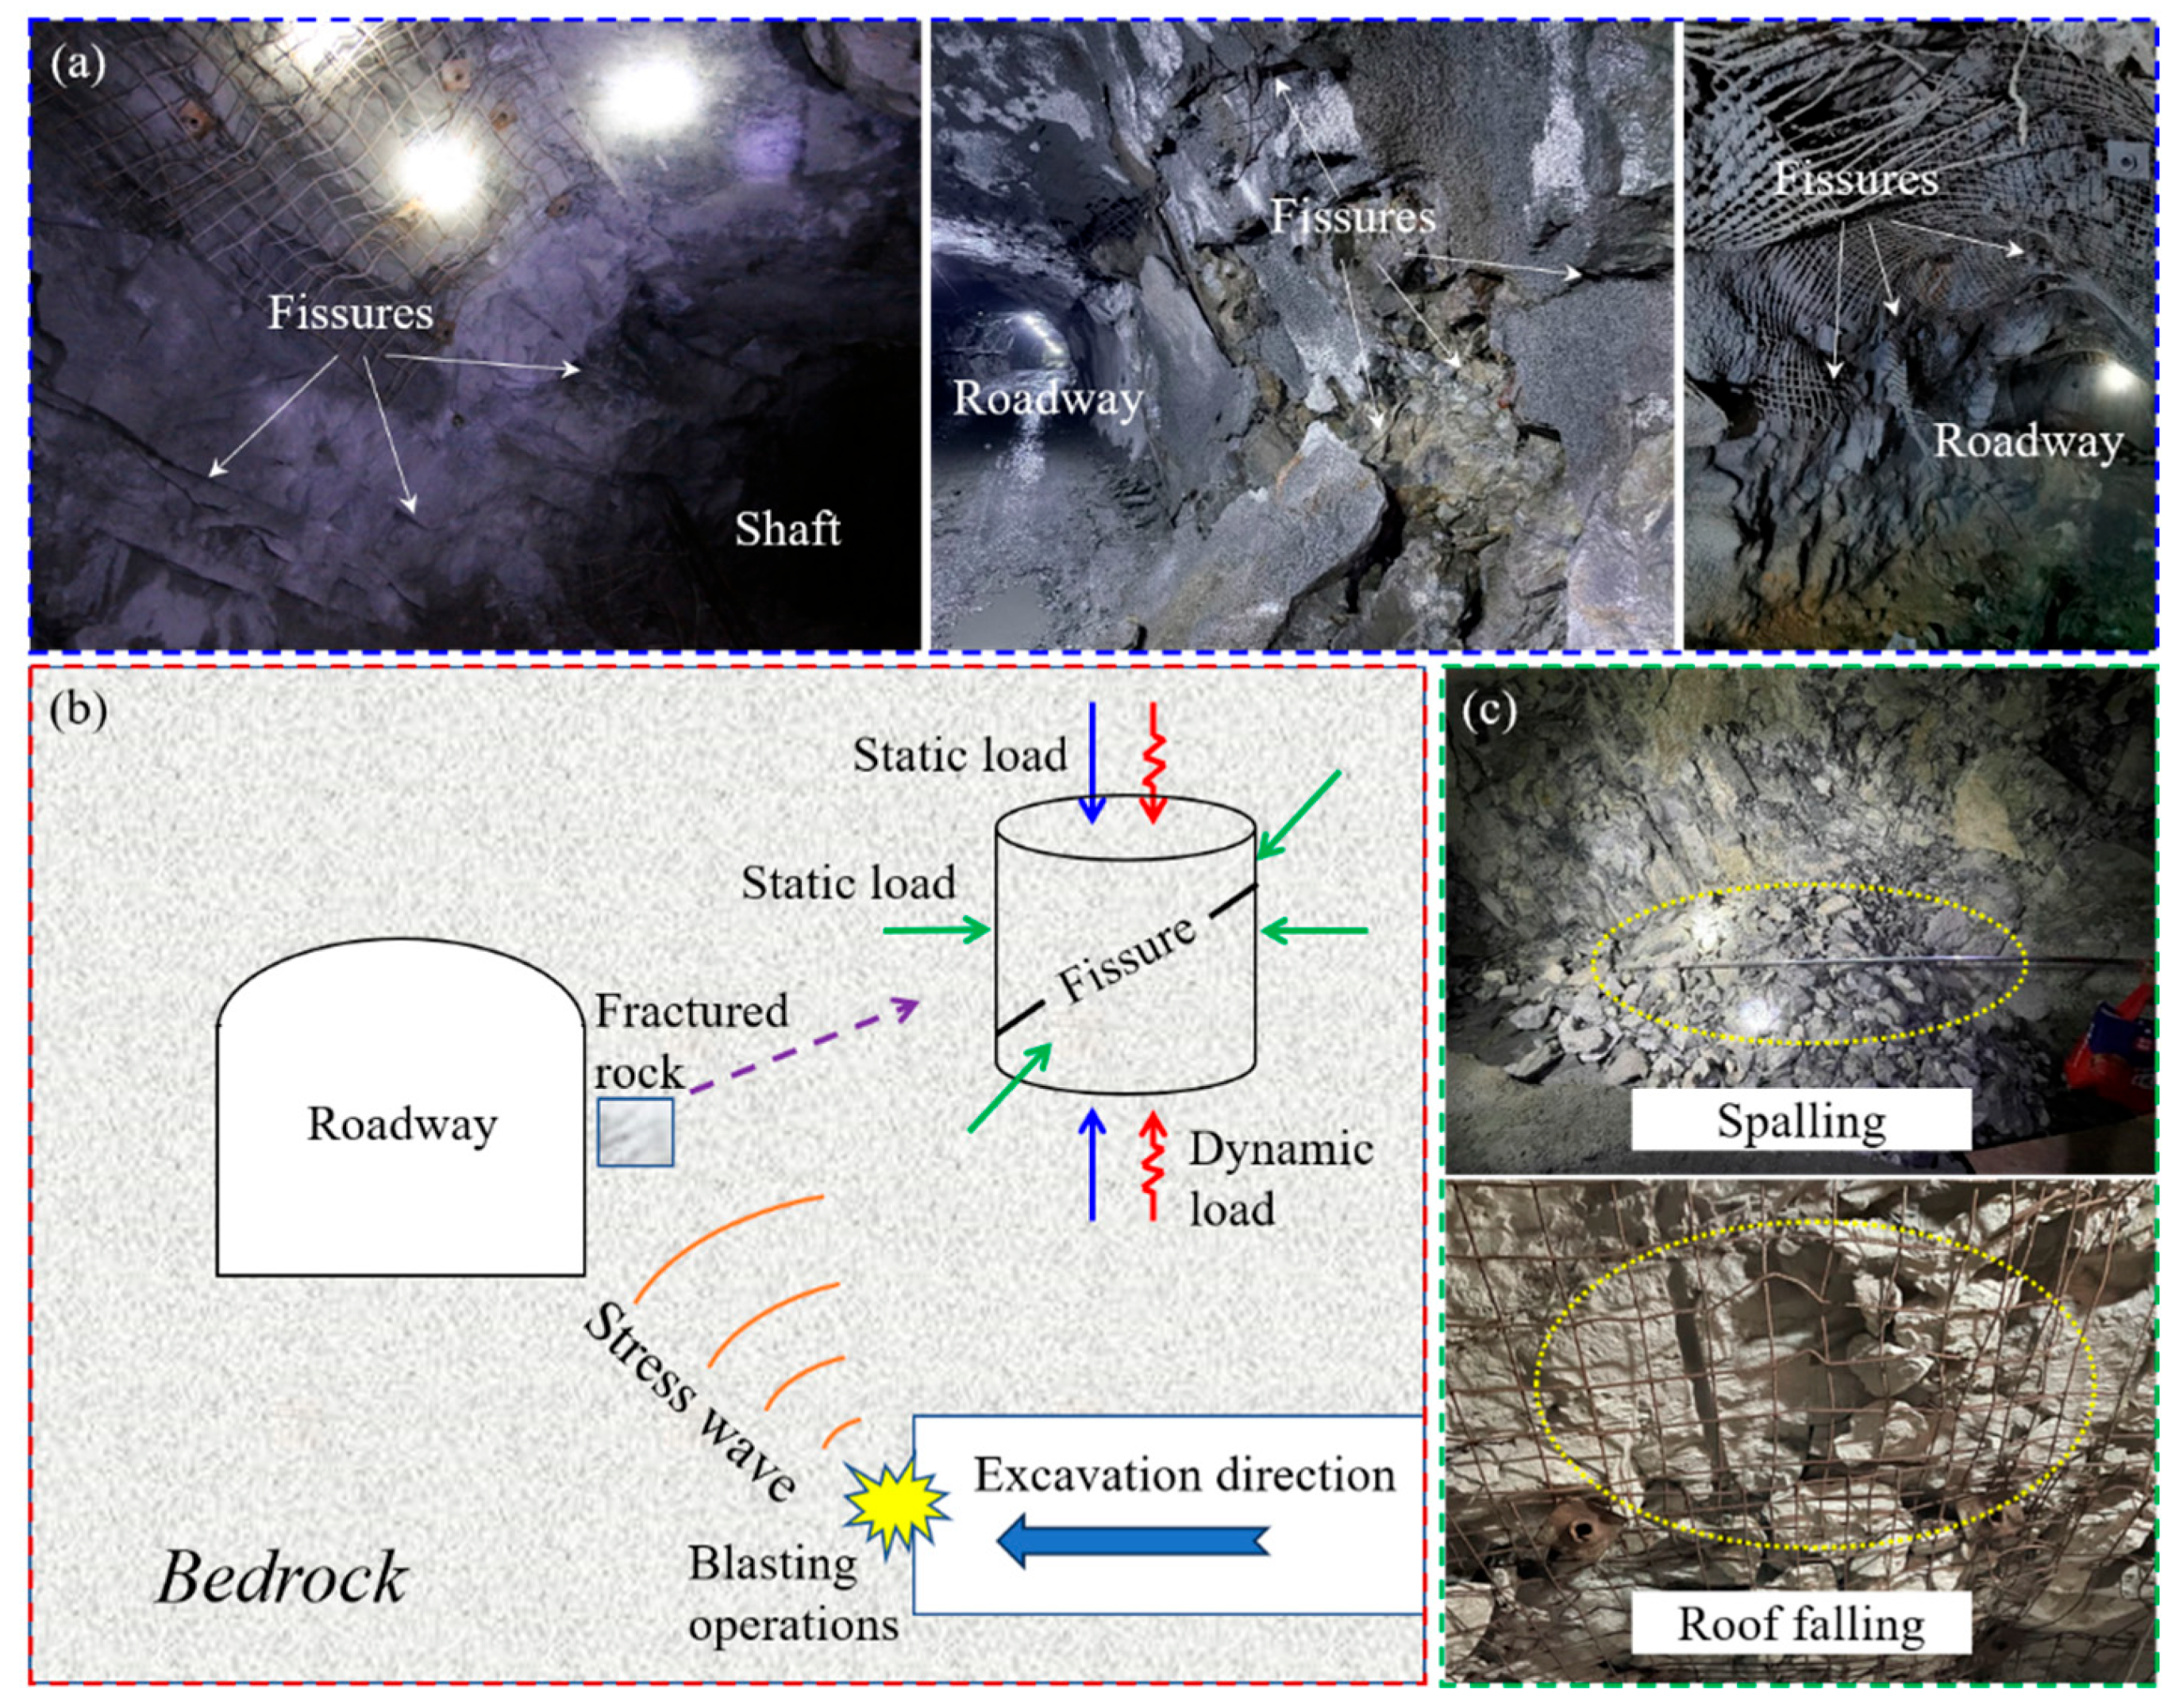
Figure 1a), becoming a typical heterogeneous, discontinuous, and anisotropic geological material with extremely complex physical and mechanical features. The density and spatial distribution of these discontinuous defects significantly alter the stress distribution pattern in the surrounding rock, thus considerably impacting the strength and fracture modes of the rock mass. Numerous studies [
4,
5,
6,
7,
8] have indicated that under external loads, the original defects in rock masses are irreversibly deformed, and new cracks mainly occur and propagate at the boundaries (or tips) of these defects, causing nonlinear degradation of the mechanical parameters of the rocks and leading to the deformation and failure of the rocks and induced disasters. Defects greatly increase the complexity and unpredictability of rock mechanical behaviors [
9], making it difficult to accurately predict the deformation and failure modes of the surrounding rocks in rock engineering, thereby increasing the risk of engineering disasters. Thus, it is crucial to discuss the mechanical features and failure mechanisms of rocks containing defects.
In subsurface rock engineering construction, the surrounding rock not only carries quasi-static stress (two-dimensional or three-dimensional) but is also often disturbed by various repeated dynamic loads such as frequent blasting operations, mechanical vibrations, and excavation construction [
10,
11,
12,
13] (
Figure 1b), which promote fatigue damage to the rocks and pose a potential threat to rock stability. In the dynamic and static superposition mechanical environment, the elastic brittleness and compactness of the surrounding rock are enhanced, which is beneficial to the accumulation of elastic strain energy and the rapid and remote propagation of dynamic stress waves. Also, when stress waves propagate through the defects in the rock mass, they are reflected and scattered, which results in a sharp rise in local stress levels in a short time and a high concentration of dynamic stress. This can easily induce dynamic disasters such as rock bursts, collapse, roof falling, and spalling [
14,
15,
16,
17] (
Figure 1c). Therefore, the study of rock damage characteristics and disaster mechanisms under the superposition of dynamic and static forces has become a hot topic in the field of engineering dynamic disaster prevention and control and safety management. Understanding the dynamic mechanical responses and rupture mechanism of fractured rocks exposed to repeated impact loads is an important prerequisite for preventing and solving these problems, and it is of great significance for stability analysis, blasting technology design, and support structure optimization in rock engineering.
In recent years, a significant amount of effort has been devoted to exploring the dynamic mechanical behavior of fractured rocks using theoretical analysis, experiments, and numerical simulations. For instance, Zhao et al. [
18] explored the influence of parallel joints on the transmission features of stress waves using the displacement discontinuity method. Li et al. [
19] believed that the presence of prefabricated flaws may change the rupture pattern of rocks under dynamic loads, shifting from splitting-dominated by intact rocks to shear-dominated by rocks with joints. Wang et al. [
20] investigated the dynamic mechanical response, crack propagation process, and energy evolution of fractured rocks under dynamic loading. You et al. [
21] carried out triaxial dynamic tests on sandstone specimens containing multiple parallel flaws and found that as the joint strength increased, the failure mode of the fractured rocks shifted from shear-dominated to shear–tensile mixed failure. Shi et al. [
22] claimed that existing fissures aligned with the impact direction provided stronger resistance compared with fissures that deviated from that direction, and the location and distribution of fissures significantly affected the impact stress transmission. Li et al. [
12,
23] conducted impact loading tests on parallel-fractured and cross-fractured granite samples containing holes to analyze the influences of fissure geometry and dynamic strain rate on the dynamic mechanical properties and cracking process of fractured rocks. Qiu et al. [
24] simulated the effect of flaws’ geometric parameters on the dynamic response and fracture behavior of jointed rocks. Chen et al. [
25] studied the dynamic mechanical responses, energy evolution, and rupture patterns of jointed granite specimens. Previous studies have made important contributions to the understanding of the deformation, strength, initiation and propagation of cracks and the cracking modes of fractured rocks subjected to impact loading. However, these works were carried out under a single impact, ignoring the cumulative effect of cyclic dynamic pressures on the damage to fractured rocks.
In terms of cyclic impact loading tests, most scholars have examined the dynamic mechanical responses of intact rocks exposed to repeated impact pressures. For instance, Jiang et al. [
26] noted that under repeated dynamic impacts, the porosity and permeability of rock progressively decreased, which primarily resulted from an overall reduction in pore size and the loss of pore connectivity. Wang et al. [
27] reported that as the number of impacts grows, the dynamic strength and deformation capacity of rocks gradually drop, and fatigue damage gradually accumulates. Jiang et al. [
28] stated that with increasing dynamic impact times, the porosity and permeability of red sandstone increase, and microcracks merge and propagate, ultimately forming larger microcrack areas. Lu et al. [
29] suggested that the dynamic peak strength of sandstone descends with increasing impact times, and brittle failure occurs. Furthermore, the dynamic mechanical features of pre-applied intact rocks under repeated impact disturbance have also received some attention. Wang et al. [
30] performed dynamic loading tests on red sandstone samples with confining pressure and studied the relationship between cyclic impact, dynamic characteristics, and porosity changes. Xue et al. [
31] concluded that under the same pre-applied axial load, as the impact times increase, the peak strength of the rock shows a tendency of first growing and then descending. The above studies only emphasized the influence of cyclic dynamic impact on intact rocks. However, less attention has been focused on the mechanical behaviors and fracture characteristics of pre-stressed fractured rocks exposed to repeated impact loads. Zhang et al. [
32] thought that under constant-cyclic impact pressure, the dynamic deformation modulus and strength of fractured rocks pre-loaded with axial compression first grow and then descend with an increasing joint angle. Luo et al. [
33] conducted dynamic triaxial cyclic impact experiments on coal rocks with different bedding angles, analyzing the effects of bedding and confining pressure on the dynamic mechanical features and damage and rupture laws of the coal rocks. Hence, the research on the dynamic mechanical features and cracking modes of fractured rocks under the combined action of quasi-triaxial static loads and cyclic dynamic loads is still insufficient; particularly, the dynamic failure mechanism and stability of fractured rocks are not fully understood, and further in-depth investigation is needed.
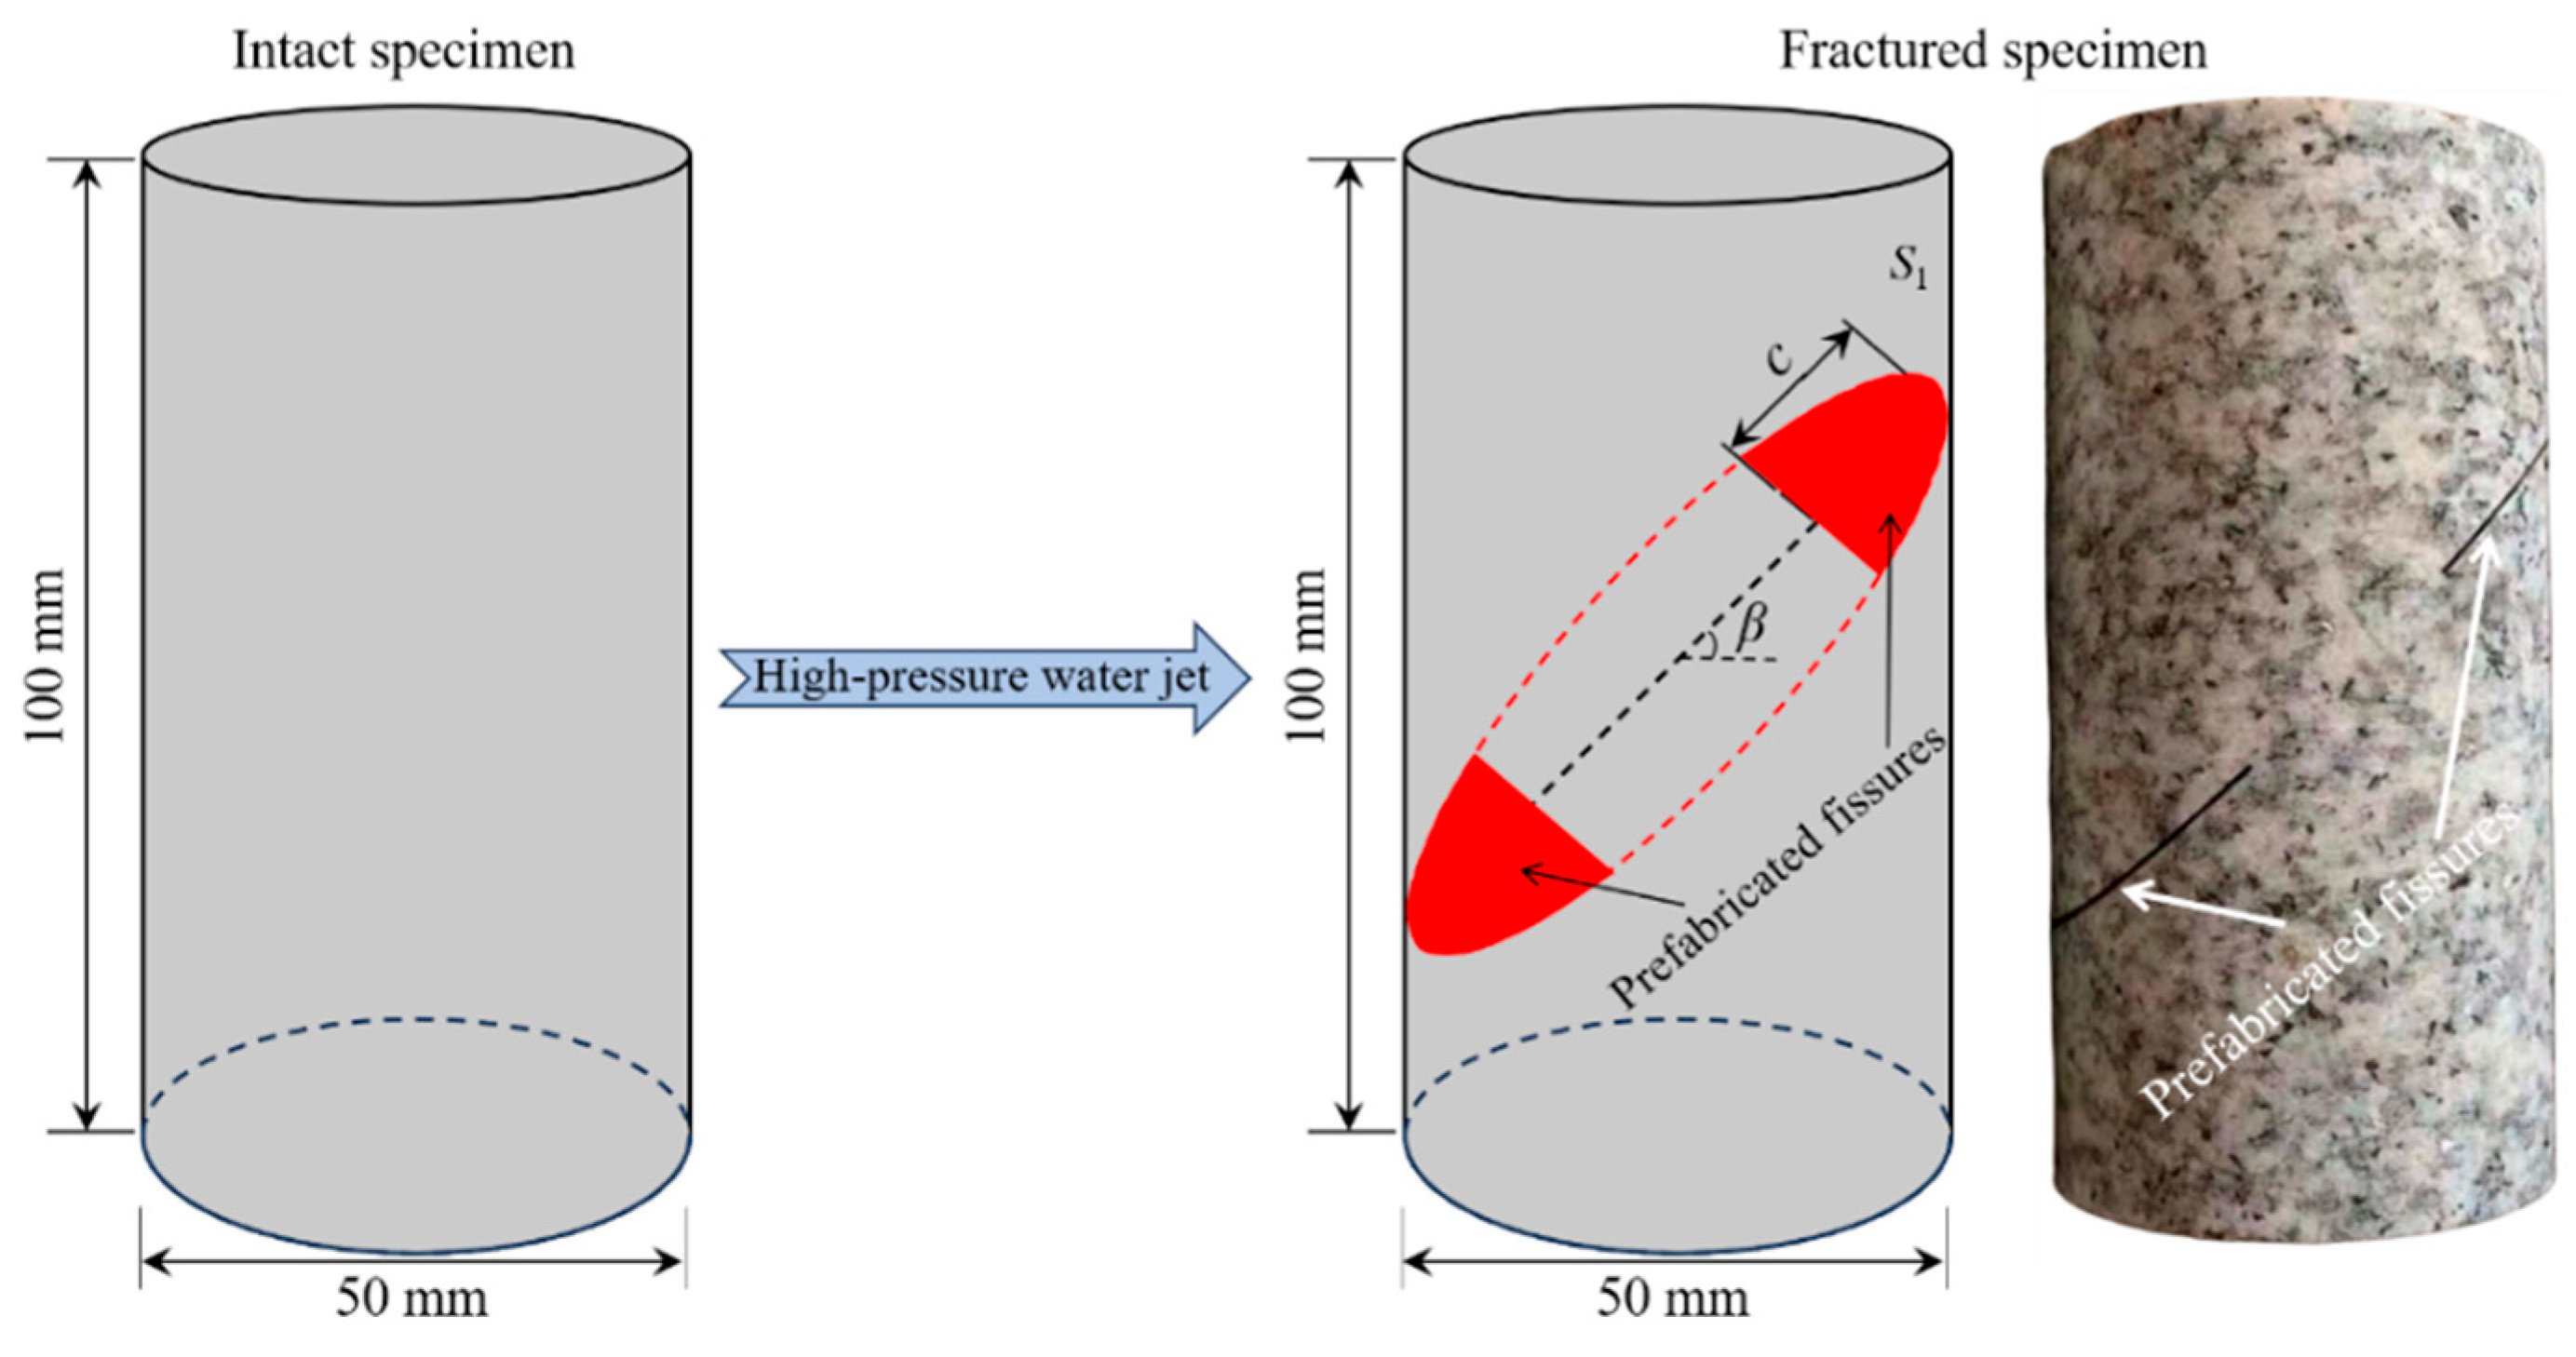
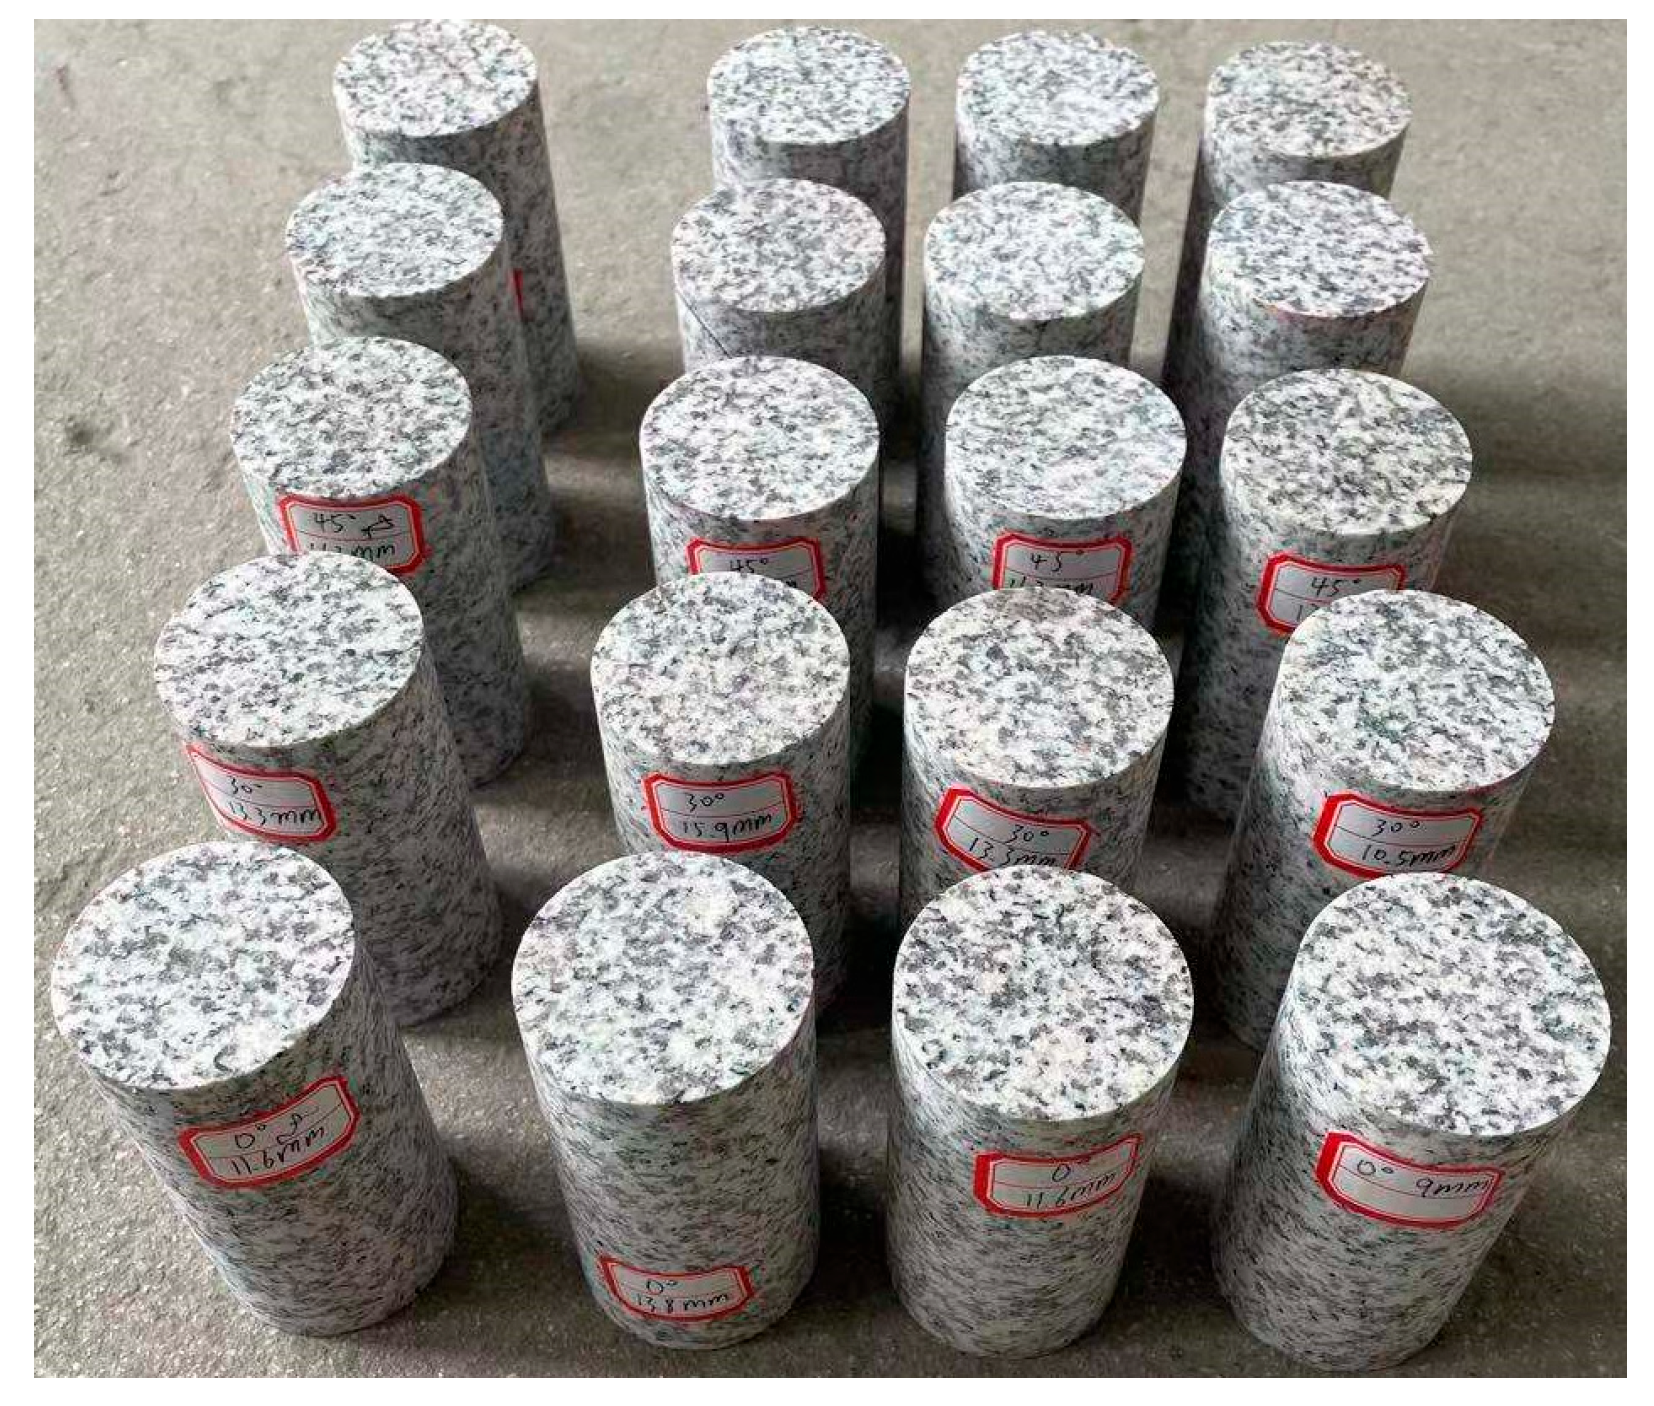
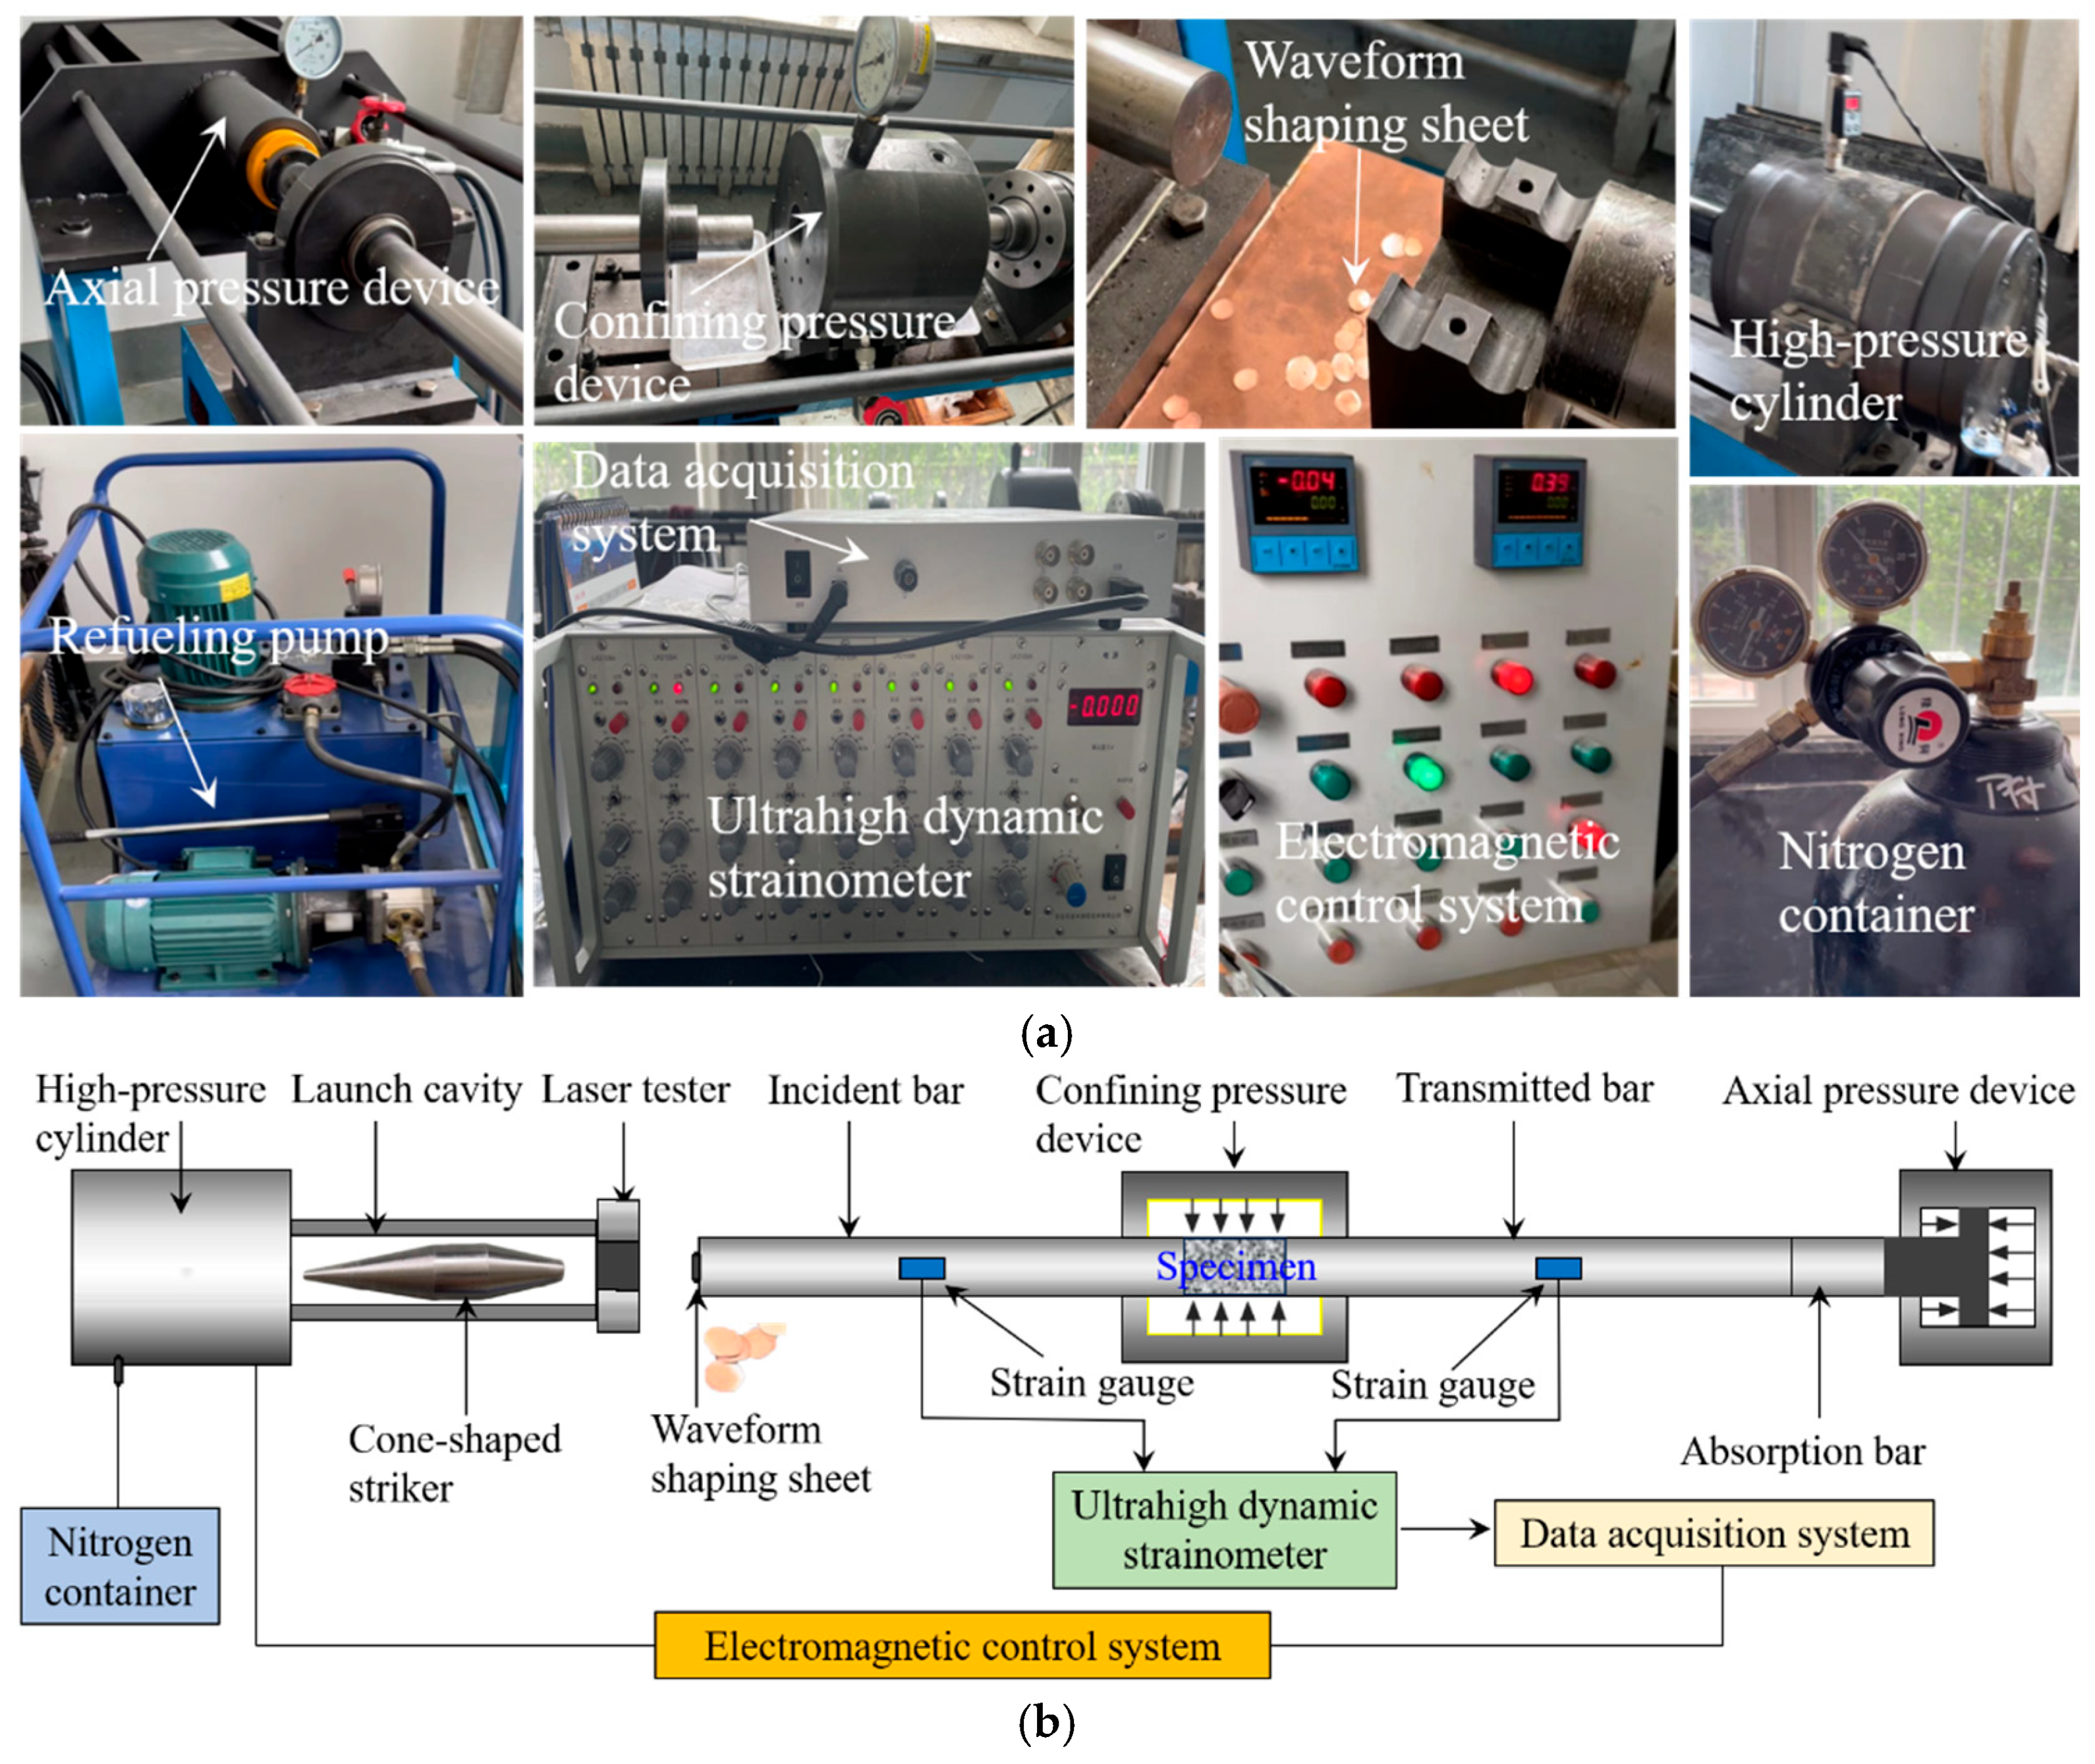
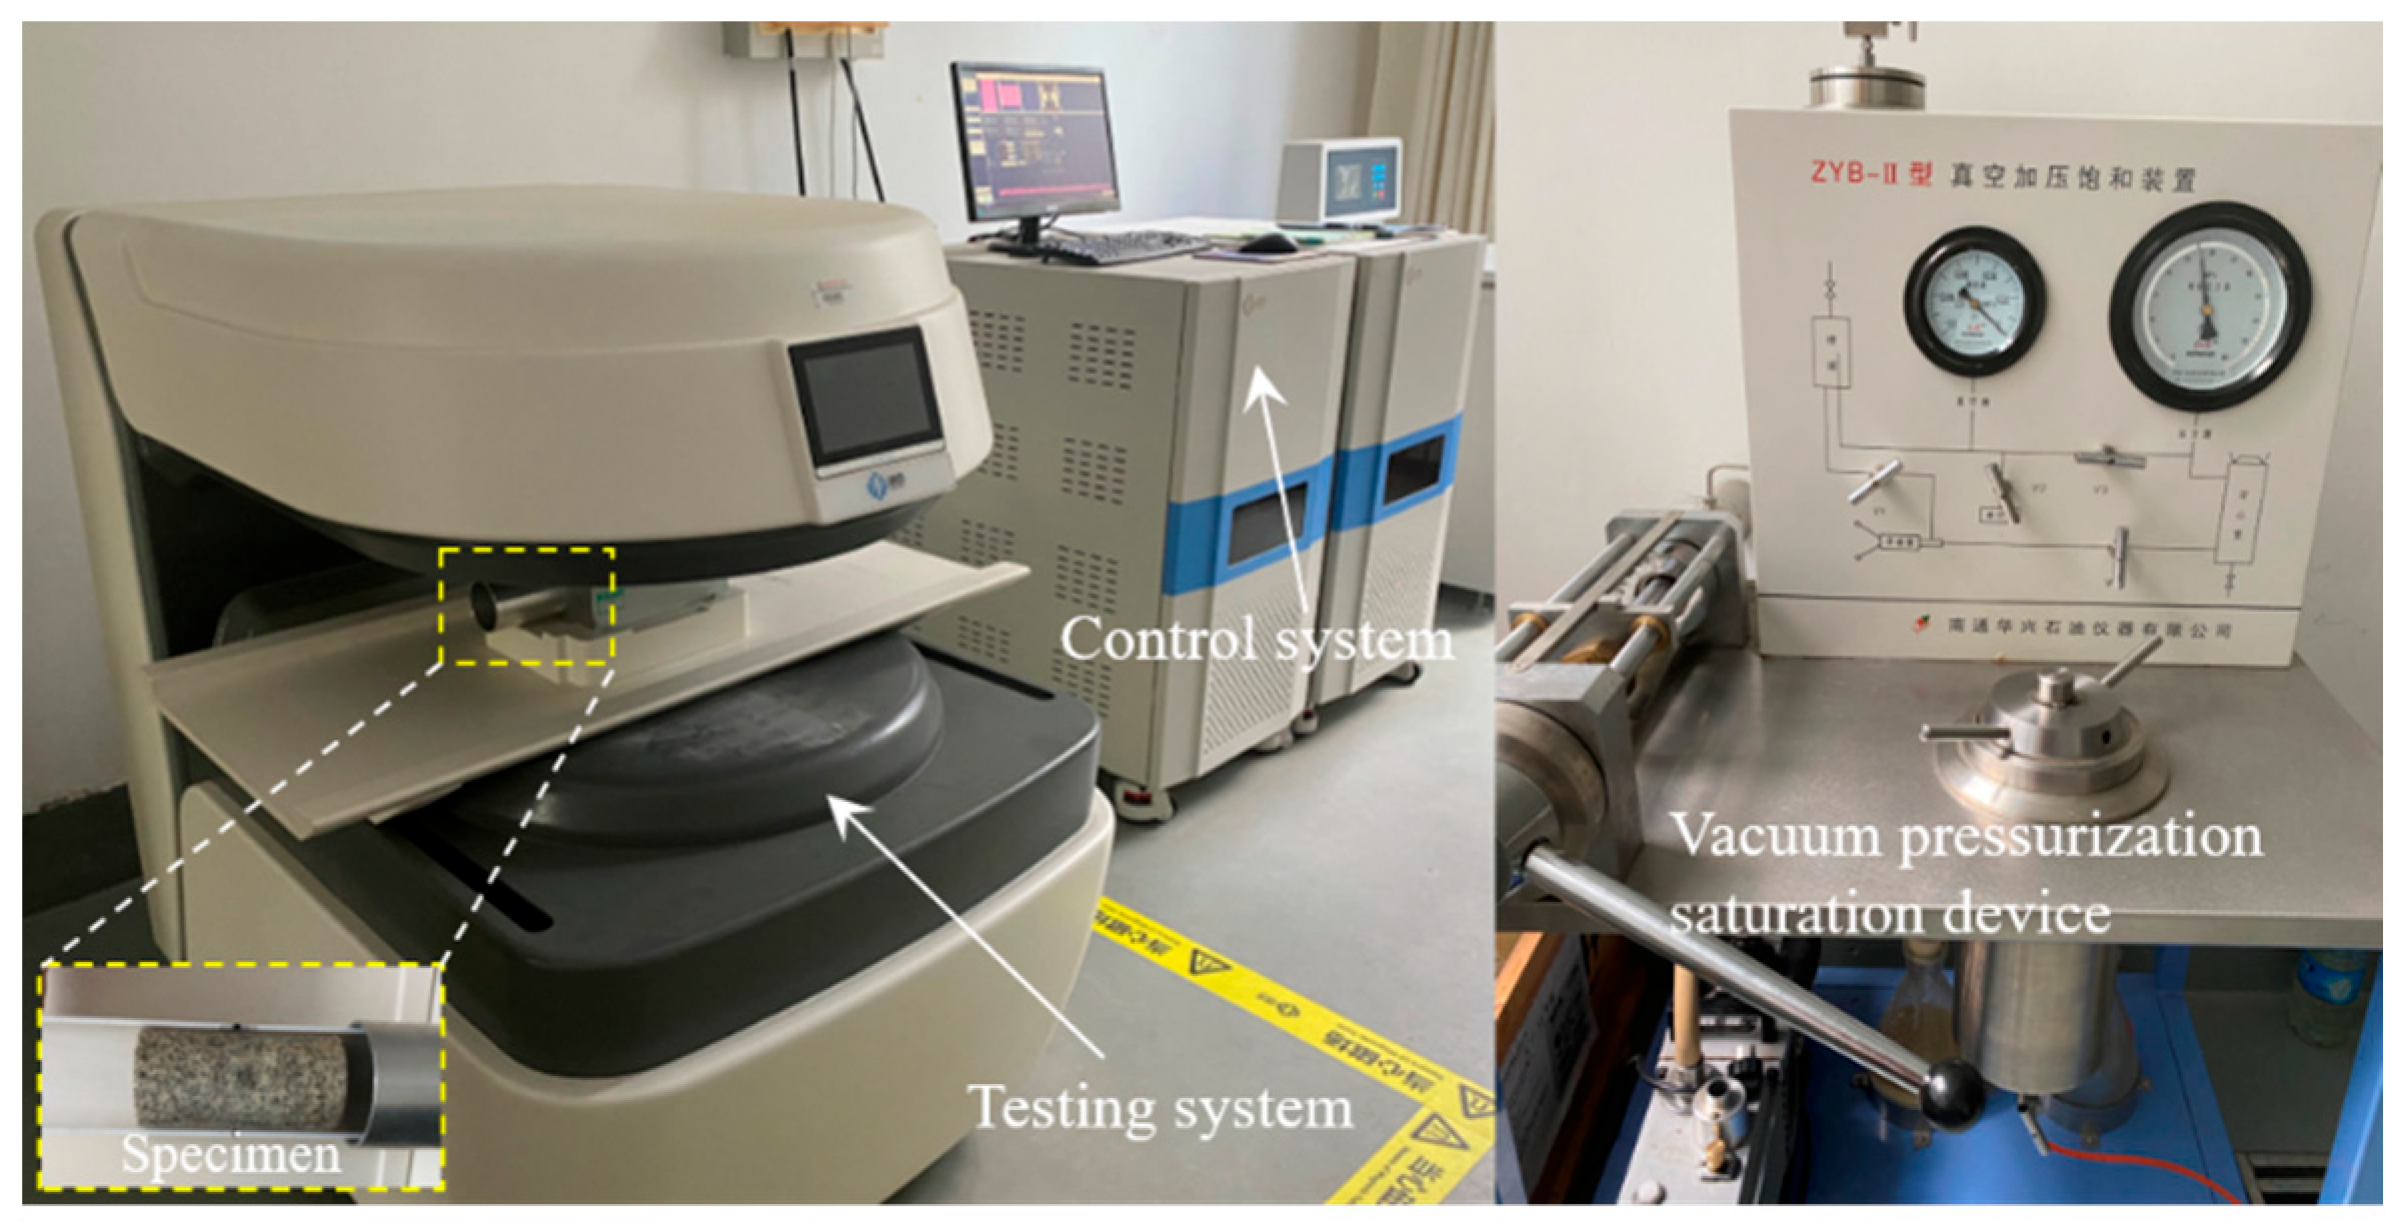
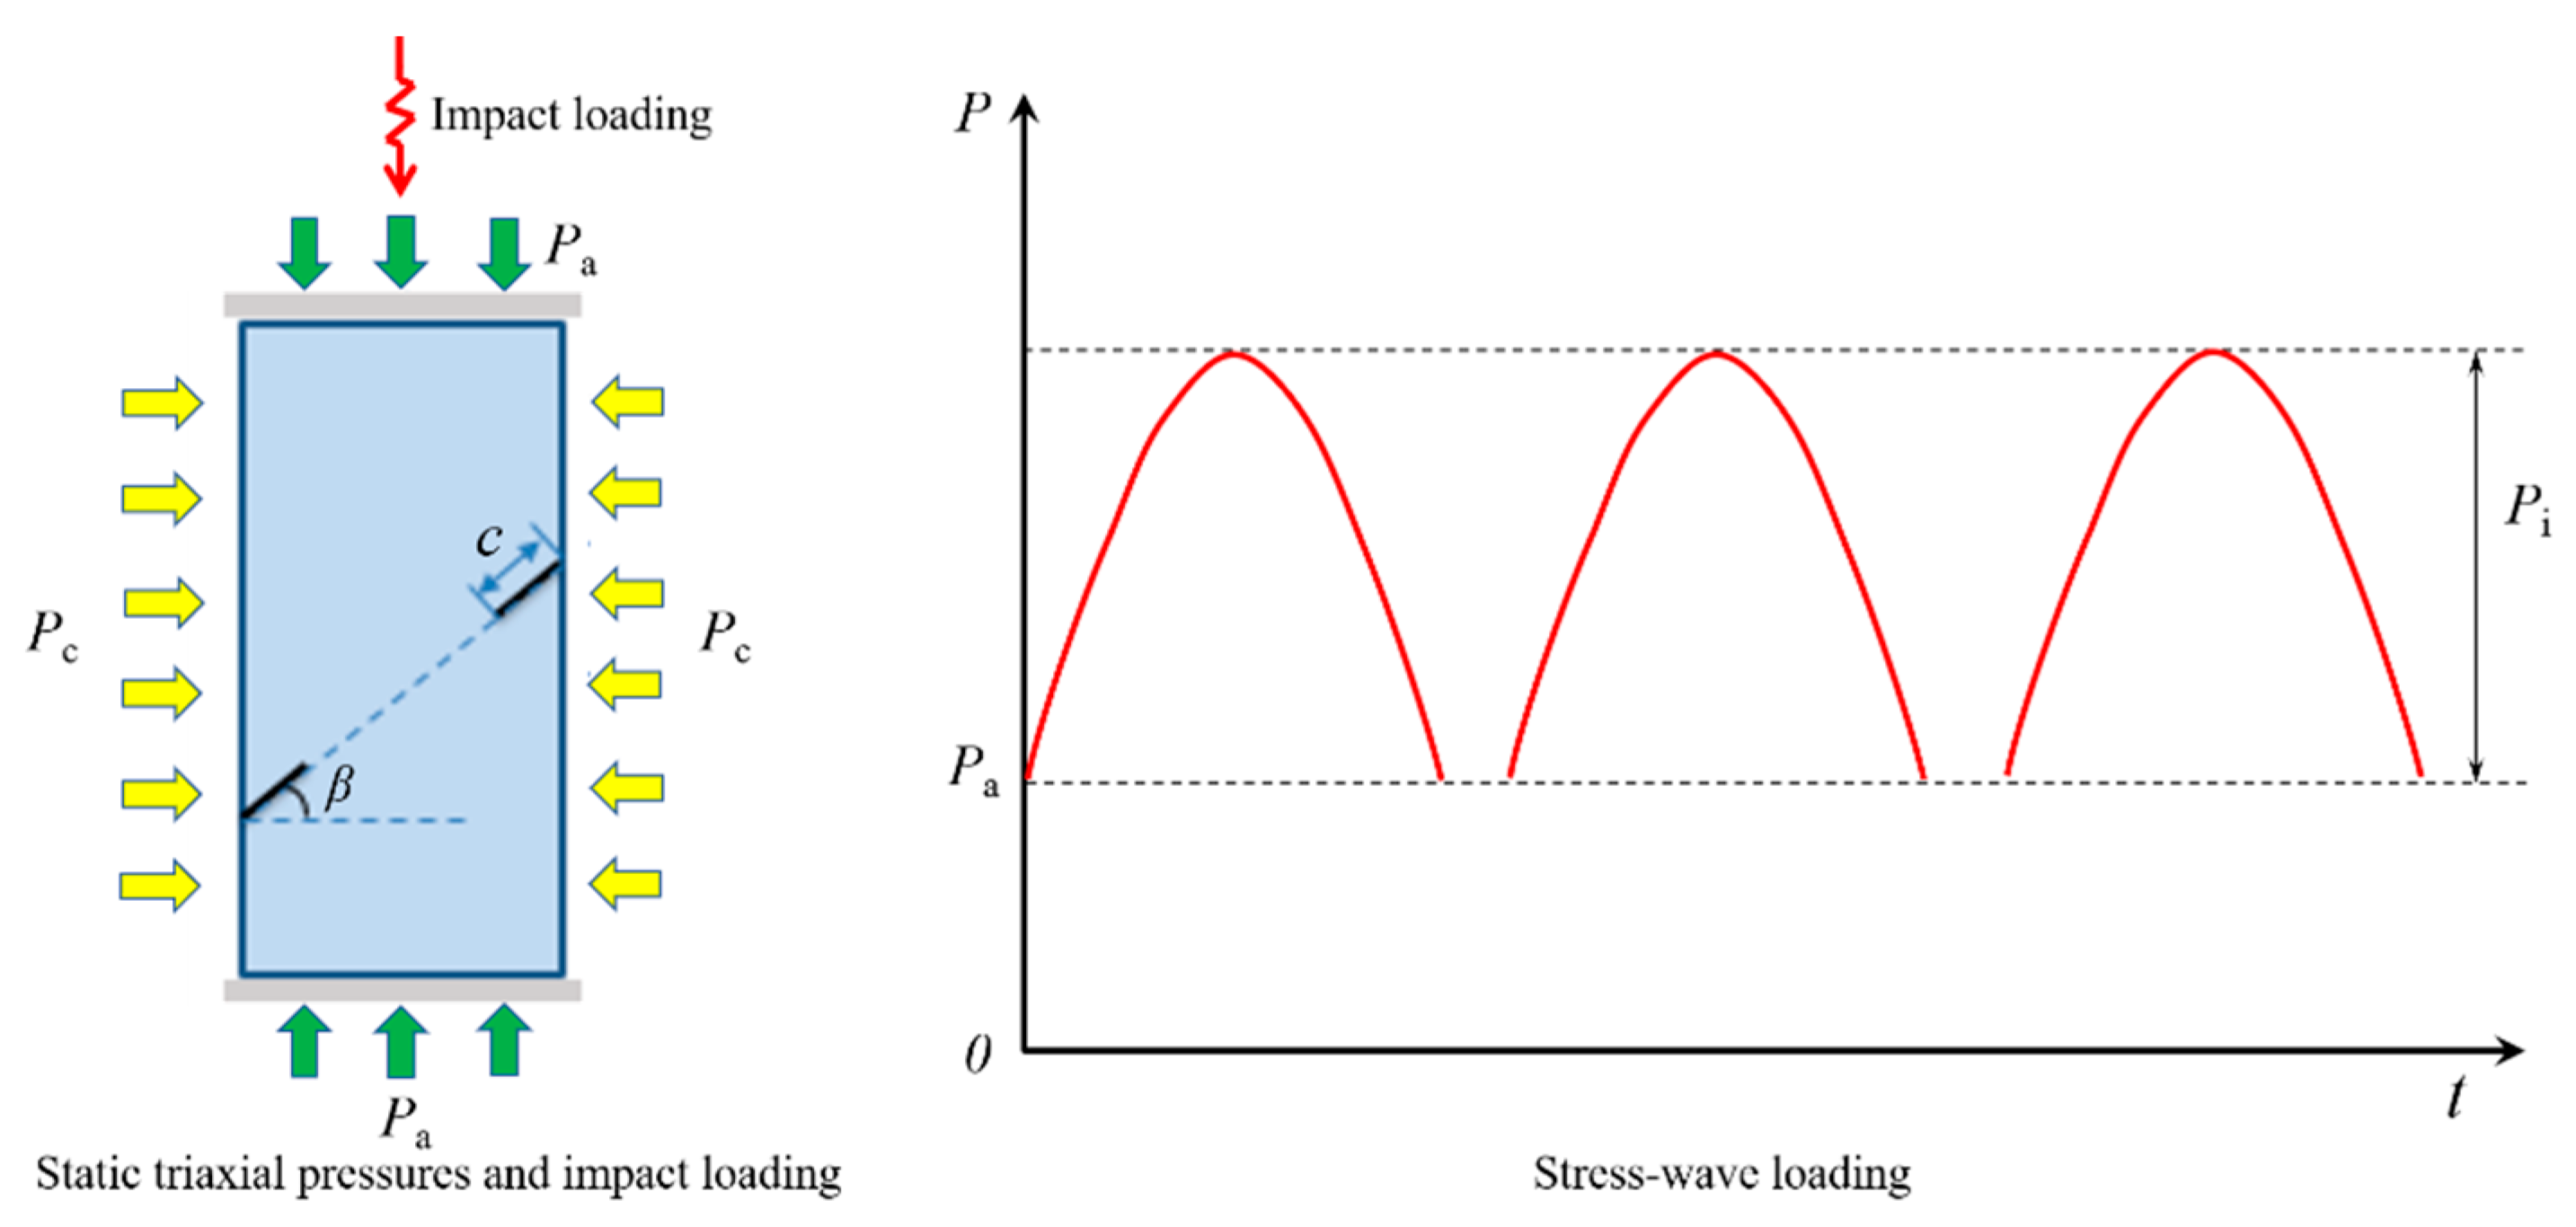
To address these issues, in this article, cylindrical granite specimens with prefabricated intermittent fissures were prepared, and repeated impact loading experiments on the produced fractured specimens under different pre-applied axial loads (8, 14, and 20 MPa) and confining pressures (8, 12, 16, and 20 MPa) were performed using a split Hopkinson pressure bar test system. Moreover, a nuclear magnetic resonance imaging system was employed to measure and identify the porosity and images of the fractured specimens after testing to analyze their dynamic damage behaviors. The stress wave fluctuation features, dynamic mechanical properties, fracture behaviors, and failure patterns of the fractured specimens subjected to varying axial and confining loads and the same repeated impact pressure were systematically examined. Accordingly, the dynamic failure mechanism of the fractured specimens was discussed. In addition, the distribution characteristics of the fragments and debris of the fractured specimens after testing were analyzed from the perspective of fragment size and mass, and the effect of different confining and axial pressures on the fractal dimension of the fractured specimens was also explored. The achieved results provide a new perspective for the surrounding rock stability evaluation, disaster prevention, and safety management of rock engineering.
3. Dynamic Mechanical Properties
3.1. Stress Equilibrium Validation
In rock impact loading tests, due to the instantaneous nature of the impact load, the generated stress waves may lead to complex stress distributions inside the specimen, so stress equilibrium validation is a critical step in ensuring the accuracy and reliability of test results. An effective SHPB test must satisfy two essential assumptions: one-dimensional stress wave transmission and the uniformity of stress and strain. For fractured specimens, prefabricated fissures in the specimen may affect the spread of stress waves. Thus, before analyzing the results of the impact tests, clarifying the validity of using the SHPB system to conduct impact loading experiments on the fractured specimens is necessary. In the SHPB tests, the dynamic stress balance between the two ends of the specimen should be achieved prior to the specimen rupture, particularly prior to peak stress occurring in the specimen. This can be checked by comparing the dynamic stress histories at both ends of the samples. In this study, the use of a cone-shaped striker to generate a slowly rising one-dimensional half-sine wave on the compression bar, as well as the use of waveform shaping sheets and the uniform application of lubricant to both ends of the sample to diminish end-face friction, are beneficial measures for significantly eliminating stress wave oscillations and reducing wave dispersion effects. This enables a uniform strain rate loading and dynamic stress balance at the specimen ends. Additionally, according to relevant studies [
39,
40], stress waves must travel back and forth through the sample at least three times to facilitate a dynamic stress balance. According to the relevant calculation formula [
23], it takes approximately 50 μs for the stress wave to propagate back and forth in the specimen once, and the duration of the incident wave is around 240 μs in the experiments, which is enough for the stress wave to propagate back and forth in the sample at least four times to reach the stress balance.
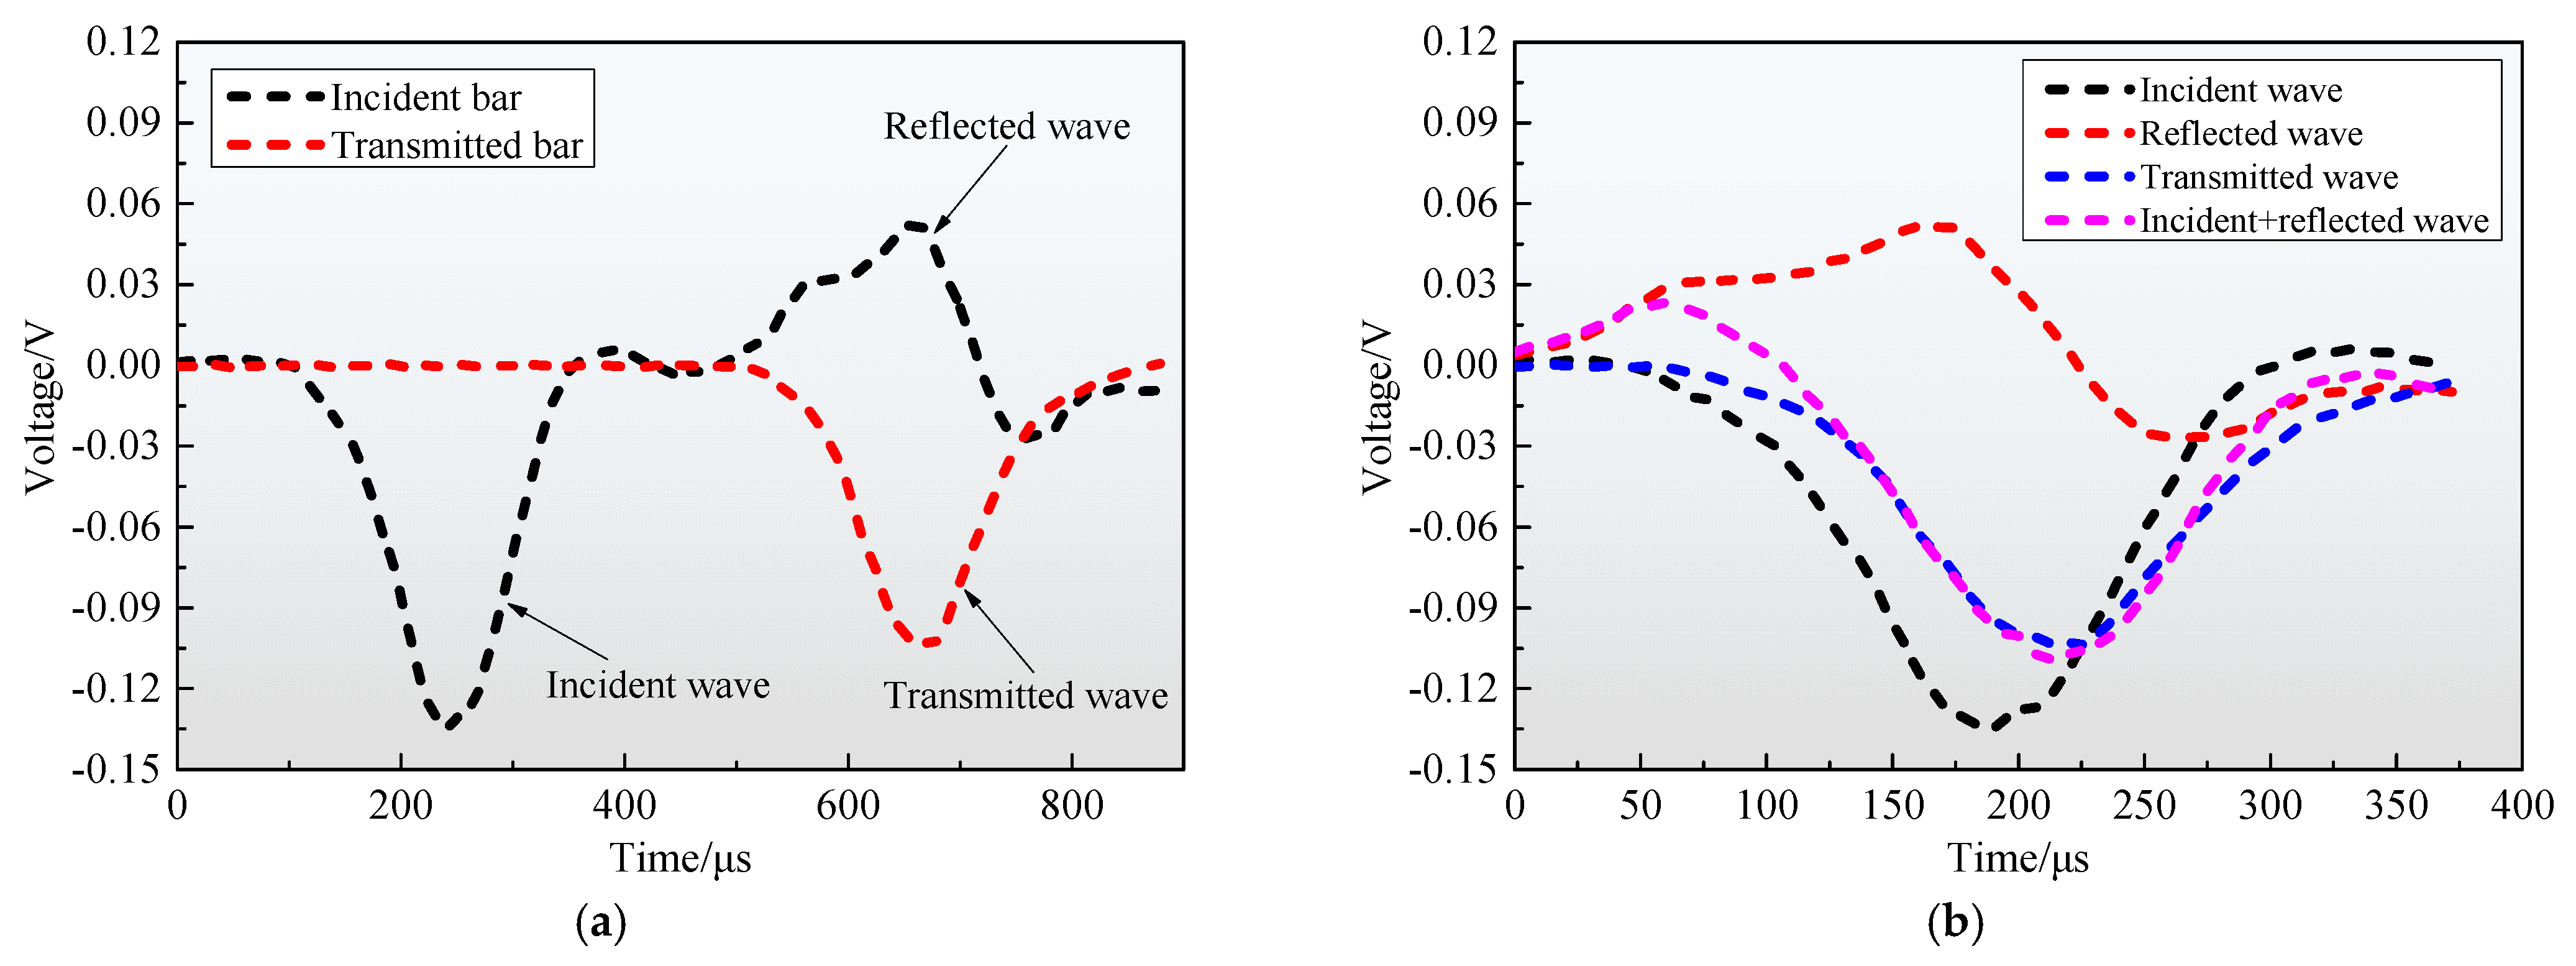
Currently, a widely accepted approach for assessing dynamic stress equilibrium is to compare the transmitted wave with the superposition wave (i.e., the sum of the incident and reflected waves). The collected typical voltage signals of the incident, reflected, and transmitted waves (
Figure 7a) of the representative specimen FGS-4 under the impact loading are converted, yielding the stress equilibrium relationship, as plotted in
Figure 7b. According to the degree of overlap between the transmitted wave and the superposition wave in the stress equilibrium relationship, it can be determined whether the stress equilibrium condition is satisfied. In
Figure 7b, the typical stress history at both ends of sample FGS-4 indicates that after multiple reflections, the superposition wave roughly overlaps with the transmitted wave before the specimen failure and remains in the post-peak region for a certain period. This means that the designed fractured specimen can reach a basic stress balance state during impact loading, demonstrating the availability and reliability of our SHPB tests. It should be noted that the same conclusion was also reached from the inspection of the other fractured specimens tested. In fact, many scholars [
41,
42,
43] have conducted impact loading experiments on rocks containing defects (such as fissures and cavities) and obtained satisfactory results. Accordingly, based on the collected incident, reflected, and transmitted strain signals, the axial stress
σ(
t), strain
ε(
t), and strain rate
(
t) of the fractured specimens can be approximately computed by the relevant formulas in the one-dimensional stress wave propagation theory, namely:
where
Ae and
Ee represent the cross-sectional area and elastic modulus of the compression bar, respectively;
As and
ls stand for the cross-sectional area and length of the specimen, respectively;
εI(
t),
εR(
t), and
εT(
t) denote incident, reflected, and transmitted strain signals, respectively; and
c0 means the longitudinal wave velocity of the compression bar.
3.2. Stress Wave Characteristics
The spread characteristics of stress waves inside the rocks during impact loading significantly affect the dynamic responses and failure patterns of the rocks. When stress waves propagate to structural planes, fissures, or discontinuities in rock masses, they can cause the initiation, growth, and connection of cracks, ultimately resulting in rock mass rupture. The reflected wave can reflect the strain changes, and the transmitted wave can characterize the average stress changes in the rock mass. Thus, understanding the transmission features of stress waves can help to better predict the dynamic mechanical features and failure mechanisms of rocks.
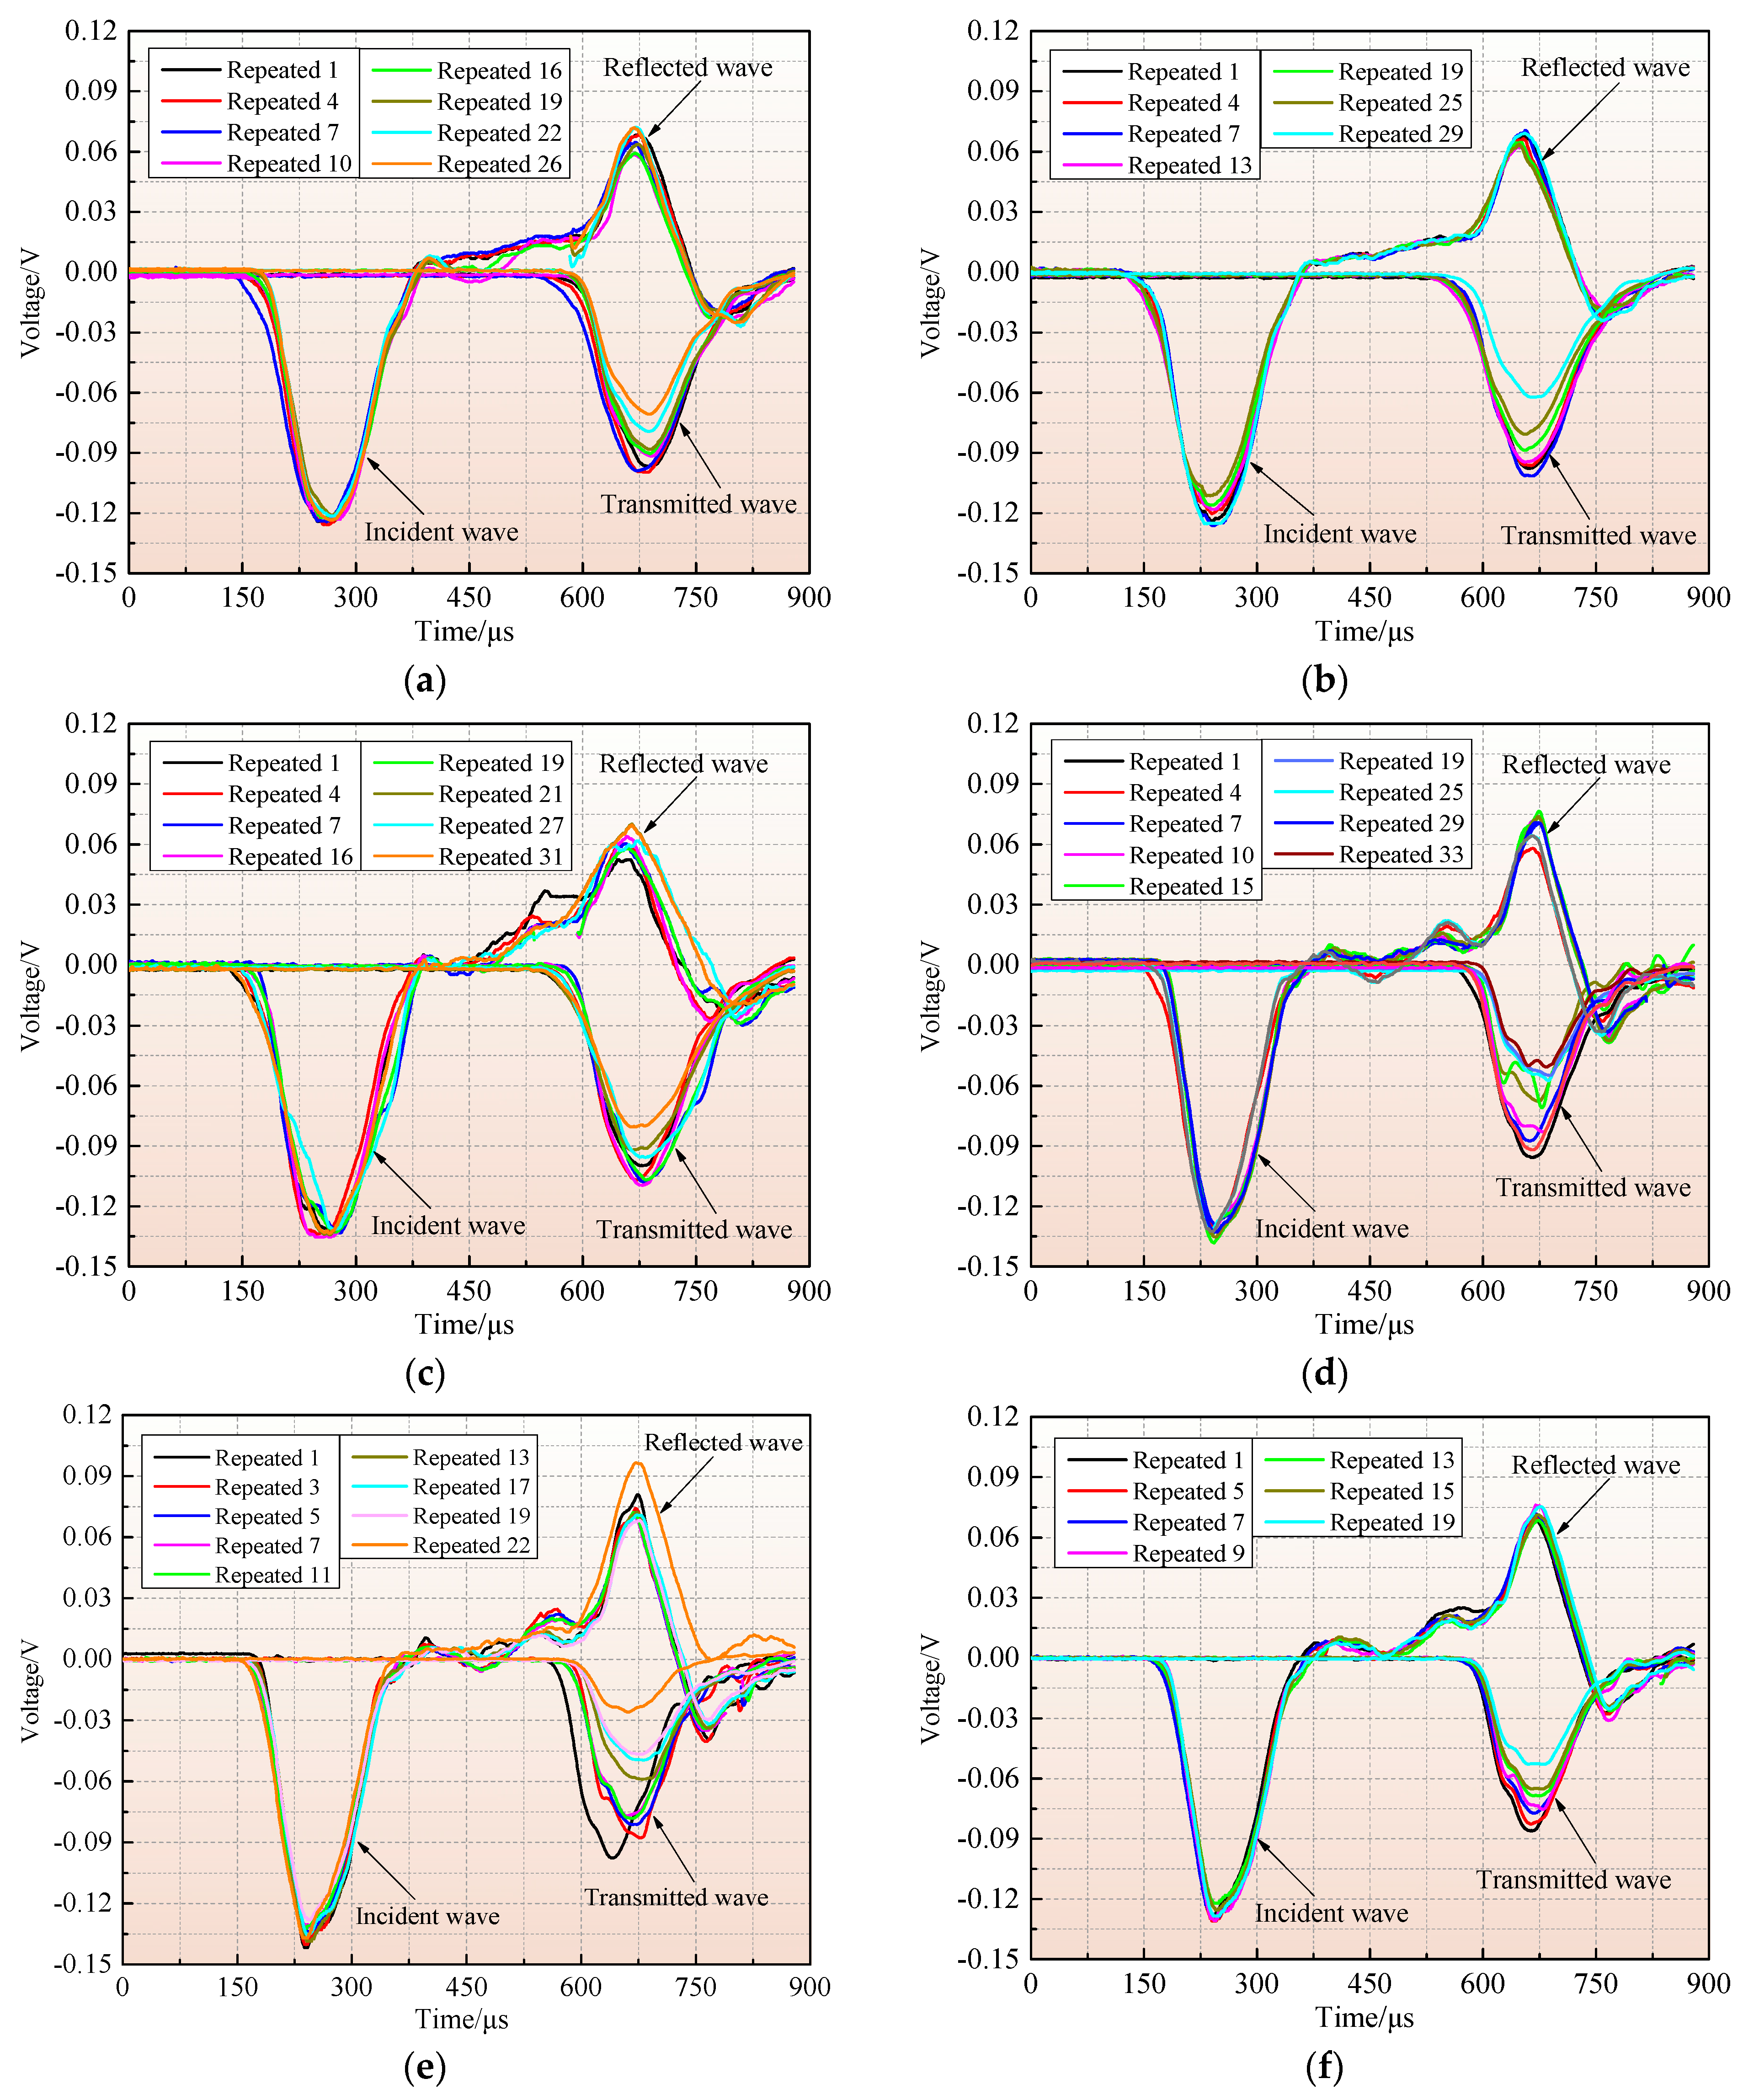
Figure 8 shows the three-wave voltage versus time curves of the fractured specimens under different quasi-triaxial pressures and repeated impact loading. Because of the high number of repeated impact times in the experiment, only partial curves of each sample are presented. Under the same impact pressure, the amplitude of the incident wave basically overlaps, and the incident, reflected, and transmitted waves are all half-sine waves. The incident waves of multiple impacts have a good coincidence, suggesting that the impact velocity has been precisely controlled. When stress waves are loaded on the specimen, the filtered incident waveform will not exhibit significant oscillations. The amplitude of the transmitted wave is less than that of the incident wave, and the variation trend of the reflected wave is generally opposite to that of the transmitted wave. These specimens have similar stress wave features. The pre-existing fissures in the specimen have a certain effect on the transmission of stress waves in the specimen, leading to varying degrees of fluctuations in the stress waves. This may be because, under one-dimensional stress wave conditions, fissures undergo varying degrees of inelastic deformation, which makes the stress waves jump to different degrees.
On the other hand, under constant impact pressure, the amplitude of the incident wave is the same, while the reflected wave and transmitted wave have approximately coincident waveforms in the first few impacts, suggesting that the impact triggered a slight damage to the rock in the stage before the formation of micropores and cracks. The amplitude of the transmitted wave reaches its maximum value in the first impact and decreases in subsequent impacts. Under the same impact pressure, the degree of damage to the rocks varies. In the early stages, the transmitted wave amplitude of rocks is small, and the energy consumption is low. After multiple repeated impacts, the damage accumulates and forms microcracks, increasing the energy consumption of the rock damage. With increasing impact times, the energy consumption of the sample damage also increases gradually.
In addition, as the impact times increase, the amplitude of the transmitted wave progressively decreases, indicating that the degree of damage of the specimen increases during the cyclic impact process. With the initiation and growth of new cracks inside the sample, the number of reflections of the incident wave on the crack surface increases, which results in a fall in the transmitted energy produced by the incident wave after passing through the sample, and thus the corresponding amplitude of the transmitted wave is weakened. The amplitude of the reflected wave of the sample appears to increase at the last impact, which may be because, after the sample is damaged under the impact load, the pre-loaded static pressures make the stress wave unable to transmit, resulting in an increase in the reflection of the stress wave at the end of the specimen, and therefore the corresponding amplitude of the reflected wave increases. When Pc = 8 MPa, the amplitude of the transmitted wave declines with increasing Pa values, and cracks develop in the specimen, and the damage progressively accumulates until the cracks propagate and penetrate. At this time, the ability of the specimen to resist external impacts weakens. Moreover, when the pre-loaded Pa is 8 MPa, the amplitude of the transmitted wave descends with a growing Pc value, indicating that increasing the Pc within a certain range can limit the initiation and growth of cracks in the sample, thereby enhancing the ability of the rock to resist external impacts.
3.3. Dynamic Stress–Strain Behavior
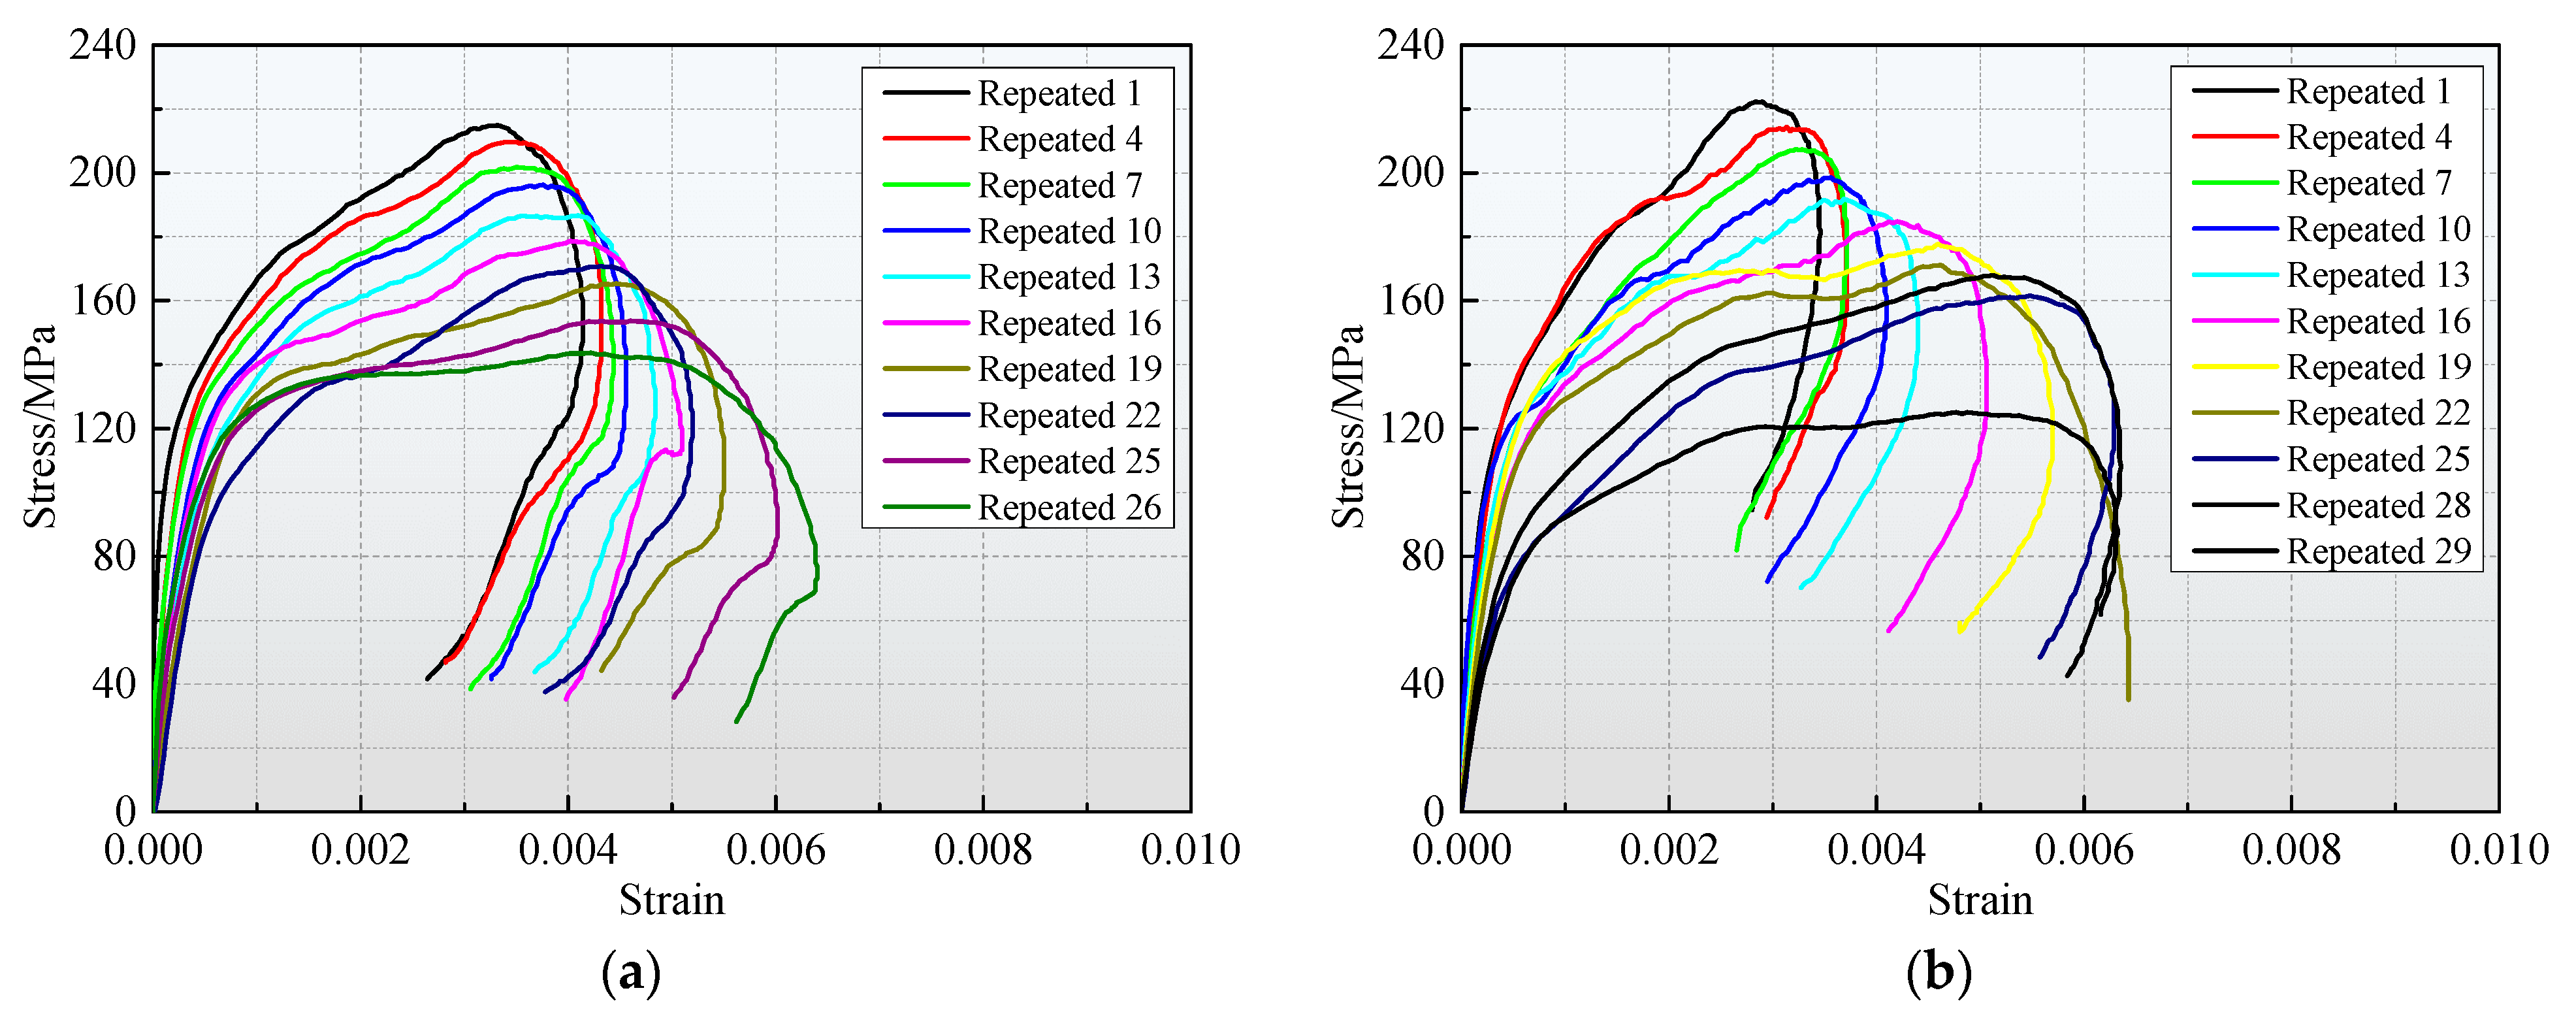
The representative dynamic stress–strain curves of the fractured samples exposed to diverse quasi-triaxial static pressures and repeated impact loading are presented in
Figure 9. In general, the dynamic stress–strain behavior of the fractured specimens subjected to diverse stress conditions exhibits a certain degree of similarity. The curves of these samples have almost no noticeable initial compaction stage (concave curve) and directly enter the approximate elastic deformation stage after the specimens are subjected to impact loads. This is because the stress pulse duration is extremely short, and the initial micro-cracks cannot be closed in time under the impact load, resulting in the curve in the initial stage being almost linear, without a compaction process. Also, these curves are relatively smooth, without a significant stress drop. Similar phenomena have also been observed in some previous studies [
12,
19,
44].
The dynamic stress–strain curves of the samples exposed to various
Pc and
Pa values can be roughly divided into three stages: the approximate elastic stage, crack propagation stage, and post-failure stage (i.e., the stage after peak stress). In the approximate elastic stage, the internal cracks of the sample are compacted, and the specimen maintains elastic deformation. As such, the dynamic stress–strain curve is nearly a straight line. At this stage, the load is largely borne by the particle skeleton and holes of the specimen. After multiple impacts, the sample still maintains good elastic deformation properties at this stage. In the crack expansion stage, with the increase in stress, some holes and cracks expand and penetrate, and the tangent slope of the stress–strain curve is smaller than that in the approximate elastic stage. At this stage, the loading stress exceeds the ultimate load of most holes, leading to the collapse of the holes. Near the collapsed holes, the stress rapidly concentrates, causing a temporary strain-hardening phenomenon. The stress–strain curve temporarily shows an upward convex form, and the tangent slope first increases and then decreases. Moreover, after multiple impacts, the tangent slope sharply decreases, and the stress–strain curves of several samples are nearly horizontal. The main reason for this is the formation of a large number of cracks in the specimens, forming a stress relaxation platform. In the post-failure stage, the stress generally declines with increasing strain, manifested as a typical class II rebound curve. The class II curve reveals the strain rebound phenomenon of the sample during the unloading process. At this time, the specimen has not completely broken and still has a certain bearing capacity. The reason for the rebound phenomenon is that the specimen initially has a high integrity and large wave impedance [
45]. When stress waves are transmitted to the specimen, the larger wave impedance of the sample increases the amplitude of the transmitted wave. The larger the amplitude of the transmitted wave, the smaller the corresponding amplitude of the reflected wave, and the faster the time to reach the peak point. However, with the continuous action of the incident stress wave, the reflected wave amplitude begins to decrease, eventually causing the direction of the reflected wave to be consistent with that of the incident wave, and the strain begins to descend, resulting in the strain rebound phenomenon. Another explanation is that during the pre-loading confining and axial pressures to the specimens, a certain amount of elastic energy is stored in the specimens, and the repeated impact loads do not cause the samples to completely break, resulting in the original elastic stress in the specimens being greater than the loading stress during stress unloading. The residual elastic strain energy accumulated in the sample is released during the unloading process, which leads to the rebound phenomenon.
According to the stress–strain curves after multiple impacts, with increasing impact times, the strain rebound phenomenon of the specimen gradually weakens. This is because microcracks in the specimen begin to expand and penetrate with increasing impact times, and the damage is aggravated, which leads to a decrease in the wave impedance of the specimen. As a consequence, when the stress wave is transmitted to the sample, the amplitude of the superimposed reflected wave grows and the amplitude of the transmitted wave declines due to multiple reflections at the crack interface. Additionally, the peak value of the reflected wave appears later because the direction of the reflected wave is opposite to that of the incident wave. At the same time, because the direction of the transmitted wave is consistent with that of the incident wave, the time of the transmitted wave peak appears earlier and earlier. According to the hypothesis of stress uniformity, the strain of the sample begins to increase, the stress decreases, and the rebound phenomenon gradually weakens. Under the final impact, the first half of the dynamic stress–strain curves of the samples remains approximately straight, while the second half has a significant right-leaning shape, the samples are broken, and the peak strains increase. For the same specimen, as the impact times increase, the hysteresis loop area of the specimen significantly increases.
The difference in the dynamic stress–strain curves of the samples exposed to varying Pc and Pa values is primarily manifested in the growth rate and plastic section. This may be due to the diverse matching correlations between the wave impedance of the specimen and the incident bar under different stress conditions, resulting in differences in the stress level of the specimens. The irreversible plastic deformation of the specimen after dynamic failure is relatively larger in two cases—when the Pa is constant and the Pc is smaller, and when the Pc is constant and the Pa is larger—which agrees fairly well with the expected results.
3.4. Dynamic Strength and Deformation Properties
3.4.1. Dynamic Strength Characteristics
The maximum stress corresponding to the dynamic stress–strain curve obtained for each impact in the repeated impact test of pre-stressed specimens is called the dynamic peak strength (DPS) of the fractured sample at that impact.
Figure 10 reveals the variation in the DPS with the impact times. The impact times,
Pa, and
Pc all have significant effects on the DPS of the specimen. Under certain axial and confining pressures, the DPS of the specimen decreases linearly with increasing impact times. As
Pa and
Pc grow, the change in DPS presents a certain regularity. Specifically, in
Figure 10a, when
Pa = 8 MPa, as
Pc increases from 8 to 20 MPa, the DPS shows an increasing trend, indicating that increasing the
Pc value within the designed range increases the specimen’s ability to resist impact disturbances. In
Figure 10b, when
Pc = 8 MPa, as
Pa grows from 8 to 20 MPa, the DPS tends to decrease. That is, when the impact times are the same and the
Pc remains unchanged, the DPS reduction rate of the rock is greater under larger axial pressure. In summary, the development of cracks inside rocks is influenced by both axial and confining pressures, and the stress environment in which the rock is located promotes corresponding changes in the structural characteristics of the rock, ultimately altering its mechanical properties.
The average value of the DPS of each impact obtained in the repeated impact test is defined as the average DPS of the sample. The correlation between average DPS and axial and confining pressures can indirectly reflect the influence of pre-loading on the deterioration of rock strength.
Figure 11 displays the variation in the average DPS of the sample with a rising
Pc and
Pa. As presented in
Figure 11a, the average DPS of the sample rises with increasing
Pc values, which indicates that
Pc significantly improves the compactness of the specimen. As the
Pc value increases, the development of microcracks is inhibited, and the internal microcracks of the sample are tightly closed, resulting in a further increase in compactness. In
Figure 11b, the average DPS tends to descend with increasing
Pa values, mainly because axial pressure facilitates the initiation and propagation of microcracks inside the specimen, which leads to a decline in the number of impacts the specimen can withstand under the same impact pressure and a decrease in its capability to resist external impact disturbances. If the difference between
Pa and
Pc is defined as deviatoric stress, it can be inferred that the smaller the deviatoric stress, the stronger the rock’s capability to withstand external impacts.
3.4.2. Dynamic Deformation Characteristics
Under the action of dynamic impact loads, rocks undergo instantaneous deformation, and the elastic deformation of rocks in a very short time can be ignored. Hence, the dynamic deformation modulus (DDM) can more accurately reflect the dynamic deformation features of rocks. The DDM is defined as the weighted average of the secant modulus, the first type of secant modulus, and the deformation modulus of the loading section of the dynamic stress–strain curve [
46]. The correlation between the DDM of the sample and the number of impacts is drawn in
Figure 12. There are certain differences in the trend of the DDM with impact times under various
Pa and
Pc values. In
Figure 12a, when
Pa = 8 MPa and the
Pc values are 8, 12, 16, and 20 MPa, the DDM shows a rapid downward tendency with increasing impact times. This is the result of the cumulative evolution of internal damage in the specimen during the cyclic impact process. As the number of impacts increases, the capability of the sample to resist external dynamic loads decreases, and the magnitude of deformation also relatively increases under the same impact load. When the
Pc values are 8 and 12 MPa, respectively, their DDM in the initial impact stage appears cross-phenomenon, that is, when
Pc = 8 MPa, the DDM decreases slowly. When
Pc = 16 MPa, there is an increase in deformation modulus at the last impact. Moreover, with increasing
Pc values, the DDM rises, with the maximum DDM at a
Pc value of 20 MPa and the minimum DDM at a
Pc value of 8 MPa.
In
Figure 12b, when
Pc = 8 MPa and the
Pa values are 8, 14, and 20 MPa, the DDM also shows a downward trend with increasing impact times. The decrease in DDM during the first few impacts is significant. This is because the pre-loaded axial compression makes the microcracks inside the specimen almost completely closed, resulting in damage to the sample during the impact process. The impact resistance of the specimen is greatly reduced, but at this time, the original or newly generated microcracks in the specimen propagate very slowly or even have no time to propagate. In the subsequent repeated impact process, when
Pa = 8 MPa, the DDM decreases almost uniformly. When
Pa = 14 MPa, the DDM decreases uniformly at first and then suddenly. These phenomena can be attributed to the slow expansion of internal microcracks in the sample after multiple impacts. Because of the rapid impact rate, the time for microcrack expansion is limited, resulting in a period of uniform expansion. However, the cumulative damage progressively increases, and the impact resistance of the sample will continue to decrease. Finally, the sudden drop in the DDM is due to the penetration of microcracks, which promotes the macroscopic failure of the sample. When
Pa = 20 MPa, the DDM decreases rapidly, and the magnitude of the decrease is also significant. This is because pre-applied axial pressure has already caused microscopic damage to the specimen, and the specimen experienced the compaction and slow propagation of internal microcracks when the axial pressure was pre-loaded. Under the action of impact load, the specimen begins to undergo macroscopic failure, and the DDM drops rapidly. This is also the reason why the total number of repeated impacts that the sample can withstand under higher axial pressure is lower. In addition, the DDM descends with increasing
Pa values. When the
Pa values are 14 and 20 MPa, their DDM exhibits a cross-phenomenon during the impact stage. The variability in the DDM of the sample under axial pressure conditions is greater than that under confining pressure conditions. The decreasing trend in the DDM varies with different
Pa and
Pc values, and the dynamic mechanical properties of rock masses exposed to diverse static stress environments may also differ significantly under the same impact disturbance. Therefore, fully understanding the changing law of the rock DDM can provide a theoretical basis for predicting the dynamic failure of engineering rock masses.
The average DDM is calculated using the DDM of the samples after each impact under the same
Pa value as well as the same
Pc value. The correlation between the average DDM and the
Pa and
Pc values is shown in
Figure 13. When
Pa = 8 MPa, the average DDM of the specimen shows an increasing trend with increasing
Pc values (
Figure 13a). The presence of confining pressure prevents the lateral deformation of the specimen and enhances the rock’s ability to resist external impacts to some extent. In
Figure 13b, when
Pc = 8 MPa, with increasing
Pa values the average DDM drops, that is, the more new microcracks germinate inside the specimen under the same impact pressure, the greater its compression deformation.
The maximum strain (MS) refers to the maximum value of the strain generated by the specimen after each impact under various axial and confining pressure conditions. The higher the MS, the greater the deformation of the specimen and the more severe the specimen damage. The variation law of MS with impact times is shown in
Figure 14. The MS grows with increasing impact times under diverse
Pa and
Pc values. Due to the differences in
Pc and
Pa, the trend of the MS also changes, and the increasing trend lines appear to intersect or be approximately parallel. When
Pa is constant, the MS decreases with increasing
Pc values (
Figure 14a), while when the
Pc value is constant, the MS grows with increasing
Pa values (
Figure 14b). The changing trend in MS with impact times is exactly opposite to that of the DDM changing with impact times. When
Pa = 8 MPa and the
Pc values are 8 and 12 MPa, respectively, the trend lines of their MSs intersect, and a similar situation also occurs when
Pc = 8 MPa and the
Pa values are 14 and 20 MPa, respectively. In addition, when the
Pc value is constant, the MS curve under a small
Pa value appears in a slow growth stage with increasing impact times, since the deformation is relatively small during this stage due to compaction. Most samples experience a sudden increase in strain during the last one or several impacts, which is due to macroscopic rupture and a decrease in their ability to resist external loads.
3.4.3. Impact Resistance Performance
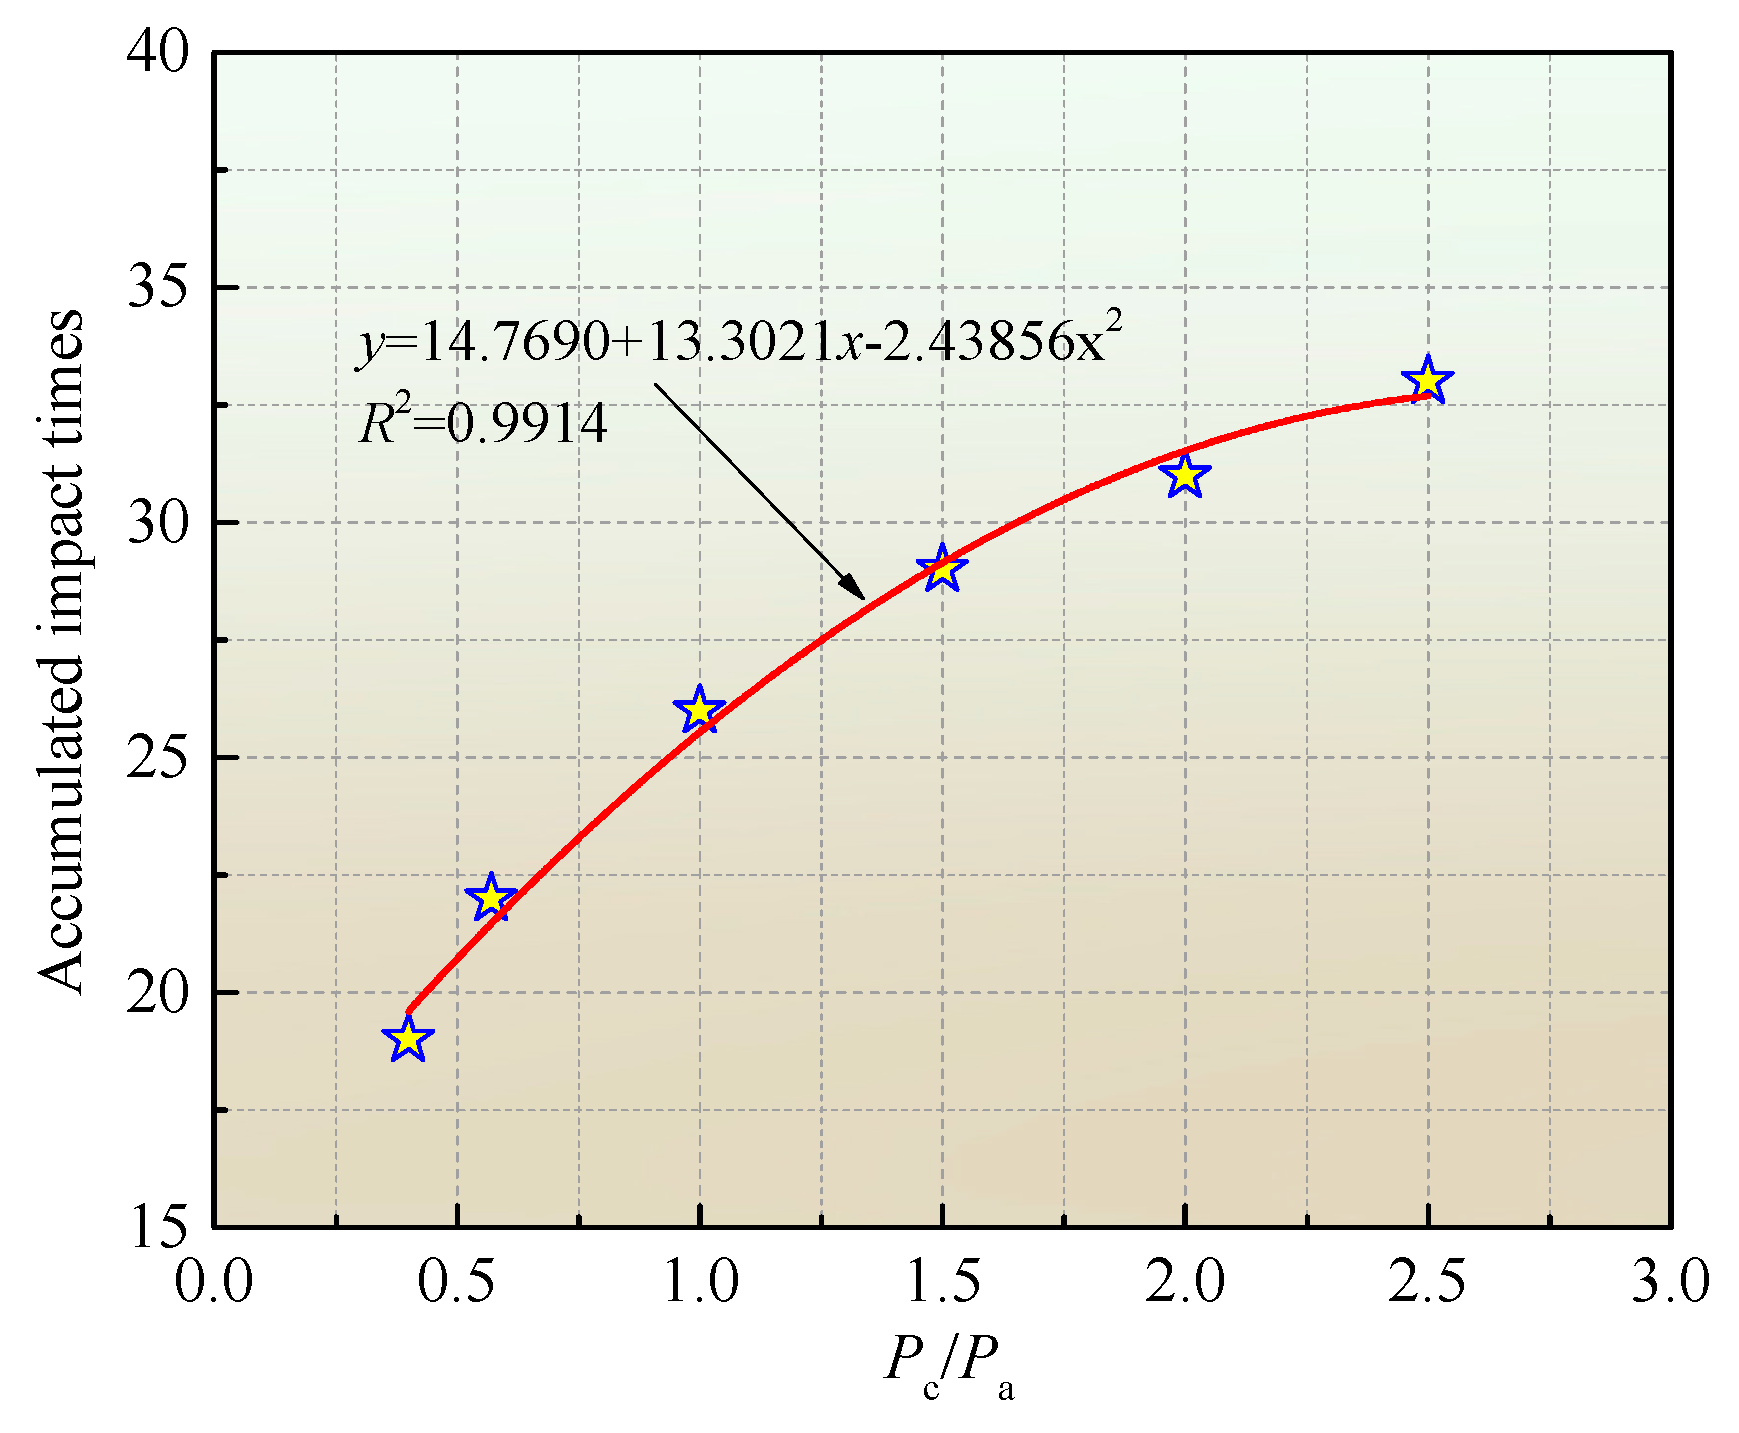
Rock structure and stress conditions have a significant influence on the impact resistance of rocks. In repeated impact tests, the impact resistance of rocks is usually characterized by the number of impacts that they can withstand. To quantitatively analyze the correlation between the accumulated impact times (AITs) that rocks can withstand, confining pressure, and axial pressure, the correlation between the AIT and the ratio of
Pc to
Pa is plotted in
Figure 15. As
Pc/
Pa grows, the AIT gradually rises, roughly showing a quadratic polynomial relationship. It can be predicted that as
Pc/
Pa further increases, the increased rate of AIT will gradually slow down. Because the pre-applied
Pc limits the lateral deformation of the sample to a certain extent, there is no trend of crack propagation inside the specimen under axial pressure. The confining and axial pressures predominantly compact the original microcracks in the specimen, and the specimen eventually fails under repeated impact loads. With increasing impact times, the mechanical properties of the specimen deteriorate, and the effect of
Pc and
Pa on the sample failure can be gradually demonstrated. These findings can be used to accurately predict the total number of cyclic impacts that rocks can withstand under different confining and axial pressures, thus providing a basis for blasting parameter design and dynamic disaster prevention and control in rock engineering.
5. Fractal Features
Recently, fractal theory has been widely applied as a nonlinear dynamic method. Under the combined action of pre-applied confining and axial pressures and repeated dynamic impact loads, fractured specimens gradually break up and produce fragments and debris with different sizes and masses. Currently, the distribution characteristics of these fragments and debris are usually analyzed from the aspects of fragment and debris size and mass to discuss the influence of confining and axial pressures on the fractal dimension of the fractured specimens. The fractal dimension of the sample directly and quantitatively reflects the degree of rock fragmentation. The greater the fractal dimension of the specimen and the more fragments and debris it contains, the higher the degree of fracture.
The fractal dimension of the specimen can be computed by the mass-equivalent side length of the fragments and debris:
in which,
where
is the debris mass corresponding to an equivalent edge length of
;
is the total debris mass;
represents the fractal dimension of the debris;
means the slope value of
in the double logarithmic coordinate system; and
represents the cumulative percentage content of the debris with an equivalent side length less than
.
According to the calculation principles of fractal dimensions, the better the linear correlation between and is, the more apparent the fractal characteristics of the fragments are. If the measured data exhibit a good linear correlation in several different segments, it indicates that the distribution has statistical self-similarity at multiple scales. The fractal dimension D, computed using Equations (5) and (6), ranges from 0 to 3. When D = 0–2, the larger-size fragments account for a significant proportion; when D = 2, the mass proportions of fragments across different size ranges are equal; and when D = 2–3, the smaller-size fragments account for a larger proportion.
After repeated impact tests, the broken sample fragments and debris are collected and sieved. Due to the large amount of fine blocks and particles generated after sample crushing, the sample fragments are finely divided to facilitate the study of the features of the specimen fragments. Thus, the sieve sizes are 0–1, 1–2.5, 2.5–5, 5–10, 10–20, 20–35, 35–50, 50–75, and 75–100 mm, respectively. For fragments smaller than 5.0 mm, it is difficult to directly measure their size, so sieving is performed using a sieve with the corresponding aperture. For fragments larger than 5.0 mm, their size is first measured with a caliper, and then they are weighed. The mass of fragments in different size ranges is recorded, and the largest size fragment of each specimen is selected and weighed. The distribution of fragments after screening is shown in
Figure 17.
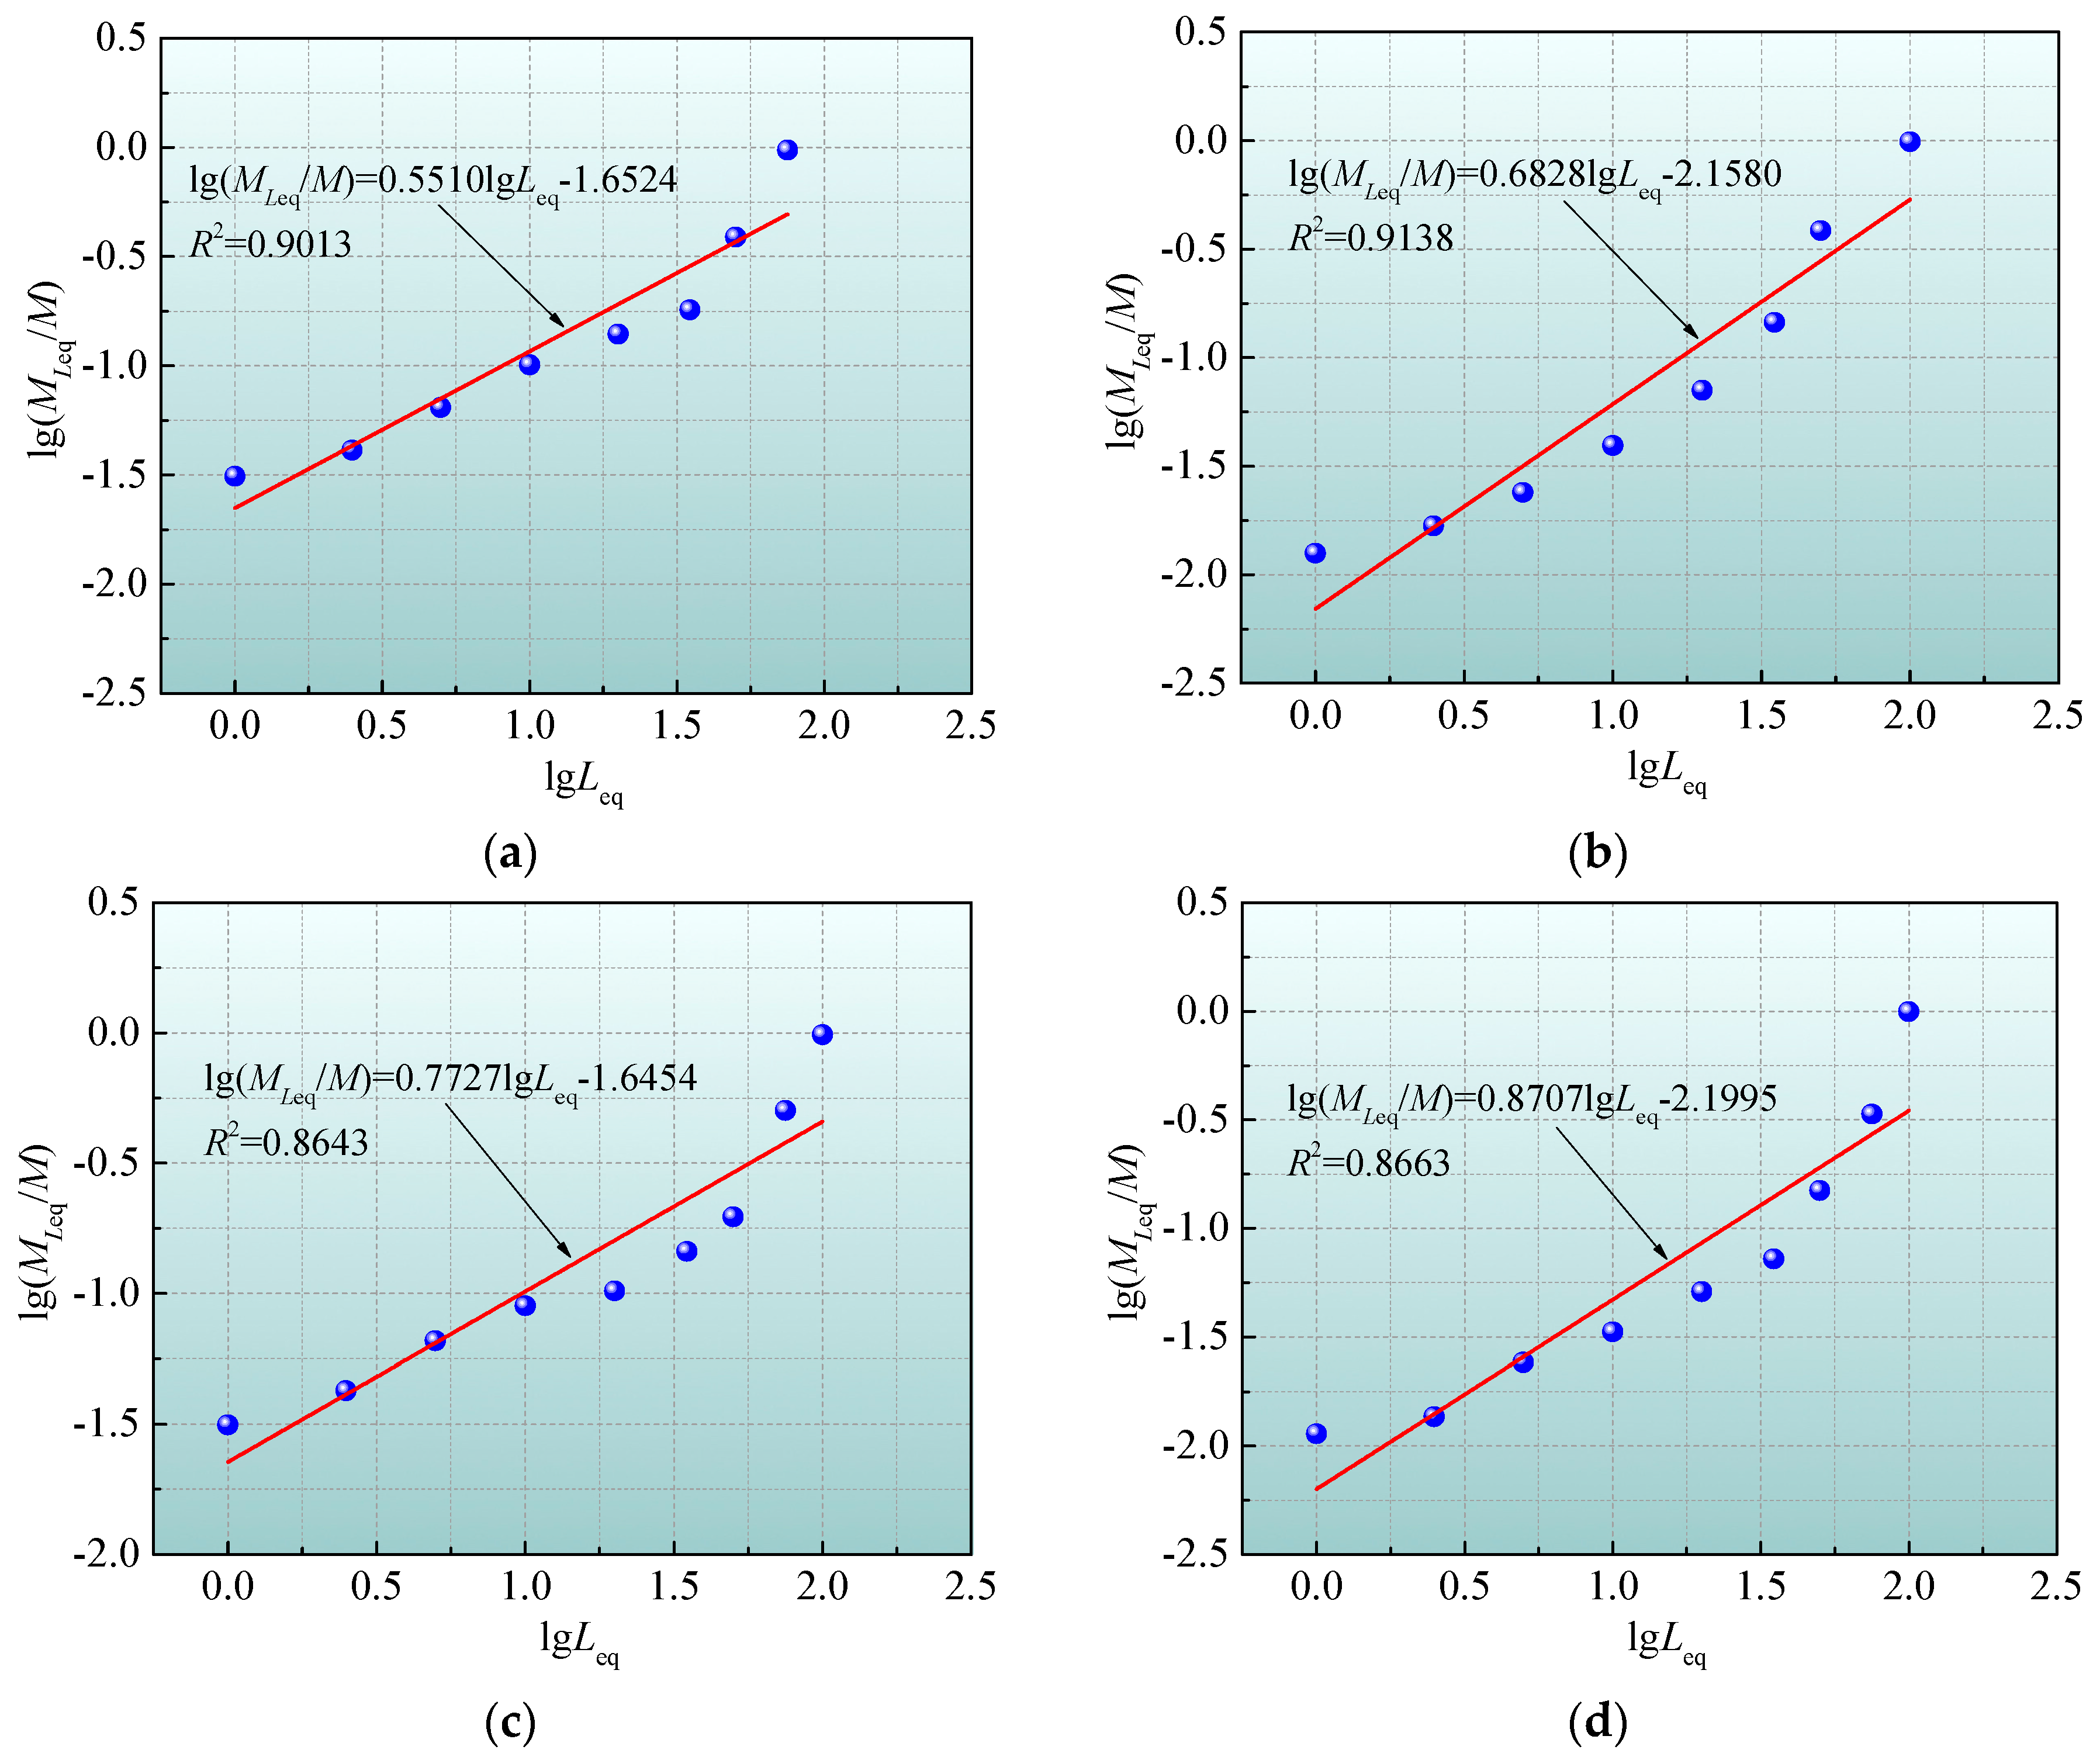
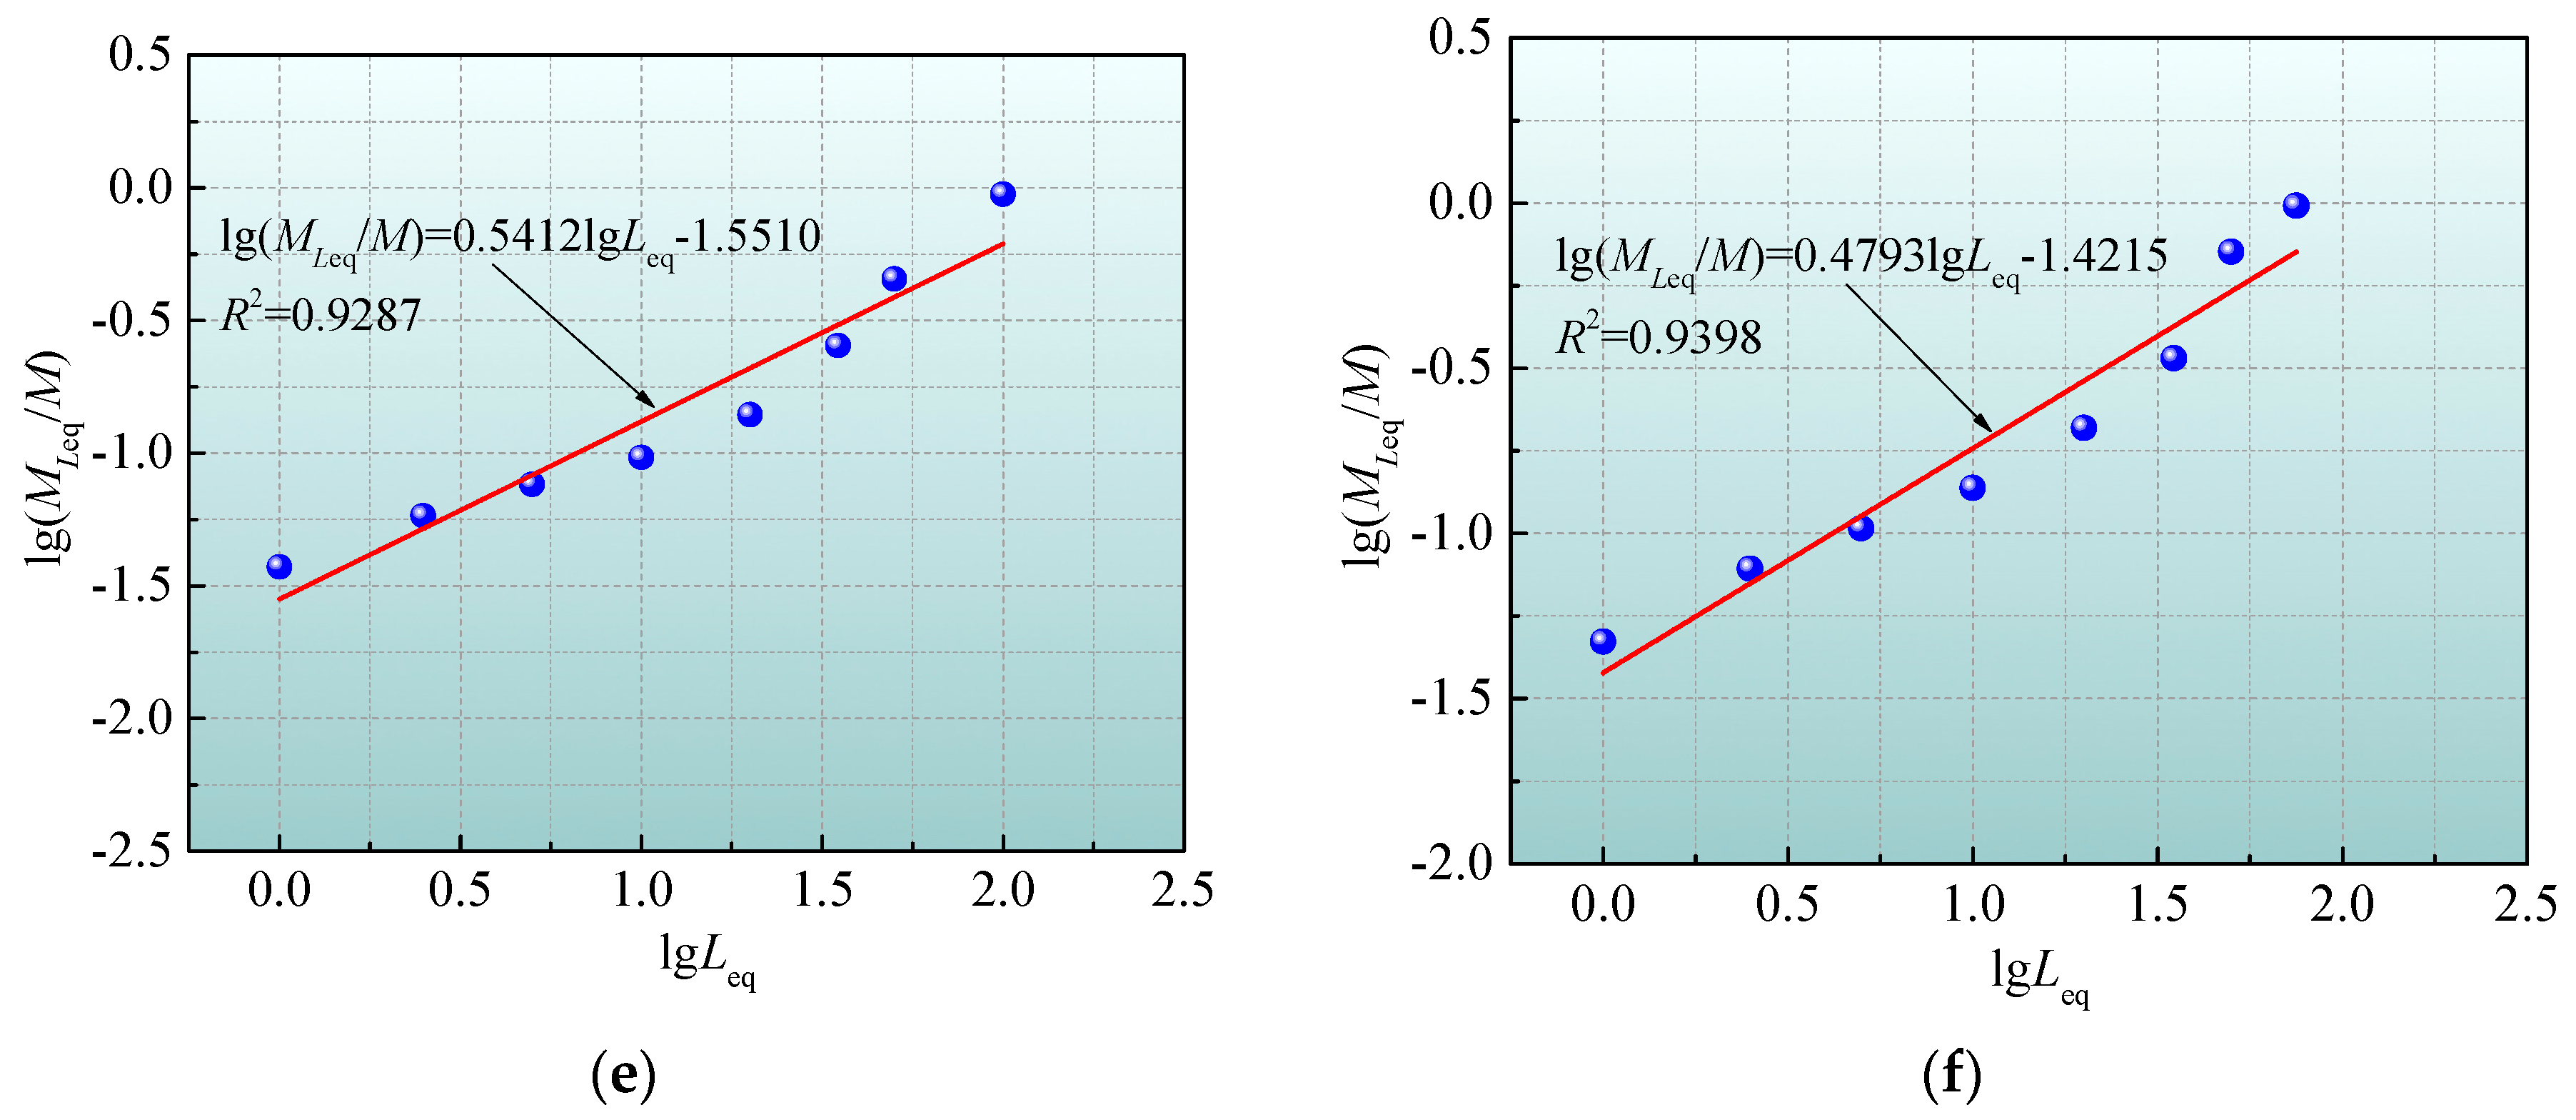
The sieving statistical results of the specimen fragments under different loading conditions are listed in
Table 3, and the relationship between the equivalent edge length and the mass logarithm of the specimen fragments is presented in
Figure 18. It can be found that there is a good linear correlation between
and
, with correlation coefficients greater than 0.86, indicating that the fractal characteristics of the sample fragments under diverse loading conditions are very remarkable. The fractal dimension values of these specimens all lie between 2 and 3, indicating that the proportion of smaller-size fragments is relatively high, which is completely consistent with the actual situation. On the other hand, when
Pa = 8 MPa and the
Pc value increases gradually from 8 to 20 MPa, the fractal dimensions of the samples after repeated impacts are 2.44, 2.32, 2.23, and 2.12, respectively. This implies that as the
Pc value grows, the fractal dimension shows a descending tendency. In other words, under the same
Pa value, specimens that were pre-loaded with smaller
Pc values will be more fragmented when subjected to the same impact load, and the degree of fragmentation of the specimens is less affected by the form of the impact load. This is because when the
Pc value is small, the radial constraint on the specimen is relatively weak, allowing the more sufficient development and propagation of cracks inside the specimen under repeated impact disturbances, leading to larger cumulative damage and a higher degree of fragmentation of the sample. Whereas, when the
Pc value is relatively large, the initial microcracks inside the specimen are compacted, and the specimen experiences greater radial constraint, resulting in an overall increase in specimen strength and making it less prone to severe fragmentation under the same repeated impact load.
In addition, when Pc = 8 MPa and the Pa values are 8, 14, and 20 MPa, the fractal dimensions of the samples obtained after repeated impacts are 2.44, 2.46, and 2.52, respectively. It can be observed that with increasing Pa values, the proportion of small-size fragments of the sample shows an increasing trend. Through the analysis of the failure mode and distribution characteristics of the fragments, it can be induced that the larger Pa values may have caused initial damage to the specimen structure. Under repeated impacts, numerous microcracks formed inside the specimen, which were previously subjected to the larger axial pressure, propagate and penetrate, releasing energy instantly, so that the specimen is severely damaged, and a large number of small-sized fragments are produced. Consequently, when the Pc value is constant, the higher the Pa value, the greater the fractal dimension and the higher the degree of fragmentation of the sample caused by the same repeated impacts. In this case, the risk of dynamic disasters occurring in the rock mass increases, and once a disaster occurs, it will cause significant harm.
By analyzing the fractal dimension of the fractured rock mass after failure under repeated impact loading, important guidance can be provided for rock engineering construction and disaster prevention and control, which is multifaceted. Fractured rock masses undergo multiple breakages and ruptures under repeated impact loads, eventually forming a certain group of fragments. The fractal dimension of the fragments can quantitatively describe their complexity and self-similarity. By analyzing the fractal dimension, the failure mode of the rocks exposed to dynamic loading can be predicted, allowing for an assessment of their stability and degree of failure. Moreover, studying the distribution characteristics of the fragments can help engineers better understand the energy transfer, crack propagation, and fragmentation mechanisms of fractured rock masses in the fracture process, providing a more accurate mathematical model for rock mass failure analysis. Changes in the fractal dimension can be adopted to predict the extent of rock mass fragmentation and possible failure modes under different loading conditions. On the other hand, fractal dimension analysis can effectively evaluate the response characteristics of rock masses at different damage levels to disasters. Particularly under seismic or explosive loading, the extent of rock fragmentation is closely associated with the consequences of the disaster. Fragmented rock masses with high fractal dimensions may lead to changes in the spread features of seismic waves, increasing the risk of secondary disasters (such as landslides and collapses) after the main disaster. Thus, using the fractal dimension to assess fragment characteristics after rock mass failure can provide important data support for disaster prevention and control, emergency response, and safety management. Additionally, quantitative criteria for rock mass stability assessment can be provided by analyzing the fractal dimension. For example, during the construction of tunnels, mines, or other underground structures, the extent of damage to the rock mass under repeated impact loads may affect construction progress and safety risks. Fractal dimension analysis can help engineers design more reasonable support systems, predict any potential rock mass deformation and failure during different construction stages, and thus reduce risks during construction. Furthermore, more effective reinforcement measures are allowed to be taken, tailored to different rock mass failure modes.
6. Conclusions
(1) The amplitude of the transmitted wave declines with increasing axial pressure, the cracks develop in the specimen, and the damage progressively accumulates until the cracks propagate and penetrate. The amplitude of the transmitted wave descends with a rising Pc value, indicating that increasing the Pc value within a certain range can limit the initiation and growth of cracks in the sample, thereby enhancing the ability of the rock to resist external impacts. Moreover, the dynamic stress–strain curves of the samples exposed to diverse Pc and Pa values can be roughly divided into three stages: the approximate elastic stage, crack expansion stage, and post-failure stage, belonging to typical class II rebound curves. With increasing impact times, the strain rebound phenomenon gradually weakens. The difference in the dynamic stress–strain curves of the samples exposed to various Pc and Pa values is primarily manifested in the growth rate and plastic section.
(2) The impact times, Pa value, and Pc value all significantly affect mechanical properties. Under certain axial and confining pressures, with increasing impact times, the DPS and DDM of the specimen drop linearly, while the MS shows an opposite trend. When the Pa value is constant, with increasing Pc values the DPS, average DPS, DDM, and average DDM increase, while the MS declines. When the Pc value is constant, as the Pa value grows the DPS, average DPS, DDM, and average DDM appear to decrease, while the MS increases. In addition, as Pc/Pa rises, the AIT gradually increases, roughly showing a quadratic polynomial relationship.
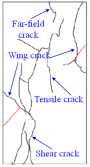
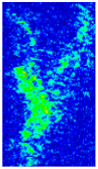
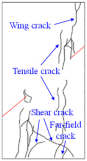
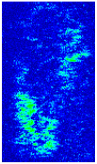
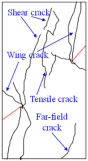
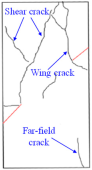
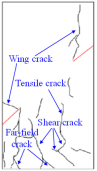
(3) With multiple reflections and transmissions of stress waves, numerous shear cracks and tensile cracks developed in the specimens under low Pc values (8, 12, and 16 MPa), and these cracks are interconnected and converge to form large-scale macroscopic fracture surfaces, and the surface of the samples peels off, leading to a higher degree of ultimate destruction to the samples. The specimen under the higher Pc value (20 MPa) is mainly subjected to tensile failure, with localized small-scale shear failure. Moreover, some shear cracks and tensile cracks developed in the specimen under the low Pa value (8 MPa), while under the higher Pa values (14 and 20 MPa), anti-wing cracks and secondary coplanar cracks developed in the specimens, mainly characterized by shear failure. Overall, three types of cracks can be observed from the dynamic fracture characteristics of the samples exposed to various Pc and Pa values—tensile cracks, shear cracks, and tensile + shear cracks—which are determined by the behavior of crack initiation and propagation.
(4) When Pa = 8 MPa and the Pc value increases gradually from 8 to 20 MPa, the fractal dimensions of the samples after repeated impacts are 2.44, 2.32, 2.23, and 2.12, respectively. This implies that as the Pc value rises, the fractal dimension shows a downward tendency. In addition, when Pc = 8 MPa and the Pa values are 8, 14, and 20 MPa, the fractal dimensions of the samples obtained after repeated impacts are 2.44, 2.46, and 2.52, respectively. The larger the pre-applied axial pressure, the greater the fractal dimension and the higher the degree of fragmentation of the sample caused by the same repeated impacts. By analyzing the fractal dimension of the fractured rocks after failure under repeated impact loading, important guidance can be provided for rock engineering construction and disaster prevention and control.


 ,
, 


