Article

Fractal Geometry: Surface Characterization of Printing Paper

Department of Forest Products and Biotechnology, Kookmin University, 77 Jeongneung-ro, Seongbuk-gu, Seoul 02707, Republic of Korea
*
Author to whom correspondence should be addressed.
Fractal Fract. 2025, 9(2), 123; https://doi.org/10.3390/fractalfract9020123
Submission received: 17 December 2024 / Revised: 2 February 2025 / Accepted: 8 February 2025 / Published: 17 February 2025

Abstract

This study investigates the surface characteristics of printing papers using fractal geometry, focusing on surface roughness and surface friction as independent properties. The fractal dimension (FD) was analyzed using the power spectral density method, which provided a more distinct characterization of paper surfaces compared to the variogram method. Surface roughness and friction were measured using a stylus-based contact profilometer, and mean absolute deviation (MAD) parameters, such as the mean absolute deviation of surface roughness (RMAD) and friction, were calculated to capture surface variability. The results revealed that while conventional parameters, such as roughness average (Ra) and the average coefficient of friction, are highly sensitive to measurement conditions, MAD-based parameters demonstrate greater robustness and stability. For instance, the regression equation for RMAD vs. Ra showed a strong correlation, with an R² value close to 1.0. However, the slopes were significantly less than one. Furthermore, FD exhibited weak correlations with surface roughness and friction, with R² values of 0.342 and 0.016, respectively, highlighting its unique ability to characterize autocorrelation or complexity of surface. Additionally, the effects of coating on paper surfaces were evaluated, revealing reduced flocculation of surface profiles but a 5% increase in FD, indicating enhanced surface complexity. These findings underscore the complementary role of FD in providing a comprehensive understanding of surface properties, with potential applications in quality control and the design of paper products.

1. Introduction

In the papermaking industry, the principles of fractal geometry have been applied to analyze the flowability of powders [1] and the properties of porous media [2,3]. Among these applications, fractal dimension (FD) analysis of the surface roughness of paper products has emerged as a promising approach for evaluating their physical properties [4].
Paper is produced via a filtration process in which pulp stock is deposited onto a forming fabric [5,6]. During this process, fibers, being significantly longer than their thickness, predominantly orient themselves within the plane of the paper, thereby creating a layered structure. The uniform distribution of fibers within the paper is influenced by several factors, including the forming consistency, hydrodynamic conditions during the forming stage, and the dimensions and properties of the fibers. This distribution is commonly described by the term “formation”, which encompasses key attributes such as appearance, printability, and strength [7]. Consequently, achieving precise control over formation is a critical focus for papermakers to ensure high-quality paper production [8].
Conventional methods for analyzing paper properties typically involve tensile strength tests, which require precise thickness measurements [9,10,11], but ignore surface roughness, which significantly affects the accuracy of thickness measurements across various paper products [12]. Thickness directly affects the evaluation of tensile strength, which is a key physical property of paper; thus, surface roughness ultimately affects the reliability and consistency of tensile strength results [13]. This highlights the importance of considering surface roughness when analyzing paper properties to ensure accurate and meaningful assessments.
Currently, thickness measurements are performed under applied loads, where the thicknesses of multiple samples are recorded to calculate the mean value, standard deviation, and coefficient of variation (COV) [14]. These metrics are then used to evaluate the physical properties of the product. However, as illustrated in the following example, this method carries the risk of yielding inaccurate assessments, highlighting the need for careful consideration of measurement variability. Figure 1 shows surface roughness profiles with identical mean values of 0 but different FD values [4,12] generated using computer simulation methods [15,16]. As shown in Figure 1, even with identical mean values and standard deviations, the surface roughness profiles vary according to their FD values. This result demonstrates that surface profiles can be significantly different even when they exhibit the same average roughness. As the FD approaches 2, which corresponds to the areal dimension, the profile increasingly fills the surface area. This result demonstrates that surface roughness profiles that are indistinguishable using conventional measurements, such as the mean and standard deviation, can be effectively differentiated by fractal geometry dimension analysis.
In a previous study [17], FD analysis was performed to evaluate the surface roughness of paper and tissue products. However, this analysis failed to identify distinct characteristics specific to each product type, probably due to the versatility of the surface roughness scales of paper products [18]. To address this limitation, this study interprets the FD values of printing paper products using power spectral density (PSD) analysis. Furthermore, this study investigates the relationships between surface roughness, surface friction, and FD via contact profilometry.

2. Materials and Methods

2.1. Materials

Table 1 lists the general printing and writing paper samples used in this study, along with their basis weights, thicknesses, and densities. The samples were conditioned for longer than 48 h at a temperature of 23 °C ± 1 °C and relative humidity (RH) of 50% ± 2%, according to ISO 187:2022 [19].

2.2. Surface Characterization

For surface characterization using a stylus-based contact profilometer (Figure 2), a surface profile is required. Figure 3 shows the surface roughness profile of P&W1 measured using a Kato surface tester (KES-SESRU, Kato Tech, Kyoto, Japan).
The test parameters were set as follows: a scan length of 20 mm, a scan speed of 1 mm/s, and a data acquisition rate of 1000 Hz (equivalent to 1000 points per second) [17]. Each sample was measured 10 times in the machine direction (MD). The experiments were conducted under controlled conditions of 23 °C ± 1 °C and 50% ± 2% RH.
A conical stylus (Figure 2) with a tip radius of 0.5 mm was used to operate the surface profiler, which was designed in accordance with KS M 4057:2021 [20]. This type of stylus is also described in ISO 24118-1:2023 [21]. The conical stylus, with a tip radius of 0.5 mm, has been successfully used to characterize the surface roughness and friction of paper and tissue products [17,22,23]. Its rounded contact area minimizes damage to the sample surface, because it is not sharp.

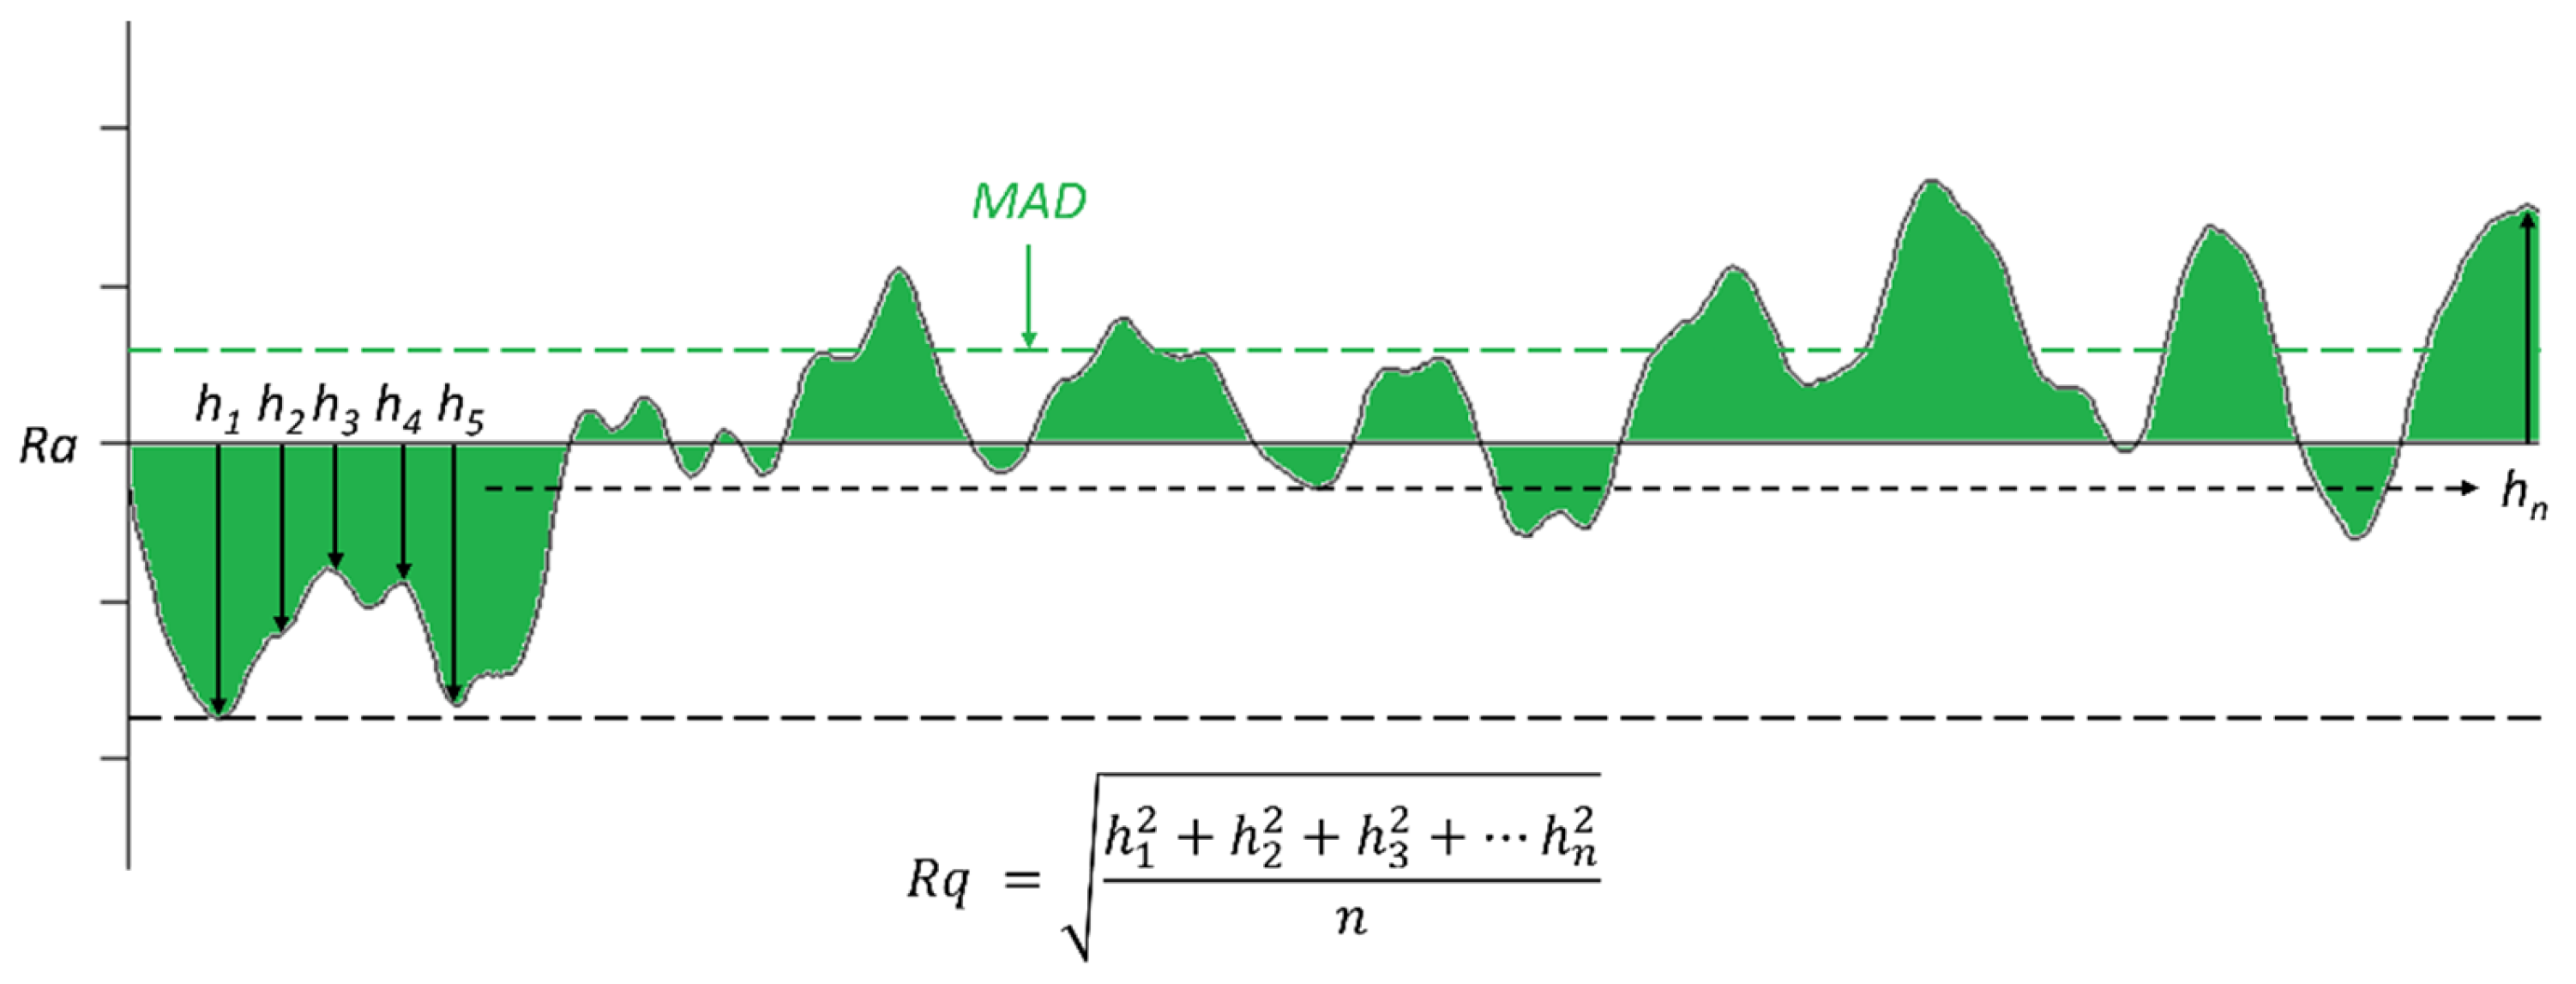
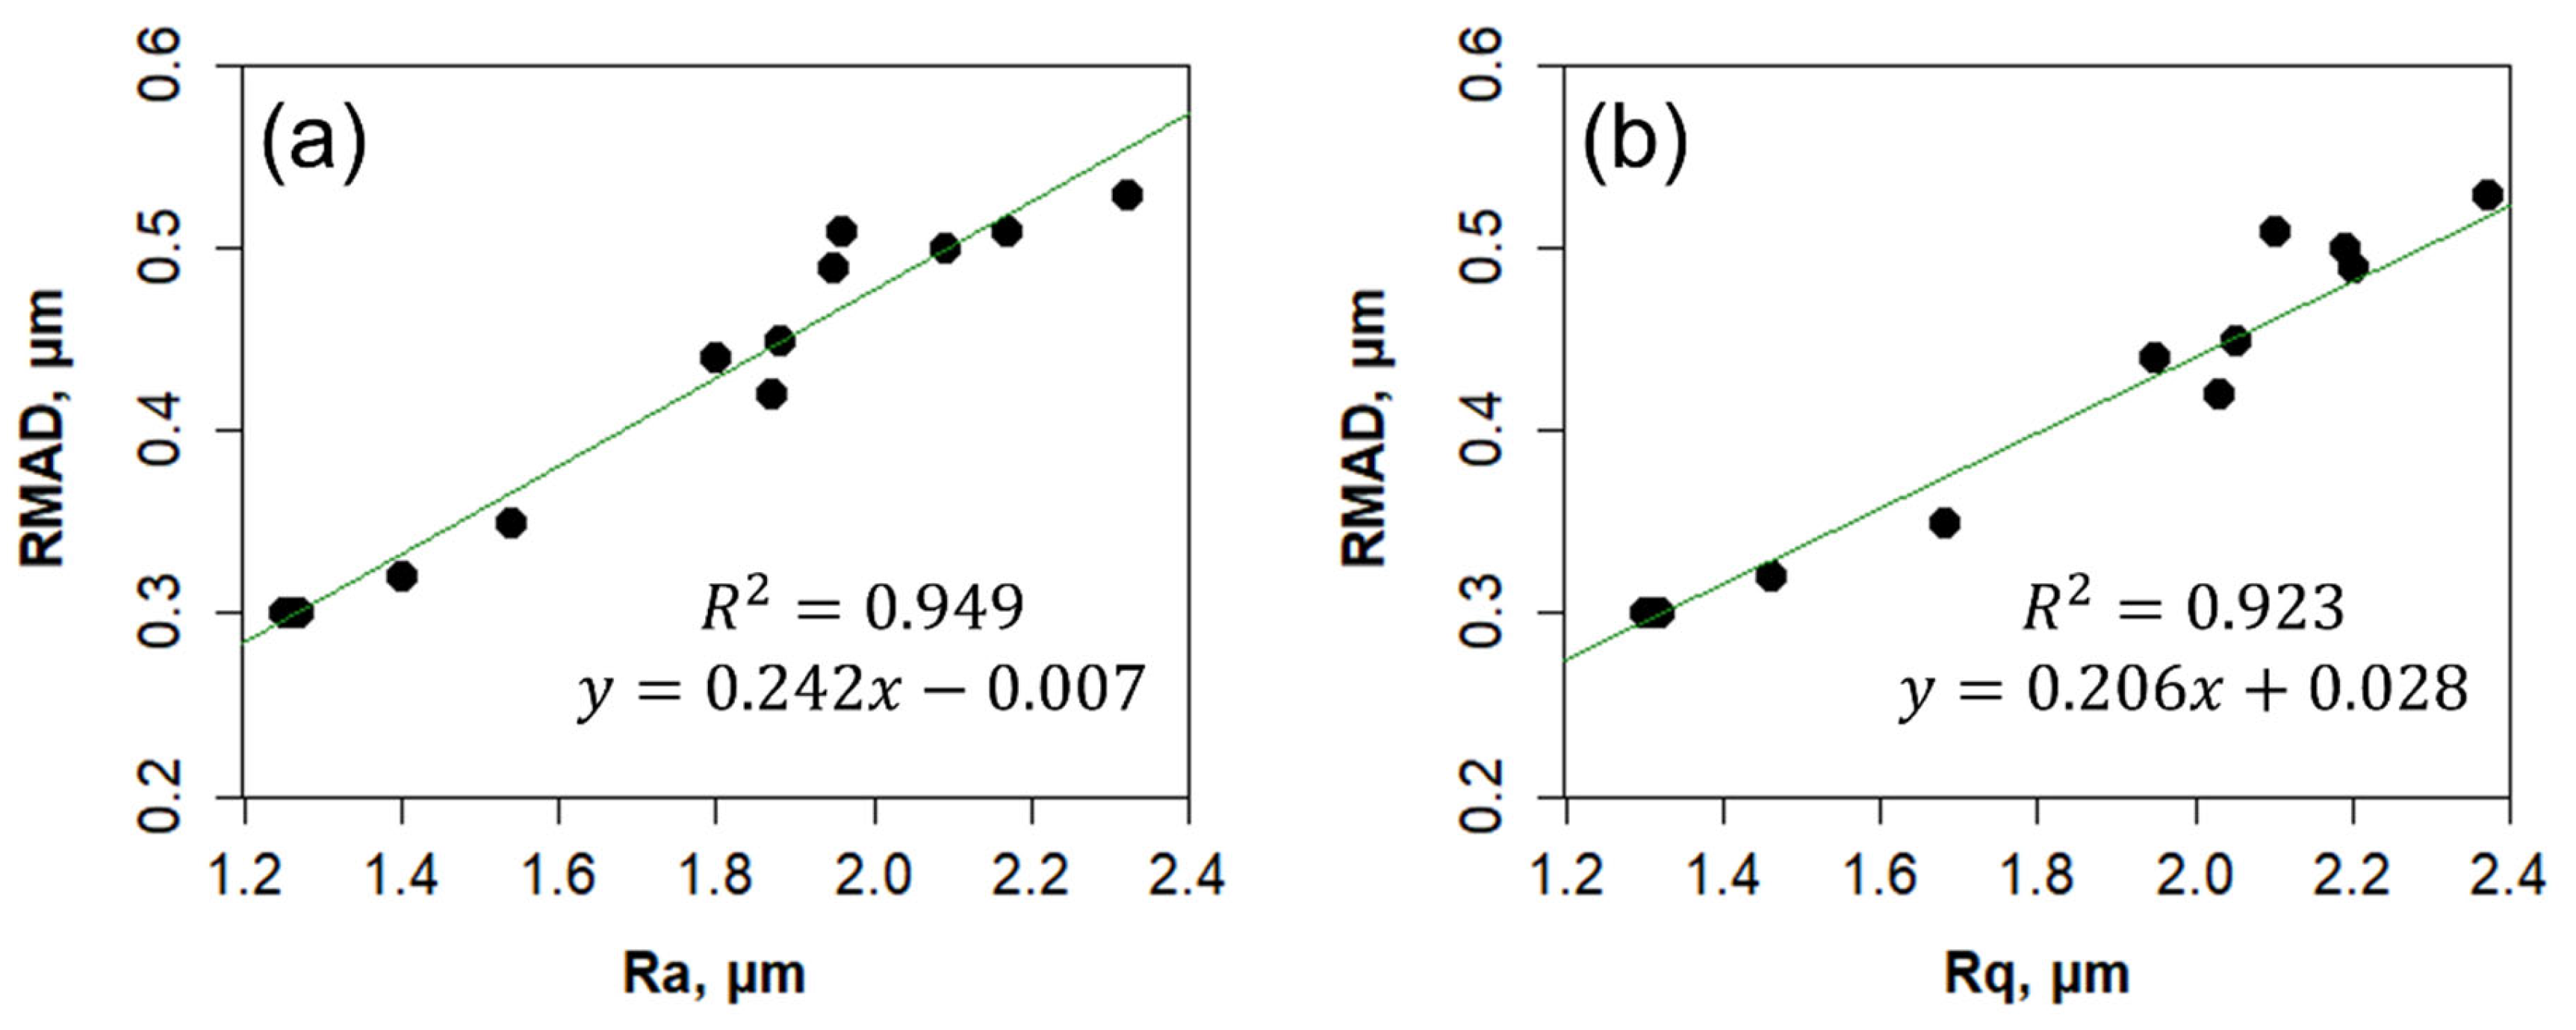
2.2.1. Surface Roughness Characterization

With a surface roughness profile (Figure 3), many surface parameters can be determined according to ISO 21920-2:2021 [24]. Among the surface roughness parameters, the roughness average (Ra) has been widely used [22] and can be calculated as follows:
R a = 1 N 1 N R i ,
where Ra denotes the roughness average (μm), Ri denotes the roughness (μm) at a scanning point I, and N represents the number of data points in the scan length. Here, N is calculated as follows:
N = D A R × L / V ,
where DAR denotes the data acquisition rate (Hz or points/s), L represents the scan length (mm), and V represents the scan speed (mm/s) [17,22,23].
Then, the spacing distance (SD) between two adjacent points can be calculated as follows:
S D = ( L × V ) / ( V / d a r ) = V / d a r .
SD may be interpreted as the measuring unit in a roughness profile, indicating that the shorter the SD, the shorter the measuring unit. However, note that, in Equation (3), SD should be independent of the stylus size and dependent only on the scan speed (V) and the data acquisition rate (DAR) [14,17,22,23]. As a numerical illustration, at DAR = 1000 Hz, L = 20 mm, and V = 1 mm/s, SD = 1 micron.
Another commonly used parameter, square roughness (Rq) is widely used to describe the standard deviation of surface height variations [25,26] and can be calculated as follows:
R q = 1 N i = 1 N R i 2 ,
where R q denotes the root mean square roughness (μm).
The mean absolute deviation (MAD) from Ra (RMAD) can be defined as follows [19]:
R M A D = 1 N 1 N R i R a .
Figure 4 shows a graphical representation of Ra, R q , and R M A D . In the figure, R M A D is calculated by dividing the shaded area by the scan length, as indicated by the dotted lines. Note that when calculating R M A D , Ra is treated as a constant similarly to how the thickness average is treated as a constant when calculating Ra. RMAD has been established as an ISO standard method for determining the surface roughness of paper and paperboards in ISO 24118-1:2023 [21].

2.2.2. Surface Friction Characterization

The Kato Surface Tester can simultaneously generate surface roughness and friction profiles using the same stylus under the same operating conditions. Figure 5 shows the friction profiles of the sample in Figure 3.
The surface friction parameters the average coefficient of friction (COF, MIU) and the MAD from the average COF (FMAD) are calculated using Equations (6) and (7), respectively.
μ ¯ = 1 N 1 N μ i
F M A D = 1 N 1 N μ i μ ¯
where MIU denotes the average COF, N represents the number of data points from the scan length, μi denotes the COF at point i, and FMAD denotes the MAD from the MIU [19,20]. Here, N is calculated using Equation (2). When calculating FMAD, the average COF is treated as a constant, as in the case of RMAD (Figure 4). FMAD has been established as an ISO standard method to determine the friction of tissue products according to ISO 12625-18:2022 [27].

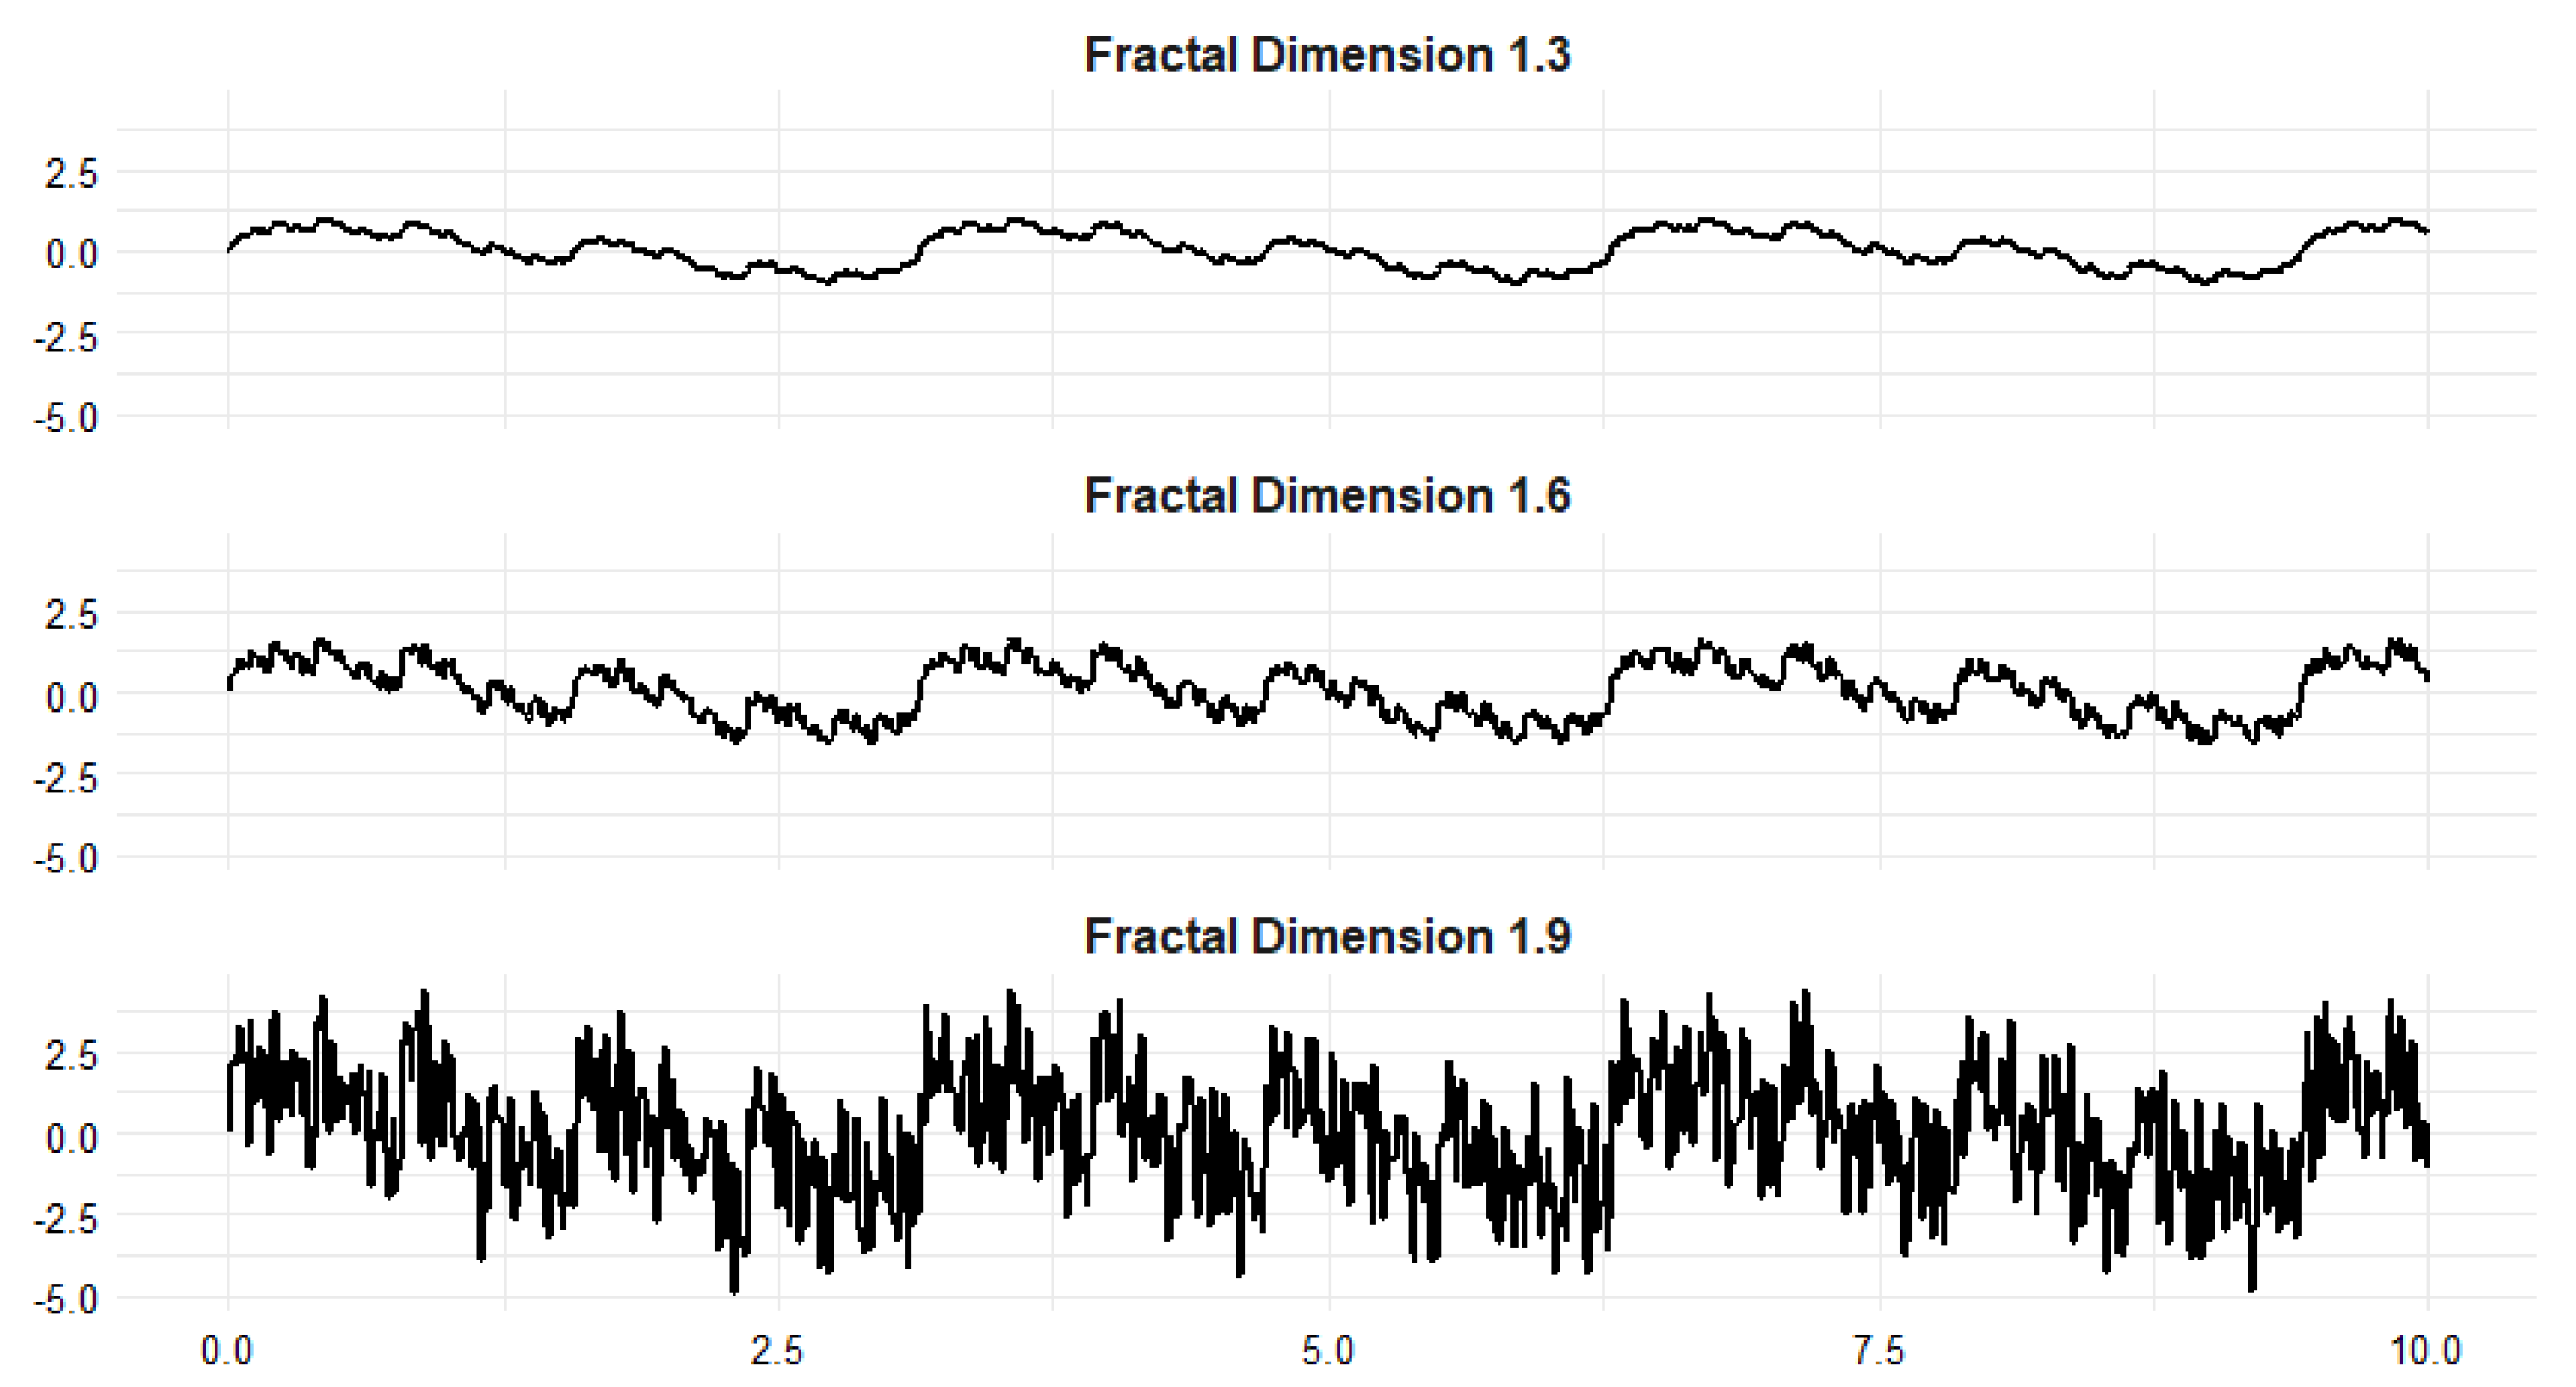
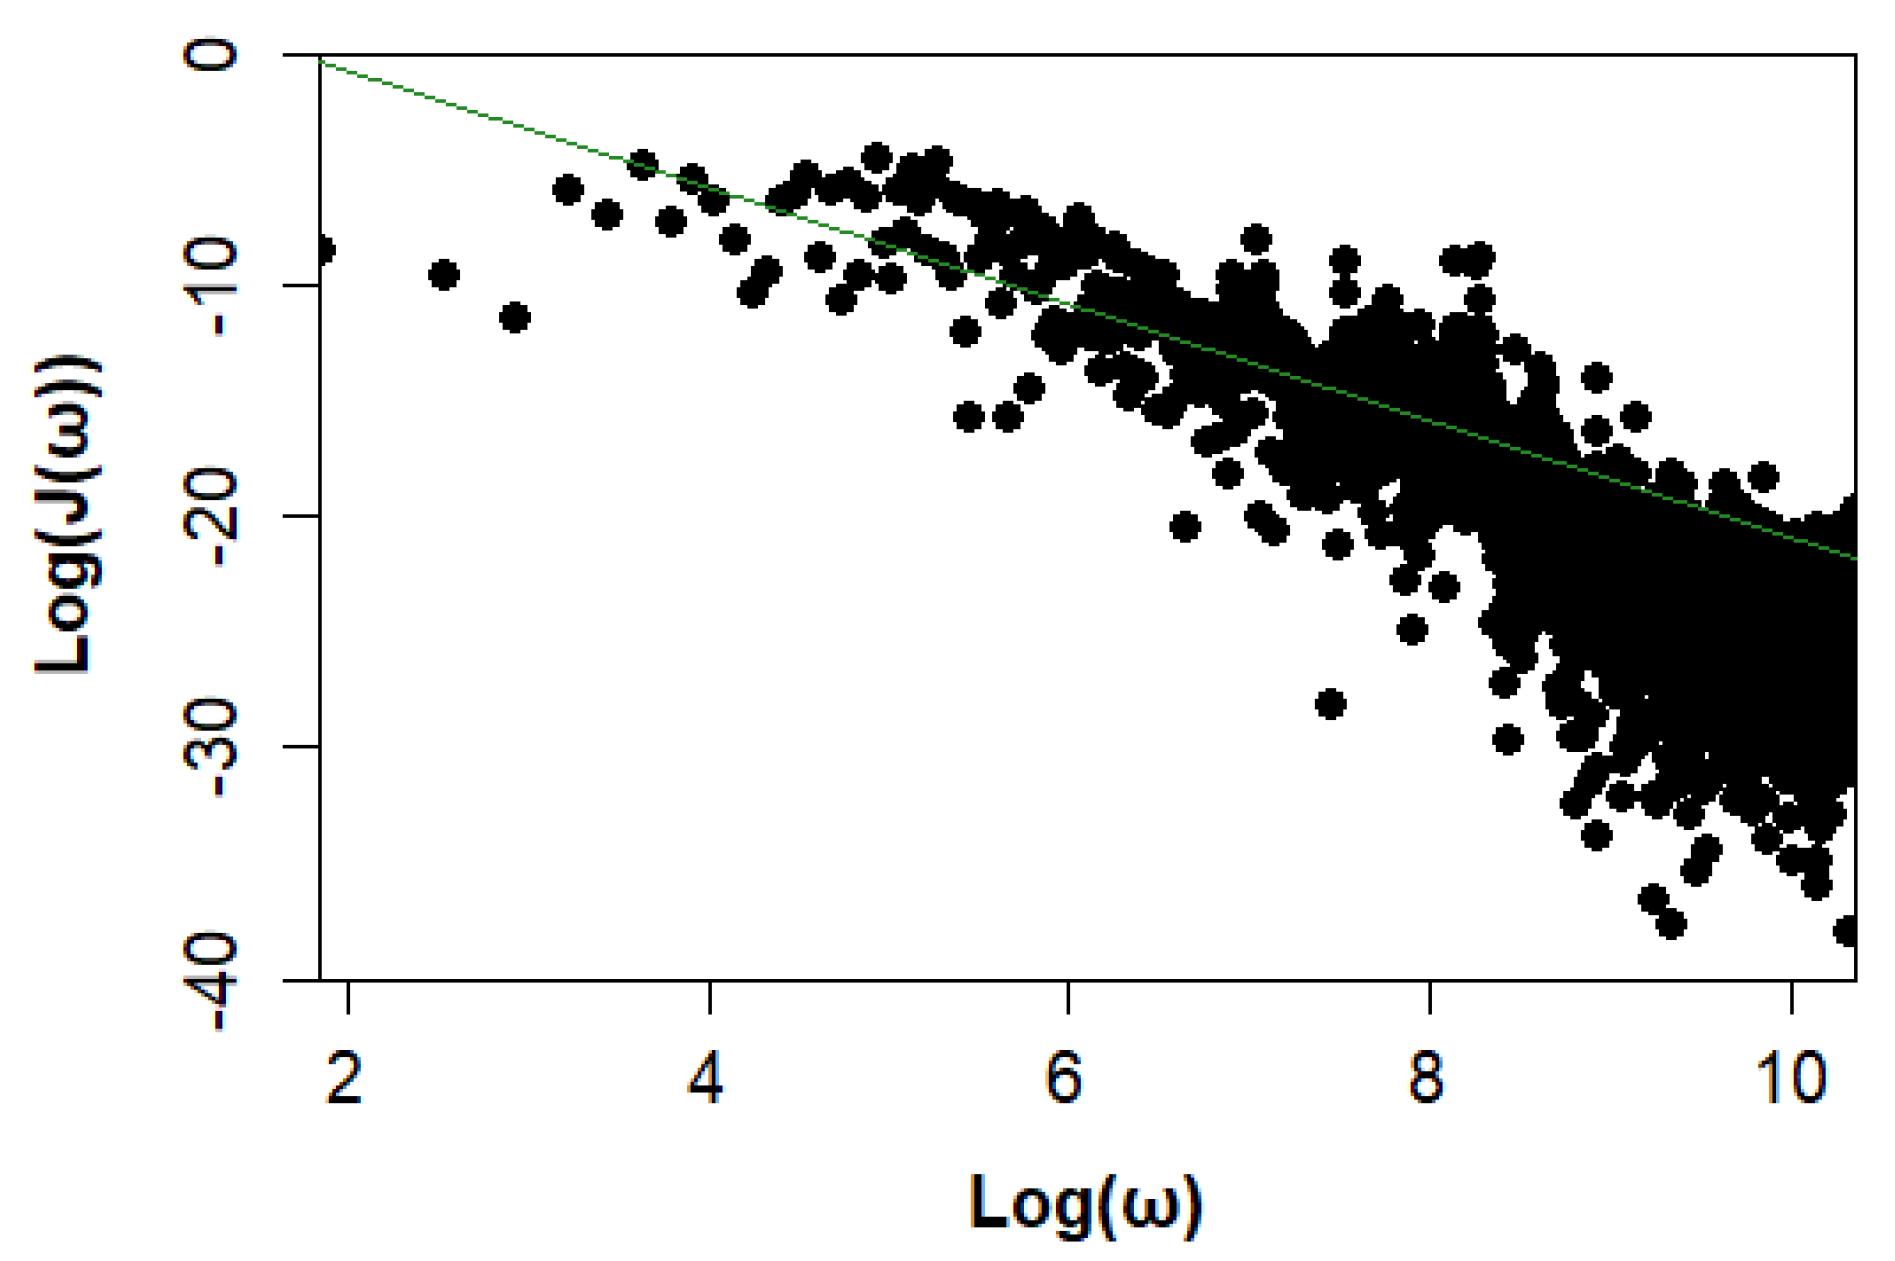
2.3. Fractal Geometry Dimension Analysis of Surface Roughness Profiles

The FD values of the surface roughness profiles were calculated using the periodogram method, which analyzes the relationship between the PSD (J(ω)) and angular frequency (ω) in the frequency domain. Surface roughness profiles, represented by one-dimensional height variations h(x) measured across the surface at evenly spaced intervals, were used as input data for the analysis.
To compute the FD, the roughness profile h(x) (Figure 3) was first transformed into the frequency domain using the Fourier transform as follows:
H ω = h ( x ) e i ω t d x ,
where H ω represents the Fourier-transformed amplitude at each angular frequency ω. The PSD ( J ( ω ) ) was then calculated as the squared magnitude of the Fourier coefficients as follows:
J ω = H ( ω ) 2 .
The periodogram method assumes a power–law relationship between the PSD and angular frequency:
J ω ω β .
Logarithmic transformation was applied to both J ( ω ) and ω , producing a linear relationship in the log–log plot.
log J ω = β log ω + C ,
where C is a constant. Linear regression was performed on the log–log plot to estimate the slope ( β ), which is related to the FD:
F D = β + 1 2
Figure 6 shows the spectral density of P&W1 on a log–log scale, with linear regression applied. This is based on autocorrelation from surface roughness profiles, such as those shown in Figure 3.

3. Results and Discussion

3.1. Surface Roughness of Printing Paper

Table 2 summarizes the surface roughness parameters, including the COV in percentage, of the printing paper samples based on 10 measurements for each sample. As shown in Table 2, the COV values of Ra and Rq were higher than those of RMAD. These findings are consistent with those reported by Park et al. [22] and Lee et al. [17], who found that Ra and Rq varied depending on measurement factors such as stylus size and instrument specifications. In contrast, during RMAD calculations, Ra is treated as a constant, allowing it to reflect the actual surface variation independently of the measurement conditions.
In addition, by comparing P&W11 (uncoated) and P&W12 (coated), all surface roughness parameters were reduced, demonstrating that the effect of coating on a paper surface can be determined using surface profile parameters such as Ra, Rq, and RMAD. Similar results have been obtained by other investigators [14,17,22].
Figure 7 compares RMAD with Ra (Figure 7a) and RMAD with Rq (Figure 7b). The R2 variation indicates strong correlations (0.949 in Figure 7a and 0.923 in Figure 7b). However, the slopes of the equations in both figures are significantly lower than 1, suggesting that Ra and Rq exhibit greater variability than RMAD. This indicates that RMAD provides more stable results, independent of the measurement conditions [17,22].

3.2. Surface Friction of Printing Paper

Table 3 presents the surface friction parameters, including the COV in percentage, of the printing paper samples based on 10 measurements for each sample. As shown in Table 3, the surface friction parameters exhibit similar trends to surface roughness parameters. The COV values of FMAD are less than the MIU values. This implies that the MIU parameters also vary, depending on the measurement conditions for calculating the friction profile parameters [17,23]. Thus, similar to surface roughness parameters, the independence of FMAD on measurement conditions is obvious.
In addition, a comparison between P&W11 (uncoated) and P&W12 (coated) revealed that while MIU increased, FMAD decreased. This result demonstrates that coating significantly reduces the fluctuations in the friction profile, which cannot be captured by the conventional friction parameter MIU [23]. These findings strongly support the argument that FMAD is a more informative parameter for characterizing surface friction than MIU.
Figure 8 compares FMAD and MIU, revealing a weak correlation between the two parameters (R2 = 0.463). This weak correlation highlights the independence of these parameters. FMAD is calculated by subtracting the MIU value at each data acquisition point, thereby allowing FMAD to represent the variation in surface friction profiles rather than the COF. Thus, FMAD is independent of COF and can provide a distinct measure of surface friction variability [17,22,23].

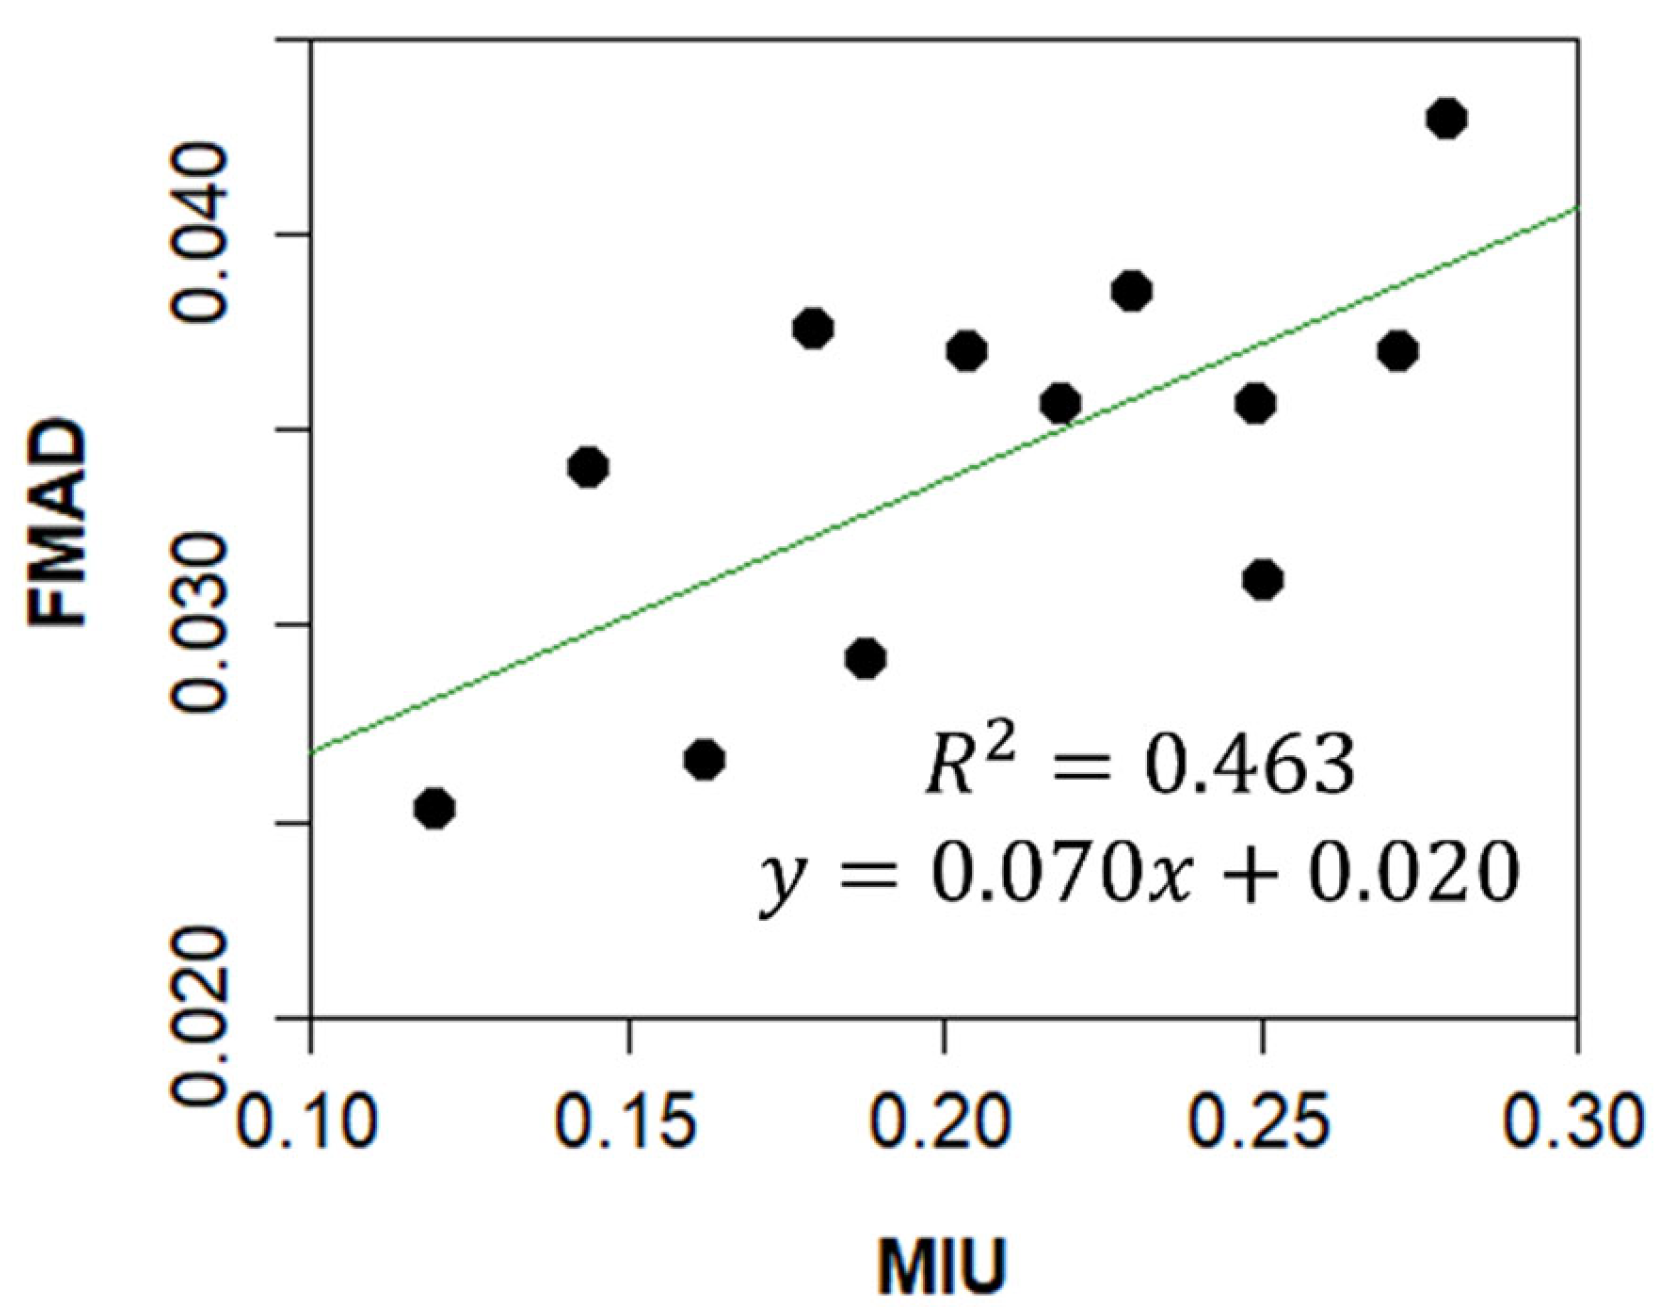
3.3. Surface Friction vs. Surface Roughness

Figure 9 presents the relationship between surface friction and roughness. As shown in Figure 9a, the correlation between the two properties is weak, suggesting their independence. This highlights the importance of measuring both surface roughness and friction for comprehensively characterizing surface properties. To illustrate this point (Figure 10), surfaces A and B, which exhibit the same average roughness and COV, demonstrate distinct performance characteristics [12,28]. For example, in terms of wear resistance, sample A is expected to perform significantly better than sample B despite having similar surface roughness metrics.
Figure 9b shows the relationship between FMAD and RMAD, both of which represent the MAD of surface friction and roughness, respectively. The correlation between FMAD and RMAD is stronger than that between MIU and RMAD.

3.4. FD Analysis of Surface Roughness of Printing Paper

Table 4 presents the FD values, along with the surface roughness and friction parameters. In previous studies [17], FD values calculated using the variogram method [12,29] were typically too similar to effectively distinguish between different paper products. In contrast, this study employed the PSD method for FD analysis, yielding results (Table 4) that are significantly more distinguishable than those obtained using the variogram method.
However, note that most printing paper products undergo a calendering process to enhance the smoothness and quality of the printed material. The calendering process involves pressing the paper against a smooth surface with sufficient force to deform the paper structure as it passes through one or more two-roll nips [8]. Because of this process, the paper surface becomes more uniform, with FD values approaching one.
Figure 11 illustrates the relationship between FD and surface roughness (RMAD). The R2 value of 0.342 indicates a weak correlation between FD and surface roughness, suggesting that the two parameters exhibit distinct and independent characteristics. This observation is consistent with the results presented in Figure 1, further supporting the notion that FD and surface roughness describe fundamentally different aspects of surface properties.
Figure 12 illustrates the relationship between FD and surface friction. The results indicate a weak correlation between the two parameters, suggesting that FD and surface friction exhibit independent characteristics. This highlights the distinct nature of FD as a parameter that captures surface complexity, which is not directly related to conventional frictional properties.
Based on these findings, FD can be used as a complementary parameter to evaluate surface characteristics. Its ability to capture unique surface information, independent of conventional roughness and friction metrics [30,31,32,33], highlights its potential for providing a more comprehensive understanding of surface properties.

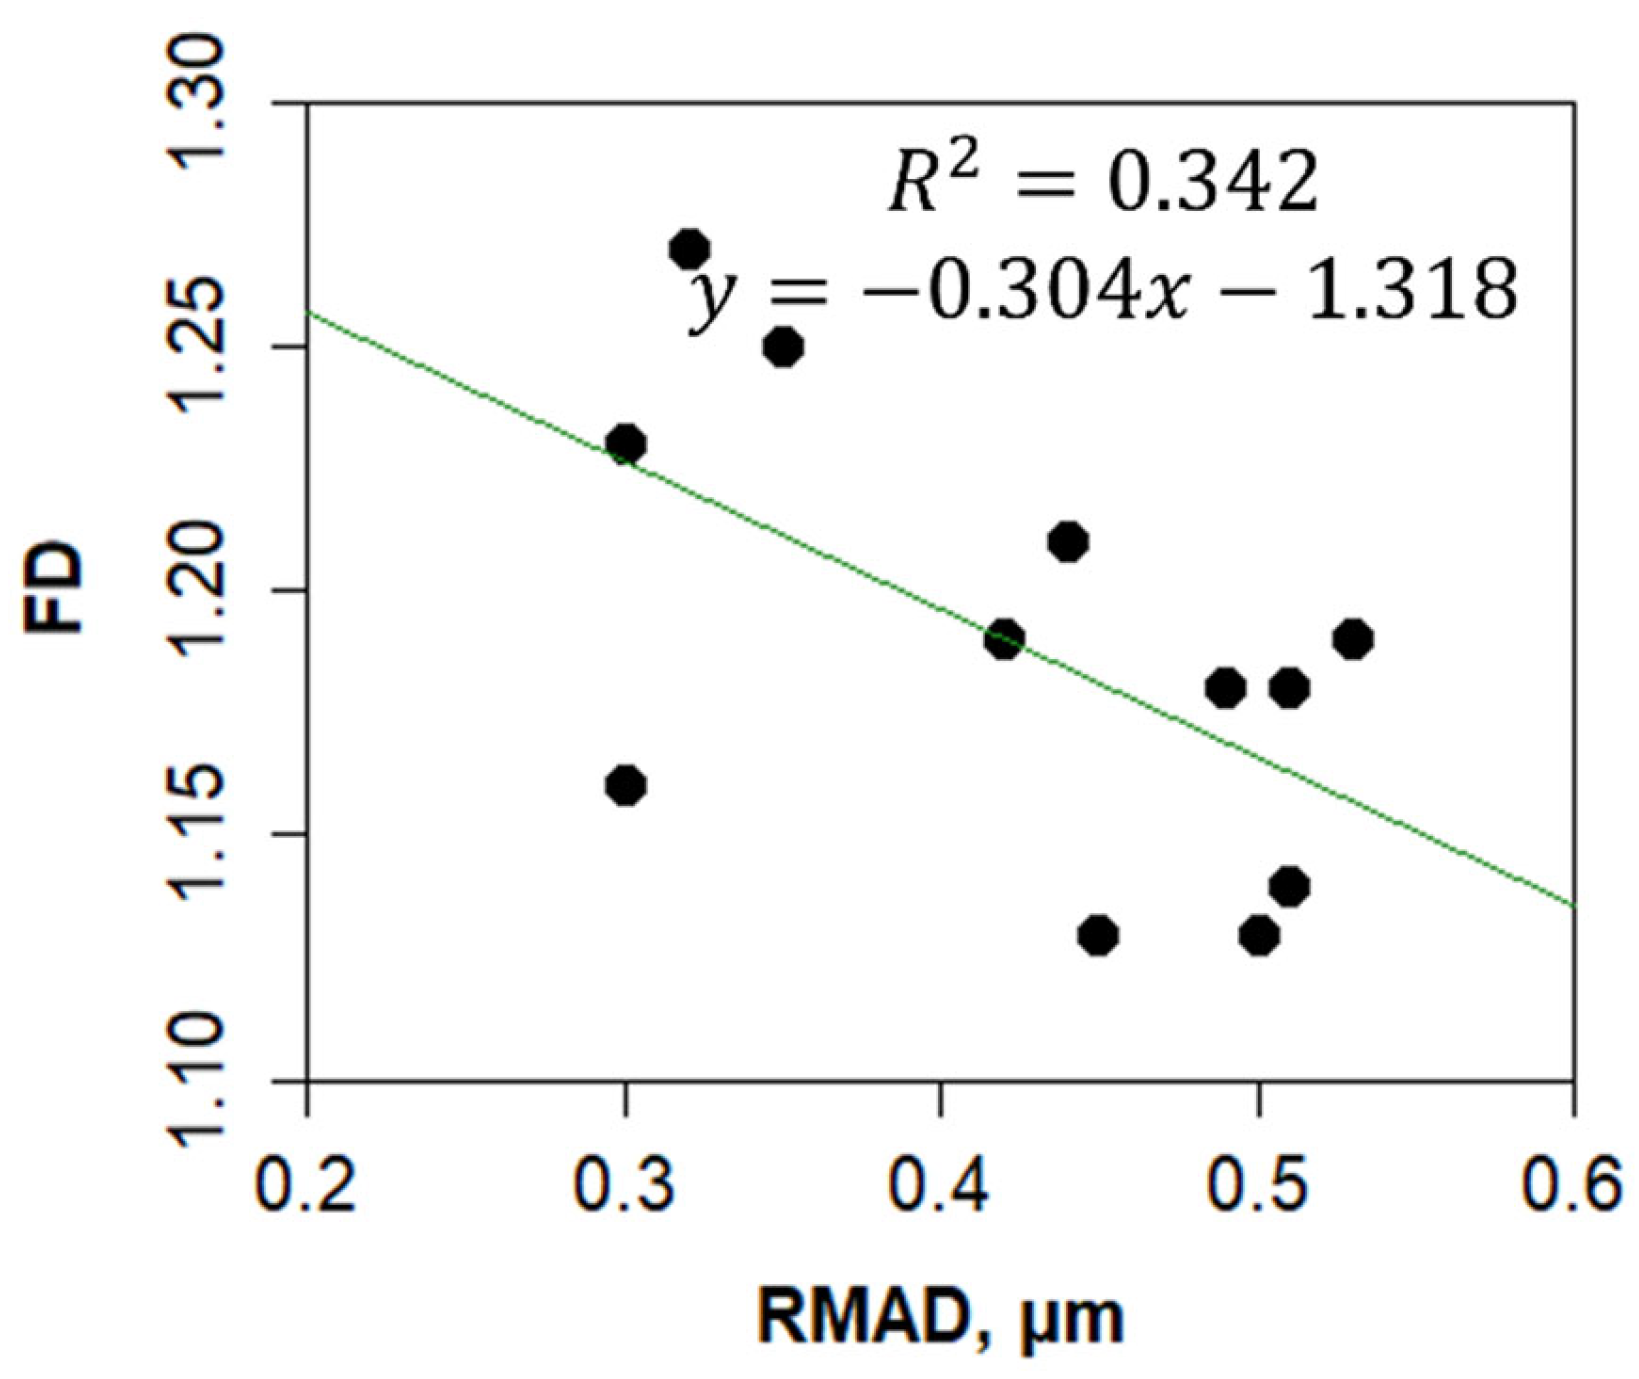
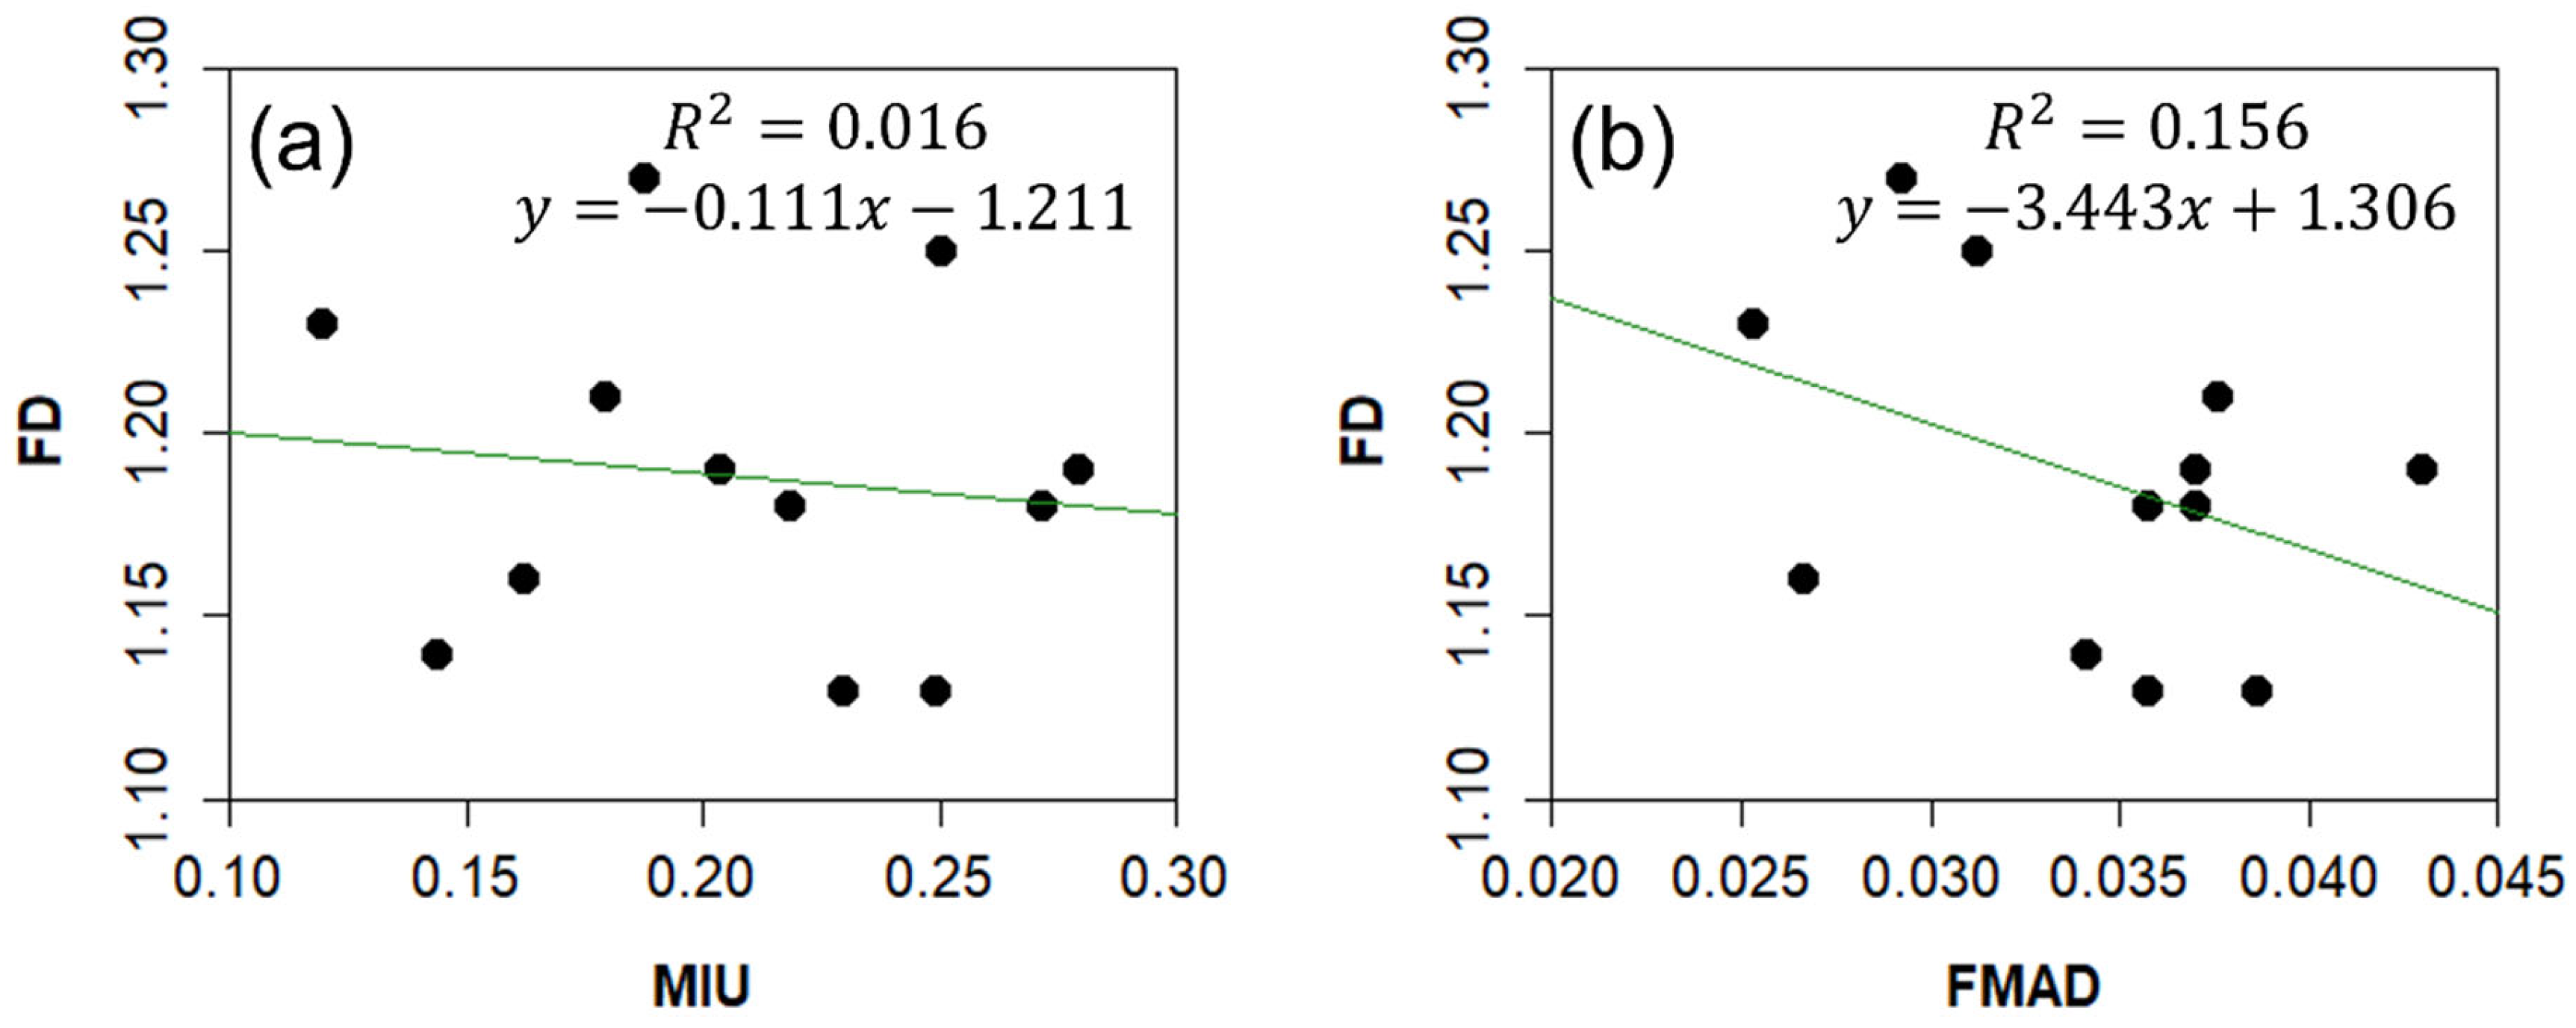
3.5. Application of Fractal Geometry to Surface Characterization

A comparison of surface parameters between the P&W11 (uncoated) and P&W12 (coated) paper samples highlights the effects of coating on surface properties (Table 5). The surface roughness and friction profiles of these samples are shown in Figure 13. In general, for coated paper to meet print quality requirements, the paper surface must be filled with a suitable pigment-rich composition to enhance smoothness. The coating also improves gloss, slickness, color, printing detail, and brightness. Therefore, coating pigments such as clay, CaCO3, and TiO2 are used with binders or adhesives [8] to produce plastic-like surfaces. The RMAD and FMAD values decreased by 16.7% and 16.2%, respectively, in the coated sample, indicating improved surface uniformity and reduced friction variability after coating. Conversely, the MIU value increased by 23%, suggesting that the coating enhanced the surface friction, probably due to the increased contact area.
The FD increased by 5% in the coated sample, reflecting greater surface complexity introduced by the coating (Figure 14). Unlike RMAD and FMAD, which focus on variability, FD provides insights into the geometric intricacies of surfaces. This result shows that coating not only smooths the surface but also adds finer-scale features, highlighting the complementary role of FD in surface characterization.
Overall, although RMAD and FMAD capture surface variability and MIU reflects friction, FD provides a unique measure of surface complexity. Together, these parameters provide a comprehensive understanding of the impact of coating on surface properties.

4. Conclusions

MAD parameters, such as RMAD and FMAD, exhibit lower variability in surface roughness and friction characterization. In general, surface parameters such as Ra, Rq, and MIU are highly dependent on profilometry measurement conditions. However, MAD parameters for surface roughness and friction provide stable and robust information.
The correlation between surface roughness and friction was investigated. The results indicate that surface roughness and friction are independent, with an R² value of 0.264. Even when surfaces have the same average roughness and deviation, frictional resistance varies depending on the contour shape.
FD values were successfully calculated using the PSD technique, ranging from 1.13 to 1.27. These values were distinguishable from those obtained using the variogram method for FD analysis of printing paper surfaces. FD values were independent of surface roughness and friction, showing weak correlations with R2 values of 0.342 and 0.016, respectively. This suggests that FD provides additional information on surface complexity and autocorrelation properties beyond what conventional surface parameters can offer.
The roles of surface parameters were confirmed by comparing uncoated and coated paper samples. FD analysis offers a comprehensive understanding of coating effects on printing paper surfaces that is not possible using conventional surface parameters. Future research will focus on FD analysis of tissue products and the separation of roughness scales, including macro-, sub-micro-, and micro-scales. The findings will be reported in a future study.

Author Contributions

Y.J.L.: Writing—original draft, Visualization, Formal analysis, Data curation. G.-W.K.: Investigation, Data curation. T.-J.L.: Writing—review & editing, Validation. H.J.K.: Supervision, Conceptualization, Funding Acquisition. All authors have read and agreed to the published version of the manuscript.

Funding

This research has been supported by the Ministry of Science and ICT (Information and Communication Technology) of the Korean government and the National Research Foundation of Korea (Grant No. RS-2023-00301889).

Data Availability Statement

The raw data supporting the conclusions of this article will be made available by the authors on request.

Conflicts of Interest

The authors declare that they have no known competing financial interests or personal relationships that could have appeared to influence the work reported in this paper.

Abbreviations

The following abbreviations are used in this manuscript:
FDFractal Dimension
PSDPower Spectral Density
RaAverage of Surface Roughness
COFCoefficient of Friction
MIUAverage of Coefficient of Friction
MADMean Absolute Deviation
RMADMean Absolute Deviation of Surface Roughness
FMADMean Absolute Deviation of Surface Friction

References

  1. Kaye, B.H. Characterizing the flowability of a powder using the concepts of fractal geometry and chaos theory. Part. Syst. Charact. 1997, 14, 53–66. [Google Scholar] [CrossRef]
  2. Keller, J.B. Flow in random porous media. Transp. Porous Media 2001, 43, 395–406. [Google Scholar] [CrossRef]
  3. Rigby, S.P.; Gladden, L.F. The prediction of transport properties of porous media using fractal models and NMR experimental techniques. Chem. Eng. Sci. 1999, 54, 3503–3512. [Google Scholar] [CrossRef]
  4. Ko, Y.C.; Park, J.-M.; Shin, S.-J. The principles of fractal geometry and its applications for pulp & Paper Industry. J. Korea Tech. Assoc. Pulp Pap. Ind. 2015, 47, 177–186. [Google Scholar]
  5. Jeong, C.W.; Lee, Y.J.; Shin, Y.C.; Choi, M.J.; Kim, H.J. Paper fingerprint by forming fabric: Analysis of periodic marks with 2D lab formation sensor and machine learning for forensic paper-identification. Nord. Pulp Pap. Res. J. 2024, 39, 747–757. [Google Scholar] [CrossRef]
  6. Lee, Y.-J.; Jeong, C.W.; Kim, H.J. Paper fingerprint by forming fabric: Analysis of periodic marks with 2D lab formation sensor and artificial neural network for forensic document dating. BioResources 2024, 19, 7591–7605. [Google Scholar] [CrossRef]
  7. Fellers, C. Paper physics. In Pulp and Paper Chemistry and Technology: Paper Products Physics and Technology; De Gruyter: Berlin, Germany, 2009; Volume 4, pp. 25–67. [Google Scholar]
  8. Smook, G.A. Handbook for Pulp & Paper Technologists; Angus Wilde Publications: Vancouver, BC, Canada, 2002. [Google Scholar]
  9. Borodulina, S.; Kulachenko, A.; Nygårds, M.; Galland, S. Stress-strain curve of paper revisited. Nord. Pulp Pap. Res. J. 2012, 27, 318–328. [Google Scholar] [CrossRef]
  10. ter Fellers, C. Bending stiffness, with special reference to paperboard. In Handbook of Physical Testing of Paper; CRC Press: Boca Raton, FL, USA, 2001; pp. 253–276. [Google Scholar]
  11. Hollmark, H.J.M.D. Mechanical Properties of Paper and Paperboard; Marcel Dekker: New York, NY, USA, 1983; Volume 11, p. 497. [Google Scholar]
  12. Ko, Y.C.; Melani, L.; Park, N.Y.; Kim, H.J. Surface characterization of paper and paperboard using a stylus contact method. Nord. Pulp Pap. Res. J. 2020, 35, 78–88. [Google Scholar] [CrossRef]
  13. Rigdahl, M.; Westerlind, B.; Hollmark, H. Analysis of cellulose networks by the finite element method. J. Mater. Sci. 1984, 19, 3945–3952. [Google Scholar] [CrossRef]
  14. Jeong, H.S.; Ko, Y.C.; Kim, H.-J. Effects of a stylus on the surface roughness determination in a contact method for paper and paperboard. Nord. Pulp Pap. Res. J. 2019, 34, 442–452. [Google Scholar] [CrossRef]
  15. Mandelbrot, B.J.N.Y. The Fractal Geometry of Nature; W H Freeman and Co., Ltd.: New York, NY, USA, 1982. [Google Scholar]
  16. Russ, J.C. Fractal Surfaces; Springer Science + Business Media: Berlin/Heidelberg, Germany, 2013. [Google Scholar]
  17. Lee, Y.J.; Ko, Y.C.; Moon, B.G.; Kim, H.J. Surface characterization of paper products by profilometry with a fractal dimension analysis. BioResources 2023, 18, 3978–3994. [Google Scholar] [CrossRef]
  18. Vernhes, P.; Bloch, J.-F.; Mercier, C.; Blayo, A.; Pineaux, B. Statistical analysis of paper surface microstructure: A multi-scale ap-proach. Appl. Surf. Sci. 2008, 254, 7431–7437. [Google Scholar] [CrossRef]
  19. ISO 187:2022; Paper, Board and Pulps—Standard Atmosphere for Conditioning and Testing and Procedure for Monitoring the Atmosphere and Conditioning of Samples. International Organization for Standardization: Geneva, Switzerland, 2022.
  20. KS M 4057:2021; Determination of Stylus Contact Method of Paper and Board—Surface Friction. Korea Agency for Technology and Standards: Chungbuk, Republic of Korea, 2021.
  21. ISO 24118-1:2023; Paper and board—Stylus contact method—Part 1: Determination of surface roughness. International Organization for Standardization: Geneva, Switzerland, 2023.
  22. Park, N.Y.; Ko, Y.C.; Kim, H.J.; Moon, B.G. Surface characterization of paper products via a stylus-type contact method. BioResources 2021, 16, 5667–5678. [Google Scholar] [CrossRef]
  23. Moon, B.G.; Park, N.Y.; Ko, Y.C.; Kim, H.J. Characterization of paper surfaces by friction profilometry. BioResources 2022, 17, 6067–6078. [Google Scholar] [CrossRef]
  24. ISO 21920-2:2021; Geometrical Product Specifications (GPS)—Surface Texture: Profile—Part 2: Terms, Definitions and Surface Texture Parameters. International Organization for Standardization: Geneva, Switzerland, 2021.
  25. McCool, J.I. Relating profile instrument measurements to the functional performance of rough surfaces. J. Tribol. 1987, 109, 264–270. [Google Scholar] [CrossRef]
  26. Duparré, A.; Ferre-Borrull, J.; Gliech, S.; Notni, G.; Steinert, J.; Bennett, J.M. Surface characterization techniques for determining the root-mean-square roughness and power spectral densities of optical components. Appl. Opt. 2002, 41, 154–171. [Google Scholar] [CrossRef] [PubMed]
  27. ISO 12625-18:2022; Tissue Paper and Tissue Products—Part 18: Determination of Surface Friction. International Organization for Standardization: Geneva, Switzerland, 2022.
  28. Leach, R. Fundamental Principles of Engineering Nanometrology; Elsevier: Amsterdam, The Netherlands, 2014. [Google Scholar]
  29. Barnes, R. Variogram Tutorial; Global Software, Inc.: Raleigh, NC, USA, 2024. [Google Scholar]
  30. Lung, C.W.; Jiang, J.; Tian, E.K.; Zhang, C.H. Relation between fractal dimension and roughness index for fractal surfaces. Phys. Rev. E Stat. Phys. Plasmas Fluids Relat. Interdiscip. Top. 1999, 60, 5121–5125. [Google Scholar] [CrossRef] [PubMed]
  31. Gneiting, T.; Ševčíková, H.; Percival, D.B. Estimators of fractal dimension: Assessing the roughness of time series and spatial data. Stat. Sci. 2012, 27, 247–277. [Google Scholar] [CrossRef]
  32. Bhushan, B.; Ko, P.L. Introduction to tribology. Appl. Mech. Rev. 2003, 56, B6–B7. [Google Scholar] [CrossRef]
  33. Yuan, C.Q.; Li, J.; Yan, X.P.; Peng, Z. The use of the fractal description to characterize engineering surfaces and wear particles. Wear 2003, 255, 315–326. [Google Scholar]
Figure 1. Surface roughness vs. FD.
Fractalfract 09 00123 g001
Figure 2. Configuration of surface tester and conical stylus.
Fractalfract 09 00123 g002
Figure 3. Surface roughness profile of P&W1.
Fractalfract 09 00123 g003
Figure 4. Graphical representations of Ra, Rq, and RMAD.
Fractalfract 09 00123 g004
Figure 5. Surface friction profile of P&W1.
Fractalfract 09 00123 g005
Figure 6. Spectral density of P&W1 on log–log scale.
Fractalfract 09 00123 g006
Figure 7. Comparison of RMAD with Ra (a) and RMAD with Rq (b).
Fractalfract 09 00123 g007
Figure 8. Comparison of FMAD and MIU.
Fractalfract 09 00123 g008
Figure 9. Comparison of MIU with RMAD (a) and FMAD with RMAD (b).
Fractalfract 09 00123 g009
Figure 10. Surfaces with identical roughness but distinct contours.
Fractalfract 09 00123 g010
Figure 11. Comparison of FD with RMAD.
Fractalfract 09 00123 g011
Figure 12. Comparison of FD with MIU (a) and FD with FMAD (b).
Fractalfract 09 00123 g012
Figure 13. Effects of coating on surface roughness (a) and friction profiles (b).
Fractalfract 09 00123 g013
Figure 14. Difference in surface profiles between P&W11 (uncoated) and P&W12 (coated) in the same scan length.
Fractalfract 09 00123 g014
Table 1. Physical properties of printing paper samples.
SampleBasis Weight, g/m2Thickness, mmDensity, g/cm3
P&W186.90.110.78
P&W276.00.100.74
P&W374.10.100.72
P&W481.70.110.74
P&W584.40.110.77
P&W683.60.110.76
P&W780.90.110.74
P&W880.90.110.75
P&W972.50.110.66
P&W1079.50.100.75
P&W1189.20.110.82
P&W12.89.40.110.81
Note: P&W12 is coated paper with coating color using P&W11 as base paper.
Table 2. Surface roughness of printing paper samples.
SampleRa, μmRq, μmRMAD, μm
MeanCOVMeanCOVMeanCOV
P&W11.4015.4%1.4615.4%0.329.5%
P&W22.0914.6%2.1914.4%0.505.1%
P&W31.8813.6%2.0516.1%0.455.8%
P&W41.277.5%1.306.5%0.305.7%
P&W51.808.4%1.9511.5%0.445.6%
P&W61.2512.4%1.3213.0%0.306.8%
P&W72.3210.5%2.3710.3%0.536.4%
P&W81.9516.6%2.2019.9%0.499.2%
P&W91.9617.2%2.1019.7%0.517.6%
P&W102.177.5%2.5524.8%0.513.6%
P&W111.879.4%2.0314.9%0.426.9%
P&W121.5413.3%1.6818.1%0.356.6%
Table 3. Surface friction of printing paper samples.
SampleMIUFMAD
MeanCOVMeanCOV
P&W10.18721.9%0.0299.9%
P&W20.23021.4%0.03917.0%
P&W30.24925.2%0.0369.7%
P&W40.16218.8%0.02713.9%
P&W50.17921.4%0.03811.6%
P&W60.11915.8%0.02512.4%
P&W70.27920.4%0.04316.1%
P&W80.27216.0%0.03713.5%
P&W90.21821.9%0.03610.5%
P&W100.1449.0%0.0348.2%
P&W110.20319.3%0.0379.2%
P&W120.25017.3%0.03115.1%
Table 4. Results of FD analysis of printing paper samples.
SampleRMAD, μmMIUFMADFD
MeanCOVMeanCOVMeanCOVMeanCOV
P&W10.329.5%0.18721.9%0.0299.9%1.273.6%
P&W20.505.1%0.23021.4%0.03917.0%1.133.3%
P&W30.455.8%0.24925.2%0.0369.7%1.133.5%
P&W40.305.7%0.16218.8%0.02713.9%1.164.6%
P&W50.445.6%0.17921.4%0.03811.6%1.214.3%
P&W60.306.8%0.11915.8%0.02512.4%1.234.9%
P&W70.536.4%0.27920.4%0.04316.1%1.195.6%
P&W80.499.2%0.27216.0%0.03713.5%1.183.4%
P&W90.517.6%0.21821.9%0.03610.5%1.182.8%
P&W100.513.6%0.1449.0%0.0348.2%1.145.5%
P&W110.426.9%0.20319.3%0.0379.2%1.195.3%
P&W120.356.6%0.25017.3%0.03115.1%1.253.7%
Table 5. Effect of coating on surface characteristics.
SampleRMAD, μmMIUFMADFD
P&W110.420.2030.0371.19
P&W120.350.2500.0311.25
Change−16.7%23%−16.2%5%
Disclaimer/Publisher’s Note: The statements, opinions and data contained in all publications are solely those of the individual author(s) and contributor(s) and not of MDPI and/or the editor(s). MDPI and/or the editor(s) disclaim responsibility for any injury to people or property resulting from any ideas, methods, instructions or products referred to in the content.

