Article

Multifractal Analysis of Neuronal Morphology in the Human Dorsal Striatum: Age-Related Changes and Spatial Differences

by
Zorana Nedeljković
1,
Bojana Krstonošić
2,
Nebojša Milošević
1,
Olivera Stanojlović
3,
Dragan Hrnčić
3 and
Nemanja Rajković
1,*
1
Department of Biophysics, Faculty of Medicine, University of Belgrade, 11000 Belgrade, Serbia
2
Department of Anatomy, Faculty of Medicine, University of Novi Sad, 21000 Novi Sad, Serbia
3
Institute of Medical Physiology “Richard Burian”, Faculty of Medicine, University of Belgrade, 11000 Belgrade, Serbia
*
Author to whom correspondence should be addressed.
Fractal Fract. 2024, 8(9), 514; https://doi.org/10.3390/fractalfract8090514
Submission received: 4 July 2024 / Revised: 15 August 2024 / Accepted: 19 August 2024 / Published: 30 August 2024

Abstract

:
Multifractal analysis offers a sophisticated method to examine the complex morphology of neurons, which traditionally have been analyzed using monofractal techniques. This study investigates the multifractal properties of two-dimensional neuron projections from the human dorsal striatum, focusing on potential morphological changes related to aging and differences based on spatial origin within the nucleus. Using multifractal spectra, we analyzed various parameters, including generalized dimensions and Hölder exponents, to characterize the neurons’ morphology. Despite the detailed analysis, no significant correlation was found between neuronal morphology and age. However, clear morphological differences were observed between neurons from the caudate nucleus and the putamen. Neurons from the putamen displayed higher morphological complexity and greater local homogeneity, while those from the caudate nucleus exhibited more scaling laws and higher local heterogeneity. These findings suggest that while age may not significantly impact neuronal morphology in the dorsal striatum, the spatial origin within this brain region plays a crucial role in determining neuronal structure. Further studies with larger samples are recommended to confirm these findings and to explore the full potential of multifractal analysis in neuronal morphology research.

1. Introduction

The basal nuclei, a group of subcortical nuclei, are primarily recognized for their motor functions, yet their involvement in various behavioral processes is well documented [1]. Consequently, these nuclei are implicated in numerous neuropsychiatric disorders [2,3]. The (neo)striatum serves as the major input structure of the basal nuclei. The predominant neuronal population in the striatum comprises projection neurons, accounting for approximately 96% of all striatal neurons in rodents and about 74% in primates [4]. The remaining cells, interneurons or local circuit cells, have been classified according to their morphology, physiology and neurochemistry, and include up to six different types [5]. Déjerine (1901) was the pioneer in applying the Golgi impregnation technique to striatal cells [6]. Following his work, numerous researchers have employed both Golgi and modified Golgi methods to examine various neuronal types within the basal nuclei [7,8].
This study investigates binary images of multipolar neurons from the human precommissural neostriatum, specifically the putamen and the head of the caudate nucleus. The morphology of these images has been quantitatively analyzed in previous publications [1,9]. This study, however, focuses on a specific subset of the previous sample, employing a different methodological approach. The images were examined using multifractal analysis, specifically through the examination of generalized dimension and singularity spectra [10].
Multifractal analysis is a form of fractal analysis that is well suited for highly irregular objects exhibiting multiple scaling rules. While neurons have traditionally been considered monofractal objects [11], there are indications of their multifractal features [12,13,14]. One of the secondary objectives of this study is to verify the presence of multiple scaling laws in the morphology of these neurons. Scaling law refers to the set of scales at which a pattern exhibits statistical self-similarity. The primary aims of the study are twofold: first, to explore the potential of multifractal analysis in distinguishing spectral distributions with age, and second, to differentiate neuron morphology from different regions of the neostriatum.

2. Materials and Methods

2.1. Tissue Preparation and Image Acquisition

Postmortem brain material was obtained from thirty adult human individuals during medico-legal autopsies (Center for Forensic Medicine, Toxicology and Molecular Genetics at the Clinical Center of Vojvodina, Serbia). None of the subjects had evidence of neurological or psychiatric diseases [9]. The study was conducted in accordance with the Declaration of Helsinki. The protocol was approved by the Ethical Committee of the University of Novi Sad (Faculty of Medicine in Novi Sad, Serbia) (protocol number 01-39/256-2008), and written informed consent was obtained from the next of kin of the deceased [15].
Tissue blocks containing precommissural putamen and precommissural caudate nucleus head from both cerebral hemispheres were processed according to the Golgi–Kopsch–Bubenaite method. The protocol is described in detail in Lalošević et al. (2005) and Krstonošić et al. (2012) [1,16]. Serial sections along the anteroposterior axis of the precommissural striatum were cut as 100 μm thick slices. Neurons were completely observed through a series of optical sections, i.e., horizontal cross-sections [1]. From such rich material, neurons were isolated in which soma, dendrites and axonal initial part were clearly distinguished from the surrounding structures (other neurons, glial cells and blood vessels) [15].
The sample used in this study consisted of 116 neuron projections, with 60 neurons from the caudate nucleus and 56 neurons from the putamen. Example images from both groups are presented in Figure 1. All images were binary and had a resolution of 1600 × 1212 pixels.
The sample was further divided into three age groups: the first group (30 to 45 years) included 18 caudate nucleus and 12 putamen neurons, the second group (46 to 60 years) included 22 caudate nucleus and 18 putamen neurons, and the third group (61 to 82 years) included 20 caudate nucleus and 26 putamen neurons. Example images from the three age groups are presented in Figure 2.

2.2. Multifractal Analysis

Multifractal analysis is a mathematical tool used to quantify morphologies characterized by multiple scaling laws [17]. Originating from research related to energy dissipation during fully developed turbulence, multifractal analysis has since been applied to a wide range of complex systems [18,19]. The comprehensive theoretical foundation of multifractal analysis has been elaborated in numerous works [20,21,22,23]. This paper focuses on several key calculations necessary for the practical implementation of this analysis using computational tools.
We employed the box-counting method with non-overlapping boxes to determine the two most commonly applied spectra: the spectra of generalized dimensions DQ(Q), and the singularity spectra f(α) vs. α. These calculations were executed using the java-based ImageJ 1.48v plugin called FracLac v2.5 [24].
To calculate the spectrum of generalized dimensions DQ(Q), the object is subjected to a kind of mathematical distortion using moments of order Q designed to accentuate different aspects of the pattern, from finer to coarser [19,24]. Initially, the probability distribution P(i,ε) is determined, representing the number of pixels M contained in an i-th box at a scale ε:
P ( i ,   ε ) = M i ,   ε / [ i = 1 N M i ,   ε ] ,
where N is the total number of boxes containing pixels. This allows for the calculation of the moments of order Q:
I Q , ε = i = 1 N P ( i , ε ) Q .
From this, the generalized dimension DQ(Q) is derived as:
D Q = lim ε 0 1 1 Q ln I Q , ε ln ε .
When forming a singularity spectrum, a multifractal object is decomposed into subsets of points with unique monofractal scaling laws, thereby representing the investigated multifractal object as a collection of monofractal sub-objects [18,20]. Direct determination of the singularity spectrum through numerical computation is shown to be challenging in practice [18]. The calculations of singularity spectra used by the FracLac v2.5 software are based on the important work of Chhabra and Jensen [24,25,26], which provided a significant advancement towards the practical implementation of these calculations [20]. The spectrum is formed by calculating the parameter α, also known as the Hölder exponent, which represents the local regularity or irregularity of a given point on an object at a specific scale [27]. This allows the formation of subsets of points with similar α, which will act as objects with monofractal properties stemmed from the original multifractal object.
To calculate these Hölder exponents, we first determine the measure of mass probability for each box of the size ε [25,26]:
μ i ( Q , ε ) = P i ( Q , ε ) Q i = 1 N P i ( Q , ε ) Q
after which the α is given as:
α Q = i = 1 N ( ε ) μ i ( Q , ε ) · ln P i ( Q , ε ) ln ε .
Each of these subsets of similar α will have their own Hausdorff dimension represented as f(α), which is calculated as:
f ( α Q ) = i = 1 N ( ε ) μ i ( Q , ε ) · ln μ i ( Q , ε ) ln ε .
In this study, values of the parameter Q ranged from −10.0 to 10.0 with a step of 0.25, providing each multifractal spectrum with 81 points. Each point in the spectra was treated as an individual variable. Consequently, each image was associated with three spectra: DQ(Q), α(Q) and f(α) vs. Q, resulting in a total of 243 variables derived from the spectra. Additionally, the singularity spectra f(α) vs. α were presented for a more intuitive understanding of the results, as this is one of the most commonly used multifractal spectra. During the implementation of the box-counting method, 12 grid positions were used. This method is sensitive to the position of box grids during calculations, a phenomenon known as quantization error [24,28]. The grids are not always optimally placed by the software to achieve the actual minimum number of boxes covering the object. To address this, a commonly used “brute force” approach was employed, involving multiple grid positionings to find the optimal position. Theoretically, this number should be as high as possible, but in practice, 12 positions will reduce the possibility of error to an acceptable level [24].
In an attempt to reduce the number of variables and to form a kind of a multifractal “fingerprint” of an image’s spectrum, we extracted four additional variables per spectrum. These variables included maximum and minimum value of a parameter, the range or span (the difference between the maximum and minimum values), and area under the spectrum (abbreviated as AUS). Shown in Figure 3, the AUS parameters were named to avoid confusion with the commonly used “area under the curve” in statistical analysis in the medical field. The AUS values were calculated using the trapezoidal rule for definite integral approximation, where trapezoids were defined by the adjacent equidistant Q-value points in the spectrum. Therefore, additional parameters for generalized dimension spectra were DQmin, DQmax, DQspan and AUS DQ(Q); for Hölder exponent spectra, there are αmin, αmax, αspan and AUS α(Q); and for singularity spectra, there are f(α)min, f(α)max, f(α)span and AUS f(α) vs. Q. With the addition of these variables, the total number of variables used in this study was 256, including age.

2.3. Statistical Analysis

The assumption of normality in variable distributions could not be assured, leading to the use of non-parametric statistical methods. For these purposes, we employed IBM SPSS Statistics v25 software. The correlation between variables and age was evaluated using Kendall’s Tau test. Quantitative differences between age groups were assessed with the Kruskal–Wallis H test, while differences between spatial groups were assessed with the Mann–Whitney U test. Statistical significance was set at p ≤ 0.05.

3. Results

Due to the large number of variables, most of the results will be presented graphically.

3.1. Differentiation by Age

All variables were tested for correlation with age using the non-parametric Kendall’s tau test. Surprisingly, given the large number of variables used, none showed significant correlation with age.
To further investigate potential broader morphological differences with age, the sample was divided into three age groups: 30 to 45 years, 46 to 60 years and 61 to 82 years. Statistical difference between group distributions was tested with the non-parametric Kruskal–Wallis H test. Consistent with the previous correlational findings, the test results indicated no statistically significant differences between the groups for any variable. Thus, the morphology of the neuron projections within this sample did not change significantly with age. The multifractal spectra of median values for the three age groups are presented in Figure 4.
Values of the generalized dimension DQ showed a decrease across almost the entire Q-negative range of the spectra with increasing age, except at Q = −0.25 (Figure 4a). The biggest differences between the groups were observed for Q = −10.0 (between groups 1 and 2, and groups 1 and 3), and for Q = −3.0 (between groups 2 and 3).
Hölder exponent α(Q) spectra (Figure 4b) exhibited similar trends to the DQ(Q) spectra, with the entire Q-negative parts showing a decline in value with age. The most pronounced differences were observed in the middle part of the spectra, at Q = −1.0 (between groups 1 and 2, and groups 1 and 3) and at Q = −0.5 (between groups 2 and 3).
Singularity spectra f(α) vs. Q (Figure 4c) were quite similar across all three age groups. Therefore, the differences observed in the singularity spectra f(α) vs. α (Figure 4d) were primarily attributed to variations in Hölder exponent α(Q) values.
Extreme value parameters and area under the spectrum parameters are presented in Table 1 for each age group and each spectrum type. These parameters were extracted for each individual image, with the table displaying the median and range for each group.
None of the extreme value parameters exhibited statistically significant differences between any of the age groups, which is expected given that they are derived from the spectra with no significant differences. Similarly, the areas under the spectra did not exhibit significant differences between the groups, with relatively similar parameter values across the groups.

3.2. Differentiation by Neuron Spatial Origin

Neuron images from the dorsal striatum in this study were divided into two groups based on their spatial origin: the first group consisted of caudate nucleus neurons, and the second group consisted of putamen neurons. Statistically significant morphological differences between the groups were detected by the majority of the variables used.

3.2.1. Spectrum of Generalized Dimensions DQ(Q)

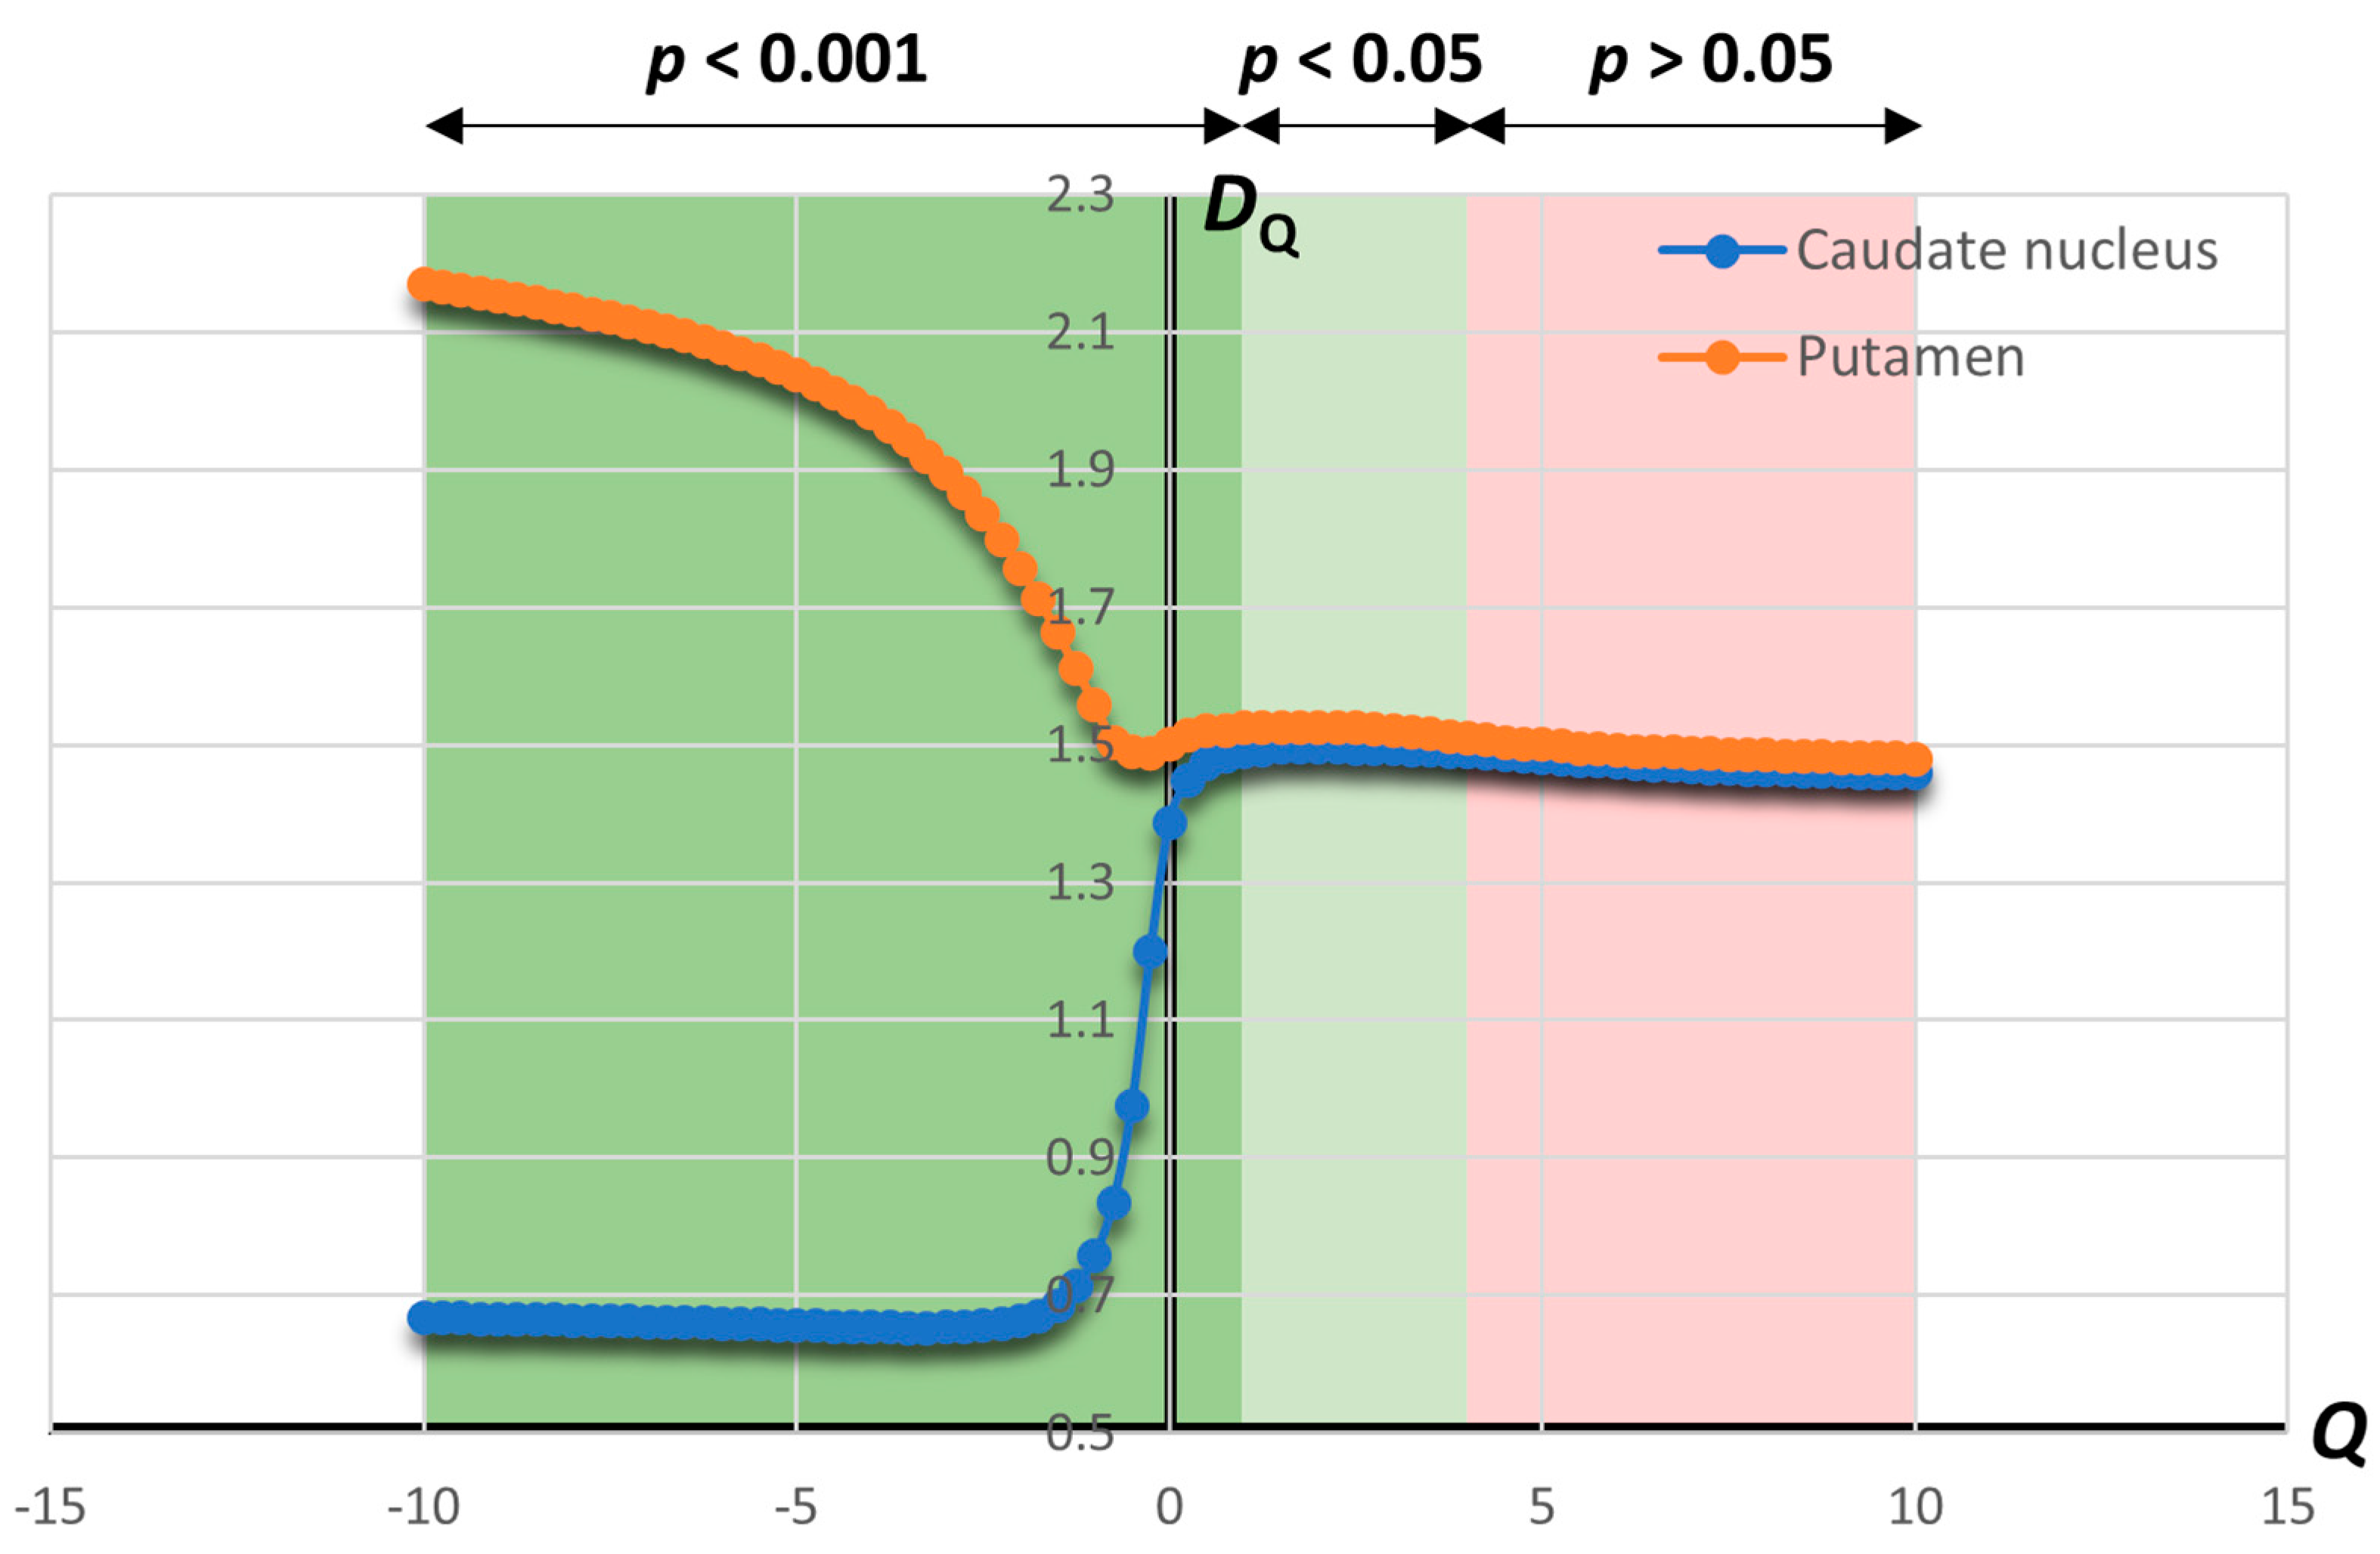
The median values of the generalized dimension spectra for both groups are presented in Figure 5. Statistically significant differences were observed in a substantial portion of the spectra, specifically 57 out of 81 points, with p < 0.001 in the Q interval from −10.0 to 1.0, and p < 0.05 from 1.25 to 4.0. For Q values larger than 4.0, no significant differences were observed (p > 0.05).
Putamen neurons exhibited higher median DQ values across the entire spectrum. The differences between the groups tended to decrease with increasing Q on the statistically significant portion of the spectrum, except for a negligible increase at Q = 2. The largest difference between the groups was observed at Q = −10.0, while the smallest difference was at Q = −5.75.
In the caudate nucleus group, median DQ values showed a slight decreasing trend at the far left and right parts of the spectrum (for the Q intervals of −10.0 to −3.5 and 2.25 to 10.0) and a noticeable increasing trend in the narrow middle part of the spectrum (for the Q interval of −1.0 to 0). The greatest increase in DQ value was observed at Q = −0.5. Conversely, putamen neurons exhibited a drop in DQ values across most of the spectrum, except for the narrow middle part with the Q interval of −0.25 to 1.0. The greatest drop in DQ value was observed for Q = −1.0.

3.2.2. Spectrum of Hölder Exponents α(Q)

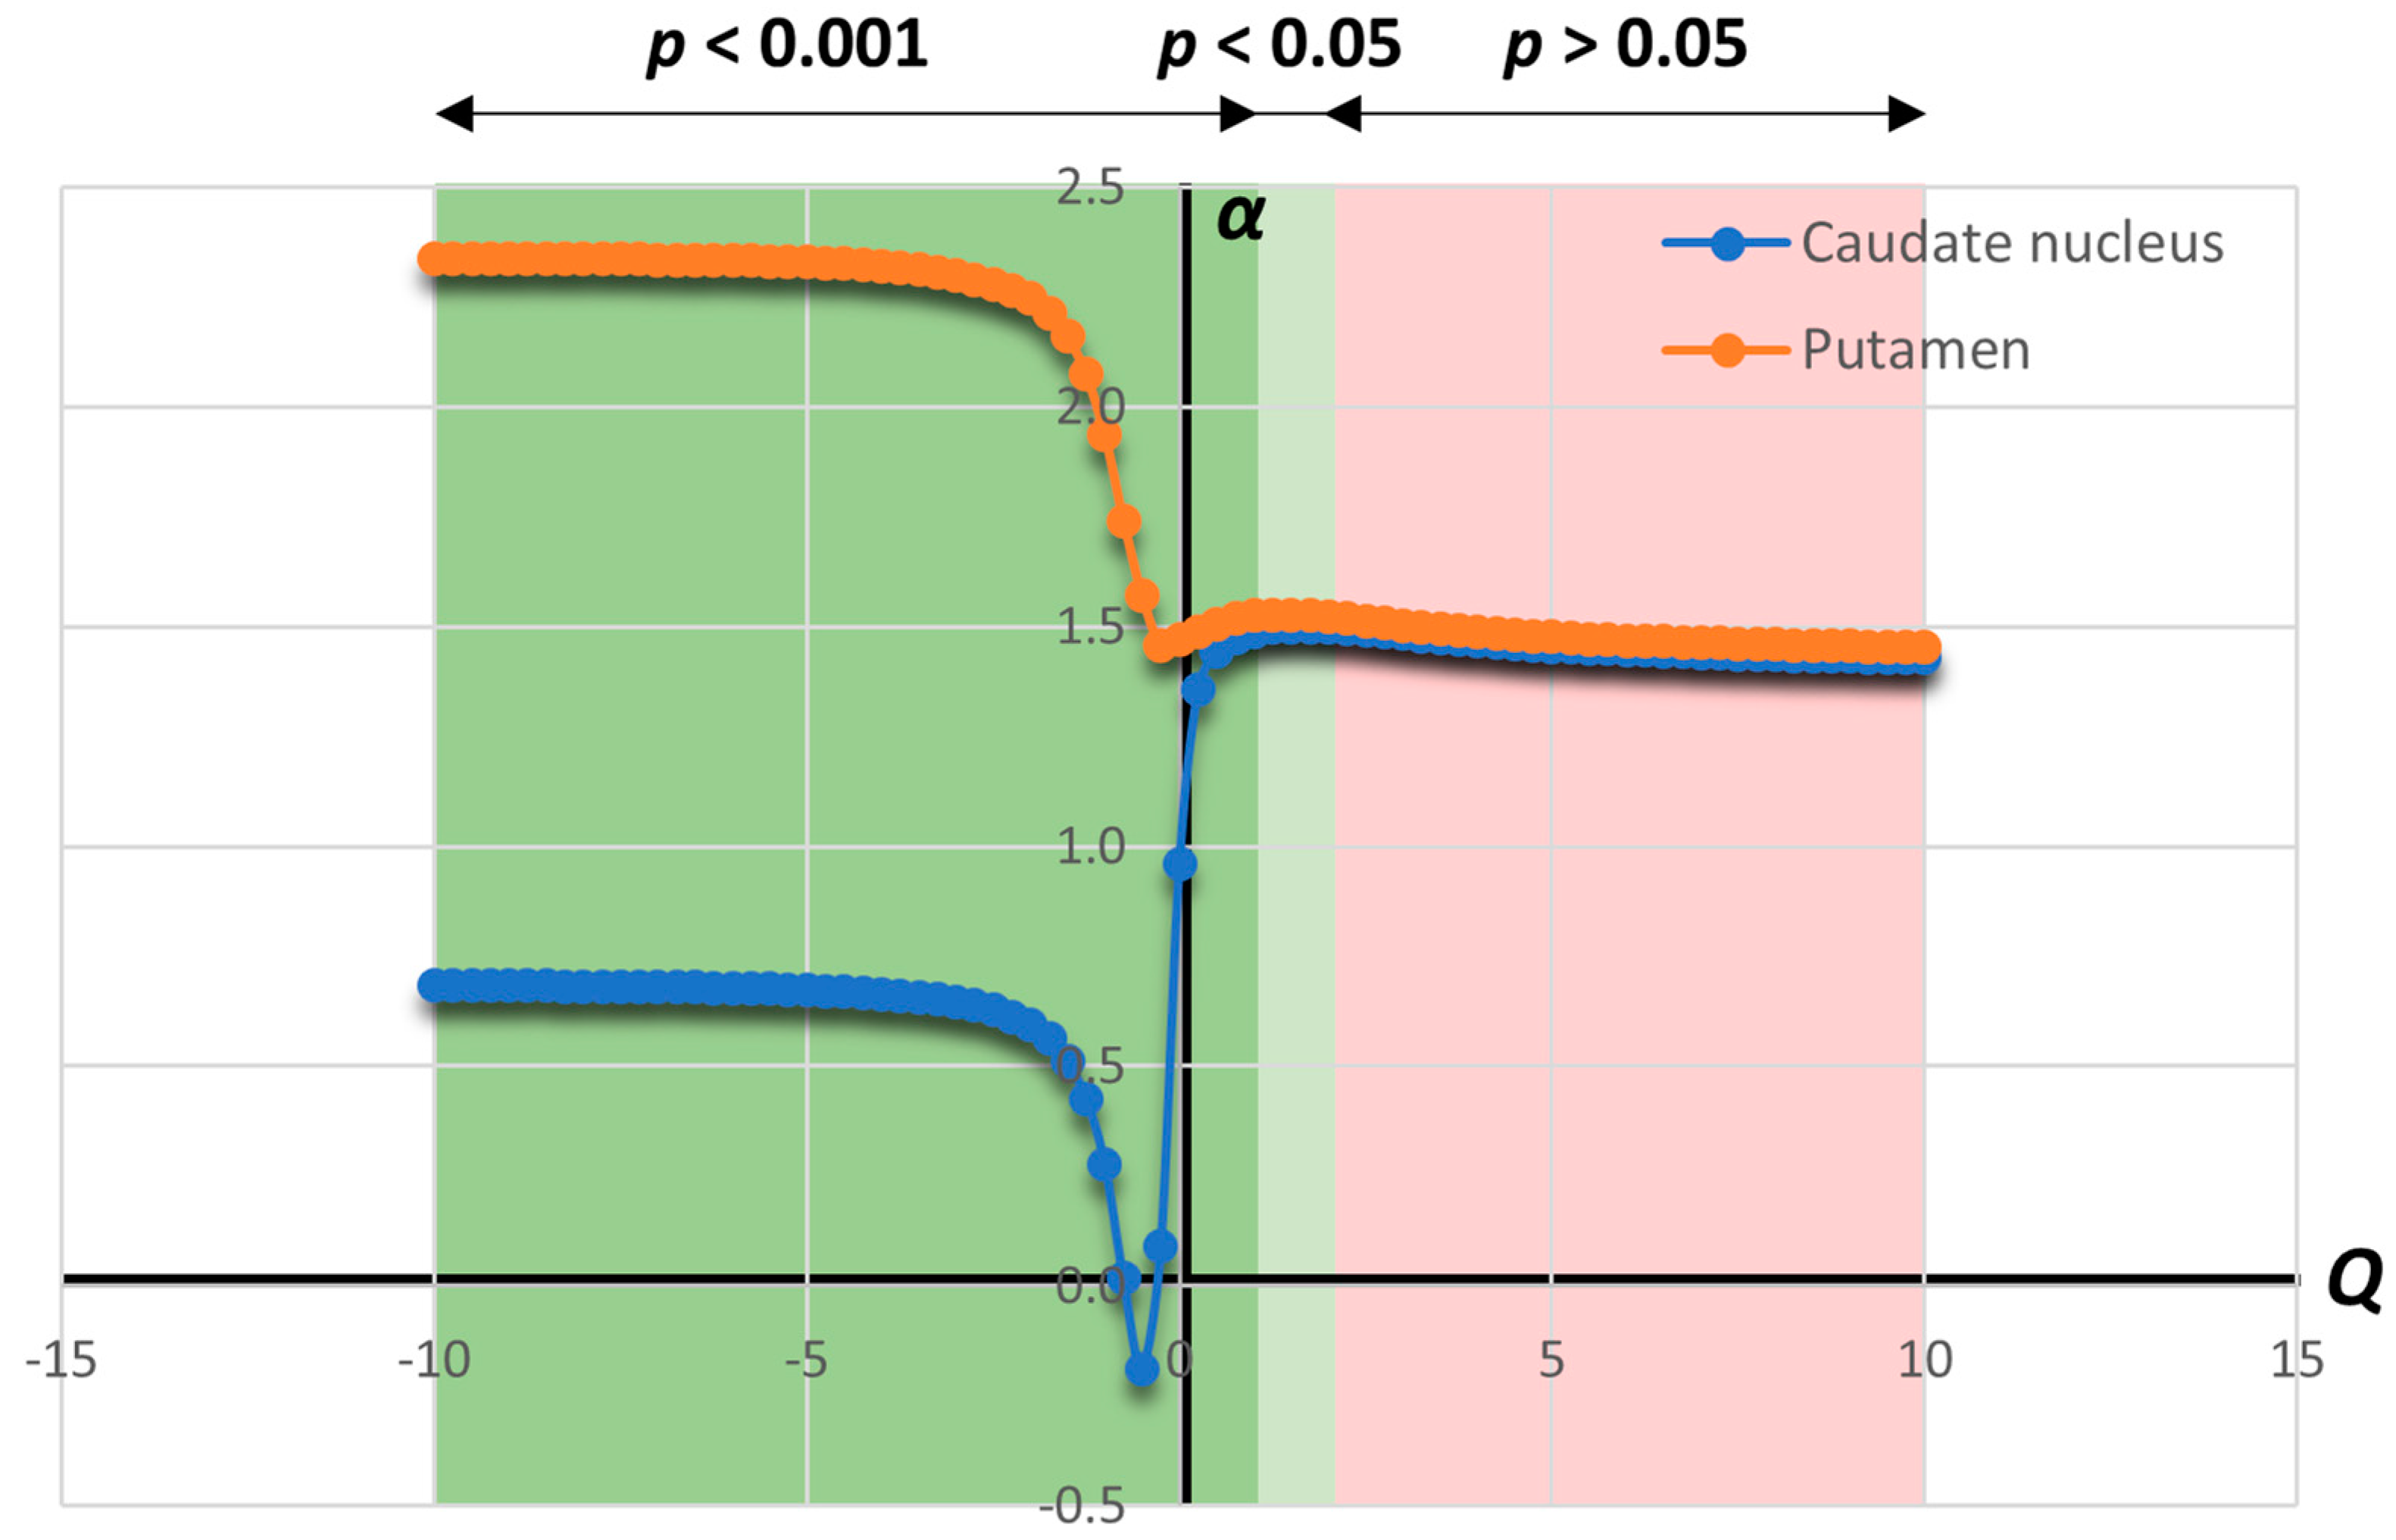
The multifractal spectra of median value Hölder exponents α(Q) of both groups are presented in Figure 6. Significant differences were observed across the entire Q-negative part of the spectrum and the left portion of the Q-positive part, with p < 0.001 in the Q interval of −10.0 to 1.0, and p < 0.05 from 1.25 to 2.0. For Q values larger than 2.0, no significant differences were observed (p > 0.05).
Similar to generalized dimension spectra, putamen neurons exhibited higher Hölder exponent values compared to caudate neurons for all Q values. Differences between the groups remained consistent on most of the spectra, except for the narrow middle part (Q values from −0.75 to 0.25) where a sudden increase followed by a rapid decrease in difference is observed. The largest difference occurred at Q = −0.5, while the smallest difference was at Q = 2.75.
Both groups showed a “plateau” on the far-left side of spectra with little to no change in value between the individual points (Q values from −10.0 to −4.75). On the far-right side, both groups showed a very slight decreasing trend (Q values from 2.75 to 10.0), which mostly coincided with the part of the spectrum with no statistically significant differences. The greatest one-step change in α value for the caudate nucleus group was the rise observed at Q = −0.25. For the putamen group, the biggest change was the rise at Q = −1.0.

3.2.3. Singularity Spectrum f(α)

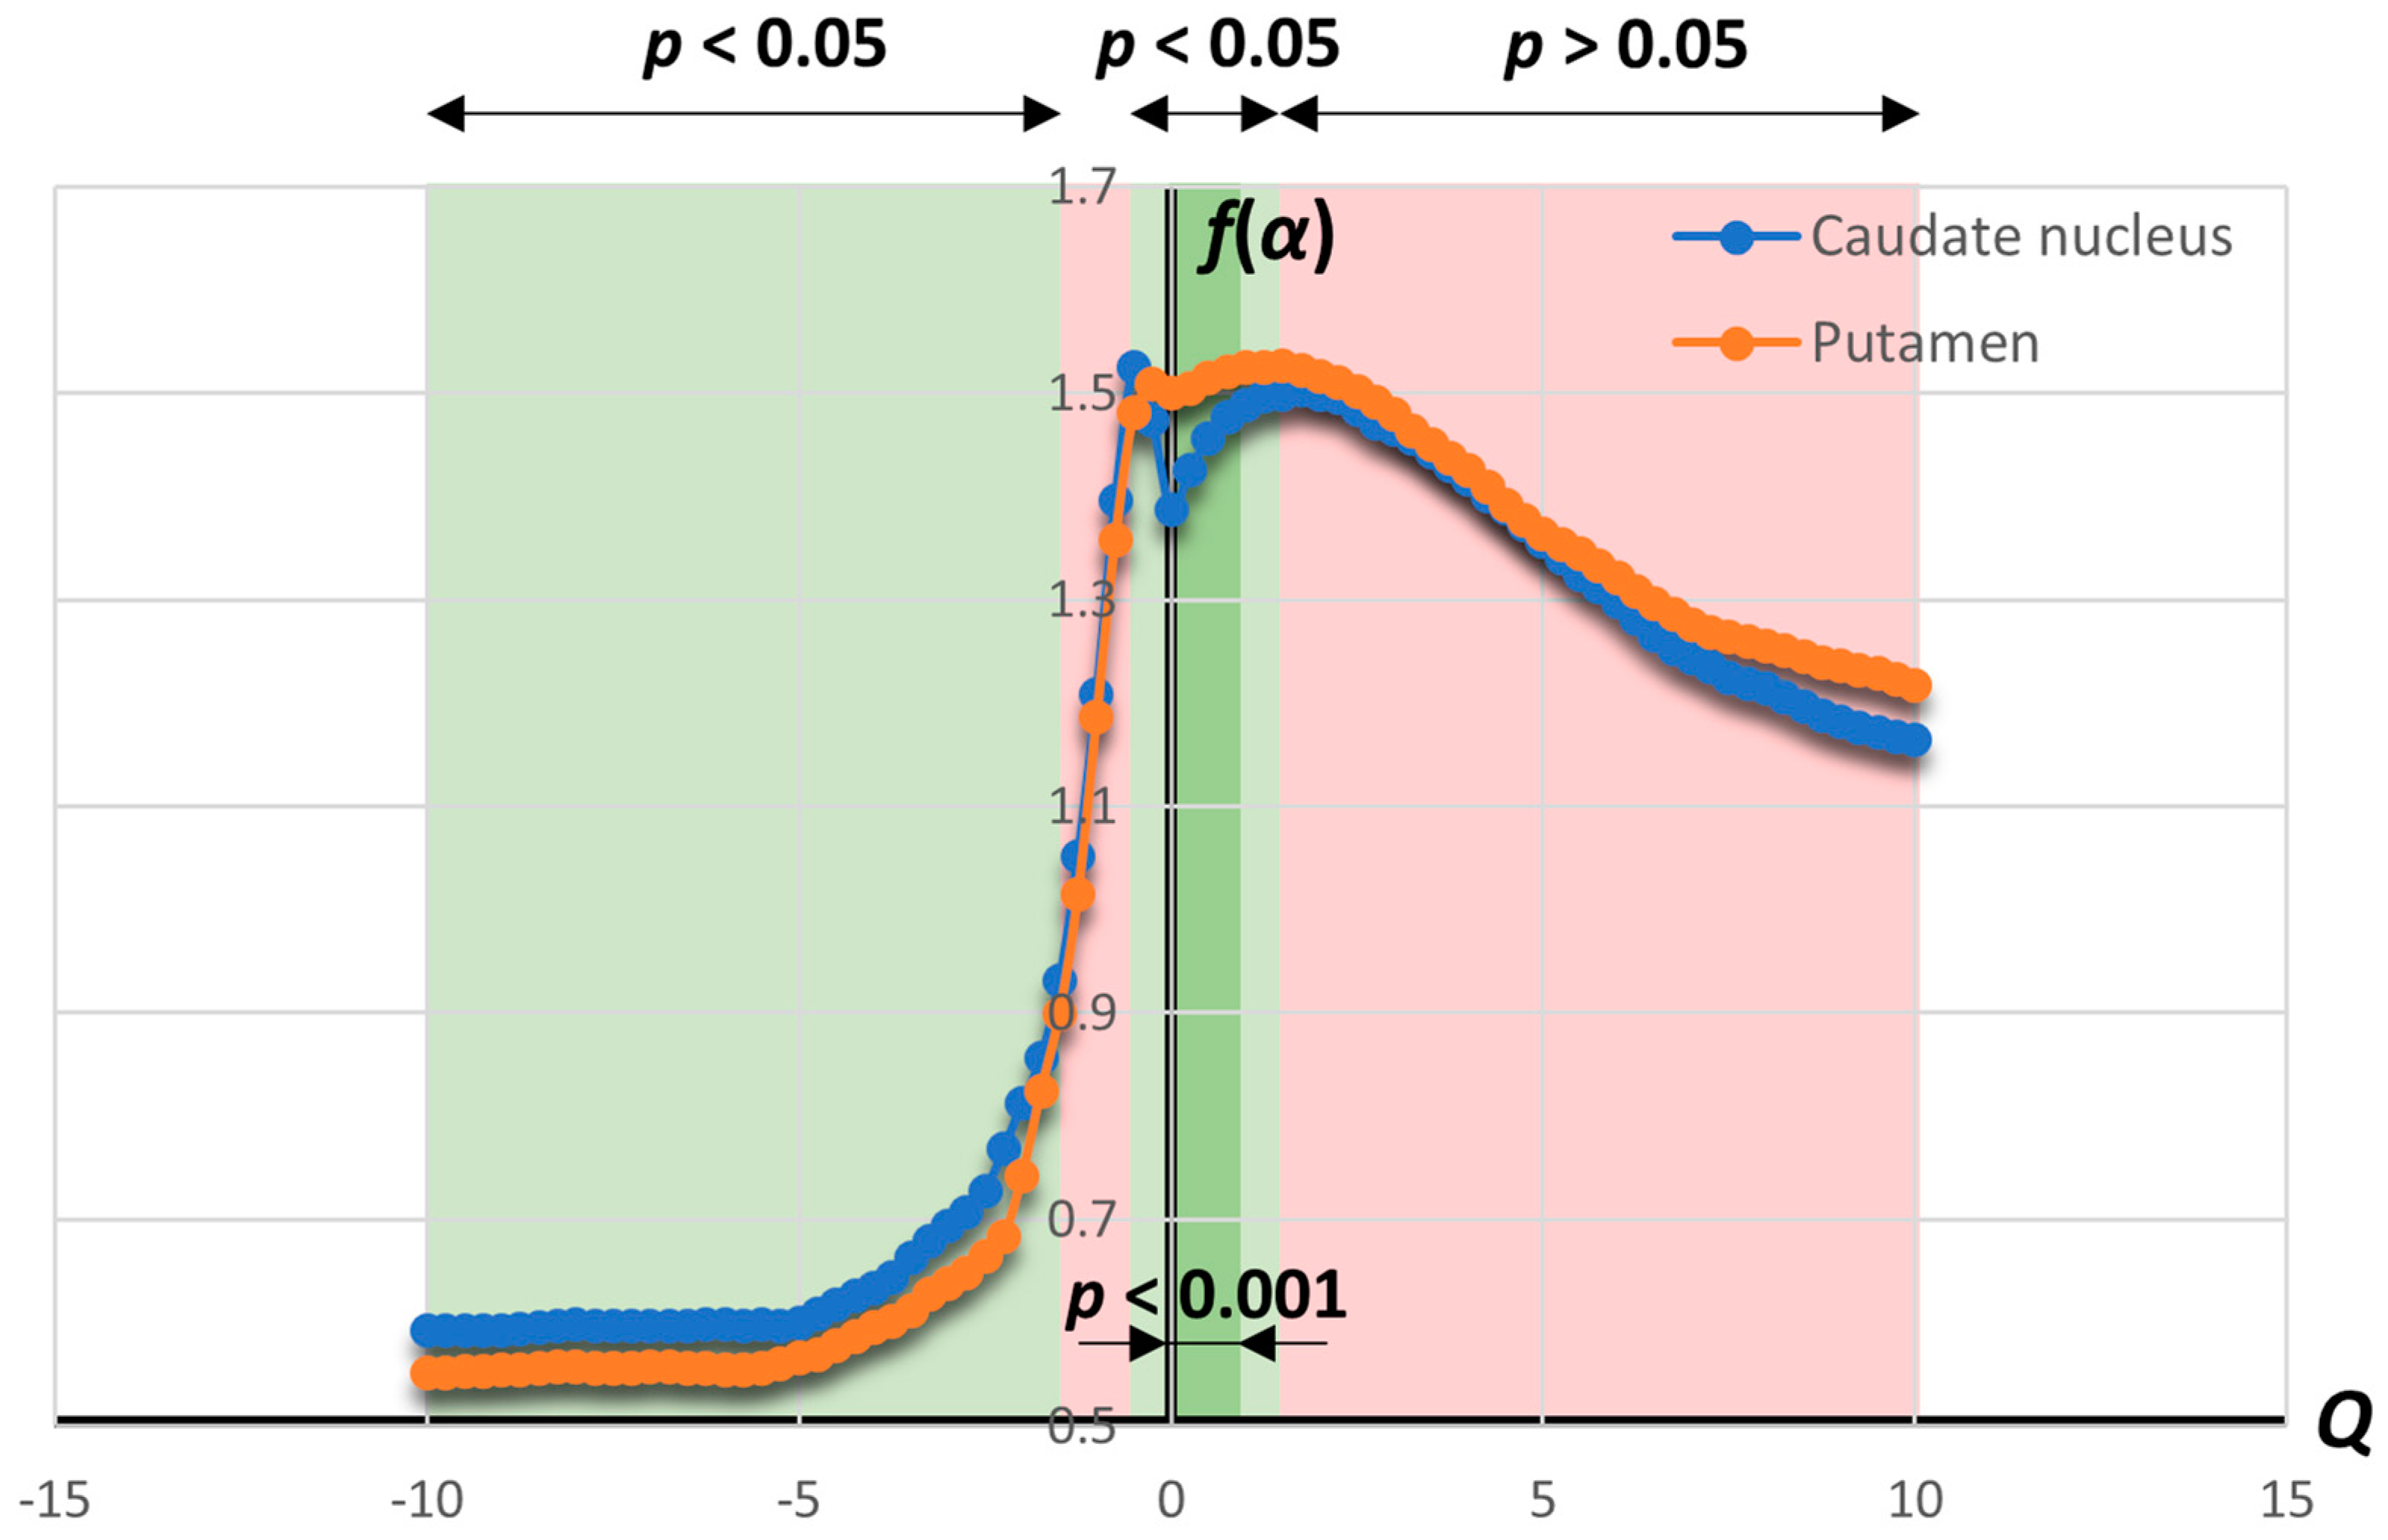
The median value singularity spectra f(α) vs. Q for both groups are presented in Figure 7. Statistically significant differences (p < 0.05) were observed in most of the Q-negative part of the spectrum and a segment in the center (Q intervals of −10.0 to −1.5 and −0.5 to 1.5). The central segment contained a narrow 5-point band of p < 0.001 (Q values from 0 to 1). No significant differences were observed in the Q intervals from −1.25 to −0.75 and 1.75 to 10.0 (p > 0.05).
Values of parameter f(α) were higher for caudate nucleus neurons on almost the entire Q-negative part of the spectrum (for Q interval of −10.0 to −0.5). The switching point was Q = −0.25, after which the putamen group exhibited higher values of f(α) (Q interval of −0.25 to 10.0). Therefore, the statistically significant segment on the left was dominated by higher values in the caudate nucleus, while the central segment mostly showed higher values in the putamen. The largest difference between the groups was observed at Q = 0, and the smallest at Q = 4.5.
The value change in both spectra showed similar trends, with a notable exception of caudate nucleus spectrum in the Q segment from −0.5 to 0, where a sudden drop was observed. This area also exhibited the greatest one-step change in value for the caudate nucleus spectrum, with a decrease at Q = −0.25. The greatest one-step change for the putamen group occurred as an increase in value at Q = −1.0.
Figure 8 shows one of the most common types of multifractal spectra: the singularity spectra f(α) vs. α, which combines the two spectra presented in Figure 6 and Figure 7.
Caudate nucleus neurons exhibit a slightly broader and more complex singularity spectrum with multiple peaks and both positive and negative Hölder exponent values, suggesting an underlying complexity in the two-dimensional neuronal projections. In contrast, the putamen shows a much narrower spectrum with positive Hölder exponents, indicating a certain simplicity and orderliness in terms of the exhibited scaling rules of the neuronal structure compared to the caudate group.

3.2.4. Extracted Parameters

Extreme value parameters and area under the spectrum parameters were extracted for each neuron image. Group median values and ranges, along with the Mann–Whitney U test results, are shown in Table 2. The majority of the parameters exhibit statistically significant differences between the groups, which aligns with the results of the spectra previously shown in Figure 5, Figure 6, Figure 7 and Figure 8. When comparing the extreme value parameters and similar parameters extracted from the median spectra (Figure 5, Figure 6 and Figure 7), we observe some expected deviations due to the nature of obtaining these variables.
The extreme parameters of generalized dimension spectra exhibit significant differences in maximum, minimum and span values between the groups. These values slightly deviate from the corresponding parameters in the median spectra DQ(Q) shown in Figure 5. The significant difference in the DQspan parameter is unsurprising given the significant differences in both DQmin and DQmax parameters. The AUS DQ(Q) parameter also showed significant differences between the groups, which is evident from the median spectra in Figure 5.
All extreme value parameters of the Hölder exponent α show significant differences between the groups. These parameters also deviate slightly from the median spectra extremums (Figure 6). The αspan parameter exhibited significant differences, with more pronounced value difference between the groups than in the case of the DQ parameter. The areas under the median spectra shown in Figure 6 are clearly different between the groups, which is reflected in the significantly different values of AUS α(Q) parameter.
The f(α) parameter exhibited significant differences only in the case of f(α)min. Parameters f(α)max, f(α)span and AUS f(α) did not exhibit any significant differences between the groups.

4. Discussion

For many years, multifractal analysis has been applied across various fields of research due to its capability to characterize highly complex and nonlinear objects and systems [19]. Neurons, and consequently their two-dimensional projections, exhibit a certain level of complexity over specific ranges of scaling [29]. In the existing literature, neuron morphology and their two-dimensional projections are predominantly subjected to monofractal analysis, as these objects are often considered monofractals [11]. However, there is a growing interest in exploring the multifractal properties of neurons, as evidence suggests that neurons possess multiple scaling laws in their morphology and other aspects like interconnectedness [12].
The use of multifractal spectra allows for the examination of various aspects of morphology that are typically overlooked due to the constraints of monofractal analysis. Spectra are created through mathematical “distortion” using moments of the order Q, as described in Equations (2) and (4), which function like a “lens” highlighting different properties of the object from finer to coarser details [19]. This process generates the generalized dimensions spectrum, DQ, characterized by a sigmoidal shape that indicates the complex structure of the scaling laws, and the singularity spectrum f(α) vs. α, which usually exhibits a parabolic shape and suggests greater “multifractality” with its larger width [19].
Neuronal projections from the sample in this study demonstrate multifractal properties in certain parts of the spectra, as evidenced by the sigmoidal shape of the generalized dimensions spectra and the relatively wide range of Hölder exponent α values, indicating multiple scaling laws. Additionally, the “plateaus” observed in both the generalized dimensions spectra and Hölder exponent spectra may suggest “monofractal tendencies” within these structures. These findings provide some support for studies that argue for the monofractal nature of neurons [11].

4.1. Differentiation by Age

The initial question posed in designing this study was whether age is related to the morphology of neurons and their ability to fill the surrounding space. To investigate this, we checked for correlations between all parameters and age, and subsequently divided the sample into three age groups. Surprisingly, none of the numerous variables showed any significant correlation with age, not even by chance. This finding was further corroborated by the age group separation, which also yielded no significant differences.
This result leads to several possible conclusions. First, the chosen neuron projections in the sample might be too morphologically uniform to detect significant differences. This contrasts somewhat with the second part of the study, where clear morphological differences based on the spatial origin of neurons were observed. However, this does not negate the possibility that neuron projections are quite uniform within individual spatial groups.
Another possible explanation is that multifractal spectra are not suitable for this type of analysis. Studies using monofractal analysis have shown significant differences in the box-count dimension [1,30]. The central point of the generalized dimensions spectrum DQ(Q) at Q = 0 represents the Minkowski–Bouligand (i.e., box-count) dimension (see Equation (2)) [19], so we could have expected statistically significant differences at least in this part of the spectrum, but they were absent.
The third conclusion is that the morphology of individual neurons in this subcortical structure does not change significantly with aging. To confirm this conclusion, further studies on larger samples are necessary. Additionally, the median values on the Q-negative parts of the DQ(Q) and α(Q) spectra showed some differences between the groups, with a decrease in the values of the generalized dimensions and Hölder exponents observed with age (Figure 4a,b). These differences in the α(Q) parameter are also evident in the singularity spectra (Figure 4d). Given that finer structures dominate this part of the spectrum, these differences could suggest a reduction in the space-filling complexity and an increase in local heterogeneity of finer structures with age. However, the distributions of the variables were not statistically significantly different among groups, which does not support these notions. A larger sample could reveal more noticeable differences or confirm the findings of this study, indicating no significant morphological differences with age.
Another important consideration is that neurons originate from different brains due to the current limitations of imaging techniques, affecting the nature of this type of study. Thus, it is currently not possible to observe age-related morphological changes in the same brain or ideally the same set of neurons, which could have a non-negligible impact on samples of this size.

4.2. Differentiation by Neuron Spatial Origin

4.2.1. Spectrum of Generalized Dimensions DQ(Q)

Neurons were also categorized by their place of origin within the dorsal striatum. Groups from the caudate nucleus and putamen exhibited statistically significant morphological differences in most applied variables. Notably, the spectrum of generalized dimensions DQ(Q) revealed significant differences in about 70% of the variables (57 out of 81 points in the spectrum) between these groups (Figure 5).
The generation of these spectra involves a mathematical distortion using moments of order Q, creating a series of objects derived from the initial object. Each new object is a distortion of the initial one, emphasizing different aspects of the original object. Moving along the spectrum towards increasingly negative values of Q emphasizes the finer structures of the object, represented by fewer pixels (Equations (1) and (2)), as coarse features (with more pixels) are suppressed. Conversely, the positive part of the spectrum highlights the dominance of coarser features of the object [19].
Examining the median spectra of DQ(Q) in Figure 5, it becomes evident that the fine structures in the neuron projections are the primary source of morphological differences between the caudate and putamen groups, as significant differences were observed across the entire Q-negative parts of the spectra. The higher values of the generalized dimensions in the putamen group indicate a greater space-filling complexity of these fine structures compared to the caudate nucleus group. These drastic differences in the negative part of the spectrum can be attributed to the shape of the individual spectra in a significant number of images from the caudate nucleus group. This resulted in an “inversion” of the median spectrum of the caudate nucleus group relative to the putamen group, which maintained the standard sigmoidal shape typical of this type of multifractal spectra.
The central parts of these spectra also show statistically significant differences. Here, the mathematical distortion is minimal, indicating that differences exist in the “intact” morphology of the two groups. This trend continues into the narrow Q-positive part of the spectrum, with slightly prominent coarser features. Across all these sections of the spectrum, the putamen group, with its higher DQ values, demonstrates greater morphological complexity.

4.2.2. Spectrum of Hölder Exponents α(Q)

The spectra of the Hölder exponents α(Q) shown in Figure 6 align with the results of the generalized dimension spectra DQ(Q). The Q-negative parts of the spectrum, along with the narrower central part, exhibit statistically significant differences between the groups, confirming the greater influence of finer structures in differentiating neuronal projections. The fact that the Hölder exponent α describes local irregularities on the examined object, and that the spectra of both groups display “plateaus” in α values, suggests the presence of monofractal properties in large portions of the projections. Again, this observation could support the argument for the monofractal nature of neuron morphology [11]. However, parts of the spectra showing drastic changes in values indicate a degree of “multifractality” and complexity in morphology that monofractal analysis cannot adequately quantify.
The putamen group exhibits higher α values across the entire spectrum, particularly in the Q-negative part where differences are significant. This suggests greater local homogeneity of fine structures in the neuron projections of this group. In contrast, the caudate nucleus group shows greater local heterogeneity in fine structures, reflected in the varied DQ(Q) spectra within the group. Additionally, the caudate nucleus displays slightly more scaling laws, implying higher “multifractality” in its neurons. However, caution is advised in such interpretations, as both spectra reveal a large clustering of points around similar values.

4.2.3. Singularity Spectrum f(α)

When forming the singularity spectrum, the multifractal object is divided into monofractal subsets of points grouped by the common Hölder exponent. The parameter f(α) for these subsets is then determined, representing their Hausdorff dimension [20]. Thus, the entire multifractal object is a superposition of these monofractal subsets [18]. The f(α) vs. Q spectra provide insight into how the fractal dimensions of point subsets vary depending on different aspects of the object’s scaling properties [19].
From Figure 7, two regions of importance can be identified. First, in the Q-negative part of the spectrum, significant differences are observed where the caudate group exhibits a higher f(α) value. Second, in the central region of the spectrum, the putamen shows a significantly higher f(α) value. This indicates that with a more pronounced accentuation of fine structures, the monofractal subsets of the caudate group demonstrate greater complexity compared to the putamen. In this Q-region, the caudate group also shows lower values of the α parameter (Figure 6), suggesting that caudate neurons not only have greater complexity but also exhibit greater local heterogeneity in fine structures. Conversely, in the central part of the spectrum, the putamen group displays higher complexity in monofractal point sets, while both groups show similar heterogeneity in scaling regularity.
It is important to note that one of the challenges of this type of analysis is the practical interpretation of the singularity spectrum results. The practical significance of these spectra can often be “elusive” and abstract, making it difficult to intuitively understand individual spectra and relate the results to the actual images.
This part of the results is more clearly illustrated by the singularity spectra in Figure 8, which combine the information from the spectra in Figure 6 and Figure 7. At f(α) values lower than 1.0, the differentiation between the two groups is evident. This corresponds to the statistically significant region in Figure 7, where f(α) values lower than 0.931 for the caudate nucleus and 0.9 for the putamen show significant differences between groups. In this part of the spectrum, we observe a clustering of α values around 0.7 for the caudate nucleus and 2.3 for the putamen. This indicates greater local heterogeneity in the fine structures of the caudate group, while maintaining a similar degree of complexity in their scaling properties.

4.2.4. Extracted Parameters

To reduce the number of variables and attempt to form a “multifractal fingerprint” of the neuronal projection, we calculated extreme value variables and AUS variables for each image. These variables generally proved to be effective in differentiating the spatial origin of neurons, as most showed statistically significant differences between the groups (Table 2). Median values of DQmin and DQmax are lower for the caudate nucleus group, while the range between these values for individual images (DQspan) is greater in this group. This confirms that the complexity of spatial filling in the neuron projections is lower in the caudate nucleus group. On the other hand, this group exhibits a greater variety of complexity, also seen in its larger range of Hölder exponents (αspan). The lower values of the extremums of Hölder exponent α further support the finding that caudate nucleus neuron projections show greater local heterogeneity.
We also notice a slight difference between the extreme value parameters and the corresponding parameters extracted from the median spectra in Figure 5, Figure 6 and Figure 7. This difference stems from the different approach to extracting the given parameters. The parameters in Table 1 and Table 2 are the extremes from the spectra of individual images, while the extremes from the median spectra are “limited” by the Q values by which the median of each parameter was calculated. Therefore, it is more accurate to use individual image parameters because they contain the true extreme values of each image, as opposed to the slightly “suppressed” extreme values of the median spectrum of the entire group.
A similar observation can be made for the DQspan variable, which shows statistically significant differences between the groups. When looking at the median spectra in Figure 5, it may seem that the spans between extremes are very similar for both groups. This is again explained by the fact that the DQspan value is calculated for individual images, as opposed to Q-discretized group median spectra, which has a suppressing effect on individual extremes.
Areas under the spectra of generalized dimensions and Hölder exponents (AUS DQ(Q), AUS α(Q)) showed statistically significant differences between the caudate and putamen groups. Examining the median spectra of the groups in Figure 5 and Figure 6 reveals the source of these differences. The caudate group, due to its low values of the parameters DQ and α on the Q-negative parts of the spectrum, exhibits a much lower area value. A higher value of the AUS DQ(Q) parameter indicates greater complexity of space filling (as observed in the putamen group), while a higher value of the AUS α(Q) parameter indicates increased local homogeneity (again, in the putamen group).
The area under the spectrum of f(α) vs. Q, marked as AUS f(α), did not show statistically significant differences, which could be expected given the approximately similar shapes of the curves shown in Figure 7. It is important to note that reducing the number of variables results in the loss of certain information that can be observed across the entire spectra. This includes details on whether the exhibited complexity and homogeneity are features of finer or coarser structures, or which part of the spectrum these extremes are expressed in. However, the benefit of this reduction is the relatively quick quantification of morphology and a mathematical depiction of the dominant morphological features of the pattern.

4.2.5. Further Discussion

Given that differences in cell morphology are believed to reflect functional differences, it can be inferred that the observed variations in neuronal morphology between the putamen and the caudate nucleus may be related to their respective functional predominance (motor vs. cognitive) within the neostriatum. However, the connection between the observed multifractal profiles of these neurons and their specific biological functions remains speculative. Future research should aim to provide additional insights, such as neurotransmitter activity or a more detailed understanding of the specific functions of these neurons, to enhance our understanding of the relationship between neuronal morphology and function.
Although the obtained results show significant morphological differences across large parts of the spectra used, it is necessary to address certain limitations of this approach. The first limitation is the pixel-based image display. Despite using relatively high-resolution images (1600 × 1212 px) in this study, various fine structures of the analyzed objects’ morphology can still be obscured, which may prove problematic with larger mathematical distortions.
Second, the segmentation of neuronal projections was performed by a human specialist, introducing the possibility of random error. Potential solutions to this drawback include using segmentation software or artificial intelligence, though these approaches also have their own drawbacks and potential system errors, so the pros and cons must be carefully weighed [31,32,33].
Another limitation is the formation of two-dimensional projections of neurons, which are essentially three-dimensional objects. This process can strip away certain morphological information, introducing randomness into the displayed data since it is often impossible to adequately choose the projection angle. A potential solution is the analysis of three-dimensional images of neurons, though this comes with its own challenges, such as imperfect segmentation and accessibility issues [33,34,35].
Lastly, the box-count method of fractal analysis, which has proven to be very practical in computer applications, also has its drawbacks that must be considered to minimize errors [36].

5. Conclusions

Multifractal analysis of two-dimensional neuron projections of the dorsal striatum did not reveal significant morphological changes in neurons with age. However, it proved to be an effective tool for differentiating the spatial origin of these neurons within the aforementioned subcortical structure. Neurons in the putamen group displayed higher morphological complexity in space filling, evidenced by higher values of generalized dimensions (DQ) and greater local homogeneity, as indicated by higher values of Hölder exponents (α). Conversely, neurons in the caudate nucleus group exhibited more scaling laws and higher local heterogeneity. Future studies with larger samples could enhance our understanding of the morphology of this brain region and address the potential shortcomings of this type of analysis.

Author Contributions

Conceptualization, N.R., Z.N. and N.M.; methodology, N.R. and Z.N.; software, N.R.; validation, B.K., O.S., D.H. and Z.N.; formal analysis, Z.N. and N.R.; investigation, Z.N., B.K. and N.R.; resources, B.K.; data curation, N.R. and N.M.; writing—original draft preparation, Z.N. and N.R.; writing—review and editing, B.K., N.M., O.S. and D.H.; visualization, Z.N. and N.R.; supervision, N.R.; project administration, O.S.; funding acquisition, O.S. and D.H. All authors have read and agreed to the published version of the manuscript.

Funding

This research was funded by the Serbian Ministry of Education, Science and Technological Development, grant number 451-03-66/2024-03/200110.

Institutional Review Board Statement

The study was conducted in accordance with the Declaration of Helsinki. The protocol was approved by the Ethical Committee of the University of Novi Sad (Faculty of Medicine in Novi Sad, Serbia) (protocol number 01-39/256-2008).

Informed Consent Statement

Informed consent was obtained from all subjects involved in the study.

Data Availability Statement

The original data presented in the study are openly available in FigShare repository at https://doi.org/10.6084/m9.figshare.26097226.v2. Accessed on 6 August 2024.

Conflicts of Interest

The authors declare no conflicts of interest.

References

  1. Krstonošić, B.; Milošević, N.T.; Gudović, R.; Marić, D.L.; Ristanović, D. Neuronal Images of the Putamen in the Adult Human Neostriatum: A Revised Classification Supported by a Qualitative and Quantitative Analysis. Anat. Sci. Int. 2012, 87, 115–125. [Google Scholar] [CrossRef]
  2. Deserno, L.; Schlagenhauf, F.; Heinz, A. Striatal Dopamine, Reward, and Decision Making in Schizophrenia. Dialogues Clin. Neurosci. 2016, 18, 77–89. [Google Scholar] [CrossRef]
  3. Langen, M.; Durston, S.; Kas, M.J.H.; van Engeland, H.; Staal, W.G. The Neurobiology of Repetitive Behavior: …and Men. Neurosci. Biobehav. Rev. 2011, 35, 356–365. [Google Scholar] [CrossRef]
  4. Roberts, R.C.; Gaither, L.A.; Peretti, F.J.; Lapidus, B.; Chute, D.J. Synaptic Organization of the Human Striatum: A Postmortem Ultrastructural Study. J. Comp. Neurol. 1996, 374, 523–534. [Google Scholar] [CrossRef]
  5. Bernácer, J.; Prensa, L.; Giménez-Amaya, J.M. Distribution of GABAergic Interneurons and Dopaminergic Cells in the Functional Territories of the Human Striatum. PLoS ONE 2012, 7, e30504. [Google Scholar] [CrossRef]
  6. Dejerine, J. Anatomie Des Centres Nerveux, Tome 2; Reuff: Paris, France, 1901. [Google Scholar]
  7. Schmitt, O.; Eggers, R.; Haug, H. Quantitative Investigations into the Histostructural Nature of the Human Putamen. I. Staining, Cell Classification and Morphometry. Ann. Anat.-Anat. Anz. 1995, 177, 243–250. [Google Scholar] [CrossRef]
  8. Tosevski, J.; Malikovic, A.; Mojsilovic-Petrovic, J.; Lackovic, V.; Peulic, M.; Sazdanovic, P.; Alexopulos, C. Types of Neurons and Some Dendritic Patterns of Basolateral Amygdala in Humans—A Golgi Study. Ann. Anat.-Anat. Anz. 2002, 184, 93–103. [Google Scholar] [CrossRef]
  9. Krstonošić, B.; Milošević, N.T.; Marić, D.L.; Babović, S.S. Quantitative Analysis of Spiny Neurons in the Adult Human Caudate Nucleus: Can It Confirm the Current Qualitative Cell Classification? Acta Neurol. Belg. 2015, 115, 273–280. [Google Scholar] [CrossRef]
  10. Karperien, A.L.; Jelinek, H.F. Box-Counting Fractal Analysis: A Primer for the Clinician. In The Fractal Geometry of the Brain; Springer: Berlin/Heidelberg, Germany, 2016; pp. 13–43. [Google Scholar]
  11. Fernández, E.; Bolea, J.A.; Ortega, G.; Louis, E. Are Neurons Multifractals? J. Neurosci. Methods 1999, 89, 151–157. [Google Scholar] [CrossRef]
  12. Smith, J.H.; Rowland, C.; Harland, B.; Moslehi, S.; Montgomery, R.D.; Schobert, K.; Watterson, W.J.; Dalrymple-Alford, J.; Taylor, R.P. How Neurons Exploit Fractal Geometry to Optimize Their Network Connectivity. Sci. Rep. 2021, 11, 2332. [Google Scholar] [CrossRef]
  13. Katsaloulis, P.; Ghosh, A.; Philippe, A.C.; Provata, A.; Deriche, R. Fractality in the Neuron Axonal Topography of the Human Brain Based on 3-D Diffusion MRI. Eur. Phys. J. B 2012, 85, 150. [Google Scholar] [CrossRef]
  14. Jelinek, H.F.; Cornforth, D.J.; Roberts, A.J.; Landini, G.; Bourke, P.; Iorio, A. Image Processing of Finite Size Rat Retinal Ganglion Cells Using Multifractal and Local Connected Fractal Analysis BT—AI 2004: Advances in Artificial Intelligence; Webb, G.I., Yu, X., Eds.; Springer: Berlin/Heidelberg, Germany, 2005; pp. 961–966. [Google Scholar]
  15. Krstonošić, B.; Milošević, N.T.; Gudović, R. Quantitative Analysis of the Golgi Impregnated Human (Neo)Striatal Neurons: Observation of the Morphological Characteristics Followed by an Emphasis on the Functional Diversity of Cells. Ann. Anat.-Anat. Anz. 2023, 246, 152040. [Google Scholar] [CrossRef]
  16. Lalošević, D.; Somer, L.; Djolaji, M.; Lalošević, V.; Mažibrada, J.; Krnojelac, D. Mikroskopska Laboratorijska Tehnika u Medicini; Medicinski fakultet Novi Sad-WUS Austrija: Novi Sad, Serbia, 2005. [Google Scholar]
  17. Smith, T.G.; Lange, G.D.; Marks, W.B. Fractal Methods and Results in Cellular Morphology—Dimensions, Lacunarity and Multifractals. J. Neurosci. Methods 1996, 69, 123–136. [Google Scholar] [CrossRef]
  18. Lopes, R.; Betrouni, N. Fractal and Multifractal Analysis: A Review. Med. Image Anal. 2009, 13, 634–649. [Google Scholar] [CrossRef]
  19. Karperien, A.; Jelinek, H.; Ahammer, H. Multifractal Formalism in Image and Time Series Analysis. Banach Cent. Publ. 2016, 109, 23–45. [Google Scholar] [CrossRef]
  20. Salat, H.; Murcio, R.; Arcaute, E. Multifractal Methodology. Phys. A Stat. Mech. Its Appl. 2017, 473, 467–487. [Google Scholar] [CrossRef]
  21. Evertsz, C.J.G.; Mandelbrot, B.B. Multifractal Measures. In Chaos and Fractals; Peitgen, H.-O., Jurgens, H., Saupe, D., Eds.; Springer: New York, NY, USA, 1992; pp. 921–953. [Google Scholar]
  22. Riedi, R.H. Multifractal Processes. Theory Appl. Long-Range Depend. 2003, 2003, 625–716. [Google Scholar]
  23. Falconer, K. Fractal Geometry: Mathematical Foundations and Applications; John Wiley & Sons: Hoboken, NJ, USA, 2003; Volume 46, ISBN 0470848626. [Google Scholar]
  24. Karperien, A.L. FracLac for ImageJ 2013. Available online: https://imagej.net/ij/plugins/fraclac/FLHelp/Introduction.htm (accessed on 20 June 2024.).
  25. Chhabra, A.; Jensen, R.V. Direct determination of the f(α) singularity spectrum. Phys. Rev. Lett. 1989, 62, 1327–1330. [Google Scholar] [CrossRef]
  26. Chhabra, A.B.; Meneveau, C.; Jensen, R.V.; Sreenivasan, K.R. Direct Determination of the f(α) Singularity Spectrum and Its Application to Fully Developed Turbulence. Phys. Rev. A 1989, 40, 5284–5294. [Google Scholar] [CrossRef]
  27. Feder, J. Fractals, 1st ed.; Springer: New York, NY, USA, 1998; ISBN 978-0-306-42851-7. [Google Scholar]
  28. Bouda, M.; Caplan, J.S.; Saiers, J.E. Box-Counting Dimension Revisited: Presenting an Efficient Method of Minimizing Quantization Error and an Assessment of the Self-Similarity of Structural Root Systems. Front. Plant Sci. 2016, 7, 149. [Google Scholar] [CrossRef]
  29. Milošević, N.T.; Ristanović, D. Fractality of Dendritic Arborization of Spinal Cord Neurons. Neurosci. Lett. 2006, 396, 172–176. [Google Scholar] [CrossRef]
  30. Milošević, N. Monofractal Dimension in Quantifying the Image of Neurons in the Plane: Analysis of Image Features of Multipolar Neurons from the Principal Olivary Nucleus in Humans with Age. Fractal Fract. 2022, 6, 408. [Google Scholar] [CrossRef]
  31. Peng, H.; Long, F.; Myers, G. Automatic 3D Neuron Tracing Using All-Path Pruning. Bioinformatics 2011, 27, i239–i247. [Google Scholar] [CrossRef] [PubMed]
  32. Li, Q.; Shen, L. 3D Neuron Reconstruction in Tangled Neuronal Image with Deep Networks. IEEE Trans. Med. Imaging 2020, 39, 425–435. [Google Scholar] [CrossRef] [PubMed]
  33. Yang, B.; Liu, M.; Wang, Y.; Zhang, K.; Meijering, E. Structure-Guided Segmentation for 3D Neuron Reconstruction. IEEE Trans. Med. Imaging 2022, 41, 903–914. [Google Scholar] [CrossRef] [PubMed]
  34. Li, A.; Gong, H.; Zhang, B.; Wang, Q.; Yan, C.; Wu, J.; Liu, Q.; Zeng, S.; Luo, Q. Micro-Optical Sectioning Tomography to Obtain a High-Resolution Atlas of the Mouse Brain. Science 2010, 330, 1404–1408. [Google Scholar] [CrossRef]
  35. Shapson-Coe, A.; Januszewski, M.; Berger, D.R.; Pope, A.; Wu, Y.; Blakely, T.; Schalek, R.L.; Li, P.H.; Wang, S.; Maitin-Shepard, J.; et al. A Petavoxel Fragment of Human Cerebral Cortex Reconstructed at Nanoscale Resolution. Science 2024, 384, eadk4858. [Google Scholar] [CrossRef]
  36. Rajković, N.; Krstonošić, B.; Milošević, N.T. Box-Counting Method of 2D Neuronal Image: Method Modification and Quantitative Analysis Demonstrated on Images from the Monkey and Human Brain. Comput. Math. Methods Med. 2017, 2017, 8967902. [Google Scholar] [CrossRef]
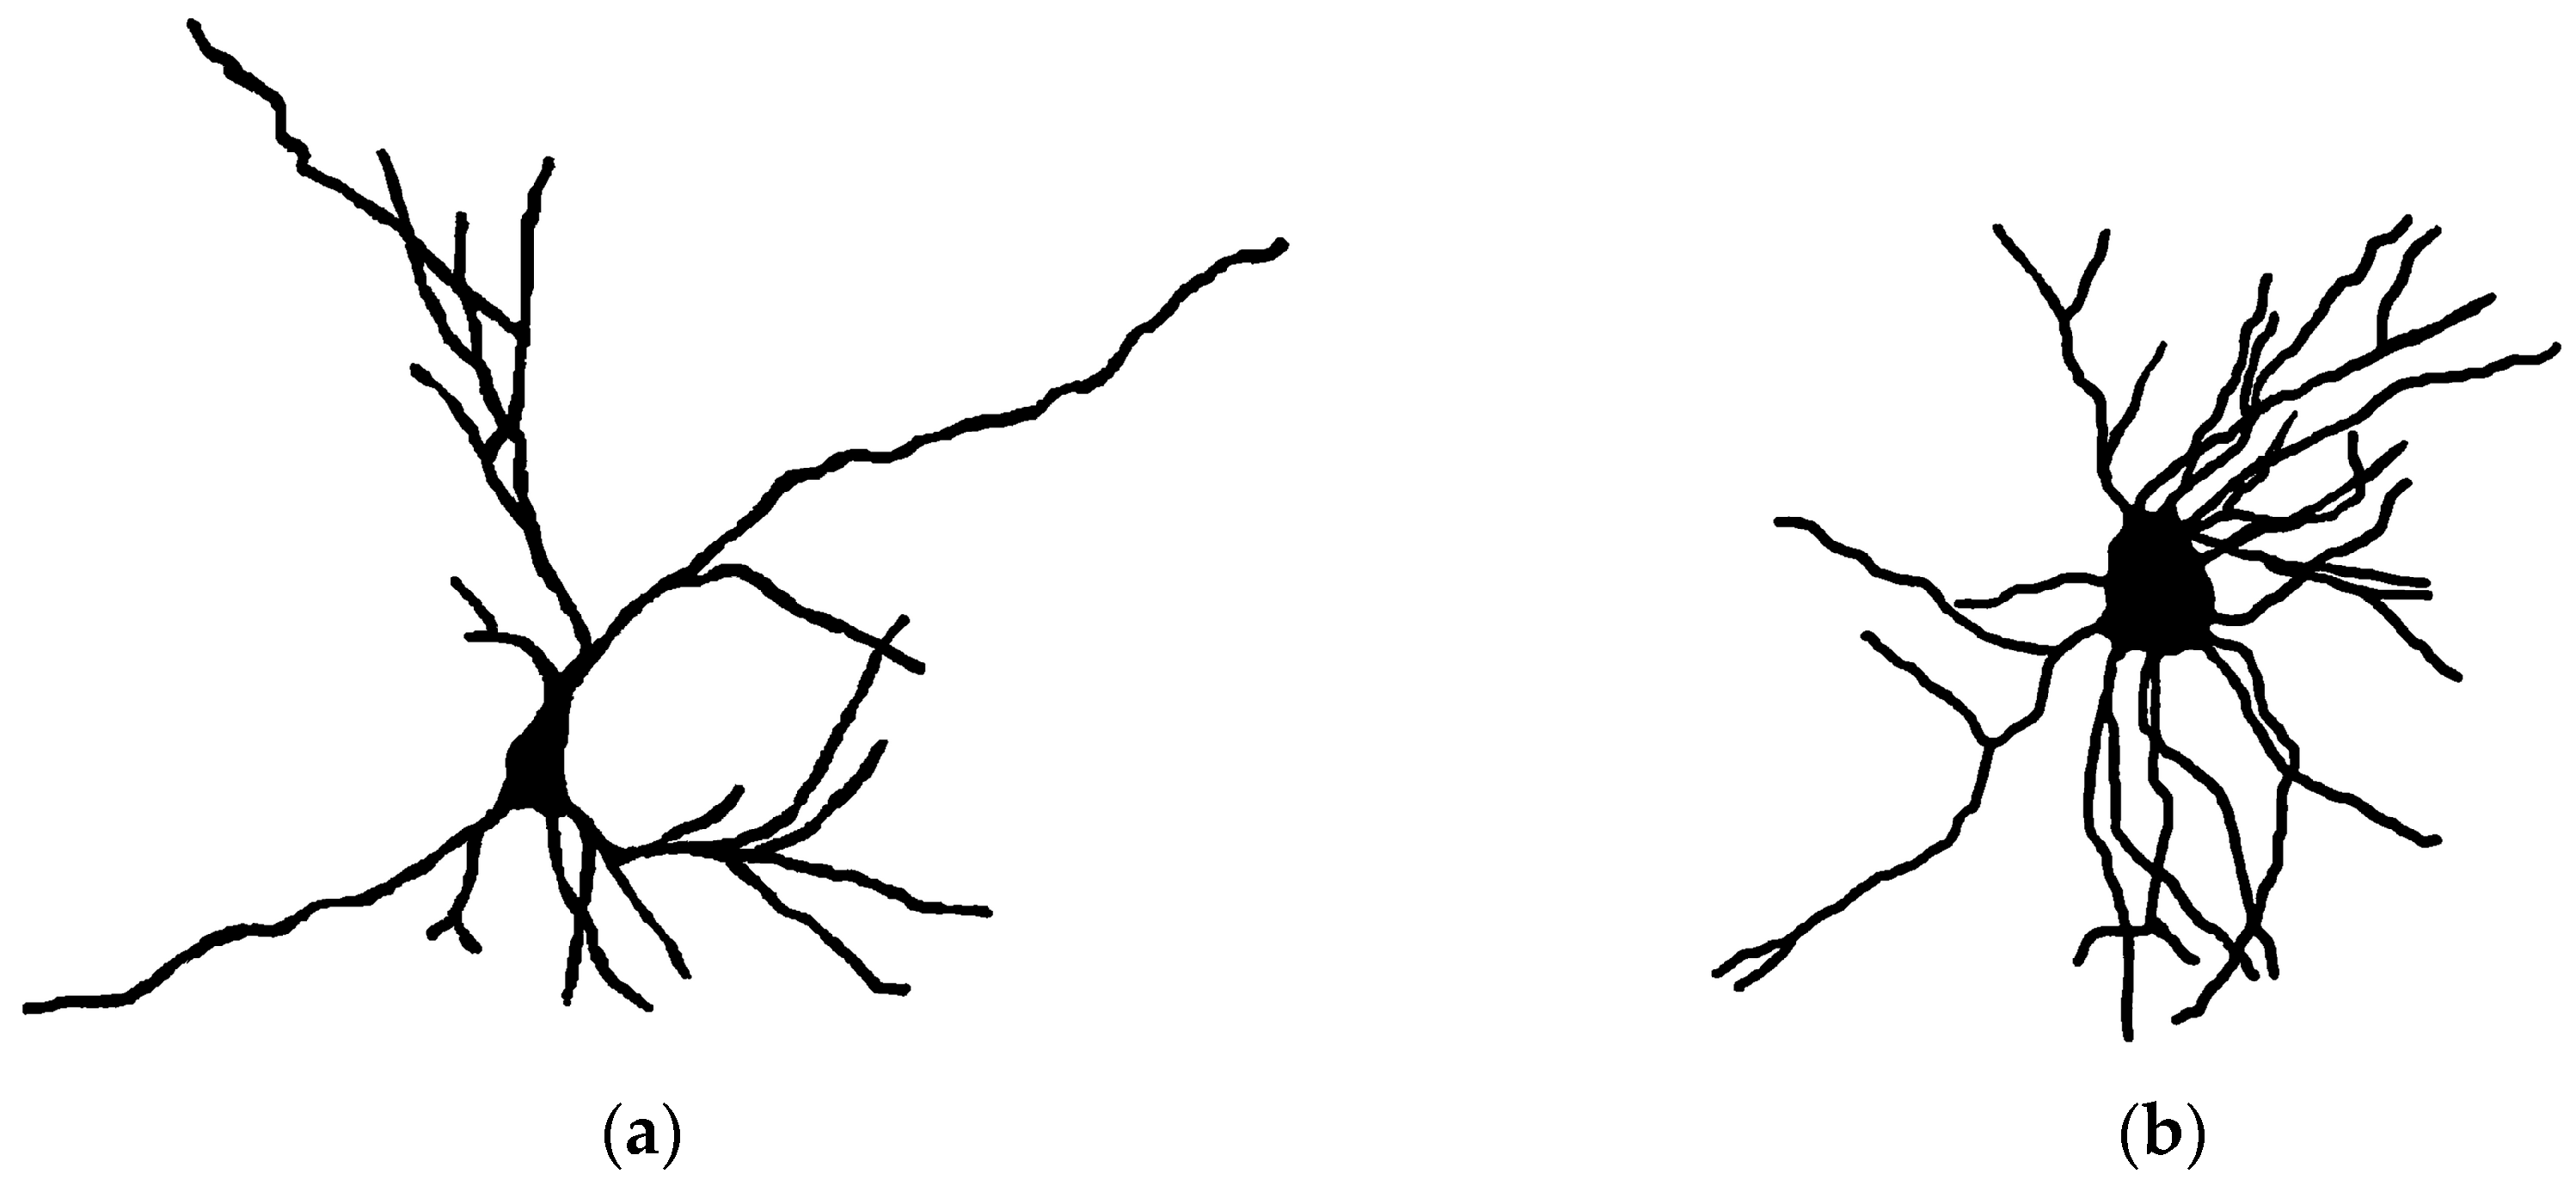
Figure 1. Examples of striatum binary images used in the study: (a) caudate nucleus neuron projection; (b) putamen neuron projection.
Fractalfract 08 00514 g001
Figure 2. Example images from the three age groups. (a) caudate nucleus neuron projection belonging to the first group; (b) caudate nucleus neuron projection belonging to the second group; (c) putamen neuron projection belonging to the third group.
Fractalfract 08 00514 g002
Figure 3. Example of area under the spectra (AUS) parameters for one image (caudate nucleus neuron projection). (a) area under the generalized dimension spectra AUS DQ(Q); (b) area under the Hölder exponent spectra AUS α(Q); (c) area under the singularity spectra AUS f(α) vs. Q.
Fractalfract 08 00514 g003
Figure 4. Median value multifractal spectra of the three age groups: (a) Generalized dimension spectra DQ(Q); (b) Hölder exponent spectra α(Q); (c) Singularity spectra f(α) vs. Q; (d) Singularity spectra f(α) vs. α. No statistically significant age-related differences were observed on any part of any spectrum.
Fractalfract 08 00514 g004aFractalfract 08 00514 g004b
Figure 5. Median value generalized dimension spectra DQ(Q) for the two groups. Significant differences were observed for Q value intervals from −10.0 to 1.0 (p < 0.001) and 1.25 to 4.0 (p < 0.05), indicated with green shades. Non-significant differences (p > 0.05) are indicated with red shade.
Fractalfract 08 00514 g005
Figure 6. Median value Hölder exponent spectra α(Q) for the two groups. Significant differences were observed for Q value intervals from −10.0 to 1.0 (p < 0.001) and 1.25 to 2.0 (p < 0.05), indicated with green shades. Non-significant differences (p > 0.05) are indicated with red shade.
Fractalfract 08 00514 g006
Figure 7. Median value singularity spectra f(α) vs. Q for the two groups. Significant differences (p < 0.05), indicated with green shades, were observed for Q intervals from −10.0 to −1.5 and −0.5 to 1.5, with the narrow band of p < 0.001 in Q interval of 0 to 1. Non-significant differences (p > 0.05) were observed for Q intervals from −1.25 to −0.75 and 1.75 to 10.0, indicated with the red shade.
Fractalfract 08 00514 g007
Figure 8. Median value singularity spectra f(α) vs. α for both groups.
Fractalfract 08 00514 g008
Table 1. Extreme value parameters and area under the spectrum parameters (AUS) for three age groups.
ParameterMedian Value (Range)Kruskal–Wallis
H
dfp
1. Age Group2. Age Group3. Age Group
DQmin1.403 (1.525)1.401 (1.492)1.381 (1.525)0.68920.709
DQmax1.981 (1.274)1.896 (0.999)1.863 (1.073)0.11820.943
DQspan0.804 (1.168)0.779 (1.079)0.811 (1.204)0.51520.773
αmin1.335 (2.658)1.318 (2.440)1.251 (2.385)0.88520.643
αmax2.127 (1.499)2.028 (1.183)1.992 (1.278)0.15420.926
αspan1.061 (1.939)1.03 (1.776)1.071 (1.638)0.44720.800
f(α)min0.579 (0.400)0.555 (0.413)0.545 (0.444)3.21620.200
f(α)max1.535 (0.396)1.556 (0.421)1.560 (0.332)1.20820.547
f(α)span0.984 (0.688)1.008 (0.606)1.005 (0.571)3.58120.167
AUS DQ(Q)32.774 (22.57)31.874 (20.588)32.295 (21.729)1.18020.554
AUS α(Q)34.846 (29.762)33.654 (26.89)34.093 (27.543)1.28320.527
AUS f(α)20.693 (3.471)20.816 (5.225)20.567 (5.805)1.12920.569
Table 2. Extreme value parameters and area under the spectrum parameters (AUS) for the caudate nucleus and putamen groups.
ParameterMEDIAN Value (Range)Mann–Whitney UZp
Caudate NucleusPutamen
DQmin0.647 (1.486)1.461 (1.336)2910.06.796<0.001
DQmax1.518 (1.018)2.169 (1.19)2917.06.834<0.001
DQspan0.872 (1.233)0.722 (0.881)1235.0−2.4590.014
αmin−0.187 (2.604)1.419 (2.340)2970.57.130<0.001
αmax1.522 (1.202)2.337 (1.419)2907.56.782<0.001
αspan1.628 (1.939)0.929 (1.615)820.5−4.479<0.001
f(α)min0.579 (0.417)0.549 (0.464)1153.5−2.9090.004
f(α)max1.565 (0.428)1.546 (0.384)1495.0−1.0220.307
f(α)span0.993 (0.688)1.02 (0.484)2014.01.8450.065
AUS DQ(Q)21.736 (21.026)34.633 (20.598)2899.06.735<0.001
AUS α(Q)20.431 (27.255)37.361 (27.411)2878.06.619<0.001
AUS f(α)20.797 (6.067)20.567 (4.509)1460.0−1.2150.224
p values for statistically significant differences shown in bold.
Disclaimer/Publisher’s Note: The statements, opinions and data contained in all publications are solely those of the individual author(s) and contributor(s) and not of MDPI and/or the editor(s). MDPI and/or the editor(s) disclaim responsibility for any injury to people or property resulting from any ideas, methods, instructions or products referred to in the content.