Article

Evolution of Pore Structure and Fractal Characteristics in Red Sandstone under Cyclic Impact Loading

1
Institute of Geotechnical Engineering, Southeast University, Nanjing 211189, China
2
School of Resources and Safety Engineering, Central South University, Changsha 410083, China
3
Department of Civil, Environmental and Architectural Engineering, University of Padova, Via Ognissanti 39, 35122 Padova, Italy
*
Author to whom correspondence should be addressed.
Fractal Fract. 2024, 8(8), 437; https://doi.org/10.3390/fractalfract8080437
Submission received: 18 June 2024 / Revised: 12 July 2024 / Accepted: 19 July 2024 / Published: 24 July 2024
(This article belongs to the Special Issue Fractal Analysis and Its Applications in Rock Engineering)

Abstract

Fatigue damage can occur in surface rock engineering due to various factors, including earthquakes, blasting, and impacts. The underlying cause for the variations in physical and mechanical properties of the rock resulting from impact loading is the alteration in the internal pore structure. To investigate the evolution characteristics of the pore structure under impact fatigue damage, red sandstone subjected to cyclic impact compression by split Hopkinson pressure bar (SHPB) was analyzed using nuclear magnetic resonance (NMR) technology. The parameters describing the evolution of pore structure were obtained and quantified using fractal methods. The development of the pore structure in rocks subjected to cyclic impact was quantitatively analyzed, and two fractal evolution models based on pore size and pore connectivity were constructed. The results indicate that with an increasing number of impact loading cycles, the porosity of the red sandstone gradually increases, the T2 cutoff (T2c) value decreases, the most probable gray value of magnetic resonance imaging (MRI) increases, the pores’ connectivity is enhanced, and the fractal dimension decreases gradually. Moreover, the pore distribution space tends to transition from three-dimensional to two-dimensional, suggesting the expansion of dominant pores into clusters, forming microfractures or even macroscopic fissures. The findings provide valuable insights into the impact fatigue characteristics of rocks from a microscopic perspective and contribute to the evaluation of time-varying stability and the assessment of progressive damage in rock engineering.

1. Introduction

Sandstone is a heterogeneous material found widely on the earth’s surface, and it undergoes the formation of abundant microporosity, microcracks, and other defects. In engineering projects such as open slope excavation, mine blasting, and tunnel boring, which involve multiple blasting operations, the rock is subjected to repeated impacts, resulting in cumulative damage [1,2]. These impacts contribute to the development and expansion of initial defects, ultimately compromising the stability of the rock and even leading to destabilization. Therefore, the study of the cumulative damage and micro-defect evolution in the internal pore structure of rock under cyclic dynamic impact is crucial for addressing the prevalence of low-amplitude impact dynamic loading in engineering practice.
The fundamental reason for the variation of physical and mechanical properties of rocks when subjected to cyclic impact loading is the alteration of their pore structure [3,4]. The Splitting Hopkinson Pressure Bar (SHPB) method [5,6,7], widely used as an experimental technique, is recommended by the International Society of Rock Mechanics (ISRM) for studying the response characteristics of rocks under cyclic impact loading [8,9,10,11]. From the microscopic point of view, damage to rocks from cyclic impact is evident through an increase in porosity and pore connectivity [12], or it may show the opposite trend [4,13]. Researchers have conducted studies on the evolution of rock damage under cyclic impact loading, considering factors such as heat treatment [11,14], water saturation [1,15], and surrounding pressure [12,16], achieving considerable results. However, most of them have focused only on the mechanical properties of rocks and the energy consumption law [10], or they have provided qualitative analyses of the characteristics of pore structure evolution, while quantitative research on the extent of damage to rocks based on pore structure expansion remains insufficient.
In addition, the assessment of pore structure using Euclidean geometry or simple mathematical methods is ineffective [17], as it fails to directly capture the microscopic perspective of rock damage. Fractal methods are employed to study the self-similarity of geometric and structural properties in natural objects [18,19]. Numerous studies have confirmed the fractal nature of rock pores [20,21,22,23,24]. As a result, employing fractal geometrical methods allows for a more accurate assessment of the spatial geometrical characteristics of pores [25,26,27], facilitating the connection between micro-morphology and macro-representation [22,28]. The pore structure is mainly characterized by porosity and pore connectivity, and T2 spectra obtained by NMR techniques provide information on pore distribution [29,30], which can be utilized to derive pore fractal dimensions [31,32,33]. Nevertheless, existing studies on pore fractal analyses primarily focus on the total porosity or fractional porosity within specific size ranges, and the interaction between pore connectivity and pore fractal dimensions is seldom considered.
The researchers employed various methods, such as NMR detection and fractal theory, to characterize the evolution of pore structure in sandstones subjected to cyclic impact. The pore structure was evaluated by T2 spectra, porosity, magnetic resonance imaging (MRI) [34], and fractal dimension. Firstly, the T2 spectrum was divided based on pore size, and a correlation model between fractional porosity and fractal dimension was established. Additionally, the combination of the NMR technique, centrifugation, and drying techniques effectively portrayed the pore connectivity and characterized the fractal features of the pores accordingly. The relationship between the microscopic pore structure and fractal dimension was established through two fractal methods: one based on pore size and the other on pore connectivity. Furthermore, the fractal characteristics of various pore structures were summarized. By conducting a quantitative analysis of rock damage caused by cyclic impacts, this study provides valuable insights into the time-varying stability characteristics and progressive damage mechanisms relevant to rock engineering. The findings of this study hold substantial relevance for evaluating pore structure and conducting fractal analysis of sandstones.

2. Methods

2.1. Materials and Experimental Procedures

Due to the widespread availability of sandstone on the earth’s surface, this research focused on red sandstone sourced from Yantai, Shandong Province [3]. Cylindrical specimens, measuring 50 mm in diameter and 50 mm in height, were precisely machined with an end surface tolerance of less than ±0.02 mm for subsequent cyclic impact damage experiments. A total of 4 specimens were selected from 7 specimens for research based on their acoustic detection analysis, ensuring a small dispersion. These selected specimens exhibited an average longitudinal wave speed of 4993 m/s and a density of 2474 kg/m3. XRD experiments revealed that the sandstone specimens were primarily composed of sodium feldspar and magnesite, accompanied by a minor presence of calcite and other minerals.
In order to investigate the evolution of rock pore structure during cyclic impact loading and elucidate the damage mechanism of rocks on a micro scale, a series of six impact loadings was conducted on sandstone. The experimental procedure is illustrated in Figure 1, outlining the following key steps:
(1)
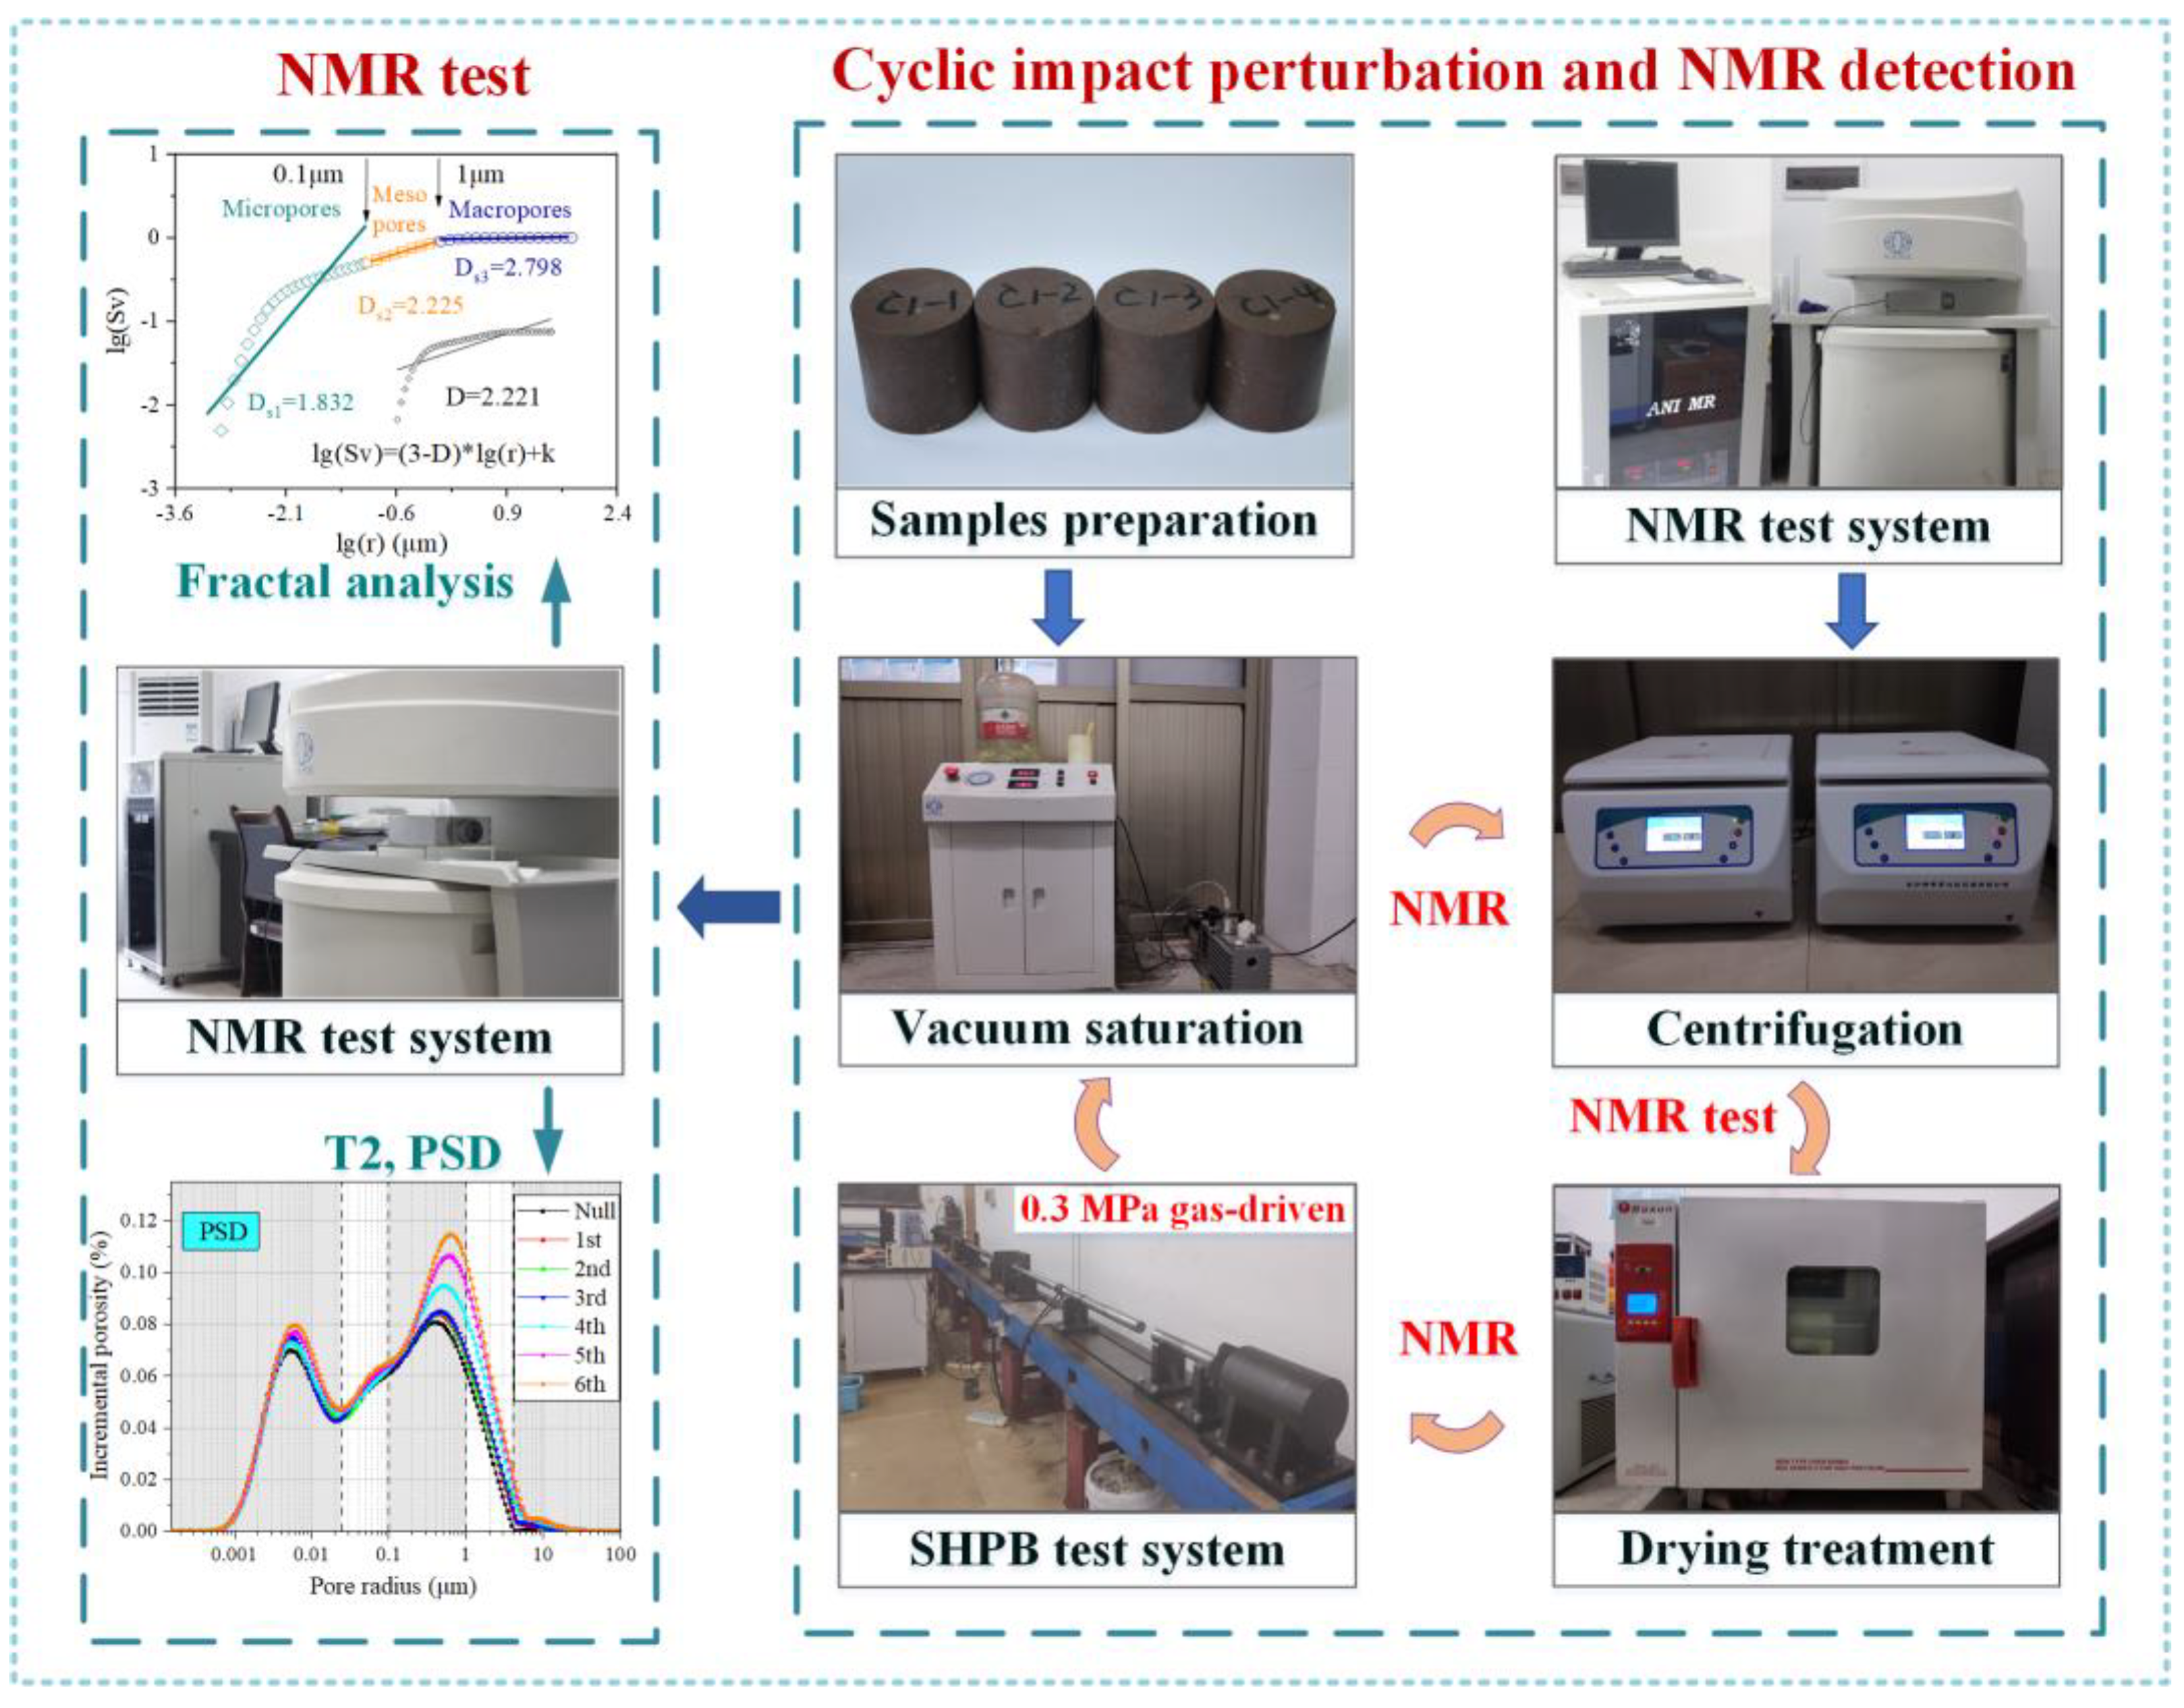
Saturation treatment: prior to conducting NMR tests, the samples were subjected to a 48 h moisture saturation using a vacuum saturation device at a pressure of 0.1 MPa to ensure complete saturation of the pores.
(2)
NMR testing: Each specimen underwent NMR tests utilizing the AiniMR-150 NMR system manufactured by Suzhou Newmarket Analytical Instruments Co., Ltd. [3,31]. The CPMG sequence was applied with specific parameters: a 0.256 ms echo time (TE = 0.256 ms), 4096 echoes (NECH = 4096), a 6000 ms waiting time (TW = 6000 ms), and 32 scans. The porosity, T2 distribution, and MRIs were obtained.
(3)
Centrifugation and drying: After saturation and the NMR test, the samples were centrifuged at 4000 rpm for 90 min, followed by NMR testing. Subsequently, the specimens were placed in an oven and dried at 60 °C for 12 h before undergoing further NMR testing.
(4)
SHPB cyclic impact loading experiments: The SHPB equipment is mainly composed of a cylinder that generates power, a cone-shaped striker, an incident bar, a transmission bar, an absorption bar, and a data receiving and collecting system [4,8]. The pressure in the high-pressure gas chamber was set to 0.3 MPa, and the release pressure was released to drive the striker out at a speed of (3.27 ± 0.18) m/s.
Figure 1. Experimental procedures of micro−damage detection under cyclic impact loading.
Fractalfract 08 00437 g001

2.2. Multi-Exponential Decay Principle of NMR

When the NMR system is tested with a homogeneous magnetic field with a small magnetic field gradient and a short echo time, the volumetric and diffusive relaxation rates can be disregarded [4,21]. Consequently, the NMR relaxation mechanism of the fluid in the pore space can be approximated to be solely related to the surface relaxation time T2 [3,30]. As rocks and other porous media contain pores of varying sizes, the spin-echo string obtained from transverse relaxation measurements in NMR tests utilizing the CPMG sequence does not represent the attenuation of a single T2 value. Instead, it represents a distribution of multiple T2 values [35], which can be mathematically described by the following equation:
M ( t ) = M i ( 0 ) e t T 2 i
where M(t) is the magnetization vector measured at time t; Mi(0) is the initial value of the magnetization vector from the ith relaxation component; and T2i is the decay time of the ith transverse relaxation component. The summation is performed for all detected pores.
Figure 2 illustrates the multi-exponential attenuation characteristics observed in aqueous-only media within pores of varying sizes. Each pore of a specific size corresponds to a single T2 value, resulting in a mono-exponential attenuation of its spin-echo sequence. Multiple pores of varying sizes possess distinct T2 values associated with their corresponding pore sizes, leading to multi-exponential attenuation in their synthesized spin-echo series.
In the case of a single pore, the magnetization vector undergoes exponential attenuation, and the signal amplitude is determined by the equation provided below:
M ( t ) = M ( 0 ) e ρ 2 S V t
M(0) is directly proportional to the volume of the pore. In porous media with 100% water saturation, the system comprising pores of varying sizes exhibits a T2 value distribution. The resultant signal amplitude is the cumulative sum of signal amplitudes generated by water within each individual pore. The signal amplitude is determined by the formula below:
M ( t ) = M i ( 0 ) e t ρ 2 S V i
where (S/V)i represents the ratio of surface area to volume for the ith pore; ρ2, known as the surface relaxation strength of the rock, is associated with its mineral composition [36,37]. The mineral composition, as characterized by XRD, indicates that minerals similar to those in red sandstone have a value of ρ2 = 0.005 μm/ms [3,38].
Obviously, M(0) = ∑M i(0), and
1 T 2 i = ρ 2 S V i
When it is assumed that all pores share similar geometry, a particular pore size corresponds to a unique specific surface area, known as
S V i = F s 1 r i
where ri is the radius (μm) of the ith pore, and Fs is the pore shape factor. For spherical pores, Fs is set to 3. By combining Equations (4) and (5), it is evident that a pore of a specific size ri corresponds to a corresponding time T2i.
r i = F s ρ 2 T 2 i = 0.015 T 2 i
By measuring M100%(0), M(0) and Mi(0) can then be scaled to porosity.
Φ = M ( 0 ) M 100 % ( 0 ) = M i ( 0 ) M 100 % ( 0 ) = M i ( 0 ) M 100 % ( 0 ) = Φ i
where Φ is the porosity of the rock; Φi is the porosity corresponding to all the ith pore sizes (also called interval porosity).
Thus, the T2 distribution (the signal amplitude M0i associated with the time constant T2i) is scaled to a pore size distribution [35] (each pore size ri and the associated porosity component Φi).

3. Results

3.1. Evolution of Pore Structure

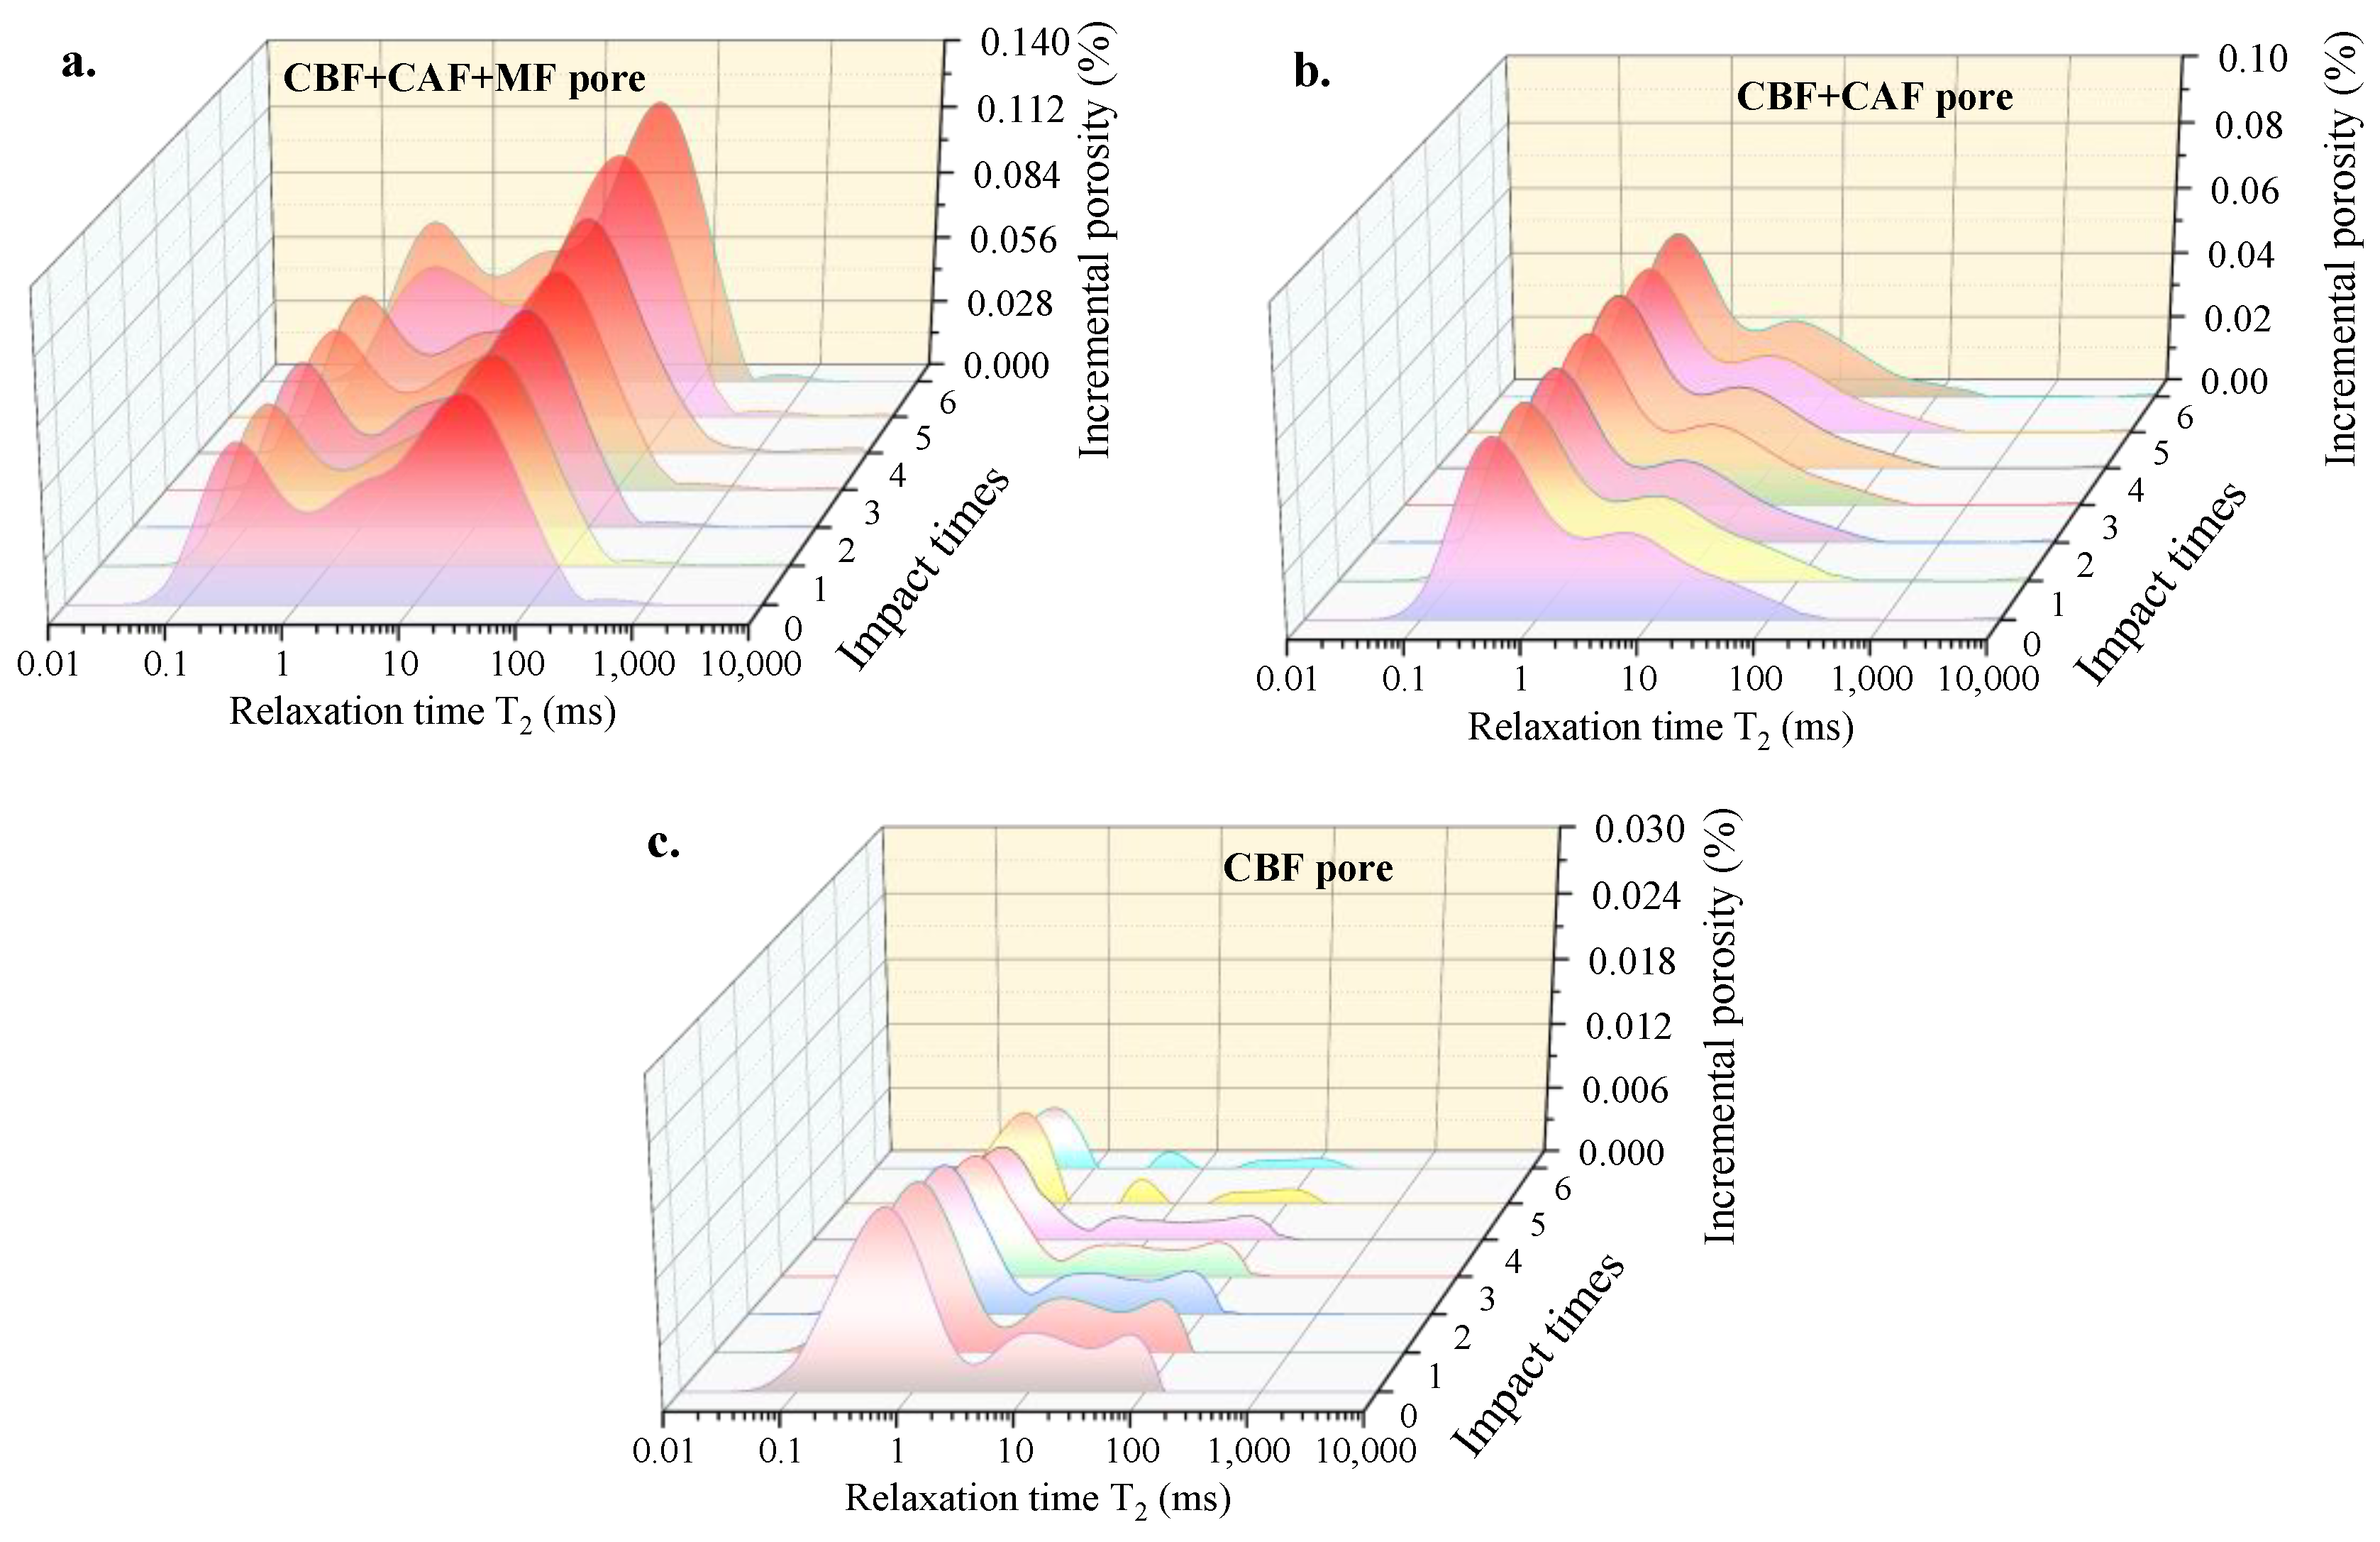
3.1.1. T2 Spectrum Distribution Measured According to Pore Connectivity

Sandstone exhibits intricate pore structures with varying connectivity, leading to variations in fluid confinement. Thus, in this study, the sandstone samples were subjected to NMR testing as shown in Figure 3 using the experimental setup depicted in Figure 1, following water saturation, centrifugation, and drying operations. This allowed for the capture of the T2 spectrum distribution of pores, exhibiting varying degrees of fluid confinement within the sandstone [19,39]. The pores are classified into three categories based on the fluidity of water within them: clay-bound fluid (CBF) pores, capillary-bound fluid (CAF) pores, and movable fluid (MF) pores [19,26]. CBF pores encompass small-sized pores and large pores, with limited connectivity [40]. Fluids within these pores primarily adhere due to the van der Waals force exerted by the solid matrix. CAF pores are characterized by retaining fluids without significant loss under specific centrifugal forces. However, larger thermal stress displacement can result in fluid loss, indicating relatively poor pore connectivity. Following centrifugation, fluids trapped within highly-connected pores are released, resulting in their escape from centrifuged pores. The pores that cannot be detected by NMR due to water escape after centrifugation represent MF pores.
Figure 4a displays the T2 spectrum, illustrating the distribution of full-size pores (including CBF pores, CAF pores, and MF pores); Figure 4b represents the T2 spectrum showing the distribution of CBF and CAF pores; and Figure 4c exclusively depicts CBF pores. The data extracted from Figure 3 reveal that during the cyclic impact process, the area of the T2 spectrum representing the full-size pores and the total porosity both increase gradually, providing evidence of the progressive development of the sandstone’s pore structure. Conversely, as the number of cycles increases, the CBF porosity and its T2 spectral area decrease gradually, implying that the ability of the pores to bind the fluid is reduced due to the interconnection of the pores. Conversely, as the number of cycles increases, the CBF porosity and its T2 spectral area decrease gradually, implying a decrease in the binding capacity between the pore and the fluid. Consequently, more fluid is lost from the pore under external forces, enhancing the connectivity of the pore structure.
The T2 spectra of pore distributions with various connectivity were acquired under distinct fluid constraints [39,40]. Figure 4a was utilized to obtain the T2c value [29] and classify the T2 spectra presented in Figure 3, while the porosities of CBF, CAF, and MF pores were quantitatively determined and illustrated in Figure 4b. Following six cycles of impact, the total porosity rose from 6.36% to 7.64%. Notably, the porosity Φcb of the CBF pores decreased from 0.75% to 0.31%, with a decrease of 58.4%, while the porosity Φca of the CAF pores increased from 2.05% to 2.43%, with an increase of 18.4%. Furthermore, the porosity Φm of the MF pores exhibited an increment from 3.55% to 4.90%, with an increase of 37.8%.
As shown in Figure 4c, with the accumulation of impact times, both T2c1 and T2c2 decrease gradually [3]. T2c1 decreases linearly, while T2c2 decreases nonlinearly. The decrease in the T2c value indicates that the pore connectivity of rock is enhanced under cyclic impact loading. T2c1 characterizes the connectivity between small−sized pores. As shown in Figure 3c, it is found that the pore connectivity with a T2 value greater than 3 ms (corresponding to a pore size of 4.5 nm) is significantly enhanced. T2c2 characterizes the connectivity between large−sized pores. As shown in Figure 3b, it is verified that the pore connectivity is significantly enhanced when the T2 value is greater than 20 ms (corresponding to a pore size of 30 nm).

3.1.2. Quantitative Analysis of Pore Evolution Based on Pore Size

According to Equation (6), the T2 spectrum can be transformed into a pore size distribution (PSD) spectrum [32], wherein the resulting PSD spectrum exhibits the same shape as the T2 spectrum. To explicitly depict the evolution of pores in sandstone, a Boolean difference operation was applied to the PSD spectrum after cyclic impacts and to the PSD spectrum in the initial state [16]. This operation yielded the changes in pore state after varying numbers of impacts, as illustrated in Figure 5.
An observation of Figure 5 indicates that, throughout the cyclic impact process, the alteration in rock pores primarily comprises a decrease in pores within the range of 1 nm to 8 nm and an increase in pores within the range of 250 nm to 25,000 nm. Furthermore, the increase in porosity accumulates gradually with an augmentation in the number of impacts.
In line with relevant studies on pore size distribution, the pores were categorized into distinct types [41,42]: I−micropores (0–25 nm), II−micropores (25–100 nm), mesopores (100–1000 nm), and macropores (>1000 nm). This categorization facilitates further quantitative investigation of pore evolution, as depicted in Figure 6. Following six cycles of impact, the I−micropores within the sandstone exhibited a gradual decline of 2.79%, while the II−micropores, mesopores, and macropores progressively increased by 9.69%, 20.28%, and 96.56%, respectively. Notably, a relationship between porosity and the number of impacts was observed, represented by an exponential function Φ = a + b × exp^(x/c) (a, b, and c are fitting parameters), as demonstrated in Figure 6.

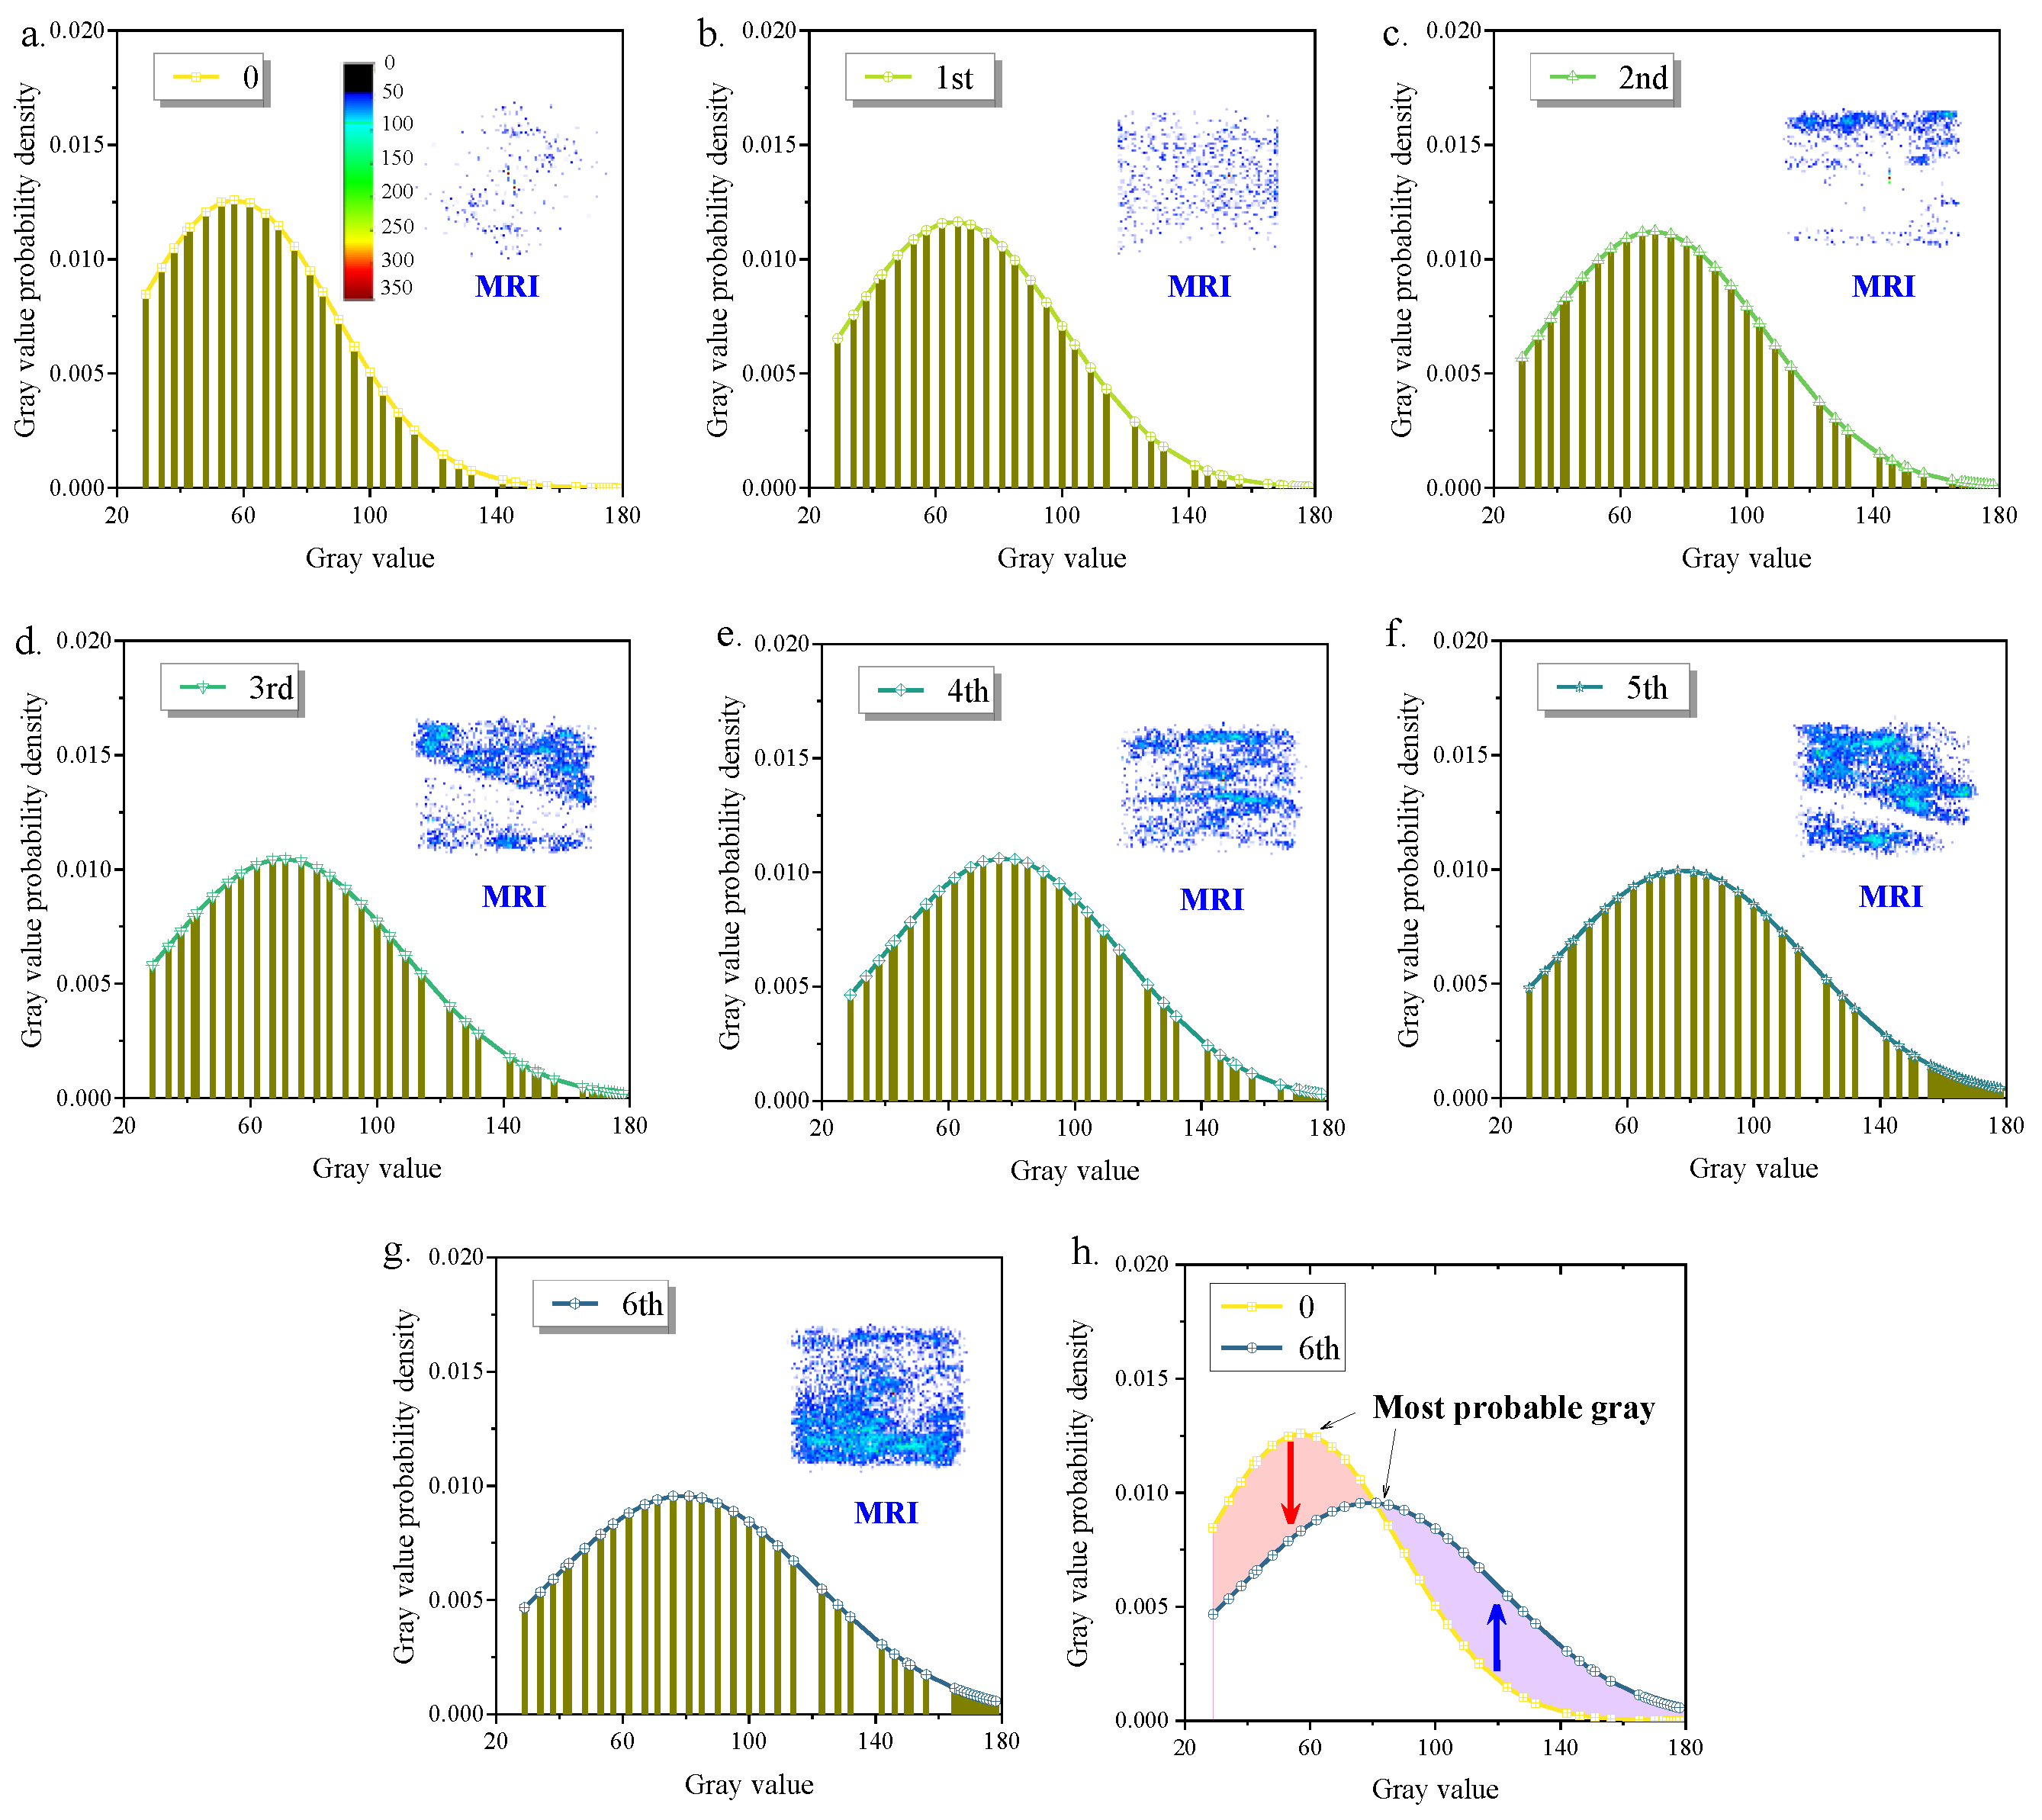
3.1.3. Pore Evolution Analysis Based on MRI

Figure 7 presents the MRI images and gray level statistics of the pores in rocks subjected to different impact cycles [34] (mainly larger pores greater than 0.1 μm, which are difficult to image due to the presence of smaller pores). The gray value describes the brightness value of image pixels, which correlates with the number of pores. As the number of pores increases [10,16], so does the gray value. As the number of impacts accumulates, the gray value distribution curve shifts towards the right, progressively increasing the most probable gray value. This observation confirms a gradual increase in the number of larger pores, and the pore development is mainly manifested as the expansion of large pores agglomerated into clusters to form pore clusters and microfractures or even macrofractures. Figure 7h illustrates the change in the gray value before and after the impact, resulting in an increase in the most probable gray value. In summary, these MRI results support the findings of larger pore variations observed in Figure 5 and Figure 6c,d.
The impact of mesopores and macropores on pore connectivity is significant, and alterations in pore size and connectivity induce changes in the geometric properties of the pore space. Rock pores are distributed throughout a three–dimensional space, but they fail to occupy the entire three–dimensional space due to their intricate microscopic structure. Describing them using Euclidean geometry becomes challenging. Consequently, using two mathematical statistical methods, namely pore size distribution and pore connectivity, to precisely evaluate the intricate characteristics of pore structure is challenging. Considering some research [20,21,22,23,24,31] indicating the fractal structural properties of pores, employing fractal geometry methods allows for a more precise evaluation of the spatial geometric features of pores.

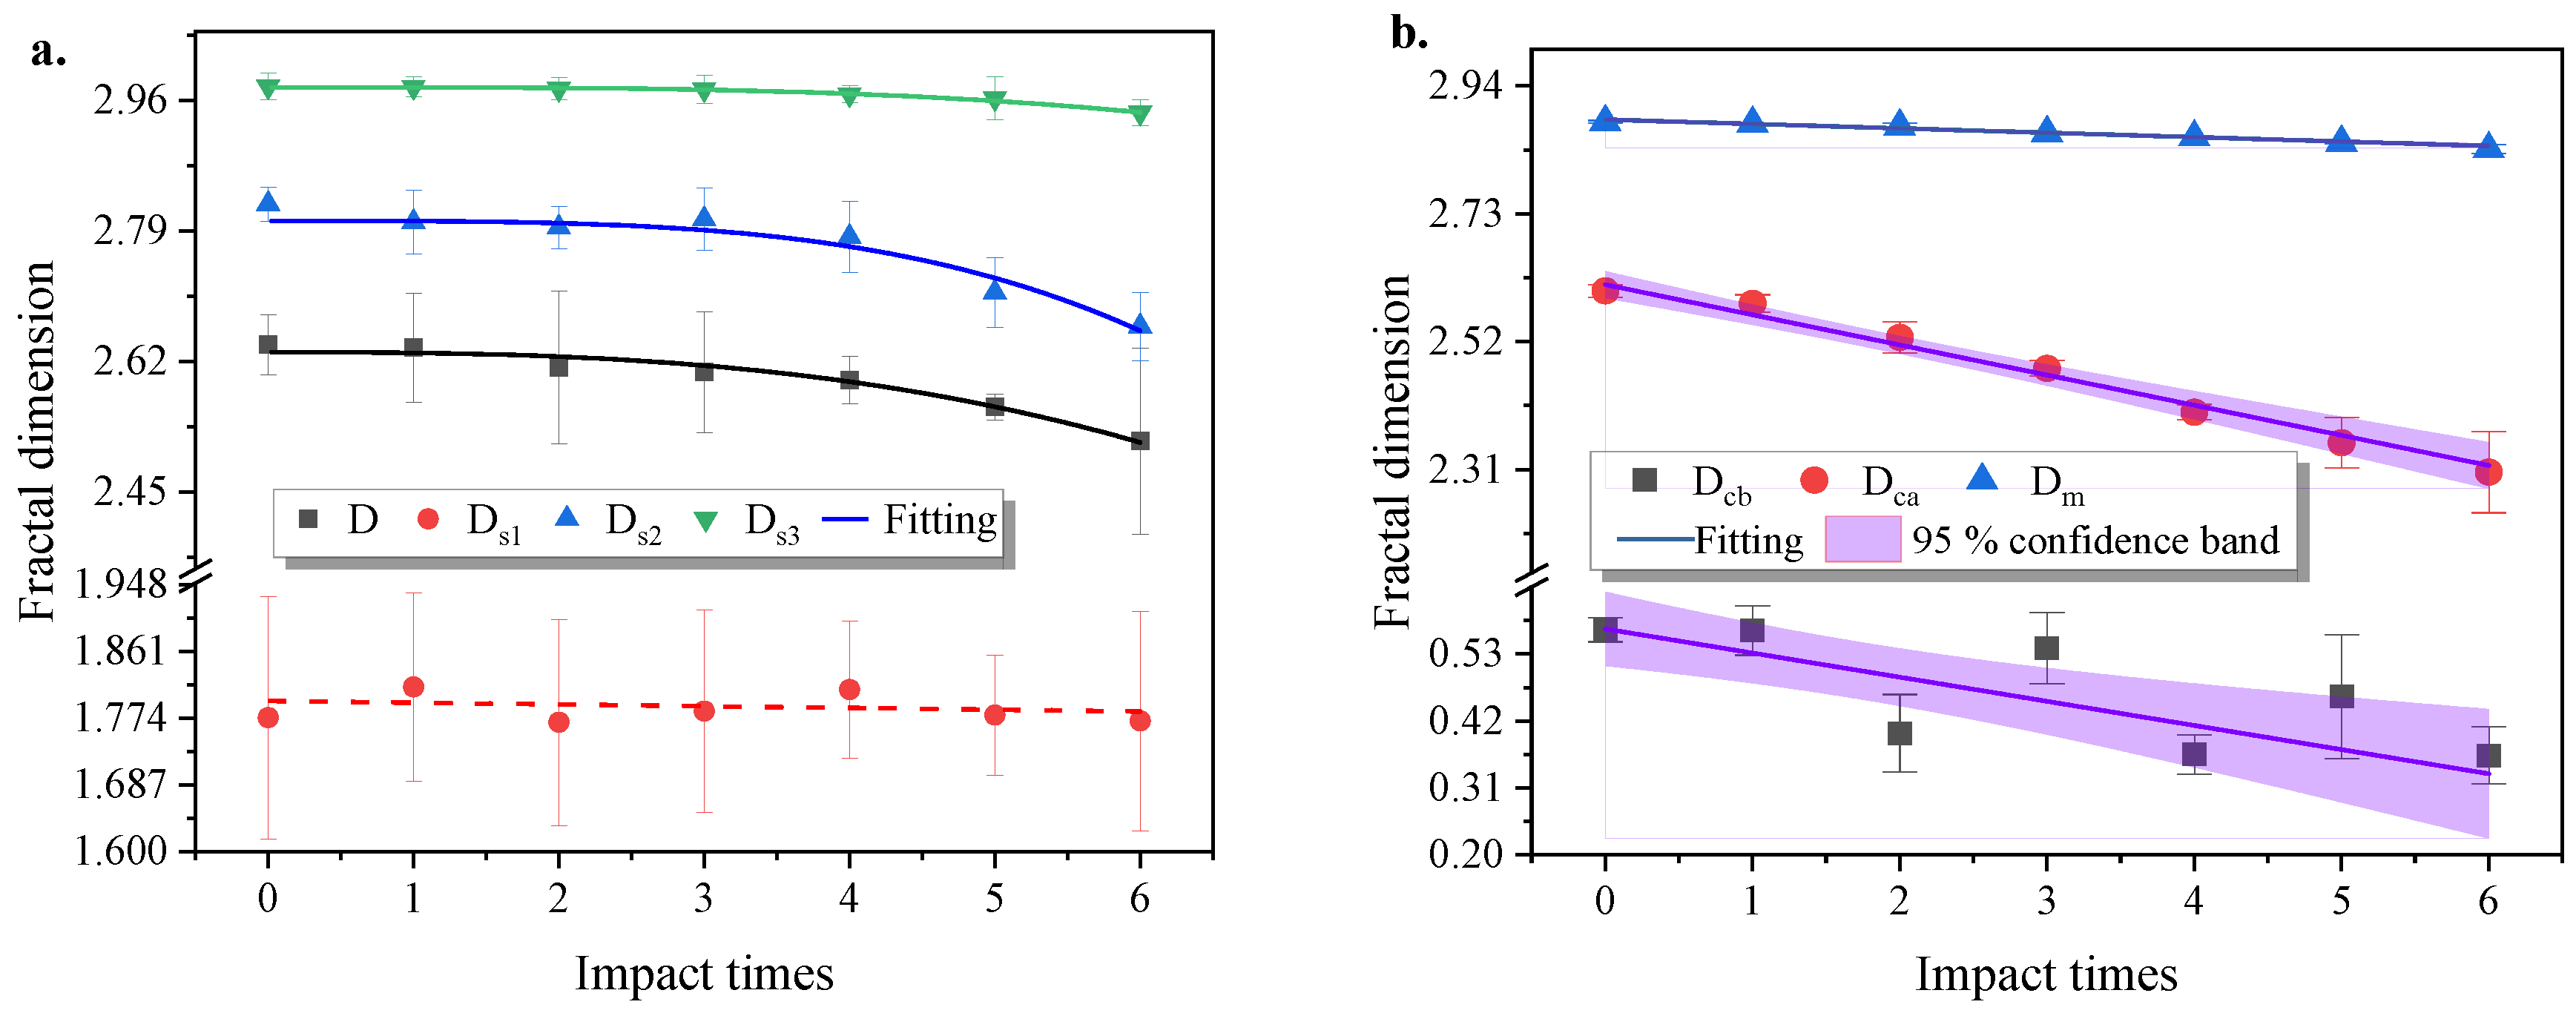
3.2. Fractal Characteristics of Pore Structure

Research findings in the field of fractal theory have demonstrated that the pore structure of rocks exhibits distinct fractal characteristics [25]. Additionally, a relationship can be established between the pore radius, denoted as r, and the fractal dimension, represented by D [24]. The calculation of pore content exceeding the size of r can be performed using the following formula:
N r = r r m a x   f ( r ) d r = a r D
where N r represents the count of pores whose pore size is larger than r. r and r m a x denote the pore radius and its maximum, μm. D represents the fractal dimension, and a is the fractal factor. f ( r ) signifies the density function of the pore radius, expressed as a percentage (%). It can be expressed as follows [6]:
f r = d N r d r = D a r D 1
The cumulative pore volume with a size less than r can be expressed as
V r = r m i n r   f ( r ) a r 3 d r = a r 3 D r m i n 3 D
where V r represents the cumulative volume of pores with a radius smaller than r, measured in cubic micrometers μm.   a refers to a proportional constant [6], which is equal to –Da²/(3 – D). r m i n denotes the minimum pore radius, μm. Therefore, the total pore volume V t of sandstone can be calculated using Equation (11).
V t = r m i n r m a x   f ( r ) a r 3 d r = a r m a x 3 D r m i n 3 D
The cumulative volume fraction of a pore radius less than r can be obtained by Equations (10) and (11) [38].
s v = V r V t = r 3 D r m i n 3 D r m a x 3 D r m i n 3 D
If r m i n is considerably smaller than r m a x , Equation (12) can be simplified to (13), and further revised as Equations (14) and (15).
s v = r 3 D r m a x 3 D = T 2 3 D T 2 m a x 3 D
lg s v = 3 D lg r + D 3 lg r m a x
lg s v = 3 D lg T 2 + D 3 lg T 2 m a x
If sandstone pores exhibit a self–similar structure and possess fractal characteristics, Equation (14) establishes a linear relationship between l g r and l g ( s v ) [39]. This Equation suggests that l g r and l g ( s v ) 3 are correlated in a linear manner. Moreover, a higher fractal dimension D indicates the presence of a more complex pore structure and greater heterogeneity within the sandstone sample.
Fractal theory can be applied to analyze the complex characteristics of pore structures [27]. Correspondingly, fractal dimension calculations can be conducted based on pore size distribution (F–ps method) and pore connectivity (F–T2c method), the principles of which are shown in Figure 8a,b. Furthermore, the fractal dimensions obtained by the F–ps method are listed in Table 1, and those based on the F–T2c method are listed in Table 2, where D, Ds1, Ds2, and Ds3 denote the fractal dimension of the total pores, micropores, mesopores, and macropores, respectively, and Dcb, Dca, and Dm represent the fractal dimension of the CBF pores, CAF pores, and MF pores, respectively. In particular, in Figure 8a, since the pore degree changes of the I–micropores and II–micropores are not large, the I–micropores and II–micropores are merged into micropores (0–100 nm) for calculation. The change in fractal dimension with impact times is shown in Figure 9. The results of the fit between the fractal dimension and the number of impacts are illustrated in Table 3. According to the F–Tps method in Figure 9a, the fractal dimensions D, Ds2, and Ds3 of the total pores, mesopores, and macropores have a power function relationship with the number of impacts x, and the goodness of fit R2 is greater than 0.9. The fractal dimensions decrease with the increase in impact times. However, the pore degree of micropores (0–0.1 μm) is not related to the number of impacts. At the 0.05 level, p = 0.625 > 0.05, the slope is significantly different from 0, and Ds1 is less than 2, which is considered non–physical and lacks the fractal characteristics analyzed from the surface geometry perspective.
In addition, according to the F–T2c method in Figure 9b, the fractal dimensions Dcb, Dca, and Dm of THE CBF pores, CAF pores, and MF pores are negatively linearly correlated with the number of impact times x. The fractal dimension values of CBF, CAF, and MF pores in their undisturbed natural state are 0.571, 2.614, and 2.885, respectively. It can be seen that the CBF pores with an extremely small pore size also lack fractal characteristics when analyzed from the surface geometry perspective, similar to micropores.

4. Discussion

4.1. Correlation of Porosity and Fractal Dimension

Under cyclic impact disturbance, the continuous medium and discontinuous pores inside the rock are repeatedly stretched and compressed by stress waves [8,16]. On the one hand, micropores and microcracks sprout, expand, and connect, while on the other hand, fewer pores may be compacted or even closed. Overall, this leads to the gradual development of micropores and microcracks inside the rock, an increase in porosity, and a significant rise in the large pores with an increment of 96.56%. The changes in pore structure caused by cyclic impact disturbance are not only reflected in the change in porosity but also in the geometric shape of spatial distribution [31]. To better evaluate pore evolution, the correlation between porosity and fractal dimension is analyzed to evaluate the pore structure evolution characteristics of sandstone under cyclic impact disturbance.
According to the F–ps method, the correlation analysis between porosity and fractal dimension for total pores, micropores, mesopores, and macropores is illustrated in Figure 10. The relationship between the total pore fractal dimension (D) and porosity (Φ) can be described by a power function D = 2.290–7.5 × 10⁻⁶Φ4.994, with an R2 value of 0.963, as illustrated in Figure 10a. Similarly, the fractal dimensions (Ds2 and Ds3) of medium–sized and large pores exhibit power–law relationships with their respective porosities (Φs2 and Φs3). Specifically, Ds2 = 2.871–2.1 × 10⁻⁴Φs26.00, with an R2 value of 0.954 in Figure 10c, and Ds3 = 2.978–0.014 Φs35.441, with an R2 value of 0.989 in Figure 10d. Additionally, it is evident from Figure 10b that the linear fit between microporous porosity (Φs1) and its fractal dimension (Ds1) has a very low R2, and at the 0.05 level, p = 0.271 > 0.05, indicating that the two are not significantly correlated.
Figure 11 illustrates the correlation analysis of porosity and fractal dimension for different types of pores under varying pore connectivity, as per the F–T2c method. Fractal dimension exhibits a linear negative correlation with the respective porosity for the CAF and MF pores, as illustrated in Figure 11b,c, with a goodness of fit (R2) exceeding 0.93. However, there is no significant relationship between the porosity (Φcb) of the CBF pores and its fractal dimension (Dcb) in Figure 11a, as indicated by a p–value of 0.053, which is greater than the significance threshold of 0.05 [29]. The slope is significantly different from zero at a confidence level of 0.05.
In summary, under equal–amplitude cyclic impact loading, the total porosity of sandstone gradually increases, accompanied by a rise in the magnitude of the increase (Figure 4b). Simultaneously, the fractal dimension of the sandstone decreases, indicating the expansion and fusion of pore microfractures, resulting in the formation of larger individual pores or regional pore groups. This expansion leads to a reduction in pore structure complexity and a decrease in the integrity of the solid medium, subsequently diminishing its resistance to impact. This represents the accumulation of fatigue damage and the intensification of structural damage.
There are two distinct methods for classifying pores: the pore classification based on pore size range and the classification based on pore connectivity. Classifying pores by size (0.1 μm, 1 μm) divides them into fixed pore ranges. Furthermore, classifying pores by connectivity focuses on characterizing differences in pore connectivity rather than considering pore size. The boundaries of pore ranges are not fixed but change with the variation in the T2c value. Two methods of pore classification are thus introduced to investigate changes in the pore structure of sandstone under cyclic impact loading, which allows for a more comprehensive examination of the pore structure in terms of both porosity and pore connectivity.
The relationship between the fractional porosity of each type of pore and its corresponding fractal dimension, as obtained by both the F–T2c method and the F–ps method, is worthy of investigation. As the number of impacts increases, the porosity of mesopores and macropores increases, leading to a corresponding decrease in their fractal dimension (Figure 6c,d). In contrast, the fractional porosity of Φca exhibits a linear decrease, while Φcb and Φm demonstrate a linear increase, resulting in a linear decrease in the corresponding fractal dimension. Therefore, there is a non–linear correlation between the fractional porosities of mesopores and macropores and their fractal dimensions under the F–ps method (Figure 9). Conversely, the porosities of the CAF pores and MF pores are linearly correlated with their fractal dimensions under the F–T2c method (Figure 10).

4.2. Variation Correlation between Porosity and Fractal Dimension

As shown in Figure 10 and Figure 11, there is a correlation between the fractional porosity of various types of pores and their fractal dimensions obtained using both the F–T2c method and the F–ps method. This correlation enables us to quantitatively assess changes in pore structure in terms of porosity and pore connectivity, respectively. However, it is essential to extract and analyze the magnitude of these changes to investigate the fatigue damage of the rock under equal–amplitude cyclic impact loading. Consequently, the percent increase in porosity (ΦI) and the percent increase in fractal dimension (DI) were defined.
Φ I = Φ i Φ 0 Φ 0 × 100 %
D I = D i D 0 D 0 × 100 %
where Φi and Di are the porosity and fractal dimension after i times of impact loading, Φ0 and D0 are the porosity and fractal dimension in the initial state (unperturbed), respectively.
Figure 12 presents the correlation between ΦI and DI under the F–T2c method and F-ps method. Under the F–ps method, shown in Figure 12a, there is a nonlinear power function relationship between the percentage of change in porosity and the percentage of change in fractal dimension for mesopores, macropores, and all pores (with a higher R2 than the linear relationship). Conversely, under the F–T2c method, shown in Figure 11b, there is a strong linear correlation between ΦI and DI for the CAF pores and MF pores. This finding is consistent with the relationship between porosity and fractal dimension.
Additionally, for micropores (Figure 11a) and the CBF pores (Figure 11b), there is no significant correlation between ΦI and DI. This lack of correlation may be attributed to the fact that both micropores and CBF pores are small in size, and their fractal dimension is lower than 2. These pores are considered non–physical and lack fractal features that can be analyzed from the surface geometry perspective [18,31].

5. Conclusions

The main conclusions of this study are as follows:
(1)
The pore structure of red sandstone develops gradually under cyclic equal–amplitude impact loading, and the porosity increment increases with the accumulation of impacts. This increase is mainly observed in mesopores (0.1–1 μm) and macropores (>1 μm). After six impacts, macropores increased by 96.56%. The most probable developed pores are those with a pore size of about 1 μm.
(2)
The double T2 cutoff (T2c) value effectively evaluates pore connectivity. The T2c2 value distinguishes between the MF pores and the non–MF pores (CBF pores and CAF pores). Under cyclic impact, both T2c2 and T2c1 decrease, while the porosity of the MF pores increases by 37.8%, thereby enhancing the pore connectivity of the sandstone.
(3)
MRI visualizes the development of pores. The most probable gray value increases during cyclic impact. There is an increase in the number of macropores, which expand, forming pore clusters and even macro fissures.
(4)
Based on pore size and pore connectivity, the pores were analyzed, and their fractal dimension was calculated. The fractal dimension of various types of pores gradually decreased under cyclic impact. Additionally, the porosity of mesopores and macropores showed a non–linear correlation with their fractal dimension using the F–ps method. On the other hand, the porosity of the CAF and MF pores exhibited a linear correlation with their fractal dimension using the F–T2c method. Notably, micropores with small size or CBF pores with weak connectivity lack fractal features when analyzed from a surface geometry perspective.
(5)
Taking into account the magnitude of changes in the pore structure of rocks during equal–amplitude cyclic impact loading, a correlation model between ΦI and DI was established. Mesopores, macropores, and all pores exhibit a nonlinear power function relationship between ΦI and DI. In contrast, the CAF pores and MF pores show a linear correlation between ΦI and DI.
This correlation study between the variation of fractal dimension and porosity reflects the complexity of the internal structure of the material, which is valuable for the prediction of material properties, the evaluation of geological reservoirs, and the optimization of engineering design.

Author Contributions

Methodology, Z.J., Y.L. and B.Z.; Software, B.Z.; Validation, P.W.; Formal analysis, P.W. and Y.L.; Investigation, G.T.; Resources, Z.J. and G.T.; Data curation, H.Q.; Writing—original draft, H.Q.; Writing—review & editing, Z.J.; Visualization, P.W.; Supervision, Z.J.; Funding acquisition, Z.J. All authors have read and agreed to the published version of the manuscript.

Funding

The authors are very thankful for the technical and financial support provided by the National Natural Science Foundation of China (Nos. 41877231, 42072299) and the Graduate Research and Innovation Projects of Jiangsu Province (KYCX21_0124).

Data Availability Statement

The data presented in this study are available on request from the corresponding author.

Conflicts of Interest

The authors declare no conflict of interest.

Abbreviations

T2Transverse relaxation time
rPore radius
Φ 0Initial porosity
Φ iPorosity after ith impacts
ΦcbPorosity of CBF pores
ΦcaPorosity of CAF pores
ΦmPorosity of MF pores
DFractal dimension
DcbFractal dimension of CBF pores
DcaFractal dimension of CAF pores
DmFractal dimension of MF pores
T2cT2 cutoff
MRIMagnetic resonance imaging
SHPBSplit Hopkinson pressure bar
NMRNuclear magnetic resonance
PSDPore size distribution
CBFClay–bound fluid
CAFCapillary–bound fluid
MFMovable fluid
F–T2cCalculation of D value based on T2 cutoff
F–psCalculation of D value based on pore size
ΦIThe percent increase in porosity
DIThe percent increase in fractal dimension

References

  1. Chu, F.; Liu, D.; Zhang, X.; Yu, H.; Zhu, G. Dynamic Response and Damage Regularity of Sandstone with Different Moisture States Under Cyclic Loading. Fractal Fract. 2022, 6, 226. [Google Scholar] [CrossRef]
  2. Li, R.; Zhu, J.; Qu, H.; Zhou, T.; Zhou, C. An Experimental Investigation on Fatigue Characteristics of Granite Under Repeated Dynamic Tensions. Int. J. Rock Mech. Min. Sci. 2022, 158, 105185. [Google Scholar] [CrossRef]
  3. Jiang, Z.; Yu, S.; Deng, H.; Deng, J.; Zhou, K. Investigation on Microstructure and Damage of Sandstone under Cyclic Dynamic Impact. IEEE Access 2019, 7, 133145–133158. [Google Scholar] [CrossRef]
  4. Liu, C.; Deng, H.; Wang, Y.; Lin, Y.; Zhao, H. Time-Varying Characteristics of Granite Microstructures After Cyclic Dynamic Disturbance Using Nuclear Magnetic Resonance. Crystals 2017, 7, 306. [Google Scholar] [CrossRef]
  5. Weng, L.; Wu, Z.; Liu, Q. Dynamic Mechanical Properties of Dry and Water-Saturated Siltstones Under Sub-Zero Temperatures. Rock Mech. Rock Eng. 2020, 53, 4381–4401. [Google Scholar] [CrossRef]
  6. Yang, R.; Xu, Y.; Chen, P.; Wang, J. Experimental Study on Dynamic Mechanics and Energy Evolution of Rubber Concrete Under Cyclic Impact Loading and Dynamic Splitting Tension. Constr. Build. Mater. 2020, 262, 120071. [Google Scholar] [CrossRef]
  7. Zhang, K.; Lai, J.; Bai, G.; Pang, X.; Ma, X.; Qin, Z.; Zhang, X.; Fan, X. Comparison of Fractal Models Using Nmr and Ct Analysis in Low Permeability Sandstones. Mar. Pet. Geol. 2020, 112, 104069. [Google Scholar] [CrossRef]
  8. Cao, R.; Wang, H.; Qiu, X.; Wang, C.; Lin, H.; Qiao, Q. Damage characteristics and fracture behavior of marble after cycle impact loading. Theor. Appl. Fract. Mech. 2023, 125, 103903. [Google Scholar] [CrossRef]
  9. Gao, X.; Xia, H.; Wang, X.; Zhao, C.; Yin, J.; Junyan, Y.; Yi, J. Experimental Study on Dynamic Mechanical Characteristics and Energy Evolution of Sandstone Under Cyclic Impact Loading. Shock Vib. 2022, 2022, 4805589. [Google Scholar] [CrossRef]
  10. Wang, X.; Dong, B.; Gao, X.; Li, P.; Wang, S.; Hu, B. Dynamic Behaviour and Energy Evolution of Granite in a Tunnel Under Cyclic Impact Loading. Rock Mech. Rock Eng. 2023, 56, 8997–9012. [Google Scholar] [CrossRef]
  11. Xia, W.; Xue, J.; Zhang, Y.; Jin, J.; Zhao, Z.; Cai, R. Dynamic Characteristics of Thermal Damage Granite under Cyclic Impact Loading. Geotech. Geol. Eng. 2023, 41, 2313–2323. [Google Scholar] [CrossRef]
  12. Luo, N.; Suo, Y.; Fan, X.; Yuan, Y.; Zhai, C.; Sun, W. Research on Confining Pressure Effect of Pore Structure of Coal-Rich in Coalbed Methane Under Cyclic Impact. Energy Rep. 2022, 8, 7336–7348. [Google Scholar] [CrossRef]
  13. Jiang, Z.; Deng, H.; Liu, T.; Tian, G.; Tang, L. Study on Microstructural Evolution of Marble under Cyclic Dynamic Impact Based On Nmr. IEEE Access 2019, 7, 138043–138055. [Google Scholar] [CrossRef]
  14. Shu, R.; Yin, T.; Li, X.; Yin, Z.; Tang, L. Effect of Thermal Treatment on Energy Dissipation of Granite Under Cyclic Impact Loading. Trans. Nonferrous Met. Soc. China 2019, 29, 385–396. [Google Scholar] [CrossRef]
  15. Li, H.; Qiao, Y.; He, M.; Shen, R.; Gu, Z.; Cheng, T.; Xiao, Y.; Tang, J. Effect of Water Saturation on Dynamic Behavior of Sandstone after Wetting-Drying Cycles. Eng. Geol. 2023, 319, 107105. [Google Scholar] [CrossRef]
  16. Wang, X.; Guo, L.J.; Xu, Z.; Liu, X.; Xu, J.; Pan, B.; Deng, D. Dynamic Response and Damage Evolution of Red Sandstone with Confining Pressure Under Cyclic Impact Loading. Fatigue Fract. Eng. Mater. Struct. 2023, 46, 1078–1092. [Google Scholar] [CrossRef]
  17. Radlinski, A.P.; Ioannidis, M.A.; Hinde, A.L.; Hainbuchner, M.; Baron, M.; Rauch, H.; Kline, S.R. Angstrom-to-Millimeter Characterization of Sedimentary Rock Microstructure. J. Colloid Interface Sci. 2004, 274, 607–612. [Google Scholar] [CrossRef] [PubMed]
  18. Deng, H.; Tian, G.; Yu, S.; Jiang, Z.; Zhong, Z.; Zhang, Y. Research on Strength Prediction Model of Sand-Like Material Based on Nuclear Magnetic Resonance and Fractal Theory. Appl. Sci. 2020, 10, 6601. [Google Scholar] [CrossRef]
  19. Pang, X.; Wang, G.; Kuang, L.; Li, H.; Zhao, Y.; Li, D.; Zhao, X.; Wu, S.; Feng, Z.; Lai, J. Insights into the Pore Structure and Oil Mobility in Fine-Grained Sedimentary Rocks: The Lucaogou Formation in Jimusar Sag, Junggar Basin, China. Mar. Pet. Geol. 2022, 137, 105492. [Google Scholar] [CrossRef]
  20. Lay Lian, T.; Radhakrishnan, P.; Daya Sagar, B.S. Morphological Decomposition of Sandstone Pore–Space: Fractal Power-Laws. Chaos Solitons Fractals 2004, 19, 339–346. [Google Scholar] [CrossRef]
  21. Li, J.; Tan, S.; Yang, C.; Chen, H.; Lin, Y. Analysis of Damage Characteristics for Skarn Subjected to Freeze-Thaw Cycles Based on Fractal Theory. Fractal Fract. 2023, 7, 354. [Google Scholar] [CrossRef]
  22. Vidales, A.M.; Miranda, E.N. Fractal Porous Media: Relations Between Macroscopic Properties. Chaos Solitons Fractals 1996, 7, 1365–1369. [Google Scholar] [CrossRef]
  23. Wu, X.; Cai, M.; Zhu, Y.; Guo, Q.; Wang, P.; Dong, J. An Experimental Study on the Fractal Characteristics of the Effective Pore Structure in Granite by Thermal Treatment. Case Stud. Therm. Eng. 2023, 45, 102921. [Google Scholar] [CrossRef]
  24. Zhang, Z.; Weller, A. Fractal Dimension of Pore-Space Geometry of an Eocene Sandstone Formation. Geophysics 2014, 79, D377–D387. [Google Scholar] [CrossRef]
  25. Guo, X.; Huang, Z.; Zhao, L.; Han, W.; Ding, C.; Sun, X.; Yan, R.; Zhang, T.; Yang, X.; Wang, R. Pore Structure and Multi-Fractal Analysis of Tight Sandstone Using Mip, Nmr and Nmrc Methods: A Case Study from the Kuqa Depression, China. J. Pet. Sci. Eng. 2019, 178, 544–558. [Google Scholar] [CrossRef]
  26. Wu, F.; Li, Y.; Burnham, B.; Zhang, Z.; Yao, C.; Yuan, L.; Zhang, F.; Deng, H.; Xi, Y.; He, J. Fractal-Based Nmr Permeability Estimation in Tight Sandstone: A Case Study of the Jurassic Rocks in the Sichuan Basin, China. J. Pet. Sci. Eng. 2022, 218, 110940. [Google Scholar] [CrossRef]
  27. Xin, Y.; Wang, G.; Liu, B.; Ai, Y.; Cai, D.; Yang, S.; Liu, H.; Xie, Y.; Chen, K. Pore Structure Evaluation in Ultra-Deep Tight Sandstones Using Nmr Measurements and Fractal Analysis. J. Pet. Sci. Eng. 2022, 211, 110180. [Google Scholar] [CrossRef]
  28. Feng, Z.; Zhao, Y.; Zhao, D. Investigating the Scale Effects in Strength of Fractured Rock Mass. Chaos Solitons Fractals 2009, 41, 2377–2386. [Google Scholar]
  29. Jiang, Z.; Cai, G.; Tian, G.; Liu, X. Effect of Aggregate Particle Size on Mortar Pore Structure. Constr. Build. Mater. 2022, 352, 128988. [Google Scholar] [CrossRef]
  30. Li, J.; Zhou, K.; Liu, W.; Deng, H. Nmr Research on Deterioration Characteristics of Microscopic Structure of Sandstones in Freeze–Thaw Cycles. Trans. Nonferrous Met. Soc. China 2016, 26, 2997–3003. [Google Scholar] [CrossRef]
  31. Jiang, Z.; He, H.; Tian, G.; Guo, W.; Li, Y.; Pan, Z. Pore Structure Quantification and Fractal Characterization of Msa Mortar Based On 1H Low-Field Nmr. Fractal Fract. 2024, 8, 42. [Google Scholar] [CrossRef]
  32. Wang, F.; Yang, K.; Cai, J. Fractal Characterization of Tight Oil Reservoir Pore Structure Using Nuclear Magnetic Resonance and Mercury Intrusion Porosimetry. Fractals-Complex Geom. Patterns Scaling Nat. Soc. 2018, 26, 1840017. [Google Scholar] [CrossRef]
  33. Xie, W.; Yin, Q.; Wang, G.; Yu, Z. Variable dimension Fractal-Based Conversion Method between the Nuclear Magnetic Resonance T 2 Spectrum and Capillary Pressure Curve. Energy Fuels 2021, 35, 351–357. [Google Scholar] [CrossRef]
  34. Rigby, S.P. Theoretical Aspects of the Estimation of Pore and Mass Fractal Dimensions of Porous Media on the Macroscopic Scale Using Nmr Imaging. Chaos Solitons Fractals 1998, 9, 1519–1527. [Google Scholar] [CrossRef]
  35. Mohnke, O.; Yaramanci, U. Pore Size Distributions and Hydraulic Conductivities of Rocks Derived from Magnetic Resonance Sounding Relaxation Data Using Multi-Exponential Decay Time Inversion. J. Appl. Geophys. 2008, 66, 73–81. [Google Scholar] [CrossRef]
  36. Saidian, M.; Prasad, M. Effect of Mineralogy on Nuclear Magnetic Resonance Surface Relaxivity: A Case Study of Middle Bakken and Three Forks Formations. Fuel 2015, 161, 197–206. [Google Scholar] [CrossRef]
  37. Valori, A.; Rodin, V.; Mcdonald, P.J. On the Interpretation of 1H 2-Dimensional Nmr Relaxation Exchange Spectra in Cements: Is there Exchange Between Pores with Two Characteristic Sizes or Fe3+ Concentrations? Cem. Concr. Res. 2010, 40, 1375–1377. [Google Scholar] [CrossRef]
  38. Godefroy, S.; Korb, J.P.; Fleury, M.; Bryant, R.G. Surface Nuclear Magnetic Relaxation and Dynamics of Water and Oil in Macroporous Media. Phys. Rev. E 2001, 64, 021605. [Google Scholar] [CrossRef]
  39. Xie, W.; Yin, Q.; Zeng, J.; Wang, G.; Feng, C.; Zhang, P. Fractal-Based Approaches to Pore Structure Investigation and Water Saturation Prediction from Nmr Measurements: A Case Study of the Gas-Bearing Tight Sandstone Reservoir in Nanpu Sag. Fractal Fract. 2023, 7, 273. [Google Scholar] [CrossRef]
  40. Peng, L.; Zhang, C.; Ma, H.; Pan, H. Estimating Irreducible Water Saturation and Permeability of Sandstones from Nuclear Magnetic Resonance Measurements by Fractal Analysis. Mar. Pet. Geol. 2019, 110, 565–574. [Google Scholar] [CrossRef]
  41. Zhang, P.; Lu, S.; Li, J.; Xue, H.; Li, W.; Zhang, P. Characterization of Shale Pore System: A Case Study of Paleogene Xin’gouzui Formation in the Jianghan Basin, China. Mar. Pet. Geol. 2017, 79, 321–334. [Google Scholar] [CrossRef]
  42. Zhang, P.; Lu, S.; Li, J.; Chang, X.; Zhang, J.; Pang, Y.; Lin, Z.; Chen, G.; Yin, Y.; Liu, Y. Quantitative Characterization of Shale Pore Connectivity and Controlling Factors Using Spontaneous Imbibition Combined with Nuclear Magnetic Resonance T2 and T1-T2. Pet. Sci. 2023, 20, 1947–1960. [Google Scholar] [CrossRef]
Figure 2. Multi-exponential decay principle in CPMG sequence test.
Fractalfract 08 00437 g002
Figure 3. T2 distribution of (a) total pores, (b) CBF pores and CAF pores, and (c) CBF pores.
Fractalfract 08 00437 g003
Figure 4. (a) Pore division by pore connectivity, (b) porosity variation based on pore connectivity, and (c) variation of T2c with impacts.
Fractalfract 08 00437 g004
Figure 5. Boolean difference operation of PSD after impact disturbance and unperturbed state.
Fractalfract 08 00437 g005
Figure 6. Porosity evolution of pores in different size ranges for (a) I–micropores; (b) II–micropores; (c) mesopores; (d) macropores.
Fractalfract 08 00437 g006
Figure 7. MRI and gray value distribution of red sandstone under impact: (ag) show 0 to 6 impacts; (h) shows gray value variation before and after impact.
Fractalfract 08 00437 g007
Figure 8. Principles of fractal dimension calculation based on: (a) F–ps method; (b) F–T2c method.
Fractalfract 08 00437 g008
Figure 9. The fractal dimension D changes with impact times: (a) F–ps method; (b) F–T2c method.
Fractalfract 08 00437 g009
Figure 10. Correlation analysis between porosity and fractal dimension based on F–ps method for (a) total pores; (b) micropores; (c) mesopores; (d) macropores.
Fractalfract 08 00437 g010aFractalfract 08 00437 g010b
Figure 11. Correlation analysis between porosity and fractal dimension based on F–T2c method for (a) CBF pores; (b) CAF pores; (c) MF pores.
Fractalfract 08 00437 g011
Figure 12. Correlation between ΦI and DI based on (a) F–ps method; (b) F–T2c method.
Fractalfract 08 00437 g012
Table 1. The fractal dimension calculation based on F–ps method.
Total PoresMicroporesMesoporesMacropores
Number of ImpactsD
(rmin < r < rmax)
Standard DeviationDs1
(rmin < r < 0.1 μm)
Standard DeviationDs2
(0.1 μm < r < 1 μm)
Standard DeviationDs3
(1 μm < r < rmax)
Standard Deviation
02.642 0.039 1.775 0.158 2.825 0.022 2.979 0.018
12.638 0.071 1.815 0.123 2.802 0.042 2.978 0.013
22.612 0.099 1.769 0.134 2.795 0.028 2.976 0.014
32.607 0.079 1.783 0.132 2.805 0.040 2.975 0.018
42.596 0.031 1.811 0.090 2.782 0.047 2.968 0.011
52.561 0.017 1.778 0.078 2.710 0.045 2.963 0.028
62.516 0.121 1.770 0.143 2.666 0.044 2.944 0.017
Note: rmin and rmax are the minimum and maximum pore sizes.
Table 2. The fractal dimension calculation based on F–T2c method.
CBF PoresCAF PoresMF Pores
Number of ImpactsDcb
(rmin < r < rc1)
Standard DeviationDca
(rc1 < r < rc2)
Standard DeviationDm
(rc1 < r < rmax)
Standard Deviation
00.570 0.020 2.603 0.010 2.881 0.002
10.569 0.040 2.583 0.014 2.878 0.001
20.400 0.064 2.527 0.026 2.874 0.005
30.540 0.058 2.476 0.013 2.863 0.001
40.365 0.033 2.404 0.013 2.856 0.001
50.460 0.102 2.354 0.042 2.847 0.003
60.364 0.047 2.306 0.067 2.836 0.007
Note: rc2 is the pore size which corresponds to T2C2, and rc1 is the pore size which corresponds to T2C1.
Table 3. Correlation fit between fractal dimension and number of impacts.
Fitting EquationR2p
F–ps methodD = 2.632–8.4 × 10⁻⁴ × x2.7610.9810.002
Ds1 = 1.797–0.002 × x0.1630.625 > 0.05
Ds2 = 2.803–2.3 × 10⁻⁴ × x3.5960.9550.0003
Ds3 = 2.978–8.6 × 10⁻⁵ × x3.3180.9900.007
F–T2c methodDcb = 0.571–0.040 × x0.8060.010
Dca = 2.614–0.049 × x0.9780.007
Dm = 2.885–0.007 × x0.9880.004
Disclaimer/Publisher’s Note: The statements, opinions and data contained in all publications are solely those of the individual author(s) and contributor(s) and not of MDPI and/or the editor(s). MDPI and/or the editor(s) disclaim responsibility for any injury to people or property resulting from any ideas, methods, instructions or products referred to in the content.

