Abstract
Cement-based composites’, as the most widely used building material, macroscopic performance significantly influences the safety of engineering structures. Meanwhile, the macroscopic properties of cement-based composites are tightly related to their microscopic structure. The complexity of cement-based composites’ microscopic structure is challenging to describe geometrically, so fractal theory is extensively applied to quantify the microscopic structure of cement-based composites. However, existing studies have not clearly defined the quantification methods for various microscopic structures in CCs, nor have they provided a comprehensive evaluation of the correlation between the fractal dimensions of different microscopic structures and macroscopic performance. So, this study categorizes the commonly used testing methods in fractal theory into three categories: particle distribution (laser granulometry, etc.), pore structure (mercury intrusion porosity, etc.), and fracture (computed tomography, etc.). It systematically establishes a detailed process for the application of testing methods, the processing of test results, model building, and fractal dimension calculation. The applicability of different fractal dimension calculation models and the range of the same fractal dimension established by different models are compared and discussed, and the advantages and disadvantages of different models are analyzed. Finally, the research delves into an in-depth analysis of the relationship between the fractal dimension of cement-based composites’ microscopic structure and its macroscopic properties, such as compressive strength, corrosion resistance, impermeability, and high-temperature resistance. The principle that affects the positive and negative correlation between fractal dimension and macroscopic performance is discussed and revealed in this study. The comprehensive review in this paper provides scholars with methods and models for quantitative research on the microscopic structural parameters of cement-based composites and offers a pathway for the non-destructive assessment of the macroscopic performance of cement-based composites.
1. Introduction
Cement-based composites (CCs) are the most widely used building materials nowadays, which play an indispensable role in engineering constructions such as roads, bridges, tunnels, and hydraulic projects [1]. The application of CCs largely depends on their macroscopic properties, including mechanical properties [2,3], impermeability [4,5], frost resistance [6,7,8], corrosion resistance [9,10,11], and high-temperature resistance [12,13,14]. These macroscopic properties are often closely related to the microscopic structure. Therefore, the relationship between the microscopic structure and macroscopic properties of CCs has attracted great attention in the fields of engineering and science [15,16].
From a microscopic perspective, CCs can be considered as a multiphase composite material system [17,18], divided into three main regions: aggregate, paste, and interface [19]. Different aggregates and mix proportions often result in significant variations in the physical and mechanical properties of CCs. Meanwhile, porous interfaces between the matrix and aggregates lead to the complex microscopic pore structure of CCs [20]. The complexity of this microscopic structure manifests as uncertainty, irregularity, and nonlinear characteristics in its macroscopic performance. Despite significant efforts by researchers to advance experimental techniques and models exploring the microscopic structure and macroscopic performance of CCs, establishing a widely accepted and representative quantitative model for microstructural parameters remains a significant challenge.
Since Mandelbrot first proposed and fundamentally established the concept of fractal in 1977 [21], fractal theory has attracted widespread attention. The theory focuses on the irregularity, random phenomena, and behaviors in the natural world, characterizing the complexity of specific-sized structures. Recently, fractal theory has found increasingly broad applications in the studies of CCs [22,23]. Based on the fractal characteristics exhibited by the pore structure and components of CCs [24], many researchers have applied fractal theory and fractal models to quantify the microstructure of CCs. For example, Wang et al. [25] used fractal theory to analyze the improvements of fly ash, PVA fibers, magnesium oxide, and anti-shrinkage agents on the pore structure of CCs. Mohammed [26] used a particle size distribution fractal model to assess the porosity of concrete particle mixtures. Meanwhile, fractal theory effectively links the microstructure of CCs with its macroscopic properties. Wang [5] discussed the impermeability of fabric concrete and established an impermeability prediction method based on a fractal model using fractal theory. Abdeldjalil et al. [27], through a particle distribution fractal model, evaluated and predicted the mechanical strength of CCs. Therefore, as a new and effective method, fractal theory has greatly promoted the development of CC research.
In the application of fractal theory, techniques such as small-angle X-ray scattering (SAXS) or neutron scattering (SANS) [28,29,30] are commonly used to measure the particle structure of cement slurry at the nanoscale. Methods such as nitrogen adsorption–desorption (NAD) [31,32] and mercury intrusion porosimetry (MIP) [33,34] are employed to determine the micro-pore structure of CCs, and techniques such as scanning electron microscopy (SEM) [35,36] and computer simulation [37] are used to measure the development of surface and internal cracks in CCs. Based on the microscopic structure of CCs obtained from these tests, numerous scholars have utilized fractal theory to study the macroscopic performance of CCs, deriving valuable conclusions. For instance, Zheng [38] and Lu [39] used fractal dimensions and to assess the compressive strength of CCs, finding a negative correlation between fractal dimensions and compressive strength. However, in the study by Jin et al. [40], fractal dimensions were positively correlated with compressive strength. These discrepancies may be related to the differences in the microscopic structure characterized by fractal dimensions [39].
Fractal theory has been widely applied to characterize the different microstructures of CCs, and some reviews have discussed the fractal dimension used to characterize microstructures and their application in evaluating macroscopic performance. However, there are still some shortcomings in the existing reviews as follows: (1) The classification of fractal dimensions corresponding to the field of cement-based materials in the existing reviews is relatively chaotic, lacking a clear and logical overall review. (2) The existing review has not yet systematically established a complete process for establishing fractal dimensions. (3) There is no comparative analysis of different models with the same fractal dimension in the existing reviews. (4) The existing reviews have not comprehensively evaluated the correlation between the fractal dimension of different microstructures and macroscopic performance, and there is a lack of disclosure of its correlation principle. (5) There is currently no comprehensive discussion on the application of the fractal dimension in evaluating the high-temperature resistance of cement-based composite materials.
2. Fractals and Test Methods Commonly Used in Fractal Field
To address these issues, this article reviews the recent applications of fractal theory in the research field of cement-based materials. Firstly, this review categorizes the commonly used testing methods in fractal theory into three categories—particle distribution (laser granulometry, etc.), pore structure (mercury intrusion porosity, etc.), and fracture (computed tomography, etc.)—and systematically establishes a detailed process for the application of testing methods, the processing of test results, model building, and fractal dimension calculation. This article adds details overlooked in previous discussions regarding the establishment of testing methods. Secondly, this article provides a detailed discussion of the advantages, disadvantages, and application scenarios of different models with the same fractal dimension, providing a clearer selection approach. Finally, the article reviews and discusses the application of the fractal dimensions of microscopic structures in the evaluation of macroscopic properties such as compressive strength, impermeability, freeze–thaw resistance, corrosion resistance, and high-temperature resistance in CCs. The principle that affects the positive and negative correlation between the fractal dimension and macroscopic performance is discussed and revealed, and the gap of the fractal dimension in evaluating high-temperature resistance performance is filled.
2.1. Concept of Fractals
Fractal geometry is a universal framework for studying irregular sets [41]. Fractal theory focuses on nonlinear processes in nature and reveals the unity of order and disorder, as well as the unity of determinism and randomness in nonlinear systems [42,43]. Irregular phenomena are common in nature, but they lack a universally agreed-upon definition for the fractal characteristics of objects in nature [44]. In general, objects that meet the following characteristics are considered fractal [45]: First, it has no feature length. Then, it demonstrates both global and local irregularity, along with intricate structures that cannot be accurately described using classical geometric terms. Lastly, it often has an iterative nature.
Take the classic Koch curve as an example, as shown in Figure 1. The process begins with a line termed the “initial segment,” which is then divided into three equal parts, and uses an equilateral triangle lacking one side to replace the middle part. This process is repeated to construct the self-similarity of the graph. Self-similarity implies that a replica can be composed of smaller replicas, each diminishing in scale with each iteration. Despite continual iteration, such evolving sets exhibit significant overall invariance, and this invariance is infinite (it means the measurement scale can tend to be infinitely small or infinitely large). The similarity dimension () of the Koch curve is determined by the following equation [42]:
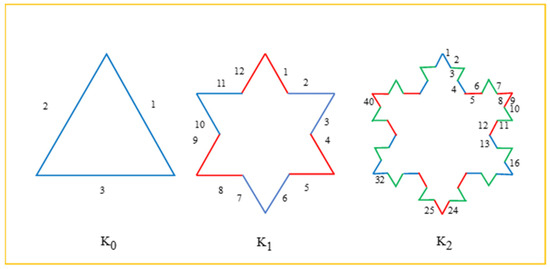
Figure 1.
Koch curve iteration process.
Fractal dimension is a parameter used to quantitatively characterize fractal features, which can accurately characterize the complexity of fractal objects [46]. There are multiple definitions of common fractal dimensions, but the most representative one is the Hausdorff dimension [44,47,48]. A curve can be described as Equation (2) when it represents fractal characteristics:
where L is the curve length, is the length measuring scale, and is the measurement number of .
where d is the Hausdoff dimension; it is the dimension of the curve.
2.2. Test Methods Commonly Used in Fractal Field
In the application of fractal theory, techniques including Morphologi G3, SAXS, and SANS are commonly used to measure the particle structure of cement slurry. Methods such as the nitrogen low-temperature adsorption–desorption (NAD) method, MIP, and LT-DSC are employed to measure the micro-pore structure of CCs, and techniques such as scanning electron microscopy (SEM) and computer simulation are used to measure the development of internal cracks in CCs.
2.2.1. Test Methods of Particle Distribution
- (1)
- Morphologi G3
Morphologi G3 acquires a high degree of dexterity and enables precise focusing on particles, capturing the images of each particle in the sample surface under the optical system of a scanning microscope [49]. Its principle involves capturing each particle’s images, simultaneously converting three-dimensional images of cement particle images into two-dimensional planar projections. Morphologi G3 can observe the morphological characteristics of particles in cement suspension samples, leading to the construction of a fractal model characterizing particle distribution.
- (2)
- Laser Granulometry
Laser granulometry is a type of optical instrument that measures particle size distribution based on the principle of static light scattering, with a measurement range ranging from submicrometers to millimeters. It can achieve good measurement accuracy for both monodisperse and particle group samples. As shown in Figure 2, the testing process of the laser granulometry proceeds as follows: The laser emits a beam of light, which is then transformed into a parallel beam of plane waves through the optical path. This beam subsequently illuminates the tested particles and scatters. Subsequently, the scattered light is directed toward discrete optical information receivers and photoelectric converters arranged in different directions. The photoelectric converter transmits the diffraction and scattering conversion information to the microcomputer for processing, which can obtain the distribution information of particles [50,51] The particle size distribution directly measured by the laser granulometry actually characterizes the volume content of the sample. Assuming particles of different sizes have the same particle density, they can be converted into mass content [52].
It is worth noting that parameters such as light shielding rate and ultrasonic dispersion time may have an impact on the experimental results in the laser granulometry testing [52]. For example, under the influence of shading rate with all other conditions the same, the larger the specific surface area under the same particle size conditions, the greater the error in particle size distribution width. Therefore, when measuring the particle size of powder, it is necessary to control the parameter settings, grasp particle shapes, and the degree of change in particle-specific surface area, to determine the magnitude of error in the particle size distribution width [53].
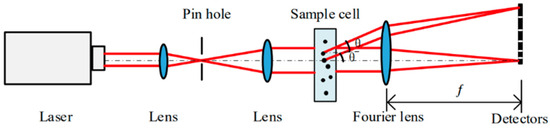
Figure 2.
Schematic diagram of classical optical structure [54].
2.2.2. Test Methods of Pore Structure
- (1)
- Mercury intrusion porosimetry (MIP)
MIP is usually used to measure the pore structure of CCs. It can measure porous structure and determine a curve that can precisely present the pore size distribution, demonstrating strong practicality and ease of operation [55]. Based on the fact that liquid mercury has high surface tension and non-wetting characteristics, the principle of MIP lies in the property that mercury only enters the pores when pressure is applied [56]. The operation process of MIP involves first evacuating gas from the pores, followed by controlling the volume of mercury entering the pores by applying pressure to the porous medium. Mercury first enters the large pores under pressure, and as the pressure increases, smaller pores are successively occupied [57]. Higher pressure corresponds to smaller pore sizes [58], allowing the determination of distribution curves for different pore sizes. In existing experimental studies, not only liquid mercury but also other non-wetting liquids (liquids with contact angles greater than 90°) have been used [59].
Although the measurement range of MIP covers the distribution of pore sizes from nanometers to micrometers, MIP still has some limitations. Sometimes MIP may identify large ink-bottle-shaped pores as small ones mistakenly, a deviation known as the “ink bottle” effect [59]. In addition, using MIP requires the sample to be dried, which may lead to changes in the pore structure. Assuming energy keeps balanced when non-wetting fluids invade the pores, the following equation [57] is obtained:
where is the pressure differential, is volume, is the surface free energy, is the surface area, 1 represents a liquid, represents a solid, represents vapor, and θ is the contact angle between mercury and the pore surface.
Assuming a circular cross-section (with cylindrical pores), the above equation is simplified to the Washburn equation, and then the pore size is expressed as Equation (5):
where is the equivalent aperture, nm, is the initial applied pressure, MPa, and θ is the contact angle between mercury and the pore surface.
- (2)
- Nitrogen adsorption–desorption (NAD) method
The nitrogen adsorption–desorption (NAD) method is usually applied to characterize the pore structure of materials, typically applied in the research of CCs, rock, and similar materials [60]. The principle of NAD is that nitrogen can only penetrate low-density gel pores, so nitrogen molecules adsorbed in pores can be directly equivalent to the actual volume of pores [61].
The specific process of the NAD method is as follows [31]: Firstly, the sample undergoes thorough pretreatment to ensure a clean surface. Subsequently, the sample is placed in a nitrogen adsorption apparatus, and vacuum treatment is applied to remove surface gases. Nitrogen gas is then injected at liquid nitrogen temperatures, and the sample’s pores adsorb nitrogen, forming a physical adsorption layer. By monitoring the change in nitrogen adsorption with pressure, an adsorption isotherm is obtained, reflecting the sample’s adsorption performance. After adsorption, nitrogen desorption is achieved by gradually reducing pressure or applying heat, with the desorption process recorded. Finally, the detailed information about pore structure is obtained by analyzing the data.
Building upon the principle that a critical pore radius exists under a specific pressure condition, wherein pores smaller than are full of adsorbate, while other pores will be covered by an adsorbate molecule monolayer.
When , then
where is adsorption capacity, and is the thickness of the adsorbed layer.
When , then
where is the lower limits, and is the upper limits.
The relationship between and is represented by the Kelvin equation [62]:
where is the balanced pore size, and is the relative pressure.
In summary, the NAD method provides detailed information about the pore structure by monitoring the adsorption and desorption processes of nitrogen gas on the sample surface. This information is crucial for studying the adsorption performance, pore distribution, and surface characteristics of materials.
- (3)
- Low-Temperature Differential Scanning Calorimetry (LT-DSC)
LT-DSC is used to measure the thermal properties of materials under controlled temperature variations, providing an indirect characterization of the physical or chemical features within the sample. When LT-DSC is applied to CCs, important information about hydrated cement slurry can be acquired [63,64,65] from melting/freeze–thaw cycles, such as the volume of mesopore/macropore and the desorption threshold of capillary pores. Due to the continuous distribution of pore size in CCs within a certain range, water melting gradually occurs from the smallest cavity to the largest cavity, which means that the results of heating scanning indirectly reflect the distribution of pore size [66].
After completing the measurement, the data selection process involves segmenting the dataset based on several criteria [52]. This includes ensuring the continuity of each data segment, choosing data points where the temperature is below 0, incorporating points where the heat flux is less than 0 during melting and greater than 0 during freezing, and restricting the aperture range from 2 nm to 200 nm. Ishikiriyama et al. [67] obtained the modified Gibbs–Thompson equation using pure water
where is approximately 273.15 K, is the melting temperature of a crystal inside a pore with a radius, and is selected according to materials.
The is represented as [68]
where is the incremental pore volume, is the time difference of two adjacent temperatures, is the average power, is the molar heat of ice–water transition, and is a function of the density of water at different temperatures.
The maximum pore volume is obtained by adding all :
where the subscript 1 refers to all the data at temperature 1, the subscript 2 refers to all the data at temperature 2, is the mass of the studied material, and is the heat power.
2.2.3. Test Methods of Fracture
- (1)
- Scanning electron microscope (SEM)
The 3D scanning electron microscope (3D-SEM) is a powerful tool specifically designed for measuring the microscopic and nanoscale morphology of sample surfaces [69]. This device provides crucial data with high resolution on surface morphology, supporting research in fields such as material science. By capturing high-resolution three-dimensional images of the sample surface, the 3D-SEM reveals detailed structures at the micro- and nanoscale, offering valuable insights for surface roughness, particle distribution, and other characterization purposes.
- (2)
- Computed Tomography (CT)
Computed tomography (CT) is an image analysis technology. The technology usually creates high-resolution cross-sectional images with the help of X-rays and computer processing. CT technology finds broader applications in crack analysis [70], damage evolution [71], microscopic structure characterization [72], and performance assessment. In comparison to other microscopic testing techniques, CT enables the non-destructive evaluation of the three-dimensional microstructure of cementitious materials [73]. Usually, it is necessary to binarize the crack image in RGB mode and then import the binarized data into MATLAB to calculate the fractal dimension [74].
- (3)
- Projected fringe technique
The projected fringe technique is an optical measurement method commonly used for three-dimensional shape measurement and the surface contour analysis of fractured concrete surfaces. In Figure 3a, an example illustrates the sampling of projected fringes by a sensor array with limited image pixels. This technique involves projecting systematic fringes or a grid pattern onto the target surface using a light source, as depicted in Figure 3b. By capturing the resulting pattern on the target surface and analyzing the phase changes within it, the three-dimensional shape of the target object can be deduced, as shown in Figure 3c. The deformation of the grid on the target surface provides elevation information. After the camera records the fringe pattern, precise three-dimensional coordinates of the target surface can be reconstructed through phase analysis and triangulation [75,76,77].
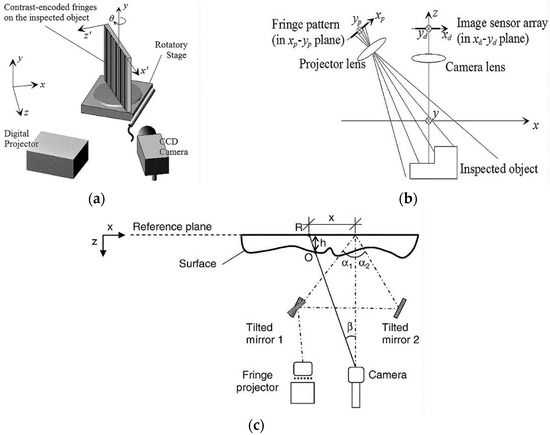
Figure 3.
(a) An example illustrates the sampling process of projected fringes, (b) the optical configuration of the technique, and (c) the principle of the technique [75,76].
- (4)
- Confocal microscope technique
The confocal microscope is a high-resolution microscope used for studying the surface morphology and microstructure of materials [24,75]. Its principle is based on a laser light source focusing at a specific depth on the sample, where only the light overlapping with the focal plane is captured by the detector, eliminating depth information and achieving clear three-dimensional images [78].
As shown in Figure 4, the operational process of a confocal microscope involves the following steps: Initially, a laser light beam is generated by a laser light source. This beam is focused onto a specific location on the sample through a pinhole, forming a small focal spot. Subsequently, light from different depths in the sample is excited and passes through specific points in the sample. Only the light coinciding with the focal plane can enter the detector through the pinhole. By moving the sample or altering the depth of the laser focus, high-resolution images can be obtained in three-dimensional space.
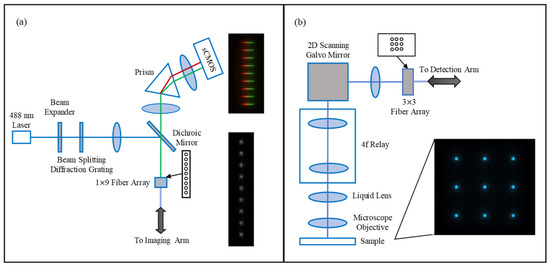
Figure 4.
(a) Experimental layout for the technique. (b) Imaging arm [79].
3. Investigation of the Fractal Models of Cement-Based Composites
At present, many fractal models and the fractal dimensions determined from them have been applied to the field of CCs, such as various fractal dimensions related to particle distribution, pore structure, and fracture development. This study mainly discusses six fractal dimensions related to CCs from the perspectives of particle distribution, fractures, and pore structure, namely the fractal dimension of particle distribution (), fractal dimension of pore surface (), fractal dimension of pore volume (), fractal dimension of pore tortuosity (), fractal dimension of crack (), and fractal dimension of fracture surface (). Table 1 shows the commonly used fractal dimensions in CCs. It is worth noting that none of the six fractal dimensions mentioned here are suitable for nanoscale pore analysis, and there is currently no research on fractal models of nanoscale pores.

Table 1.
Summary of six fractal dimensions used in cement-based composites.
3.1. Fractal Dimension of Particle Distribution ()
The particle size distribution is an important characteristic for evaluating the properties of CCs, and it always determines the mechanical properties of CCs. Particles are irregular three-dimensional objects that cannot be precisely represented by simple parameters, such as surface area or volume. However, they have fractal characteristics, so fractal geometry is used to describe the characteristics of particles [80].
is commonly used to evaluate the grading and fineness of powders in CCs, thereby reflecting the distribution of powder or particles in freshly mixed cement slurry [49,91]. In addition, can evaluate the influence of adding superplasticizer, but it cannot recognize the changes affected by molecular structure [92]. The calculation of the fractal dimension depends on the experimental test results of particles and the corresponding fractal calculation model.
The commonly used measurement methods for particle size distribution characteristics include optical microscopy [24], laser granulometry [91], Morphologi G3 [80], etc., which can usually accurately measure the distribution of particle size form 20 nm to 2000 μm. Based on experimental measurement information, the commonly used calculation models are as follows.
- by combining Image Analysis System with Zhang’ Model
Fresh cement slurry, as a typical suspension system, often experiences particle aggregation and dispersion. Zhang et al. [80] used Morphologi G3 to observe the characteristics of particles in cement slurry samples and constructed a fractal dimension model that can characterize particle distribution. The entire measurement process has a short duration, so the impact of time on the cement hydration effect is negligible. Finally, based on the analysis of hundreds of thousands of cement particle samples, an expression equation for the fractal dimension was constructed. The following equation is derived from the statistical analysis theory of the particle image’s two-dimensional projection grid simplification, which can provide necessary information on particle size distribution.
where is the edge length of the mesh on the particle image, is the total number of grids with edges of . The larger the value determined using this equation, the higher the degree of dispersion of cement particles.
- by combining laser granulometry with Yu’s Model
Laser granulometry can be used to determine the pore characteristics of different cement particles [91]. Based on the measurement results, Yu [81] and Chu et al. [49] proposed the following equation to calculate the fractal dimension . The particle size distribution of CCs always satisfies
where , is the total number of particles smaller than size , is the total number of system particles, and is the fractal dimension of particle distribution.
Then,
where is the number of particles with scales between :
By deriving the above equation, we can obtain
At this point, there exists a straight-line segment , and linear regression analysis is performed on this straight-line segment. The slope of the regression line is ; then,
- Comparative analysis of models
Table 2 presents the commonly used calculation models. Among them, Yu’s model [81] is only suitable for calculating when the particle size distribution is known to be fractal, but it cannot verify whether the distribution is fractal by calculating the fractal dimension. The Gaudin–Schumann distribution and Rosin–Rammler distribution are both fractal distributions, and Yu’s model is derived based on the Gaudin–Schumann distribution. To conform to two distributions, the particle size must be obtained from the same material under the same grinding mechanism or within a certain particle size range. It can be seen that the usage conditions of Yu’s model are quite strict. And Zhang’ model [80] is derived based on the theory of mesh simplification on two-dimensional images. Although the applicable conditions are simple, the simplification and calculation processes are complex.
Table 2.
Comparison of different models of .
3.2. Fractal Dimension of Pore Structure
The pore structure parameters of CCs include pore surface, pore volume, pore tortuosity, etc. The pore surface reflects the surface roughness and affects its adsorption capacity and chemical reaction activity. The pore volume directly affects the density and mechanical properties of CCs. The tortuosity determines the permeability and stress transfer path of the material. Therefore, studying the pore structure parameters is helpful to better understand the key properties of CCs, such as permeability, compressive strength, and durability, and to optimize material design and preparation processes, improving material performance and reliability. This section summarizes existing fractal dimension calculation models based on three aspects: pore surface, pore volume, and pore tortuosity.
3.2.1. Fractal Dimension of Pore Surface ()
So far, many researchers have published results on . Although different researchers have adopted different measurement and calculation methods, these fractal dimensions have the same physical meaning; that is, fractal dimensions can reflect the roughness and irregularity of pore surfaces [82]. In general, fractal dimensions can be calculated by combining appropriate fractal models with pore surface parameters measured by adsorption methods, mercury porosity methods, SANS, and other equipment [83,93]. The fractal dimension was first proposed by Pfeifer and Avnir [94], who used surface size to describe potential surface irregularities. The existing commonly used calculation models are described below.
- by combining MIP with Neimark’s Model or Zhang’s Model
The results of MIP are often combined with thermodynamic fractal models to calculate . In the process of MIP, the work applied to mercury is the same as the increase in the surface energy of mercury [12].
In Neimark’s model [82], it is assumed that under capillary balanced conditions, the interface between fluids is of equal curvature; then,
where is the pressure difference or overpressure, and is the surface tension. Here, is the yardstick of fractal surfaces. The configuration and location of the interface can be changed through .
From a thermodynamic perspective, there is a balance between the extended work on the surface of mercury and the intrusion work of non-wetting fluids. Therefore, the relationship between the pressure applied to mercury and the intrusion volume of mercury is shown as Equation (19) [12]:
where is the contact angle between mercury and the sample, and is the pore surface area.
After integration, is obtained [24]:
When the internal pore surface satisfies Equation (21), it can exhibit fractal characteristics:
where is the pore radius.
Then, we can obtain the scaling relationship between and :
The model of Zhang and Li [12,93] is another commonly used thermodynamic analysis model based on mercury intrusion processes. They calculated the using mercury intrusion data and obtained a scaling relationship equation, which was modified as follows:
where is a constant, so is obtained as follows:
where the subscript indicates that this is the nth mercury injection process, is the cumulative surface energy from the first to the nth mercury injection, is the pore volume, is the pore radius, and is the fractal dimension of the pore surface.
- by combining NAD with FHH Isotherm Equation
The NAD method can obtain an isothermal adsorption–desorption curve. The FHH equation [60,83,95] is an isotherm equation. It is a logarithmic function that replaces equilibrium pressure with the surface coverage [83] based on the result of the NAD test:
where is the amount of adsorbed nitrogen at a given condition, is a constant, which is the intercept of the straight line shown in Equation (26), and is the adsorption potential:
where represents the saturated vapor pressure.
When van der Waals attraction forces dominate (i.e., the surface tension at the interface between liquid and gas can be ignored), the adsorption mode is generated by the van der Waals forces. Pfeifer et al. [94] found that
However, as the coverage rate increases, the thickness of the surface mode also increases. This leads to a decrease in the interface area. Then,
- by combining NAD with Liang’s model
Based on the NAD method, Liang’s model [84,85] evaluates the surface area distribution of pores through the exponential law, and the expression for surface fractal dimension () is shown in Equation (29).
where is the total number of surface area greater than , and is the maximal area. is the minimal area, and it is also the lower limits of NAD.
Usually, the BJH (Barrett, Joyner, and Halenda) model can be applied for NAD. Assuming the shape of pores is cylindrical,
where is the surface area of a single pore channel, and is the upper limit of the NAD test domain, equal to 200 nm.
where is the increment of pore area which can be determined directly by the test.
- Comparative analysis of models
The models based on the MIP testing method include Neimark’s model and Zhang’s model. Neimark’s model requires consideration of dividing different pressure ranges in its application. In contrast, Zhang’s model can avoid this process and provide very good predictions for both smooth and rough surfaces, making it more widely applicable and practical. In practical applications, using these two models to process the same experimental data may yield different fractal dimension results. Additionally, reducing each pressure change during the mercury intrusion process can achieve higher calculation accuracy. Furthermore, it should be noted that external air pressure has a significant impact on the fractal properties and pore volume of pore surfaces. Especially when using MIP for testing, changes in air pressure may amplify the “ink bottle effect” [96].
The models based on the NAD testing method include the FHH isotherm equation and Liang’s model. From a thermodynamic perspective, the applicability of the FHH isotherm equation is comparable to that of Neimark’s model. The FHH isotherm equation is also a universal thermodynamic relationship used to describe the pore-filling adsorption process within the Kelvin equation range. For the FHH equation with a (D-3) index, these two methods are equivalent. On the other hand, Liang’s model is based on exponent laws and evaluates the porous media through an intuitive exponential relationship. This model requires clear minimum and maximum aperture information, making it demanding in terms of measurement accuracy. (See Table 3).
Table 3.
Comparison of different models of .
3.2.2. Fractal Dimension of Pore Volume ()
At present, there are various models used to determine the volume fractal dimension . It is generally believed that different have the same physical meaning, which describes the pore volume distribution and spatial structure complexity in porous materials [97]. Due to the close correlation between and pore volume, all techniques that are used for measuring pore volume can be combined with various models to determine . These methods generally use extremely small wavelengths as the scale for measuring or detecting the fine details of pores, and smaller wavelengths can effectively obtain the detailed information of pores. Commonly used pore volume measurement techniques include NAD, MIP, low-temperature differential scanning calorimetry (LT-DSC), etc. [86].
- by combining MIP with the Menger Sponge Model or Space-Filling Model
At present, MIP testing techniques are combined with the Menger sponge model [97,98] or the spatial-filling model [86] to calculate . The construction steps and principles of these two models are similar, but there are some differences in the subsequent calculations combined with MIP measurement results.
The Menger sponge model was first used by Pfeifer and Avnir [94] in 1983 to calculate surface size and describe the irregularities of potential surfaces. In recent years, Li [97] and Zarnaghi [98] have also simulated the pore structure of CCs and obtained . As shown in Figure 5, the calculation steps are as follows: first, the pores are divided into cubes with side lengths of , and then, each cube is divided into small ones that have equal volume (), totaling . Randomly, small cubes of the number are removed, then . The above steps are repeated times, in this case, and . Therefore, the structural volume is displayed as .
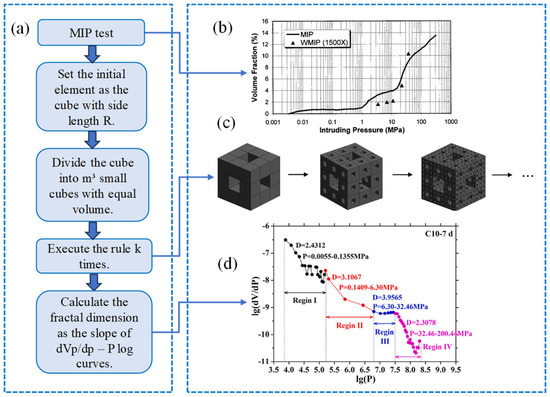
Figure 5.
(a) Flow chart of determining by Menger sponge model, (b) volume fraction by image analysis and MIP, (c) Menger sponge, and (d) fractal regions of C10 concrete [87].
When , then
Combined with the MIP test results, it can be concluded that
At this point, is a logarithmic curve, and its slope is the fractal dimension . The value of is related to the MIP testing results.
The typical range of is 2–3, and it is believed that the value of becomes larger when the pore structure gets more complex.
Additionally, Ji et al. [86] developed a space-filling model based on a planar-fractal model. This process is consistent with the Menger sponge model. At this point, the can be calculated as follows:
where is the number of small cubes occupied by hydration products, is the total number of small cubes, and is the total number of blank cubes (similar to pores). The equation shows that the higher the spatial filling capacity of cement hydrates, the higher the value of , and the lower the value of .
- by combining NAD with Liang’s model
Based on the NAD technique, the maximal volume can be obtained; then, the expression for the fractal dimension () established by Tang [84] and Liang et al. [85] is shown as
where is the total number of volume greater than , and is maximal volume. is minimal volume, and it is the lower limits of NAD.
Usually, the BJH (Barrett, Joyner, and Halenda) model can be applied for NAD. Assuming the shape of pores is cylindrical,
where is the surface area of a single pore channel, and is the upper limit of the NAD test domain, equal to 200 nm.
where is the increment of pore area which can be determined directly by the test.
- by combining LT-DSC with Liang’s model
After conducting the LT-DSC test, it is necessary to select a suitable dataset based on the standards. Then, the modified Gibbs–Thompson equation is presented as [1,5]
where R is the pore radius, is 273.15 K, and is chosen according to materials.
The maximal pore volume () can be obtained as Equation (11). The modified expression for the fractal dimension () established by Tang [84] and Liang et al. [85] is shown as Equation (35). Then, combined with the measurement results of LT-DSC, the fractal dimension can be calculated.
- Comparative analysis of models
Table 4 shows the information of different models of . A substantial body of research indicates that the values calculated based on different models and testing methods do not fall within a unified range. Specifically, the typical range of calculated using MIP technology and the Menger sponge model lies between 2.0 and 3.0 [97,98]. Conversely, values determined using MIP technology and the spatial filling model typically range from 0 to 3. The typical range of calculated using the NAD method and Liang’s model falls between 0 and 2 [86]. values computed using LT-DSC technology and models typically range from 1 to 5 [85]. The disparities in these results may be attributed to observation scales and testing methods. Factors such as image resolution, thresholds, and magnification significantly influence the fractal analysis process and results of porous structures, leading to variations in . Additionally, researchers employing different testing methods may introduce varying degrees of systematic error. For instance, mercury pressure may disrupt the CC, resulting in significant systematic errors in MIP testing.
Table 4.
Comparison of different models of .
Among the aforementioned calculation models, while the spatial filling model is typically applied to hardened cement pastes, other models have broader applications and can be used for porous bodies. In the spatial filling model, only the solid phase and gas phase (pores) are considered due to the removal of the liquid phase under high-vacuum conditions during MIP experiments.
3.2.3. Fractal Dimension of Pore Tortuosity ()
can effectively describe the degree of curvature of porous materials. Yu et al. [88] suggest that the diameter (D) and length scales of capillaries (S) can be equivalent, so the relationship between D and S is analogous to the relationship of flow between fractal scales and tortuosity in heterogeneous media, which is shown as Equation (39):
where is the diameter of the capillary tube, is the actual bending length, and is the length of a straight line along a gradient. For straight capillaries, , while for cases with more internally curved capillaries, is much greater than . If the range of is between 1 and 2, then can represent the degree of curvature of the capillary path.
- by combining Image Analysis techniques with the Box-counting Method
Image analysis techniques are commonly used for fractal analysis of the pore structure. Tang et al. [84] proposed that can be determined by the box-counting method based on the test result of image analysis techniques. The specific steps of this method are as follows:
Firstly, select samples and observe them with an optical microscope (or image analysis techniques). The black areas in the observation image are pores formed by particle aggregation, while the white areas are clusters formed by aggregation. Then, record the total number () and aperture () of large pores and use small boxes with the side length to cover the pore areas; then, calculate the total number of boxes (). Finally, perform a linear regression analysis of and , where is the slope of the straight line ().
- by combining Computer simulation with Yu’s model
Yu et al. [89] proposed a new computer simulation method to predict the evolution of the microstructure and transport properties of cement slurry. The method adopted a two-step strategy to simulate the microstructure of cement slurry, as shown in Figure 6.
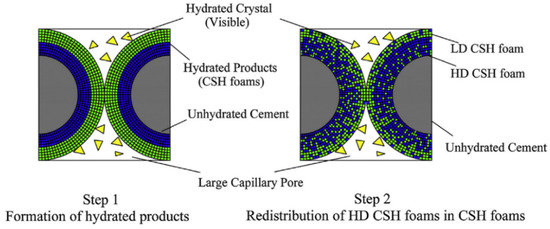
Figure 6.
Two-step modeling strategy for the microstructure of cement paste [89].
Then, by simulating the microstructure, the fractal dimension was calculated. The specific flow chart is as follows Figure 7:
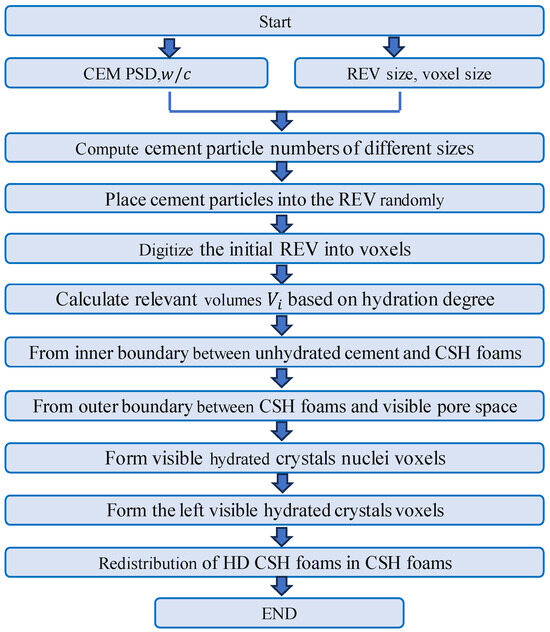
Figure 7.
Flow chart of simulation algorithm for microstructure of cement paste [89].
The fractal relationship between and is
where is the tortuosity of the pores, is the fractal dimension of pore tortuosity, is the tortuous length (actual length), and is the side length of the cube representative elemental volume (REV).
Moreover, can be calculated as [84,88]
where is the average pore tortuosity, and is the average pore diameter.
Usually, and are predicted by the double-layer model:
where is the average diameter of cement particles, and is the porosity of cement paste. and can be measured by a test or computer simulation.
- Comparative analysis of models
The characteristics of porous media were generally detected through experimental testing, such as SAXS, SEM, and computed tomography (CT) scans. The preparation process of these traditional test methods is always complex and cumbersome. However, the computer simulation method better reflects the overall pore structure characteristics and solves the shortcomings of previous computer simulation methods. Yu [89] compared the microstructure of cement slurry by computer simulation with that by MIP and BSE image testing and found that the simulation results were more accurate, effectively avoiding the influence of the “ink bottle” effect.
Traditional observation methods may be limited by accuracy and scale, but computer simulation methods are suitable for pores of any size. Computer simulation can well reflect the microstructure of the hydration process, but it focuses on specific perspectives, so Yu’s model is not suitable for studying the overall pore structure characteristics. (See Table 5).
Table 5.
Comparison of different models of .
3.3. Fractal Dimension of Fracture
The occurrence of cracks on the interior and surface of CCs is always common and complex, constituting the most common type of damage [22]. The fracture behavior not only reflects the state of CCs but also reflects the stability of the structure [99]. Therefore, it is crucial to study the geometric parameters that can reflect the fracture behavior of CCs. The two commonly used fractal dimensions related to fracture are and .
3.3.1. Fractal Dimension of Crack ()
The actual cracks observed in CCs are highly intricate and often characterized by randomness and irregularity. Their development process typically exhibits nonlinear characteristics, with variations in length, width, curvature, and density [22]. The complexity of external conditions and the nonlinearity of the CC itself pose challenges for characterization using traditional geometric methods [100]. Fractal dimension, a concept frequently employed in fractal theory, provides a means to quantify the space-occupying effectiveness of crack shapes and paths. This property of fractal theory renders it well suited for analyzing surface cracks.
The widely used crack fractal dimension effectively captures the distribution of concrete cracks. Moreover, numerous researchers have adopted various methods to calculate the fractal dimension of fracture, including laser granulometry [101], plastic sheet tracing and drawing technology [99], surface profilometry [102], crack mapping [103], optical scanners (or digital cameras) [104,105], and the X-ray computed tomography (CT) technique [106,107]. Recently, applying to describe cracks in CCs has become a research hotspot [108].
- by combining X-ray CT scanning test with Box-Counting model
After obtaining the crack information through the CT technique, the box-counting method, implemented by MATLAB, can determine . In the study conducted by Shang et al. [22], cracks in CCs were sequentially extracted and reconstructed using fractal calculation methods. The original CT images were transformed into cracks with distinct grayscale values against crack-free backgrounds. They assigned a value of 1 to the crack part and 0 to the non-crack part. As shown in Figure 8, a pixel compression method was utilized to visualize cracks in 2D images, followed by obtaining a compressed binary 2D digital cloud matrix ([Bn]256×256). Subsequently, the binary 2D digital cloud matrix was stacked using a matrix superposition algorithm from top to bottom.
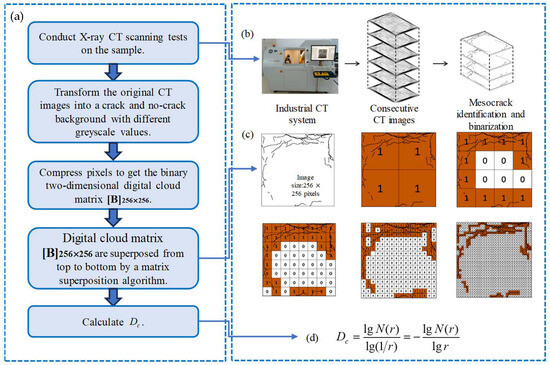
Figure 8.
(a) Flow chart of determining by box-counting method, (b) X-ray CT scanning process, (c) specific imaging processes, and (d) computing box-counting fractal dimension [22].
The surface crack area was overlaid with boxes of different lengths, with the side length adjusted based on the required grid density. All the crack areas were covered by boxes, and the total number of these boxes () was calculated. If the length () satisfies the conditions specified in Equation (46), then is calculated as Equation (47).
In a logarithmic coordinate system, if the fitting curve of the points is a straight line, it indicates that surface cracks can be evaluated by fractal theory. At this point, is the slope of the line.
- by combining X-ray CT scanning test with improved Box-Counting model
Nitka and Tejchman [72] proposed a new detection method based on CT images, incorporating image enhancement and crack extraction. They conceptualized the image as a three-dimensional surface plane. During the process, can be determined. Traditional methods are limited to describing the fractal characteristics of relevant regions but fail to capture the fractal attributes of individual signal pixels. Therefore, they proposed a new method to evaluate the pixels’ fractal characteristics. Analysis showed that the standard deviation, variance, and fitting error of the fractal dimension calculated by the improved box-counting model are relatively small [109]. This indicates that the fractal dimension calculated by the new method is more accurate than that calculated by the traditional one [37]. Figure 9 shows the flow chart of their proposed method.
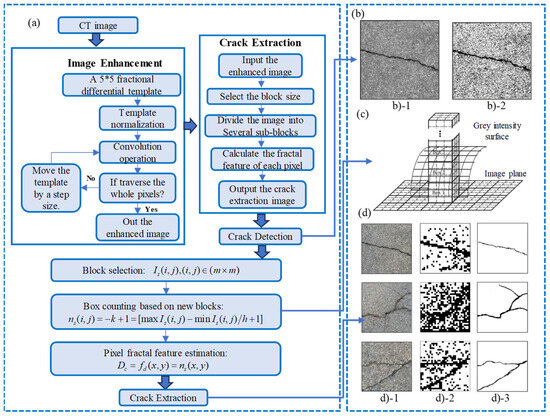
Figure 9.
(a) Flow chart of determining by improved box-counting method; (b) comparison of images. (b-1) Initial image, (b-2) enhanced image, (c) explanation of improved method, (d) images detected by different methods. (d-1) Initial image, (d-2) FD, (d-3) proposed method [90].
The image plane is divided into overlapping blocks of size . The block moved one pixel along the image’s or direction in every step, resulting in blocks being overlapped in the plane. The related block is defined as follows:
where refers to the block.
Then, each block is composed of boxes of size , where , and is the total number of picture grayscale. Let the minimum and maximum gray levels in the block fall into the and boxes, respectively. The total number of the boxes is calculated as follows:
where and are the maximum and minimum gray levels, respectively.
can be determined as
where is the pixel gray level.
- Comparative analysis of models
Table 6 shows the different models of . As for the traditional box-counting method, selecting the size of boxes is of great significance [110]. While the box size can be adjusted, the scale and height are also under the limitations of equations and , which directly impacts the results. Moreover, the traditional box-counting method is applied for related regions and not individual signal pixels. However, digital images containing crack information exhibit detailed textures, potentially leading to the omission of crack information using the traditional method. The improved box-counting method offers a suitable approach to describe the fractal features of pixels, addressing these issues. Nevertheless, the accuracy of the traditional box-counting method generally meets requirements, and its operation is relatively straightforward, making it more widely utilized.
Table 6.
Comparison of different models of .
3.3.2. Fractal Dimension of Fracture Surface ()
Statistically speaking, the formation of the fracture surface can be attributed to the dynamic process of damage evolution [111]. Combining fractal geometry with fracture phenomena can effectively describe rough surfaces and interfaces quantitatively [101,112,113]. The most commonly used fractal dimension to reflect the fracture situation of the fracture surface is denoted by [24]. In recent years, many test methods and models have been used to calculate the fractal dimension , such as the projected fringe technique combined with the grid scaling method, the confocal microscope technique combined with the cube-counting method [76], SEM combined with the box-counting method [39], the laser profilometer combined with the string method [24], etc.
- by combining Projected Fringe Technique with Grid Scaling Method
In Mechtcherine’s [76] research, the projection fringe technique was employed to measure the fracture surface of uniaxial tensile tests, aiming to investigate the influence of parameters on crack propagation. Measurements were taken every 0.16 mm, resulting in the fracture surface all covered by 375 625 grids.
After obtaining cross-sectional grid data through optical measurement, the smallest grid size can be determined, and then the roughness can be determined by Equation (51). Subsequently, the geometric data from all measurement points were utilized to construct a triangular mesh, as depicted by the gray surface in Figure 10b. From this grid, the area of a single triangle was computed, facilitating the determination of the entire surface area (equal to the total number of all single triangles).
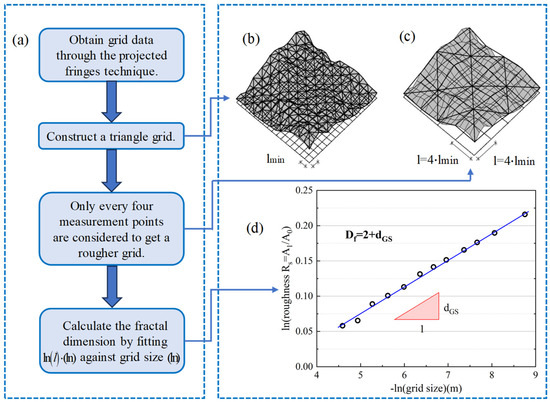
Figure 10.
(a) Flow chart of determining by grid scaling method, (b) example of fracture surfaces covered by grids of size , (c) example of fracture surfaces covered by grids of size , and (d) schematic diagram of fitting curve [76].
The principle of this method may be that and increase with the decrease in . The relationship of these parameters is controlled by . And during the process, some measurement points can be selectively ignored so that the calculation will be simplified (for example, for grid size , only every fourth measurement point is considered, as shown in Figure 10c).
where is the roughness of the fracture surface for grid size , is the fractal increment, and is the scale factor.
Finally, the relationship between the logarithm of roughness () and the logarithm of grid size () is shown in Figure 10d, where the slope of the fit curve is .
- by combining SEM with the Box-counting Method
Lu used the Box-counting method combined with the SEM method to calculate the fractal dimension [5]. According to their method, the box-counting method was applied to calculate through a large dataset of SEM images depicting fracture surfaces. Firstly, they imported an image with a resolution of MM pixels (Figure 11(b-1)). Then, binary operations were performed on the images to generate a matrix. The matrix underwent segmentation and processing. Finally, the slope of the line - was calculated, representing the fractal dimension .
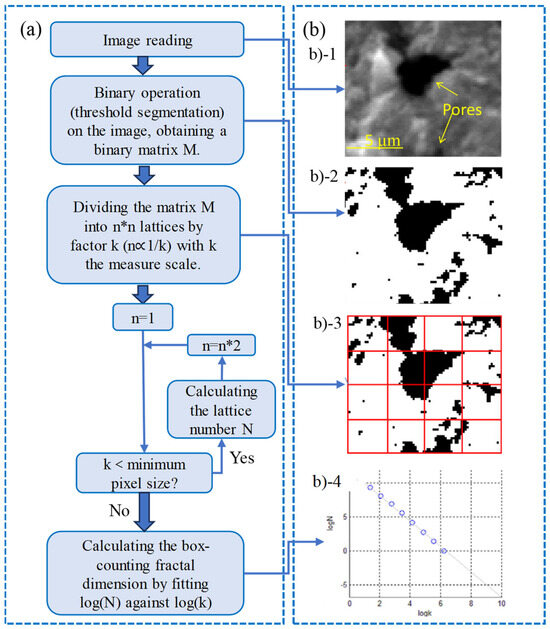
Figure 11.
(a) Flow chart of determining by box-counting method and (b) specific imaging processes. (b-1) Image reading, (b-2) process of generating matrix, (b-3) calculations of boxes, and (b-4) schematic diagram of fitting curve [39].
can be determined as [110]
where is the minimum number of boxes with size covering all cracks, and is the total number of all boxes.
- by combining Confocal microscope with the Cube-counting method
The box-counting method can be extended as the cube-counting method. In Mechtcherine’s research [76], a confocal microscope was applied to test cross-sections. Every spot of size 0.64 mm × 0.64 mm yielded 512 × 512 mesh data in total. Simultaneously, the fracture surface of concrete was constructed, as depicted in Figure 12, where cubes were used on a three-dimensional scale instead of squares, distinguishing it from the box-counting method.
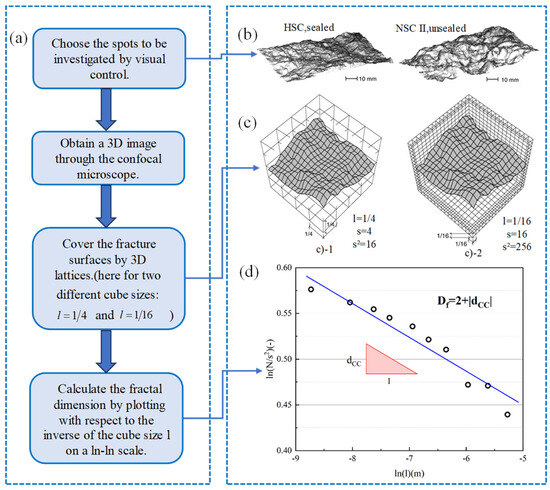
Figure 12.
(a) Flow chart of determining by cube-counting method, (b) schematic diagrams of fracture surfaces, (c) schematic diagrams of fracture surfaces covered by cubes with two sizes, (d) schematic diagram of fitting curve [76].
The number of cubes intersecting the surface was divided by the number of cubes and then plotted against the inverse of the cube size on a scale.
As illustrated in Figure 12, draw some points (, ) in the coordinate axis, where is the number of cubes intersecting the interface, and is the cube length. If these plots can be linearly fitted, then can be calculated as Equation (54):
where dGG is the fractal increment and the slope of the line.
- Comparative analysis of models
The measurement points in the grid scaling method are obtained through optical measurement and are generally used in conjunction with optical instruments. In calculations, some points are ignored, resulting in lower accuracy compared to other methods. The algorithm of the box-counting method is simple and easy to use. It has relatively high accuracy but can only be applied to one-dimensional and two-dimensional data. The cube-counting method is a new method based on the box-counting method, which is applied to three-dimensional calculations. (See Table 7).
Table 7.
Comparison of different models of .
4. Application of Fractal Theory on Performance of Cement-Based Composites
The macroscopic performance of CCs is highly related to their microscopic structure. This composite material typically consists of cement, aggregates, water, and additives, and its macroscopic properties are influenced by the components and their interactions [2]. Specifically, the distribution and shape of aggregates significantly impact the strength and toughness of the composite material, while the pores formed during cement hydration and hydration products directly affect its strength, stiffness, and durability [114]. Due to the complex morphology and spatial distribution of pores in concrete, fractal theory is often used to analyze and evaluate the mechanical properties of CCs [115].
This review attempts to explore in depth the correlation between macroscopic performance (including compressive strength, freeze–thaw resistance, impermeability, corrosion resistance, high-temperature resistance, etc.) and the fractal dimensions of microscopic structures. Understanding these relationships can better establish the connection between microscopic structure and macroscopic properties, providing robust guidance for the design and optimization of CCs. Table 8 summarizes existing research on the correlation between the fractal dimensions of microstructure and macroscopic properties of CCs.
Table 8.
Fractal dimensions applied to evaluate the properties of cement-based composites.
4.1. Compressive Strength
The mechanical performance of CCs is one of the key requirements in the design of structures [121]. The compressive strength of CCs is significantly correlated to their microstructure, particularly regarding particle distribution, pore structure, and cracks [2,98]. By introducing fractal theory, a clearer understanding of the impact of these microstructures is gained. Therefore, numerous researchers have conducted studies to assess the correlation between microstructure and the mechanical properties of CCs [115,121,133], exploring the application of fractal dimensions in evaluating the compressive strength of CCs.
4.1.1. Correlation between Particle Distribution and Compressive Strength of Specimens
The fractal dimension can effectively characterize the gradation and fineness of powder in CCs or the spatial distribution of particles in freshly mixed cement slurries. Based on the above theory, Abdeldjalil et al. [27,121] investigated the application of in predicting compressive strength and found that compressive strength is strongly correlated to the C/W ratio of cement and the fractal particle model FGMg. Their analysis encompassed particle mixtures from 99 types of concrete components across various studies to ensure the reliability and accuracy of the and the fractal model FGMg. Therefore, they concluded that the can effectively evaluate the compressive strength. Additionally, Yang [120] explored the relationship between the peak load of concrete, the proportion of coarse and fine aggregates, and the . As shown in Figure 13, their findings revealed a robust negative correlation between the and compressive strength, demonstrating clear linearity in the curves. They also proposed the feasibility of establishing a predictive model for compressive strength using the . Overall, the existing research indicates a negative correlation between the fractal dimension and compressive strength. This correlation stems from the fact that an increase in suggests a more complex spatial distribution, resulting in uneven internal stress distribution within cement-based composites and a decrease in compressive strength.
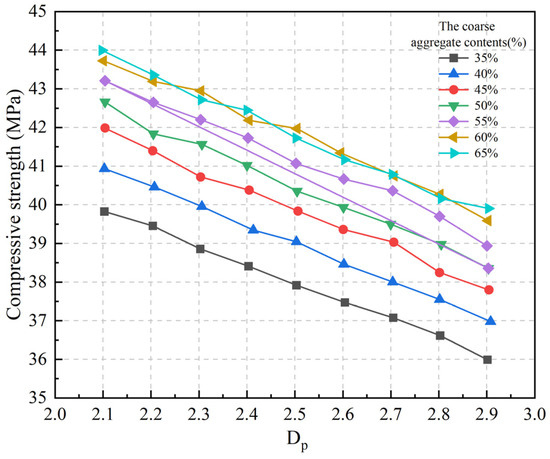
Figure 13.
Effect of fractal dimension of cement paste on compressive strength [120].
4.1.2. Correlation between Pore Structure and Compressive Strength of Specimens
The fractal dimension serves as a valuable indicator for reflecting the pore morphology and spatial structure complexity of CCs, making it one of the commonly used metrics for evaluating the compressive strength of CCs. Figure 14 illustrates the varying trends between compressive strength and observed in different studies. Han et al. [87] conducted research on ordinary Portland cement concrete and concluded that is positively related to compressive strength. This implies that compressive strength can be inferred by analyzing . Zarnaghi [98] investigated the optimal amount of silica fume in lightweight self-compacting concrete, the results indicated that higher degrees of hydration shifted the pore structure from larger pores to predominantly dispersed smaller pores. This led to an increase in , exhibiting a positive correlation with compressive strength.
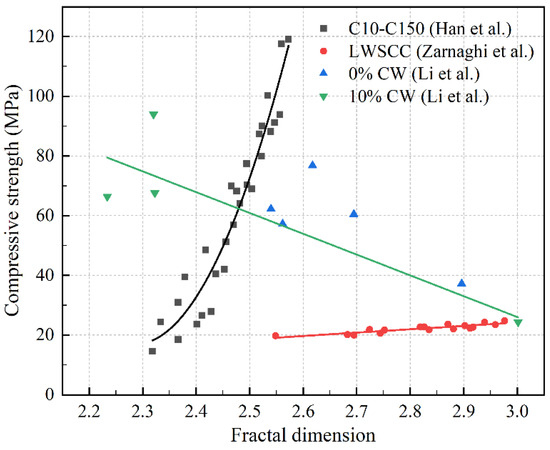
Figure 14.
Varying trends between compressive strength and observed in different studies [87,97,98].
Overall, there appears to be a positive correlation between compressive strength and , indicating that as the increases, the compressive strength tends to increase. This is attributed to the fact that the porosity remains unchanged, and the increase in signifies the dispersion of larger pores into numerous and more dispersed smaller pores. Consequently, this alteration in pore distribution contributes to a more uniform stress distribution within the concrete, ultimately enhancing compressive strength. However, Li et al. [97] arrived at a contrasting conclusion, suggesting a negative correlation between and compressive strength. This discrepancy might be attributed to the utilization of cementitious slurries subjected to high-temperature treatment. The high-temperature treatment resulted in a more complex and rough pore structure in the cement-based composite material, leading to an increase in and a decrease in compressive strength.
Similar to , is also positively related to compressive strength. Compared to pore parameters such as total pore area, average pore diameter, and median pore diameter, fractal dimension more accurately characterizes the complexity of pore size distribution and pore structure, providing a more effective assessment of the macroscopic performance of concrete. As increases, the average pore diameter and median pore diameter decrease, the pore surface area increases, and the complexity of the pore structure grows, resulting in an increase in the compressive strength of concrete materials. Figure 15 shows some related studies, with the typically around 3 for different concrete materials.
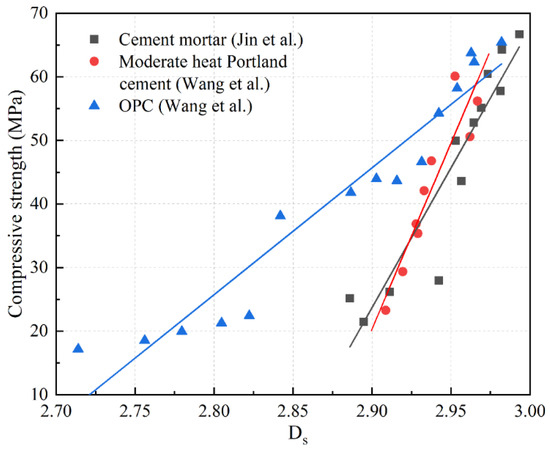
Figure 15.
Relationship between compressive strength and [116,117,134].
Jin et al. [40] pointed out that the , calculated based on a thermodynamic relationship fractal model, serves as a comprehensive indicator for evaluating the characteristics of the pore structure in cement mortar. Moreover, with the increase in , both the flexural strength and compressive strength of cement mortar show a significant improvement. Wang et al. separately investigated the relationship between the mechanical properties and of silica-fume-modified Portland-cement-based materials [91] and concrete materials incorporating silica fume and fly ash [100]. The results indicated that with an increase in the content of modified materials, the increases, leading to a notable enhancement in the compressive strength.
4.1.3. Correlation between Fracture and Compressive Strength of Specimens
Lu et al. [39] reported findings on the fracture surface information of SF-modified concrete specimens. As shown in Figure 16, an increase in SF content led to a noticeable suppression of irregularities on the fracture surface, accompanied by an enhancement in compressive strength. The decrease in led to an increase in compressive strength, and therefore, was negatively correlated to the compressive strength. The fractal dimension of cracks has a clear linear relationship with the coupling effect, which can quantitatively reflect the degradation law of fiber-reinforced concrete. The larger the value of the fractal dimension of cracks, the greater the freeze–thaw damage of fiber-reinforced concrete, and the lower the compressive strength. Similarly, Sun et al. [118] reported that there was a clear linear relationship between the fractal dimension and the coupling effect, which can quantitatively reflect the degradation law of fiber-reinforced concrete. The larger the value of , the greater the damage to fiber-reinforced concrete, and the lower the compressive strength.
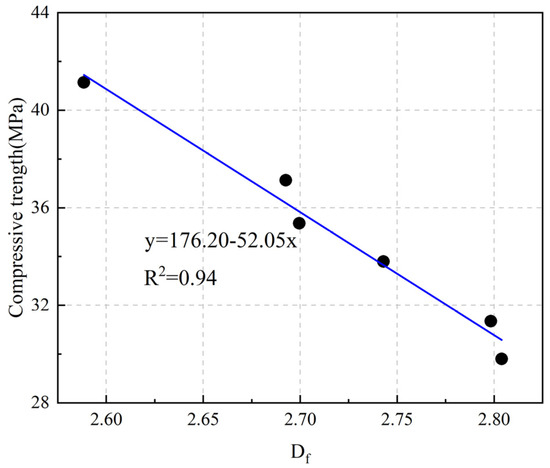
Figure 16.
Relationship between compressive strength and fractal dimension [39].
can not only be used to evaluate the compressive strength of CCs but also to establish models for predicting compressive strength. Volchuk et al. [119] reported on the relationship between fracture stress and fractal dimension in compressive strength experiments and established a practical predictive model to describe the relationship between macroscopic structural factors and concrete strength standards. Zheng et al. [38] discussed the relationship between and uniaxial compressive strength. They analyzed the damage degree of glass-fiber-reinforced concrete by quantitatively characterizing the crack distribution and evaluated the influence of fiber dosage on the strength performance and failure mechanism. The results indicated that the uniaxial compressive strength can be improved by adding appropriate fibers. As the fiber dosage increased until excessive, new defects would form in the fibers, leading to a decrease in uniaxial compressive strength. As shown in Figure 17 and Figure 18, when the fiber dosage increased, the compressive strength first increased and then decreased, and the fractal dimension first decreased and then increased. is negatively correlated with compressive strength. The fractal dimension of cracks can better reflect the change process of concrete material damage and quantitatively describe the characteristics of material damage evolution [135]. This may be because CCs undergo a cross-scale evolution process from “uniform” damage to local failure in the overall statistical sense during tensile deformation, which is similar to the iterative process of fractal curves to a certain extent [100].
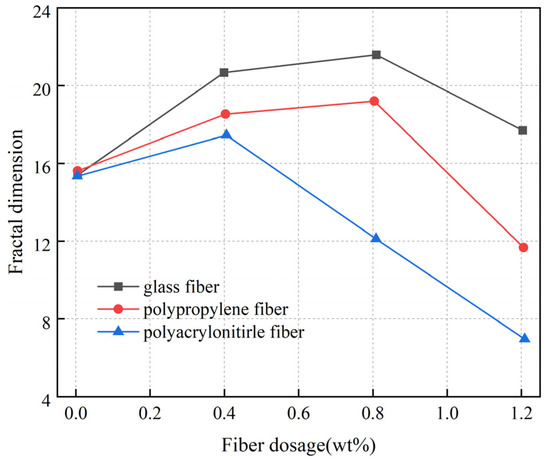
Figure 17.
Variation curve of peak stress of specimens with different fiber dosages [38].
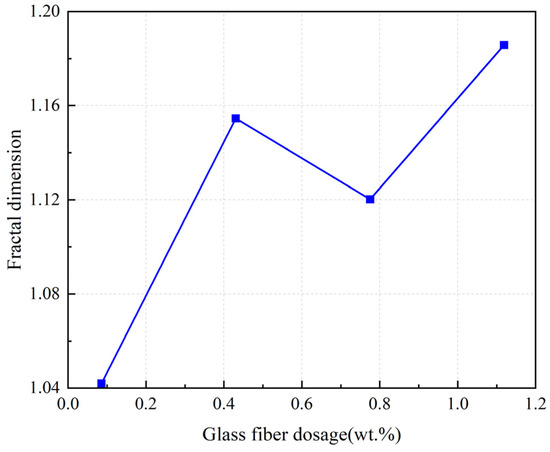
Figure 18.
Relation diagram of glass fiber dosage and fractal dimension [38].
4.2. Frost Resistance
Cement-based materials in harsh cold environments are subjected to freeze–thaw cycles, accelerating the degradation process and leading to severe degradation. This will cause irreversible damage to the durability of CCs’ structures [7,8]. This phenomenon poses significant challenges for the maintenance and repair of infrastructure. Therefore, research on the frost resistance of CCs is of paramount importance [136].
Due to the complex pore structure of CCs, traditional geometric methods struggle to accurately describe the nuanced differences in frost resistance caused by pore structure variations. Furthermore, these methods often fail to adequately reflect the specific damage processes at the microlevel. As mentioned earlier, fractal dimension descriptions of various pore structures have been introduced, enabling effective characterization of pore structure characteristics at the microlevel. Consequently, these fractal dimensions can be leveraged to independently evaluate the frost resistance of CCs. The existing research indicates that the frost resistance of CCs is closely related to the pore structure [137].
4.2.1. Correlation between Pore Structure and Frost Resistance of Specimens
As widely acknowledged, mass loss and the relative dynamic modulus of elasticity are typical indicators for evaluating frost resistance. Numerous research has shown a good correlation between and mass loss, as well as relative dynamic elastic modulus. Therefore, can serve as an effective indicator for evaluating the frost resistance of CCs.
Jin et al. [122] conducted experimental research on the freeze–thaw cycle and pore structure of concrete. They reported that, under the action of freeze–thaw cycles, only the fractal dimension exhibited changes. They proposed using fractal dimension to characterize the frost resistance and established a microfreeze–thaw damage model with as the independent variable to explore the freeze–thaw failure mechanism. Zou et al. [123] provided a quantitative description of the microdamage in mold-bag concrete subjected to different dry–wet and freeze–thaw cycles using . They established a dry–wet and freeze–thaw damage model based on the relative dynamic modulus of elasticity as the damage index. The validity of this model was confirmed by comparing experimental measurements with simulated values obtained from the model. Wang et al. [25] studied some concrete samples containing fly ash, PVA, MgO, and SRA and determined the frost resistance of concrete using the rapid freeze–thaw method. As shown in Figure 19a, the research results revealed a positive correlation between and the relative dynamic elastic modulus of elasticity, with an R2 value of 0.972. Furthermore, they observed is negatively correlated to the concrete quality loss, with an R2 value of 0.940 (Figure 19b). These conclusions can all indicate a linear positive correlation between and the frost resistance.
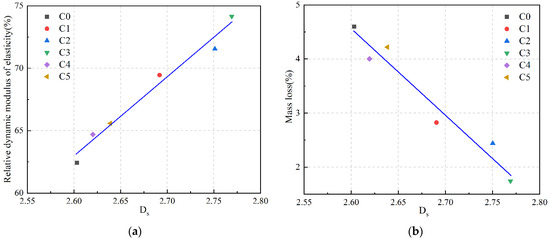
Figure 19.
Relationships between and (a) relative dynamic elastic modulus; (b) mass loss [25].
4.2.2. Correlation between Fracture and Frost Resistance of Specimens
As a fractal dimension used to describe the distribution of concrete cracks, can effectively evaluate the frost resistance of CCs. This is because crack propagation is the primary cause of damage to cement-based composites [138]. When cracks appear, the overall integrity of the cement-based composites decreases, leading to a deterioration in freeze–thaw resistance. Asphalt concrete, in particular, is severely affected by freeze–thaw cycles [139].
Li et al. [124] reported a fracture toughness model for a single crack based on fractal theory, shedding light on the inherent mechanism of freeze–thaw cycles. As shown in Figure 20, the appearance of cracks causes the average fractal dimension of pores to initially fluctuate first and then decrease with an increase in freeze–thaw cycles. Simultaneously, the overall integrity decreases, and the elastic modulus gradually deteriorates. Overall, the existing research has shown that , as a quantitative analysis of the internal structure of concrete, can serve as a quantitative indicator of concrete frost resistance.
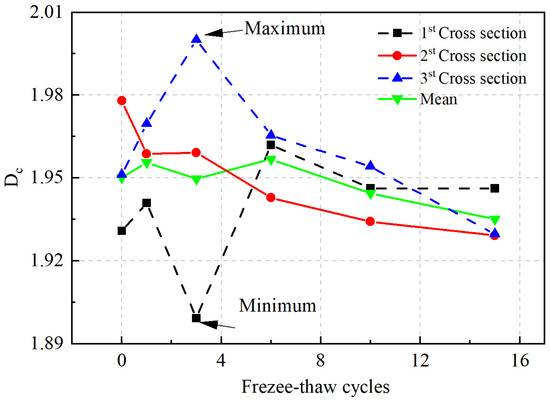
Figure 20.
The law for the change in the fractal dimension on each cross-section [124].
4.3. Impermeability
4.3.1. Correlation between Pore Structure and Impermeability of Specimens
The durability of CCs is always affected by water [140,141], and the penetration of harmful ions dissolved in water is considered the main cause of various durability problems including steel corrosion, the cracking of the concrete protective layer, and even delamination [142]. Moreover, water infiltration is a common occurrence during the deterioration process of freeze–thaw cycles [143]. Clearly, water absorption plays a critical role in the durability of CCs.
The impermeability of CCs refers to their ability to prevent the ingress of external ions and water. Therefore, superior impermeability translates to enhanced resistance against water and harmful ion penetration [142]. Zheng [144] reported that impermeability is determined by the total porosity in CCs and the microgeometric structure. Similar results have been reported by other studies [144], stating that high porosity and a high proportion of large capillary pores are conducive to the generation of percolation channels. Therefore, studying the impermeability of pore structures is of great significance. In this section, we provide a detailed explanation of the relationship between different fractal dimensions of pore structures and impermeability.
In recent years, numerous researchers have explored the correlation between and the impermeability of CCs. It is widely acknowledged that is positively correlated to impermeability, leading to the establishment of several permeability models based on fractal theory. For instance, Wang et al. [125] studied the reactivity of MgO and its effects on the impermeability and freeze–thaw resistance of CCs. As shown in Figure 21, they revealed a negative correlation between and porosity, as well as the pore size of CCs, with R2 values of 0.970 and 0.938, respectively. This suggested that can effectively characterize the pore structure of CCs. Furthermore, the correlation between concrete impermeability and is shown in Figure 22, clearly indicating a negative correlation between the relative permeability coefficient used to evaluate the impermeability of concrete and , with an R2 value of 0.987. That is to say, higher values of correspond to better impermeability. Moreover, Wang et al. [5] used a combination of fractal theory and impermeability testing to establish a TRC fracture seepage model, providing a reference for predicting the impermeability of TRC. In this study, the was introduced to describe roughness, and the prediction equation better aligned with the actual TRC impermeability testing. Therefore, the above research results clearly indicate that can be used to characterize the porosity of CCs and evaluate the impermeability of CCs.
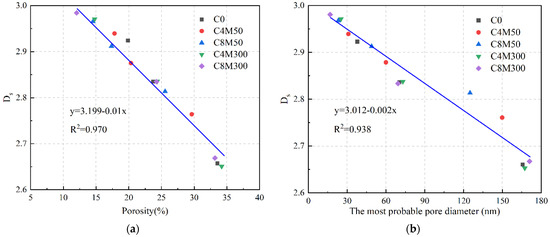
Figure 21.
The correlation between and (a) porosity and (b) the most probable pore diameter of concrete [125].
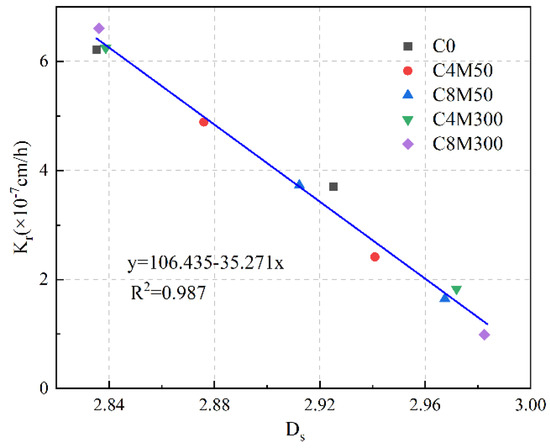
Figure 22.
The correlation between and [125].
In the study on the complexity of pore distribution, impermeability of CCs, and fractal analysis of pore connectivity, Ding [126] revealed a high correlation between and the probability of pore connectivity, with an R2 value of 0.935. They found that the of concrete with a pore size ranging from 50 to 550 nm can describe the pore distribution inside concrete in detail and more quantitatively. This fractal dimension serves as a valuable metric for quantifying the complexity of internal pores in CCs and is of great significance for studying the permeability of concrete based on chaotic fractal theory. Shao et al. [127] reported that when carbon nanotubes were added, the of rubber concrete decreased, and the impermeability of the concrete was improved. Overall, although exhibits significant scale dependence, it can still effectively reflect the degree of coarsening and degradation of pore structures. is well linearly correlated with the water absorption value of CCs, which can accurately evaluate the impermeability of CCs.
4.3.2. Correlation between Fracture and Impermeability of Specimens
can serve as an effective indicator for evaluating impermeability in CCs. Darcy’s law provides the relationship between the cross-sectional flow rate and permeability coefficient, allowing for the evaluation of the impermeability of concrete based on the cross-sectional condition. In this evaluation, the distribution of cross-sectional cracks plays an important role. Ding et al. [145] used the fractal dimension to link the measured crack width with the effective crack width, and established a functional relationship between the permeability coefficient of cracked concrete and . The results indicated that the fractal dimension increased with the increase in fiber content, while the permeability coefficient decreased with the increase in fiber content. Moreover, as the crack width increased, the absolute value of the exponent of the fractal dimension decreased, indicating a reduced impact of crack section roughness on the permeability coefficient.
Furthermore, there is still some controversy regarding the application of fractal dimension in evaluating the impermeability of CCs. Lu et al. [39] studied the correlation between , compressive strength, and the impermeability of concrete mixed with silica fume. The results indicate that an increase in silica fume content increases compressive strength but reduces impermeability and . The decrease in confirms that SF particles homogenize the material structure, which in turn leads to a decrease in impermeability. This is consistent with the research findings of Pfeifer and Avnir [94], which assert that reflects the internal surface irregularity, with higher values signifying more severe surface irregularity. However, the main controversy in this study lies in the specific physical significance between impermeability and . Impermeability may be established by the threshold path of water infiltration instead of the irregularity of the material surface [146]. Additionally, the image data obtained by SEM technology in this study not only reflects the surface structure but also reflects the distribution of components, posing challenges in separating terrain and component differences. Consequently, the fractured concrete surface in the study may not be as irregular as evaluated by .
4.4. Corrosion Resistance
It has been identified that sulfuric acid is the most corrosive mineral acid in nature. Fan et al.’s research [147] shows that the factors affecting sulfuric acid corrosion in CCs are always internal and external. Internal factors include cement type, auxiliary cementitious materials, water–cement ratio, aggregates, etc. External factors include the value of solution pH, temperature, concrete stress state, etc. Annually, tens of thousands of CCs degrade due to the action of sulfuric acid, resulting in huge losses. Therefore, a large number of scholars have studied the effect of sulfuric acid on CCs [9,148,149].
Sulfate corrosion is one of the important causes of cracks in CCs, prompting researchers to employ to evaluate the resistance of CCs against sulfate corrosion. Zhang et al. [128] reported the fractal characteristics of cracks in fiber lithium slag concrete under sulfate erosion. Their findings revealed that initially increased, then decreased, and subsequently increased with erosion days. As the component was damaged, the showed an oscillatory increasing trend with the sulfate erosion days, suggesting that the can be used as one of the indicators to determine the degree of damage to components. In another study, Xiao et al. [130] attempted to explore the feasibility of characterizing the of sulfuric-acid-corroded concrete surfaces. Their findings demonstrated a positive power relationship between and the corrosion duration, initially experiencing sharp increases followed by a plateau phase, as shown in Figure 23. The results indicate that the can be used as an indicator to evaluate the degree of corrosion deterioration.
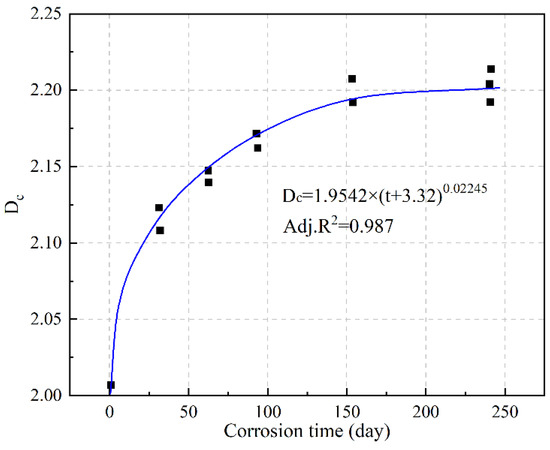
Figure 23.
Relationship between fractal dimension and corrosion time [130].
In addition to sulfuric acid corrosion, chloride ion invasion causing macropore and microporous corrosion is also prevalent [150]. Ji et al. [129] conducted simulation experiments on chloride ion invasion, verifying that the fractal theory can describe the distribution of concrete cracks well. They introduced for the first time to characterize the corrosion cracking of concrete specimens under different corrosion rates. In their study, Ji et al. [129] subjected Portland cement specimens of size 100 mm × 100 mm × 400 mm to a 5% NaCl solution. Upon crack formation in the sample, the epoxy resin was used to fill the corrosion cracks due to its fluidity. This experiment process involved using PS to grid the surface of slices, similar to the box-counting method. Through regression analysis, the correlation between and corrosion rate was established as follows:
The relationship between and is positively correlated, with correlation coefficients above 0.95, indicating a good linear relationship. According to the conclusion by Xu et al. [151], if is linearly correlated with , the crack is self-similarity, allowing their distribution to be described using fractal theory. Therefore, Ji et al. concluded that concrete cracks caused by chloride ion corrosion have obvious fractal characteristics, justifying the application of fractal geometry theory for their description.
4.5. High-Temperature Resistance
With the increasing occurrence of sudden extreme loads such as high temperatures, explosions, and impacts on concrete structures [152], the need to assess the high-temperature resistance performance of CCs has become paramount. Exposure to high temperatures induces alterations in the physical and chemical properties of CCs, ultimately leading to a decrease in mechanical properties such as compressive strength, crack formation, delamination, and decreased elastic modulus [153]. These changes pose threats to the durability of CCs and the overall stability of the structural systems [154]. Consequently, evaluating the high-temperature resistance performance of CCs is vital when evaluating the performance of designed structures.
The observed alterations in the performance of CCs exposed to high temperatures are related to the changes in the microstructure of the material. Conventional methods struggle to provide quantitative analysis of phenomena such as crack initiation and propagation, as well as impact crushing of CCs. In this context, the fractal dimension emerges as a reliable tool for evaluating the high-temperature resistance of CCs from various perspectives.
4.5.1. Correlation between Pore Structure and High-Temperature Resistance of Specimens
As the temperature increases, the internal pore structure of CCs deteriorates more severely, and the porosity and threshold pore size both increase with the increase in temperature [155]. However, as the temperature rises to a certain extent, the porosity and pore size of CCs tend to stabilize. However, high temperature induces both physical and chemical changes in CCs. Consequently, the internal surface roughness of pores increases and the internal distribution of pores volume undergoes alterations within cement-based composites. Thus, can be an effective indicator for evaluating the high-temperature resistance performance of CCs.
Li et al. [97] conducted a study on the influences of high temperature on the microstructure of calcium carbonate whisker (CW)-reinforced cement slurry. As shown in Figure 24, their research found that when the temperature is within 400 °C, the porosity and pore size increased minimally or even decreased. Intriguingly, the of 10% improved cement paste decreased, while the residual compressive strength increased. This phenomenon can be attributed to the relatively uniform pore structure of the CW-reinforced cement slurry, leading to a reduction in the fractal dimension and an enhancement in the compressive strength after high-temperature treatment. Therefore, the is a useful tool for evaluating changes in pore structure at high temperatures, and there is a negative correlation between and high-temperature resistance performance.
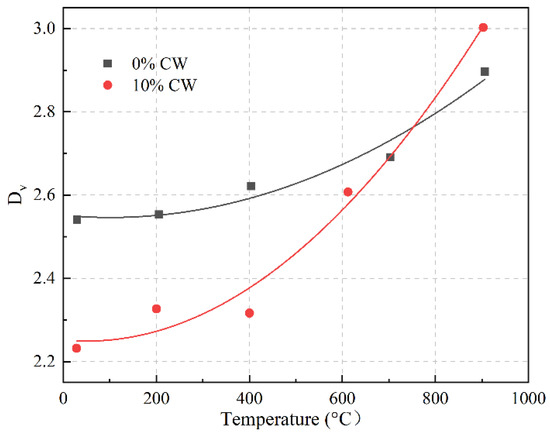
Figure 24.
Effect of whisker and temperature on of cement-based composites at 20–60 nm pore size [97].
4.5.2. Correlation between Fracture and High-Temperature Resistance of Specimens
The effectiveness of the fractal dimension in evaluating the high-temperature resistance performance of CCs stems from its reduced susceptibility to variations in material shape and size under high-temperature conditions. Li et al. [132] conducted an analysis on the cracking characteristics of concrete materials at elevated temperatures, examining parameters such as crack area, total length, average width, and . They prepared two sizes of concrete material specimens: cube specimens (70 × 70 × 70 mm3) and prism specimens (40 × 40 × 40 mm3). As shown in Figure 25, the cube specimens exhibited significantly longer total crack lengths compared to the prism specimen, while the result of the average crack widths was the opposite. Notably, the crack area and of the two specimens were similar.
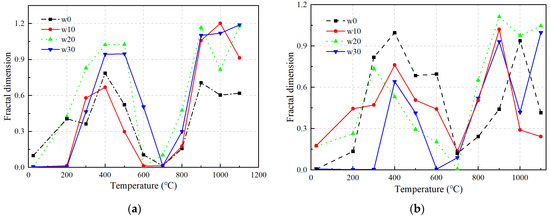
Figure 25.
Variation curves on fractal dimension of surface crack parameters with increasing temperature: (a) cube specimen; (b) prism specimen [132].
Evidently, the degree of concrete material cracking after exposure to high temperatures is closely related to the size and shape of the specimen. However, in contrast to other crack parameters, the fractal dimension is less affected by these factors. Therefore, the can effectively evaluate the degree of cracking in concrete components after high-temperature treatment.
The efficacy of the in assessing high-temperature resistance primarily stems from its strong correlation with the crushing characteristics of cement-based composites, particularly under elevated temperatures. This relationship was validated by Gao et al. [14] through their investigation on the performance of concrete containing carbon nanotubes at high temperatures. As shown in Figure 26, the curves of plain concrete (PC) exhibited a linear growth relationship under different working conditions. The high correlation coefficients (R2 > 0.9) signify that the crushing distribution of the sample conforms to the fractal principles [156]. Furthermore, as shown in Figure 27, the fractal dimension of modified concrete (MC) is lower than that of PC. This discrepancy is likely attributed to the introduction of multi-walled carbon nanotubes (MWCNT), which enhances the uniformity and compactness of the microstructure in MC. This enhancement effectively mitigates the initiation and propagation of cracks, resulting in a decrease in and an improvement in high-temperature resistance.
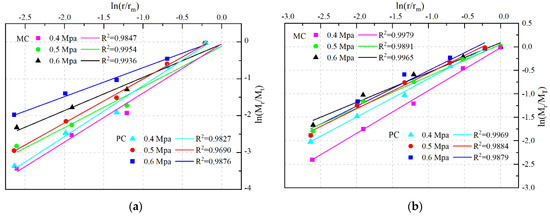
Figure 26.
curves: (a) at 25 °C, (b) at 600 °C [14].
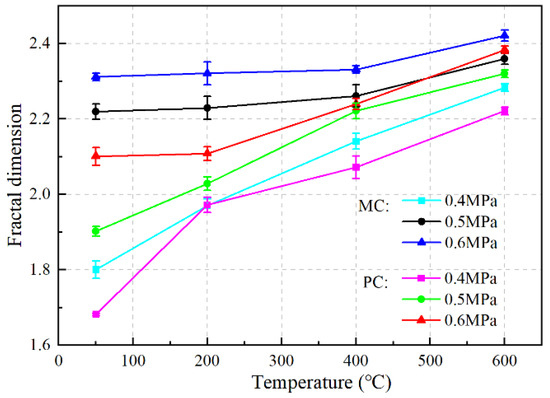
Figure 27.
Effect of temperature on fractal dimension [14].
Following exposure to elevated temperatures, it was noted that impact resistance exhibited a negative correlation with , while high-temperature resistance demonstrated a positive correlation, further emphasizing the utility of as an indicator for evaluating the performance of concrete materials under high temperatures.
5. Conclusions and Outlook
In summary of the aforementioned paper, a comprehensive review on three aspects was conducted: microstructure testing methods, fractal models, and the application of fractal theory in macro-mechanics. A detailed process was established for the application of microstructure testing methods, processing of test results, establishment of fractal models, and calculation of fractal dimensions. This paper supplemented the details that may be overlooked during the application process of the model and discussed the advantages, disadvantages, and applicable scenarios of different models with the same fractal dimension. This paper explores and reveals the principle of the correlation between the fractal dimension of microstructures and macroscopic performance. Through this review, a profound understanding of the current research status was gained, leading to the following conclusions:
(1) In terms of microstructure testing methods, numerous innovative technologies and methods have been observed. This article categorizes the testing methods for microstructure into three categories. Specifically, particle distribution testing primarily employs Morphologi G3 and the static light scattering method. Pore structure is commonly assessed using MIP, NAD, and LT-DSC, while crack testing predominantly relies on SEM and CT scanning. These methods provide rich means for a deeper comprehension of material microstructures.
(2) Fractal theory can effectively describe the microstructural characteristics of cement-based composites. This paper extensively describes six fractal dimensions related to microparameters, including the fractal dimensions of the particle spatial distribution (), pore surface (), pore volume (), pore tortuosity (), fracture surface (), and the dimensions of cracks ().
(3) The fractal dimensions of microstructures in cement-based composites are closely correlated with their macroscopic performance. Notably, the compressive strength of materials has a positive correlation with and a negative correlation with both and . This may be because as the spatial distribution becomes more complex, increases and decreases, leading to uneven internal stress distribution and a decrease in compressive strength. Furthermore, the shows a positive correlation with cement-based composites’ frost resistance and impermeability. Due to the increase in macropores, the irregularity of the pore surface decreases, the frost resistance decreases, and it is easier to form permeable channels, resulting in a decrease in impermeability. Although correlations exist between the and corrosion resistance, they may vary for different structures. Additionally, and both demonstrate a positive correlation with high-temperature resistance. The fractal dimension is less affected by high temperature compared to other cracking parameters and can effectively evaluate the performance of CCs after high temperature. It is important to note that these correlations may vary across different studies.
Despite significant progress in microstructure testing methods and fractal models, as well as meaningful achievements in the application of fractal theory in the field of cement-based composites, these methods still face challenges and limitations. Future research efforts should be directed toward overcoming these limitations:
(1) Commonly used fractal dimensions and models struggle to address structural issues at the nanoscale. Further efforts are needed to enhance the resolution and accuracy of testing methods and improve the applicability and accuracy of fractal models.
(2) Although different measurement techniques and fractal models yield fractal dimensions with the same physical meaning, they may lead to different or even contradictory conclusions when evaluating the same macroscopic properties. Currently, there is a lack of unified relationships or standards between fractal dimensions and macroscopic properties, making it challenging to compare results from different fractal models.
(3) Despite the application of many fractal dimensions in evaluating macroscopic properties, research in this area is still insufficient. A more in-depth and comprehensive fractal study is needed for mechanical properties and durability. This will determine a more accurate quantitative relationship between fractal dimensions and micro- and macrostructural performance models, providing a better understanding of cement-based composite properties.
(4) This article focuses on studying and summarizing the applications of the fractal dimension in compressive strength, frost resistance, corrosion resistance, impermeability, and high-temperature resistance, without exploring and summarizing the effects of fractal dimension on shrinkage behavior, fracture mechanics, flowability, and impact resistance, etc. In future research, we will continue to strengthen our work in this area.
Author Contributions
Conceptualization, P.Z. and F.W.; methodology, J.D.; software, J.D.; formal analysis, J.D.; investigation, P.Z., J.D., J.G. and F.W.; resources, J.G.; data curation, J.D.; writing—original draft preparation, P.Z.; writing—review and editing, J.D., J.G. and F.W.; visualization, P.Z.; project administration, F.W.; funding acquisition, P.Z. and J.G. All authors have read and agreed to the published version of the manuscript.
Funding
This research was funded by the National Natural Science Foundation of China (Grant No. U2040224) and the Natural Science Foundation of Henan (Grant No. 232300421003).
Data Availability Statement
The data that support the findings of this study are available from the corresponding author upon reasonable request.
Acknowledgments
The authors would like to thank all the anonymous referees for their constructive comments and suggestions.
Conflicts of Interest
The authors declare no conflicts of interest.
References
- Chen, Z.; Luo, Q.; Jin, D.; Wang, Z. Numerical study of fractal analysis of crack propagation in concrete under different strain rates by meso-scale particle element modeling. Int. J. Impact Eng. 2023, 173, 104440. [Google Scholar] [CrossRef]
- Ji, Y.; Zou, Y.; Wan, X.; Li, W. Mechanical Investigation on Fiber-Doped Cementitious Materials. Polymers 2022, 14, 1663. [Google Scholar] [CrossRef] [PubMed]
- Yu, Y.; Zhang, C.; Xie, X.; Yousefi, A.M.; Zhang, G.; Li, J.; Samali, B. Compressive strength evaluation of cement-based materials in sulphate environment using optimized deep learning technology. Dev. Built Environ. 2023, 16, 100298. [Google Scholar] [CrossRef]
- Qu, P.; Llu, X.; Baleanu, D. Simulating chloride penetration in fly ash concrete by a fractal derivative model. Therm. Sci. 2019, 23, S67–S78. [Google Scholar] [CrossRef]
- Wang, B.; Guo, J.; Liu, J.; Wang, Q. Prediction method of permeability of textile-reinforced concrete based on fractal dimension theory. Constr. Build. Mater. 2022, 327, 126868. [Google Scholar] [CrossRef]
- Quy, N.X.; Noguchi, T.; Na, S.; Kim, J.; Hama, Y. Distribution Map of Frost Resistance for Cement-Based Materials Based on Pore Structure Change. Materials 2020, 13, 2509. [Google Scholar] [CrossRef]
- Dong, S.; Qin, L. Study on Evolution Law of Pore Structure and Frost Resistance of High-Performance Activated Cement-Based Composites in Severe Cold Area. J. Phys. Conf. Ser. 2022, 2348, 012017. [Google Scholar] [CrossRef]
- Ji, Y.; Zou, Y.; Ma, Y.; Wang, H.; Li, W.; Xu, W. Frost resistance investigation of fiber-doped cementitious composites. Materials 2022, 15, 2226. [Google Scholar] [CrossRef]
- Xiao, J.; Qu, W.; Jiang, H.; Li, L.; Huang, J.; Chen, L. Fractal characterization and mechanical behavior of pile-soil interface subjected to sulfuric acid. Fractals 2021, 29, 2140010. [Google Scholar] [CrossRef]
- Zhao, J.; Gao, X.; Chen, S.; Lin, H.; Li, Z.; Lin, X. Hydrophobic or superhydrophobic modification of cement-based materials: A systematic review. Compos. Part B Eng. 2022, 243, 110104. [Google Scholar] [CrossRef]
- Fu, Q.; Zhao, X.; Zhang, Z.; Xu, W.; Niu, D. Effects of nanosilica on microstructure and durability of cement-based materials. Powder Technol. 2022, 404, 117447. [Google Scholar] [CrossRef]
- Liu, P.; Cui, S.; Li, Z.; Xu, X.; Guo, C. Influence of surrounding rock temperature on mechanical property and pore structure of concrete for shotcrete use in a hot-dry environment of high-temperature geothermal tunnel. Constr. Build. Mater. 2019, 207, 329–337. [Google Scholar] [CrossRef]
- Shen, J.; Xu, Q.; Liu, M. Fractal analysis of defects in concrete under elevated temperatures. ACI Mater. J. 2022, 119, 19–34. [Google Scholar] [CrossRef]
- Gao, F.-F.; Tian, W.; Wang, W.-D. Residual impact resistance behavior of concrete containing carbon nanotubes after exposure to high temperatures. Constr. Build. Mater. 2023, 366, 130183. [Google Scholar] [CrossRef]
- Zhang, P.; Su, J.; Gao, Z.; Zhang, T. Effect of sand-precursor ratio on mechanical properties and durability of geopolymer mortar with manufactured sand. Rev. Adv. Mater. Sci. 2024, 63, 20230170. [Google Scholar] [CrossRef]
- Zhang, P.; Sun, Y.; Wu, J.; Hong, J.; Gao, Z. Mechanical properties and microstructure of nano-modified geopolymer concrete containing hybrid fibers after exposure to elevated temperature. Constr. Build. Mater. 2023, 409, 134044. [Google Scholar] [CrossRef]
- Zhu, X.; Bai, Y.; Chen, X.; Tian, Z.; Ning, Y. Evaluation and prediction on abrasion resistance of hydraulic concrete after exposure to different freeze-thaw cycles. Constr. Build. Mater. 2022, 316, 126055. [Google Scholar] [CrossRef]
- Sebsadji, S.K.; Chouicha, K. Fractal equations to represent optimized grain size distributions used for concrete mix design. Comput. Concr. 2020, 26, 505–513. [Google Scholar]
- Song, Z.; Lu, Y. Mesoscopic analysis of concrete under excessively high strain rate compression and implications on interpretation of test data. Int. J. Impact Eng. 2012, 46, 41–55. [Google Scholar] [CrossRef]
- Yang, X.; Wang, M. Fractal dimension analysis of aggregate packing process: A numerical case study on concrete simulation. Constr. Build. Mater. 2021, 270, 121376. [Google Scholar] [CrossRef]
- Nelkin, M. The fractal geometry of nature—Mandelbrot, BB. Bull. Am. Meteorol. Soc. 1984, 65, 1112. [Google Scholar]
- Shang, X.; Yang, J.; Wang, S.; Zhang, M. Fractal analysis of 2D and 3D mesocracks in recycled aggregate concrete using X-ray computed tomography images. J. Clean. Prod. 2021, 304, 127083. [Google Scholar] [CrossRef]
- Yin, Y.; Ren, Q.; Shen, L. Study on the effect of aggregate distribution on mechanical properties and damage cracks of concrete based on multifractal theory. Constr. Build. Mater. 2020, 262, 120086. [Google Scholar] [CrossRef]
- Wang, L.; Zeng, X.; Yang, H.; Lv, X.; Guo, F.; Shi, Y.; Hanif, A. Investigation and application of fractal theory in cement-based materials: A review. Fractal Fract. 2021, 5, 247. [Google Scholar] [CrossRef]
- Wang, L.; Guo, F.X.; Yang, H.M.; Wang, Y.; Tang, S.W. Comparison of fly ash, PVA fiber, MgO and shrinkage-reducing admixture on the frost resistance of face slab concrete via pore structural and fractal analysis. Fractals 2021, 29, 2140002. [Google Scholar] [CrossRef]
- Mohammed, R.; Kaddour, C. Porosity assessment of granular mixtures intended for concrete using the fractal model of particle-size distribution. Constr. Build. Mater. 2021, 293, 123492. [Google Scholar]
- Abdeldjalil, M.; Chouicha, K. Study of the prediction of the mechanical strength of concrete based on the fractal model of granular distribution. Constr. Build. Mater. 2022, 348, 128562. [Google Scholar] [CrossRef]
- Liu, B.; Ma, R.; Fan, H. Evaluation of the impact of freeze-thaw cycles on pore structure characteristics of black soil using X-ray computed tomography. Soil Tillage Res. 2021, 206, 104810. [Google Scholar] [CrossRef]
- Zeng, Q.; Li, K.; Fen-Chong, T.; Dangla, P. Surface fractal analysis of pore structure of high-volume fly-ash cement pastes. Appl. Surf. Sci. 2010, 257, 762–768. [Google Scholar] [CrossRef]
- Aili, A.; Maruyama, I. Review of Several Experimental Methods for Characterization of Micro- and Nano-Scale Pores in Cement-Based Material. Int. J. Concr. Struct. Mater. 2020, 14, 55. [Google Scholar] [CrossRef]
- Zhou, Z.-M.; Cheng, Z.-M.; Li, Z.; Yuan, W.-K. Determination of effectiveness factor of a partial internal wetting catalyst from adsorption measurement. Chem. Eng. Sci. 2004, 59, 4305–4311. [Google Scholar] [CrossRef]
- Zhang, A.; Ge, Y.; Yang, W.; Wang, G. New insight of solvent-replacement-induced damage to pores of cement stone by comparison with 1H NMR relaxometry, mercury intrusion porosimetry, and nitrogen adsorption. Constr. Build. Mater. 2023, 409, 133981. [Google Scholar] [CrossRef]
- Tanaka, S.; Sakai, Y. Estimation of actual pore-size distribution by inverse analysis of mercury intrusion. Constr. Build. Mater. 2023, 366, 130208. [Google Scholar] [CrossRef]
- Tibbetts, C.M.; Tao, C.; Paris, J.M.; Ferraro, C.C. Mercury intrusion porosimetry parameters for use in concrete penetrability qualification using the Katz-Thompson relationship. Constr. Build. Mater. 2020, 263, 119834. [Google Scholar] [CrossRef]
- Wang, Y.; Diamond, S. A fractal study of the fracture surfaces of cement pastes and mortars using a stereoscopic SEM method. Cem. Concr. Res. 2001, 31, 1385–1392. [Google Scholar] [CrossRef]
- Li, S.; Chao, W.; Li, W.; Cheng, J.; Yuan, B. Study on the effect of nanosilica suspension on the properties of cement-based grouts. Mater. Sci. 2022, 40, 171–182. [Google Scholar] [CrossRef]
- Zhang, L.; Dang, F.; Ding, W.; Zhu, L. Quantitative Study of Concrete Mesoscopic Damage Based on the Improved Differential Box Counting Method. J. Basic Sci. Eng. 2021, 29, 973–985. [Google Scholar]
- Zheng, D.; Song, W.; Fu, J.; Xue, G.; Li, J.; Cao, S. Research on mechanical characteristics, fractal dimension and internal structure of fiber reinforced concrete under uniaxial compression. Constr. Build. Mater. 2020, 258, 120351. [Google Scholar] [CrossRef]
- Lu, Q.; Qiu, Q.; Zheng, J.; Wang, J.; Zeng, Q. Fractal dimension of concrete incorporating silica fume and its correlations to pore structure, strength and permeability. Constr. Build. Mater. 2019, 228, 116986. [Google Scholar] [CrossRef]
- Jin, S.; Zhang, J.; Han, S. Fractal analysis of relation between strength and pore structure of hardened mortar. Constr. Build. Mater. 2017, 135, 1–7. [Google Scholar] [CrossRef]
- Tang, S.; Huang, J.; Duan, L.; Yu, P.; Chen, E. A review on fractal footprint of cement-based materials. Powder Technol. 2020, 370, 237–250. [Google Scholar] [CrossRef]
- Wen, H.J.; Peng, D.Y.; Wang, Z.J.; Gao, L.C. Application and development of fractal theory in the field of material science. J. Iron Steel Res. 2000, 12, 70–73. [Google Scholar]
- Altun, I.; Sahin, H.; Aslantas, M. A new approach to fractals via best proximity point. Chaos Solitons Fractals 2021, 146, 110850. [Google Scholar] [CrossRef]
- Guo, W.; Qin, H.; Chen, H.; Sun, W. Fractal theory and its applications in the study of concrete materials. J. Chin. Ceram. Soc. 2010, 38, 1362–1368. [Google Scholar]
- Liu, J. A novel computational approach for fractal nonlinear pochhammer-chree model. Fractals 2022, 30, 2250159. [Google Scholar] [CrossRef]
- Wang, K.-L.; Yao, S.-W.; Liu, Y.-P.; Zhang, L.-N. A fractal variational principle for the telegraph equation with fractal derivatives. Fractals 2020, 28, 2050058. [Google Scholar] [CrossRef]
- Zhang, P.; Gao, Z.; Shi, Y.; Lin, Y.; Li, J. Effect of large broken stone content on properties of roller compacted concrete based on fractal theory. Constr. Build. Mater. 2020, 262, 120821. [Google Scholar] [CrossRef]
- Duan, Q.; An, J.; Mao, H.; Liang, D.; Li, H.; Wang, S.; Huang, C. Review about the Application of Fractal Theory in the Research of Packaging Materials. Materials 2021, 14, 860. [Google Scholar] [CrossRef] [PubMed]
- Chu, H.; Ren, F.; Zheng, Z.; Gu, M. Study on granularity distribution of powder by fractal models. Fractals 2017, 25, 1740009. [Google Scholar] [CrossRef]
- Wu, W.; Liu, T.; Cha, Y. Application analysis of domestic laser particle size analyzer. Express Water Resour. Hydropower Inf. 2024, 1–7. [Google Scholar]
- Li, X.; Xie, K.; Huang, Z.; Zeng, H. Development and prospect of technique for laser particle size analyzer. Acta Petrol. Sin. 2009, 25, 146–148. [Google Scholar]
- Ding, G.; Chen, K. Application of laser particle size analyzer in the grain-size analysis of special soils. J. Yangtze River Sci. Res. Inst. 2023, 40, 1–8. [Google Scholar]
- Chen, J. Experimental study on the measurement of ultra-fine coal size. Rock Miner. Anal. 2004, 39, 183–186. [Google Scholar]
- Liu, S.; Zhang, Z.; Pan, Z.; Qu, Z. Introduction of laser particle size analyzer structure and characteristics. China Instrum. 2012, 32, 63–66. [Google Scholar]
- Rao, S.M.; Acharya, I.P. Mercury intrusion porosimetry studies with geopolymers. Indian Geotech. J. 2017, 47, 495–502. [Google Scholar] [CrossRef]
- Dewitt, G.; Glass, H.J. Reliability and reproducibility of mercury intrusion porosimetry. J. Eur. Ceram. Soc. 1997, 17, 753–757. [Google Scholar]
- Cebeci, O.Z. The intrusion of conical and spherical pores in mercury intrusion porosimetry. J. Colloid Interface Sci. 1980, 78, 383–388. [Google Scholar] [CrossRef]
- Winslow, D.N. The validity of high pressure mercury intrusion porosimetry. J. Colloid Interface Sci. 1978, 67, 42–47. [Google Scholar] [CrossRef]
- Abell, A.; Willis, K.; Lange, D. Mercury intrusion porosimetry and image analysis of cement-based materials. J. Colloid Interface Sci. 1999, 211, 39–44. [Google Scholar] [CrossRef]
- Zeng, Q.; Li, K.; Fen-Chong, T.; Dangla, P. Pore structure of cement pastes through NAD and MIP analysis. Adv. Cem. Res. 2016, 28, 23–32. [Google Scholar] [CrossRef]
- Meng, J.; Wang, Y.; Zhang, Q.; Ye, G.; Zhou, X. Pore network model of low-temperature nitrogen adsorption-desorption in mesoporous materials. CIESC J. 2023, 74, 893–903. [Google Scholar]
- Aligizaki, K.K.; Cady, P.D. Air content and size distribution of air voids in hardened cement pastes using the section-analysis method. Cem. Concr. Res. 1999, 29, 273–280. [Google Scholar] [CrossRef]
- Bentz, D.P. Capillary porosity depercolation/repercolation in hydrating cement pastes via low-temperature calorimetry measurements and CEMHYD3D modeling. J. Am. Ceram. Soc. 2006, 89, 2606–2611. [Google Scholar] [CrossRef]
- Ridi, F.; Luciani, P.; Fratini, E.; Baglioni, P. Water confined in cement pastes as a probe of cement microstructure evolution. J. Phys. Chem. B. 2009, 113, 3080–3087. [Google Scholar] [CrossRef] [PubMed]
- Vollet, D.R.; Donatti, D.A.; Ruiz, A.I.; Gatto, F.R. Mass fractal characteristics of wet sonogels as determined by small-angle X-ray scattering and differential scanning calorimetry. Phys. Rev. B. 2006, 74, 024208. [Google Scholar] [CrossRef]
- Ridi, F.; Fratini, E.; Baglioni, P. Fractal structure evolution during cement hydration by differential scanning calorimetry: Effect of organic additives. J. Phys. Chem. C. 2013, 117, 25478–25487. [Google Scholar] [CrossRef]
- Ishikiriyama, K.; Todoki, M.; Motomura, K. Pore size distribution (PSD) measurements of silica-gels by means of differential scanning calorimetry optimization for determination of PSD. J. Colloid Interface Sci. 1995, 171, 92–102. [Google Scholar] [CrossRef]
- Irico, S.; Gastaldi, D.; Canonico, F.; Magnacca, G. Investigation of the microstructural evolution of calcium sulfoaluminate cements by thermoporometry. Cem. Concr. Res. 2013, 53, 239–247. [Google Scholar] [CrossRef]
- Friel, J.; Pande, C. A direct determination of fractal dimension of fracture surfaces using scanning electron-microscopy and stereoscopy. J. Mater. Res. 1993, 8, 100–104. [Google Scholar] [CrossRef]
- Zhang, M.; Jivkov, A.P. Micromechanical modelling of deformation and fracture of hydrating cement paste using X-ray computed tomography characterisation. Compos. B Eng. 2016, 88, 64–72. [Google Scholar] [CrossRef]
- Zhou, J.; He, X.; Zhang, L. CT characteristic analysis of sea-sand concrete exposed in simulated marine environment. Constr. Build. Mater. 2021, 268, 121170. [Google Scholar] [CrossRef]
- Nitka, M.; Tejchman, J. A three-dimensional meso-scale approach to concrete fracture based on combined DEM with X-ray CT images. Cem. Concr. Res. 2018, 107, 11–29. [Google Scholar] [CrossRef]
- Skarzynski, L.; Tejchman, J. Experimental investigations of damage evolution in concrete during bending by continuous micro-CT scanning. Mater. Charact. 2019, 154, 40–52. [Google Scholar] [CrossRef]
- Shang, X.Y.; Yang, J.W.; Li, J.S. Fractal characteristics of meso-failure crack in recycled coarse aggregate concrete based on CT image. Acta Mater. Compos. Sin. 2020, 37, 1774–1784. [Google Scholar]
- Su, W.; Chen, S. Error-corrected fringe discrimination using nonary-encoded patterns for phase-shifting projected fringe profilometry. Opt. Lasers Eng. 2021, 141, 106554. [Google Scholar] [CrossRef]
- Mechtcherine, V. Fracture mechanical behavior of concrete and the condition of its fracture surface. Cem. Concr. Res. 2009, 39, 620–628. [Google Scholar] [CrossRef]
- Ficker, T. Fractal strength of cement gels and universal dimension of fracture surfaces. Theor. Appl. Fract. Mech. 2008, 50, 167–171. [Google Scholar] [CrossRef]
- Wilson, T.; Masters, B.R. Confocal microscopy—Introduction. Appl. Opt. 1994, 33, 565–566. [Google Scholar] [CrossRef]
- Pacheco, S.; Liang, R. Multifocal confocal spectral microscope. In Proceedings of the Conference on Design and Quality for Biomedical Technologies VIII, San Francisco, CA, USA, 7–8 February 2015. [Google Scholar]
- Zhang, Y.; Kong, X.; Gao, L.; Bai, Y. Characterization of the mesostructural organization of cement particles in fresh cement paste. Constr. Build. Mater. 2016, 124, 1038–1050. [Google Scholar] [CrossRef]
- Yu, K.; Zheng, Z.S. Fractal study on granularity distribution of powder. Mater. Sci. Eng. 1995, 13, 30–34. [Google Scholar]
- Neimark, A. A new approach to the determination of the surface fractal dimension of porous solids. Phys. A 1992, 191, 258–262. [Google Scholar] [CrossRef]
- Jaroniec, M. Evaluation of the fractal dimension from a single adsorption-isotherm. Langmuir 1995, 11, 2316–2317. [Google Scholar] [CrossRef]
- Tang, S.; He, Z.; Cai, X.; Cai, R.; Zhou, W.; Li, Z.; Shao, H.; Wu, T.; Chen, E. Volume and surface fractal dimensions of pore structure by NAD and LT-DSC in calcium sulfoaluminate cement pastes. Constr. Build. Mater. 2017, 143, 395–418. [Google Scholar] [CrossRef]
- Liang, M.; Yang, S.; Miao, T.; Yu, B. Analysis of electroosmotic characters in fractal porous media. Chem. Eng. Sci. 2015, 127, 202–209. [Google Scholar] [CrossRef]
- Ji, X.; Chan, S.; Feng, N. Fractal model for simulating the space-filling process of cement hydrates and fractal dimensions of pore structure of cement-based materials. Cem. Concr. Res. 1997, 27, 1691–1699. [Google Scholar] [CrossRef]
- Han, X.; Wang, B.; Feng, J. Relationship between fractal feature and compressive strength of concrete based on MIP. Constr. Build. Mater. 2022, 322, 126504. [Google Scholar] [CrossRef]
- Yu, B.; Cheng, P. A fractal permeability model for bi-dispersed porous media. Int. J. Heat Mass Transf. 2002, 45, 2983–2993. [Google Scholar] [CrossRef]
- Yu, P.; Duan, Y.H.; Chen, E.; Tang, S.W.; Wang, X.R. Microstructure-based fractal models for heat and mass transport properties of cement paste. Int. J. Heat Mass Transf. 2018, 126, 432–447. [Google Scholar] [CrossRef]
- Cao, T.; Wang, W.; Tighe, S.; Wang, S. Crack image detection based on fractional differential and fractal dimension. IET Comput. Vis. 2019, 13, 79–85. [Google Scholar] [CrossRef]
- Tang, M.; Ba, H. Study on fractal characteristics and activity of superfine fly ash. Mater. Sci. Technol. 2002, 10, 89–92. [Google Scholar]
- Moskovits, M. The fractal nature of particle-size distributions of ground clinker. Cem. Concr. Res. 1990, 20, 499–505. [Google Scholar] [CrossRef]
- Zhang, B.; Li, S. Determination of the surface fractal dimension for porous-media by mercury porosimetry. Ind. Eng. Chem. Res. 1995, 34, 1383–1386. [Google Scholar] [CrossRef]
- Pfeifer, P.; Avnir, D. Chemistry in noninteger dimensions between 2 and 3 fractal theory of heterogeneous surfaces. J. Chem. Phys. 1983, 79, 3558–3565. [Google Scholar] [CrossRef]
- Avnir, D.; Jaroniec, M. An isotherm equation for adsorption on fractal surfaces of heterogeneous porous materials. Langmuir 1989, 5, 1431–1433. [Google Scholar] [CrossRef]
- Lan, X.-L.; Zeng, X.-H.; Zhu, H.-S.; Long, G.-C.; Xie, Y.-J. Experimental investigation on fractal characteristics of pores in air-entrained concrete at low atmospheric pressure. Cem. Concr. Compos. 2022, 130, 104509. [Google Scholar] [CrossRef]
- Li, L.; Li, Z.; Cao, M.; Tang, Y.; Zhang, Z. Nanoindentation and porosity fractal dimension of Calcium Carbonate Whisker reinforced cement paste after elevated temperatures (up to 900 °C). Fractals 2021, 29, 2140001. [Google Scholar] [CrossRef]
- Zarnaghi, V.N.; Fouroghi-Asl, A.; Nourani, V.; Ma, H. On the pore structures of lightweight self-compacting concrete containing silica fume. Constr. Build. Mater. 2018, 193, 557–564. [Google Scholar] [CrossRef]
- Zhuang, N.; Dong, H.; Zhou, Y.; Chen, D. Cracking behavior of reinforced concrete piles externally bonded with carbon fiber reinforced polymer in a marine environment. Constr. Build. Mater. 2018, 190, 1154–1162. [Google Scholar] [CrossRef]
- Yin, Y.; Ren, Q.; Shen, L.; Han, Y. Study on crack propagation and damage evolution process of concrete based on fractal dimension. J. Hydraul. Eng. ASCE 2021, 52, 1270–1280. [Google Scholar]
- Erdem, S.; Blankson, M.A. Fractal-fracture analysis and characterization of impact-fractured surfaces in different types of concrete using digital image analysis and 3D nanomap laser profilometery. Constr. Build. Mater. 2013, 40, 70–76. [Google Scholar] [CrossRef]
- Ficker, T. Fracture surfaces and compressive strength of hydrated cement pastes. Constr. Build. Mater. 2012, 27, 197–205. [Google Scholar] [CrossRef]
- Erdem, S.; Hanbay, S.; Blankson, M.A. Self-sensing damage assessment and image-based surface crack quantification of carbon nanofibre reinforced concrete. Constr. Build. Mater. 2017, 134, 520–529. [Google Scholar] [CrossRef]
- Szelag, M. Fractal characterization of thermal cracking patterns and fracture zone in low-alkali cement matrix modified with microsilica. Cem. Concr. Compos. 2020, 114, 103732. [Google Scholar] [CrossRef]
- Li, L.; Sun, H.-X.; Zhang, Y.; Yu, B. Surface cracking and fractal characteristics of bending fractured polypropylene fiber-reinforced geopolymer mortar. Fractal Fract. 2021, 5, 142. [Google Scholar] [CrossRef]
- Liu, J.; Jiang, R.; Sun, J.; Shi, P.; Yang, Y. Concrete damage evolution and three-dimensional reconstruction by integrating CT test and fractal theory. J. Mater. Civ. Eng. 2017, 29, 04017122. [Google Scholar] [CrossRef]
- Li, Z.; Hao, P.; Liu, H.; Xu, J. Effect of cement on the strength and microcosmic characteristics of cold recycled mixtures using foamed asphalt. J. Clean. Prod. 2019, 230, 956–965. [Google Scholar] [CrossRef]
- Zhu, D.; Tang, A.; Wan, C.; Zeng, Y.; Wang, Z. Investigation on the flexural toughness evaluation method and surface cracks fractal characteristics of polypropylene fiber reinforced cement-based composites. J. Build. Eng. 2021, 43, 103045. [Google Scholar] [CrossRef]
- Na, J.; Jia, G.; Wei, W.; Jun, W. Three-dimensional characterization of wood surface roughness with improved differential Box-counting. J. Northeast For. Univ. 2019, 47, 76–80. [Google Scholar]
- Sarkar, N.; Chaudhuri, B. An efficient differential box-counting approach to compute fractal dimension of image. IEEE Trans. Syst. Man Cybern. 1994, 24, 115–120. [Google Scholar] [CrossRef]
- Peng, J.; Wu, Z.; Zhao, G. Fractal analysis of fracture in concrete. Theor. Appl. Fract. Mech. 1997, 27, 135–140. [Google Scholar] [CrossRef]
- Santos, S.F.; Rodrigues, J.D.A. Correlation between fracture toughness, work of fracture and fractal dimensions of Alumina-mullite-zirconia composites. Mater. Res. 2003, 6, 219–226. [Google Scholar] [CrossRef]
- Mecholsky, J.J., Jr. Estimating theoretical strength of brittle materials using fractal geometry. Mater. Lett. 2006, 60, 2485–2488. [Google Scholar] [CrossRef]
- Zhang, P.; Sun, X.; Wei, J.; Wang, J.; Gao, Z. Influence of PVA fibers on the durability of cementitious composites under the wet-heat-salt coupling environment. Rev. Adv. Mater. Sci. 2023, 62, 20230155. [Google Scholar] [CrossRef]
- Li, Y.; Wang, P.; Wang, F.; Zheng, X.; Gao, Y. Compressive strength and composite pore structure parameters of iron ore tailings ball concrete. Constr. Build. Mater. 2022, 347, 128611. [Google Scholar] [CrossRef]
- Wang, L.; Jin, M.; Wu, Y.; Zhou, Y.; Tang, S. Hydration, shrinkage, pore structure and fractal dimension of silica fume modified low heat Portland cement-based materials. Constr. Build. Mater. 2021, 272, 121952. [Google Scholar] [CrossRef]
- Wang, L.; Jin, M.M.; Guo, F.X.; Wang, Y.; Tang, S.W. Pore structural and fractal analysis of the influence of fly ash and silica fume on the mechanical property and abrasion resistance of concrete. Fractals 2021, 29, 2140003. [Google Scholar] [CrossRef]
- Sun, J.; Wen, Z.H.; Liao, H.F. Investigation on compressive strength of fiber reinforced concrete subjected to the coupling effects of freeze-thaw cycling and loading utilizing fractal theory. Acta Mater. Compos. Sin. 2024, 34, 1–10. [Google Scholar]
- Volchuk, V.M.; Kotov, M.A. Fractal express methods evaluation of a breaking stress of concrete. J. Phys. Conf. Ser. 2021, 1926, 012023. [Google Scholar] [CrossRef]
- Yang, X.; Li, L.; Dai, H.; Jia, M. Effect of fractal dimension in concrete meso-Structure on its axial mechanical behavior: A numerical case study. Fractals 2021, 29, 2140011. [Google Scholar] [CrossRef]
- Abdeldjalil, M.; Chouicha, K. Effect of the cement-to-water ratio and fractal granular model on the prediction of concretes compressive strength. Int. J. Concr. Struct. Mater. 2022, 16, 43. [Google Scholar] [CrossRef]
- Jin, S.; Zheng, G.; Yu, J. A micro freeze-thaw damage model of concrete with fractal dimension. Constr. Build. Mater. 2020, 257, 119434. [Google Scholar] [CrossRef]
- Sun, H.R.; Zou, C.X.; Xue, H.J.; Zhao, Q.; Wu, J. Fractal characteristics of dry-wet and freeze-thaw erosion pore structure of mold-bag concrete. J. Build. Mater. 2022, 25, 124–130. [Google Scholar]
- Li, J.; Wang, F.; Yi, F.; Ma, J.; Lin, Z. Fractal analysis of the fracture evolution of freeze-thaw damage to asphalt concrete. Materials 2019, 12, 2288. [Google Scholar] [CrossRef] [PubMed]
- Wang, L.; Song, X.; Yang, H.; Wang, L.; Tang, S.; Wu, B.; Mao, W. Pore structural and fractal analysis of the effects of MgO reactivity and dosage on permeability and F-T resistance of concrete. Fractal Fract. 2022, 6, 113. [Google Scholar] [CrossRef]
- Ding, X.; Liang, X.; Zhang, Y.; Fang, Y.; Zhou, J.; Kang, T. Capillary water absorption and micro pore connectivity of concrete with fractal analysis. Crystals 2020, 10, 892. [Google Scholar] [CrossRef]
- Shao, J.; Zhu, H.; Haruna, S.I.; Xue, G. Durability and Fractal Analysis of Pore Structure of Crumb Rubber Concrete Modified with Carbon Nanotubes. Arab. J. Sci. Eng. 2023, 48, 12959–12976. [Google Scholar] [CrossRef]
- Zhang, G.; Chen, Y.; Lu, H.; Li, X. Fractal characteristics of fiber lithium slag concrete cracks under sulfate attack. Chin. J. Eng. 2022, 44, 208–216. [Google Scholar]
- Ji, H.; Jiang, H.; Zhao, R.; Tian, Y.; Jin, X.; Jin, N.; Tong, J. Fractal characteristics of corrosion-induced cracks in reinforced concrete. Materials 2020, 13, 3715. [Google Scholar] [CrossRef] [PubMed]
- Xiao, J.; Qu, W.; Jiang, H.; Dong, W. Three-dimensional fractal characterization of concrete surface subjected to sulfuric acid attacks. J. Nondestruct. Eval. 2020, 39, 57. [Google Scholar] [CrossRef]
- Xiao, J.; Long, X.; Li, L.; Jiang, H.; Zhang, Y.; Qu, W. Study on the influence of three factors on mass loss and surface fractal dimension of concrete in sulfuric acid environments. Fractal Fract. 2021, 5, 146. [Google Scholar] [CrossRef]
- Li, L.; Zhang, Y.; Shi, Y.; Xue, Z.; Cao, M. Surface cracking and fractal characteristics of cement paste after exposure to high temperatures. Fractal Fract. 2022, 6, 465. [Google Scholar] [CrossRef]
- Boukli Hacene, S.M.A.; Ghomari, F.; Schoefs, F.; Khelidj, A. Probabilistic modelling of compressive strength of concrete using response surface methodology and neural networks. Arab. J. Sci. Eng. 2014, 39, 4451–4460. [Google Scholar] [CrossRef]
- Jin, S.; Zhang, J.; Chen, C.; Chen, W. Study of pore fractal characteristic of cement mortar. J. Build. Mater. 2011, 14, 92–97, 105. [Google Scholar]
- Ding, C.; Xu, T.; Chen, Q.; Su, C.; Zhao, P. Study on the Relationship between Fractal Characteristics and Mechanical Properties of Tensile Fracture of Reinforced Concrete Structures. KSCE J. Civ. Eng. 2022, 26, 2225–2233. [Google Scholar] [CrossRef]
- Şahmaran, M.; Özbay, E.; Yücel, H.E.; Lachemi, M.; Li, V.C. Frost resistance and microstructure of engineered cementitious composites: Influence of fly ash and micro poly-vinyl-alcohol fiber. Cem. Concr. Compos. 2012, 34, 156–165. [Google Scholar] [CrossRef]
- Gao, P.-W.; Wu, S.-X.; Lin, P.-H.; Wu, Z.-R.; Tang, M.-S. The characteristics of air void and frost resistance of RCC with fly ash and expansive agent. Constr. Build. Mater. 2006, 20, 586–590. [Google Scholar] [CrossRef]
- Li, L.; He, Z.; Liu, W.; Hu, C. A study on the application of rock asphalt from Sichuan China based on anti-rutting performance. Appl. Sci. 2019, 9, 870. [Google Scholar] [CrossRef]
- Teltayev, B.B.; Rossi, C.O.; Izmailova, G.G.; Amirbayev, E.D. Effect of freeze-thaw cycles on mechanical characteristics of bitumens and stone mastic asphalts. Appl. Sci. 2019, 9, 458. [Google Scholar] [CrossRef]
- Neville, A. Consideration of durability of concrete structures: Past, present, and future. Mater. Struct. 2001, 34, 114–118. [Google Scholar] [CrossRef]
- Basheer, L.; Cleland, D.J. Durability and water absorption properties of surface treated concretes. Mater. Struct. 2011, 44, 957–967. [Google Scholar] [CrossRef]
- Chen, Y.; Cen, G.; Cui, Y. Comparative study on the effect of synthetic fiber on the preparation and durability of airport pavement concrete. Constr. Build. Mater. 2018, 184, 34–44. [Google Scholar] [CrossRef]
- Zhao, X.-L.; Wei, J.; Liu, Z.-K. Durability of concrete under multi-damage action. J. Wuhan Univ. Technol. Mat. Sci. Ed. 2004, 19, 73–75. [Google Scholar] [CrossRef]
- Zheng, J.-J.; Wong, H.S.; Buenfeld, N.R. Assessing the influence of ITZ on the steady-state chloride diffusivity of concrete using a numerical model. Cem. Concr. Res. 2009, 39, 805–813. [Google Scholar] [CrossRef]
- Ding, Y.; Ma, Y.; Hao, X. Investigation on effect of crack geometry on permeability of fiber/concrete based on fractal theory. Acta Mater. Compos. Sin. 2020, 37, 2908–2916. [Google Scholar]
- Katz, A.J.; Thompson, A.H. Quantitative prediction of permeability in porous rock. Phys. Rev. B 1986, 34, 8179–8181. [Google Scholar] [CrossRef]
- Fan, Y.F.; Hu, Z.Q.; Zhang, Y.Z.; Liu, J.L. Deterioration of compressive property of concrete under simulated acid rain environment. Constr. Build. Mater. 2010, 24, 1975–1983. [Google Scholar] [CrossRef]
- Xiao, J.; Long, X.; Qu, W.; Li, L.; Jiang, H.; Zhong, Z. Influence of sulfuric acid corrosion on concrete stress-strain relationship under uniaxial compression. Measurement 2022, 187, 110318. [Google Scholar] [CrossRef]
- Su, J.; Zhang, P.; Guo, J.; Zheng, Y. Effect of PVA fibers on durability of nano-SiO2 reinforced cement-based composites subjected to wet-thermal and chloride salt-coupled environment. Nanotechnol. Rev. 2023, 12, 20230140. [Google Scholar] [CrossRef]
- Wang, L.; Bao, J. Investigation on chloride penetration into unsaturated concrete under short-term sustained tensile loading. Mater. Struct. 2017, 50, 227. [Google Scholar] [CrossRef]
- Xu, Y.; Qian, C.; Bian, L.; Chen, Y. Fractal based characterization of nonuniform corroded surface profile in steel bars. J. Basic Sci. Eng. 2012, 20, 296–303. [Google Scholar]
- Kristoffersen, M.; Minoretti, A.; Børvik, T. On the internal blast loading of submerged floating tunnels in concrete with circular and rectangular cross-sections. Eng. Fail. Anal. 2019, 103, 462–480. [Google Scholar] [CrossRef]
- Georgali, B.; Tsakiridis, P.E. Microstructure of fire-damaged concrete. A case study. Cem. Concr. Compos. 2005, 27, 255–259. [Google Scholar] [CrossRef]
- Fernandes, B.; Gil, A.M.; Bolina, F.L.; Tutikian, B.F. Microstructure of concrete subjected to elevated temperatures: Physico-chemical changes and analysis techniques. IBRACON Struct. Mater. J. 2017, 10, 838–863. [Google Scholar] [CrossRef]
- Fan, Y.N.; Du, H.X.; Shi, L.N. The fractal characteristics of C80 high performance concrete pore structure subject to high temperatures. In Proceedings of the 4th International Workshop on Renewable Energy and Development (IWRED), Electr Network, Sanya, China, 24–26 April 2020; Volume 510. [Google Scholar]
- Xie, H. The fractal effect of irregularity of crack branching on the fracture-toughness of brittle materials. Int. J. Fract. 1994, 65, R71–R75. [Google Scholar] [CrossRef]
Disclaimer/Publisher’s Note: The statements, opinions and data contained in all publications are solely those of the individual author(s) and contributor(s) and not of MDPI and/or the editor(s). MDPI and/or the editor(s) disclaim responsibility for any injury to people or property resulting from any ideas, methods, instructions or products referred to in the content. |
© 2024 by the authors. Licensee MDPI, Basel, Switzerland. This article is an open access article distributed under the terms and conditions of the Creative Commons Attribution (CC BY) license (https://creativecommons.org/licenses/by/4.0/).