Article

Assessing the Influence of Feedback Strategies on Errors in Crowdsourced Annotation of Tumor Images

1
User-Centric Analysis of Multimedia Data Research Group, Faculty of Electrical Engineering and Information Technology, Technische Universität Ilmenau, Gustav-Kirchhoff-Straße 1, 98693 Ilmenau, Germany
2
ScaleHub GmbH, Heidbergstraße 100, 22846 Norderstedt, Germany
3
Institute of Anatomy and Cell Biology, Faculty of Medicine, Julius-Maximilians-Universität Würzburg, Koellikerstraße 6, 97070 Würzburg, Germany
*
Authors to whom correspondence should be addressed.
Big Data Cogn. Comput. 2025, 9(9), 220; https://doi.org/10.3390/bdcc9090220
Submission received: 30 June 2025 / Revised: 6 August 2025 / Accepted: 18 August 2025 / Published: 26 August 2025

Abstract

Crowdsourcing enables the acquisition of distributed human intelligence for solving tasks involving human judgments in scalable ways, with many use cases in various application areas accessing human intelligence. However, crowdworkers completing the tasks may have limited or no background knowledge about the tasks they solve due to the plethora of various tasks available. Therefore, the tasks—even on a micro scale—also need to include appropriate training for the crowdworkers to enable them to complete them successfully. However, training crowdworkers efficiently in a short time for complex tasks poses a challenge and remains an unresolved issue. This paper addresses this challenge by empirically comparing different training strategies for crowdworkers and evaluating their impact on the crowdworkers’ task results. We perform comparisons between a basic training strategy, a strategy based on previous errors made by other crowdworkers, and the addition of instant feedback during training and task completion. Our results show that adding instant feedback during both the training phase and during the task yields more attention from the workers in difficult tasks and hence reduces errors and improves the results. We conclude that more attention is retained when the content of instant feedback includes information about mistakes made by other crowdworkers previously.

1. Introduction

Crowdsourcing leverages the aggregation of distributed individual contributions, offering a scalable alternative for tasks requiring human judgment. Distributing microtasks to a large online workforce enables organizations to achieve cost-effective results while providing workers with economic incentives. This paradigm of collective intelligence has gained widespread adoption in fields requiring extensive manual labeling or pattern recognition [1]. Crowdsourcing encourages anyone with a very large problem to divide it into very small units, called microtasks, each of which can be solved in a matter of minutes. In crowdsourcing, the person who offers microtasks and offers a reward in return takes on the role of the employer. Similarly, the person who takes on the microtask, solves it, and receives the reward takes on the role of a crowdworker [2]. A mutual benefit is expected since the crowdworkers are compensated for their labor, and the employers complete the work cost- and time-effectively [2]. Crowdsourcing has been shown to be a livelihood for many people around the world, with different levels of education. The high level of granularity of the microtasks has the subjacent effect of reusing the task template to, e.g., annotate different data points. Additionally, a single task might be replicated for quality control. Thus, many crowdworkers can solve many microtasks in parallel in a very short time, and a crowdworker can do more than one task. Therefore, crowdsourcing can be considered a scalable methodology.
Among other kinds of tasks, some of the most common tasks [3,4] range from data classification [5] and correcting inaccurate predictions of artificial intelligence (AI) models [6], to identifying different kinds of patterns in datasets or a target to search for [3]. In principle, these tasks can be solved by artificial intelligence algorithms. Indeed, computational techniques like the top-best-performance machine learning aim to automate the identification process [7]. For instance, artificial intelligence showed high performance for pattern recognition processes in general-purpose applications, such as identifying pedestrians [8], digitizing documents [9], or identifying license plates [10], to cite a few examples. However, there have been many remaining gaps [6] left by artificial intelligence algorithms, which have had to be filled by direct human intervention, or by the joint opinion of multiple human beings.
The performance of artificial intelligence models increases continuously, but the performance slope has flattened out and starts showing asymptotic behavior. In particular, some improvements in artificial intelligence model growth are not as rapid as before, due to its proximity to the upper limit, with the addition of many resources—data and computational capacity—involved in making this small change [11]. This situation occurs especially in very specific-purpose applications, such as clinical diagnosis. In clinical diagnosis as a field of application—where the result can determine treatment options or impact health and survival itself—the wide range of automation use cases is tremendous, since it is intended to eliminate a great burden on experts. However, current artificial intelligence models still do not show reliable results in pattern recognition in this field [12]. To mention one clinical application, advances have been made in the automatic detection of cancer [13] by identifying tumor cells in histological images. The identification of abnormalities in medical images—such as tumors in cancer diagnostics—is essential to support healthcare professionals in detecting symptoms. These image-based biomarkers not only aid clinical decision-making but also contribute to developing personalized alerts tailored to each patient.
Despite the advances in artificial intelligence, automated identification has not been fully achieved. Manual identification is still being conducted. Firstly, because artificial intelligence models need large amounts of data, either to train—estimate—parameters, e.g., supervised machine learning, or to test the effectiveness of inference in these models, as is the case with supervised and unsupervised machine learning. In this sense, in many use cases, the nature of which is very specific, such as in health [14], identification of diatoms for environmental biomarkers [15], or in solar panel identification [16], the availability of such data is very scarce. It happens because in many cases the data is not made publicly available. Secondly, there are still no tools that are easy-to-use by the public and can easily be used to create models and utilize them quickly. Therefore, automatically generating such data remains unresolved, often requiring trained annotators [17]. Another challenge is the limited access to sufficient resource capacity to support the aforementioned point, resulting in computational techniques lacking complete accuracy, thereby still requiring human labor [18]. Moreover, relying on small groups of annotators is risky since this might lead to subjective judgments and decreased accuracy due to a high workload. Finally, access to expert annotation sets is often limited and expensive. In other words, the creation or processing of data is, by itself, an increasingly large and high-demand problem. Crowdsourcing is faced as a viable alternative to mitigate these challenges, harnessing the collective efforts of a distributed workforce.
Hence, crowdsourcing has allowed companies to obtain data, in a scalable and effective way, according to their needs. It has also been shown that the collective intelligence of crowdsourcing has allowed very large problems to be solved by dividing tasks, with significant performance [19].
The development of crowdsourcing has brought with it various challenges which include the type of tasks to be performed [3], the presentation of the task, the type of rewards, the selection of crowdworkers [20], as well as the factors and motivations that influence each crowdworker. The importance of providing instructions has already been discussed through analyzing the way human beings weigh the instructions—i.e., expectations [21]—in terms of benefits [4]. It has been demonstrated that the guidance of crowdworkers through precise information is necessary [22]. For example, Yin et al. started the discussion about strategies of redaction [23] via weighting restrictive words. However, to the best of our knowledge, the influence of the content of training given to crowdworkers via errors, that is, the way in which crowdworkers learn, and what type of content they should be given, had not been previously analyzed. As mentioned above, the education levels of crowdworkers vary greatly. Even at higher education levels, crowdworkers are not prepared for tasks involving a highly specialized central subject matter, for example, tumor annotation. Until now, much of the responsibility for indicating what to do and how to do it falls to the employer. “How” the microtask should be performed is translated into a training package that must contain precise and concise information. Training should allow the crowdworkers to obtain the information necessary to perform the task, but this has to be conducted in an efficient way, as each microtask should not take too much time. Until now, ways to optimize the training of crowdworkers using previous results have not been analyzed. For instance, in the use case of annotation of medical data, recognizing histological patterns in cancer imagery typically stems from accumulated experience, rather than from the foundational knowledge acquired through standard medical education. Therefore, training crowdworkers for annotation in this context is a big challenge since only highly reliable annotated data can be considered meaningful [14,24].
We, therefore, present a training framework for crowdworkers, based on feedback from previous crowdworkers. Through different training strategies, we show the influence of various feedback mechanisms on the quality of work. First, we present a baseline training strategy, which simulates different training packages for in-production environments. Then, we present an optimized training strategy, a training package based on errors that other workers have frequently made. This paper is an extension of the work presented in [14], building upon its foundational concepts to explore further advancements. As a result of its further advancements, we also present the instant feedback training strategy, which, in addition to showing the errors previously committed by other crowdworkers, provides instant feedback based on error detection with a very small number of features. Our hypothesis is that, by exposing in the training of future crowdworkers the errors that previous crowdworkers made, the attention of the workers is captured, and it implies better performance from them.
Figure 1 illustrates the different training content approaches evaluated in this paper. In Study 1, we designed an initial version of the baseline training strategy for the crowdworkers.
We extracted the relevant scenarios related to technical issues and the typical error patterns workers revealed from the results of Study 1. This information was input for Study 2, in which this baseline version was repeated after removing all technical issues (BASTRAGY) and compared to an optimized version (OSTRAGY) and an instant-feedback version of the training strategy (INSTRAGY).
We use the identification of breast tumors in histological breast images as a use case; i.e., the microtask and the training content were around this topic. We present the results obtained using a comparative study of the three task versions and how optimization led to obtaining fewer erroneous results.

2. Related Work

2.1. Crowdsourcing for Supporting Artificial Intelligence (AI)

Crowdsourcing has been applied successfully to distribute labor, solving numerous problems by outsourcing the required workforce. Indeed, there are different common tasks available on commercial crowdsourcing platforms like Amazon Mechanical Turk (https://www.mturk.com (accessed 7 May 2025)) or Microworkers (https://www.microworkers.com (accessed 7 May 2025)). In particular, image annotation is a particularly common and preferred task that can be solved this way. This emerges from the fact that the use of crowdsourcing can successfully compensate for the sometimes still missing performance of Artificial Intelligence (AI) applications when processing raw data [17]. Mehta et al. [25] evaluated the performance of a Convolutional Neural Network (CNN) while varying the training data. In particular, the performance of the model trained with crowdsourced kidney scan data was not significantly different from the performance of the model trained with data annotated by experts. Moreover, the performance of models trained with the data combined by workers and experts was higher than any of the models trained separately with data from crowdworkers or experts.

2.2. Crowdsourcing for Supporting Medical Imaging and Media

Previous works showed that the specific ability to identify histologic patterns in oncology tissue imaging is developed with experience, rather than the basic understanding of histology from medical education [26]. However, experts are a rare resource and cannot be used to annotate large amounts of image data. Moreover, health-related professionals are not necessarily a guarantee for accurate identification of biomarkers in medical data. For instance, an experiment reported by Goldenberg et al. [27], where 270 crowdworkers took about 323 s to rate Ureterorenoscopy skills for 44 residents. Even with training material and didactic information provided, only 60% of residents’ ratings were accurate. The work of Mehta et al. also implies that laypeople can perfectly annotate medical images in certain circumstances [25]. This encourages our idea that each person can annotate any medical imaging after completing proper training.
Several works show the potential of using crowdsourcing to support medicine. Amgad et al. [28] asked participants to annotate tissue regions from Digital Slide Archive (DSA) [7] images, with high-accuracy results. Crowdsourcing has proven to deliver reliable results also in evaluating surgical skills [27,29,30], particularly in fields such as urology [31] and the analysis, e.g., annotation of regions or interpretation, of tissue DICOM® (Digital Imaging and Communications in Medicine Format) images [32]. Studies have achieved high-quality outcomes even when involving non-medical individuals [33]. A similar context of application outlines the work of Morozov et al. [32], who have used a workforce of expert radiologists to calculate the center of mass of tissue areas from DICOM images. Since the approach focused on developing automated detectors to optimize the accuracy of tumor shape approximations, the training dataset was gathered in a controlled environment. Whilst it is a dedicated goal of crowdsourcing workflows to support AI models by creating accurate annotated datasets, the typical workforce available does not contribute expert knowledge. It is therefore essential to implement rapid, fine-grained training protocols—almost atomic in nature—through which crowdworkers can quickly attain a minimal level of proficiency required to perform the tasks effectively.
Beyond supporting AI models through the generation of training data, or validating other algorithms [30], there are additional applications for crowdsourcing in medical contexts. For instance, when assessing surgical skills, the medical community often prefers human judgment over automated models, especially for high-stakes evaluations like graduation or board certification. Additionally, for evaluating the quality of microenvironment-targeted drugs in vascularized breast cancer spheroids [34]. Therefore, assessment from humans remains needed.

2.3. Reliable Answers in Evaluation of Medical Images

The training instructions for crowdworkers should concisely articulate the concerning task and encourage the workers to answer and contribute sincerely. Non-specialist crowdworkers seem to neglect cases where a best- or worst-grade rating is required as described by Conti et al. [31]. They uploaded videos to a specialized platform for scoring urology skills. They have found neither correlation among expert submissions, nor between expert and crowdworker submissions. Meanwhile, Paley et al. [35] have reported that crowdworkers do not replicate expert scores. The most important issue was the overestimation of technical competency. To address this, it may be necessary to re-train crowdworkers frequently—even the same worker after just two or three evaluations. This re-training should both correct technical misunderstandings and create an environment where workers feel comfortable providing honest assessments without holding back due to excessive modesty or worries of appearing critical. Additionally, identifying workers who display consistent patterns of modesty, like an error profile, could help exclude them from tasks that involve evaluating others’ work. Alternatively, additional task constraints could be implemented to reduce the influence of modesty on their judgments. Other results are presented by Rice et al. [26]. Although they were focused on video speed, they found correlations between rating videos at 1× and 2× speed with the obtained metrics for evaluating surgical skills, as well as section segments (despite the moderate correlation of the latter). This suggests that crowdworkers can contribute to annotating images in diverse and complex domains after receiving appropriate training. The same is reported by Amgad et al. [28], as they have mentioned the first hints of giving directed feedback, taking advantage of the real-time web-based tools.

2.4. Quality of Crowdsourcing Results

On the other hand, one key factor determining the accuracy of the results obtained is testing. Some microtasks include a test before the annotation task to assess a minimal level of understanding. Mehta et al. [25] have reported a correlation between experts and crowdworkers using two CNNs. The two CNNs were trained on data sets resulting from crowdworkers’ annotations and experts’ annotations, respectively. The researchers found correlations that were not significantly different between the tests performed using both models. They identified that a key factor is the number of tests completed by each crowdworker. While previous studies about testing skills used few tests or did not conduct them at all, Mehta et al. performed approximately 15–20 tests after the training phase. In the worst case, testing might be approached through trial and error, but even then, it still provides a way for workers to receive feedback on their performance. The problem arises when tasks are very complex; in such cases, the number of required tests would need to be high, while the correctness and quality of feedback remain poor, according to the findings discussed by Grote et al. [36]. Still, an active learning strategy for modifying the training content and advising about the most common errors may enhance the feedback and would make the task require fewer tests before the annotation phase. Grote et al. conducted an experiment of crowdworkers annotating cancer from histological images. They obtained poor results from workers annotating images of invasive tumors. They concluded that the poor results of the workers originated from images with low feature differentiation. The authors suggested modifying the task design in future iterations. However, they omitted to precisely state the necessary modifications. Still, the researchers concluded that high accuracy might be obtained when using crowdsourcing. The idea is to reduce the amount of very complex data that needs to be annotated by experts. Focusing on iterating over modified training material is a new concept not explored previously when considering images, and medical images particularly.
Low crowd performance may also stem from the challenging quality of the images rather than the crowd itself. While prior experience can be informative, it does not necessarily guarantee accurate insight into the crowd’s expertise or performance [29,30] which suggests an opportunity to provide immediate or near-immediate feedback. This aligns with the conclusions drawn by Rice et al. [26].
Other factors could enhance crowdsourcing accuracy, but with some limitations. Assigning crowdworkers to directly communicate with one another for instance might enable discussions in unclear cases and lead to better results based upon an agreement of workers after a short discussion. However, implementing such communication systems is difficult due to technical, time, or bandwidth reasons, especially on most commercial crowdsourcing platforms. Some participating crowdworkers are based in developing countries with scarce access to adequate devices [37,38].

2.5. The Way the Crowdworkers Are Trained

To ensure effective crowdworkers’ training, it is essential to minimize frustration and confusion [39]. The most important factor appears to be that tutorials and instructions are straightforward and easy to understand.
There has been an effort to establish ontological relationships among different tasks to create training content, as reported by Ashikawa et al. [40]. However, pre-learning tasks did not enhance the accuracy of low-quality workers facing low task motivation and concentration issues, as these issues might be highly dependent on the workers’ experience with previous tasks.
There is a need to train new crowdworkers or re-train existing workers after a few ratings to help them improve their rating quality and make them more objective. Alternatively, implementing stricter constraints during the task can help [26].
Grote et al. [36] evaluated histological image labeling using a crowd of medical students. One of their findings is the importance of a dedicated training phase to obtaining high-quality results. They highlight the need for a precise definition of terminology and categories. Further, they suggest that the training phase should be face-to-face or video-based teaching. However, this is not possible in microtasking use cases. As mentioned, lower crowd performance may, in some cases, be more attributable to the complexity or quality of the images than to limitations of the crowdworkers [29,30]. Therefore, one option is to provide instant or near-instant feedback [26]. Previous works have discussed different types of feedback that the crowdworkers could receive. Prior research by Sanyal and Ye [41] has highlighted the importance of feedback types in shaping task performance, yet this study distinguishes between outcome and process feedback in the context of crowdsourcing contests. By analyzing over 1.4 million submissions, the authors show that process feedback fosters convergence while outcome feedback promotes solution diversity. However, a key limitation is that the analysis focuses solely on the public rather than on instant textual feedback. Also, focusing on the crowdworker training material, frustration, and incomprehension should be avoided [42]. As the most crucial factor for this, the comprehensibility of the tutorial and the instructions should be ensured.
We identified a gap that has not been reported to our knowledge: the need for training that focuses on prior errors. By categorizing the mistakes made by crowdworkers into groups based on patterns, we could develop more effective training content. Therefore, this paper aims to enhance the accuracy of medical image tag analysis by optimizing the training phase of the corresponding crowdsourcing campaign. It focuses on identifying common error patterns made by crowdworkers, an area previously overlooked. By categorizing these errors, we can create more effective training content.
The next sections provide information about the dataset utilized, the task design, the campaign, and the results obtained from it. Furthermore, how the specific use case of annotating histological images has an impact on the task design is explained.

3. Materials and Methods

We employ the use case of tumor annotation from histologic images for evaluating the training approaches. First, we will describe the dataset in detail. Then, the annotation tool and the types of training strategies will be described.

3.1. Dataset

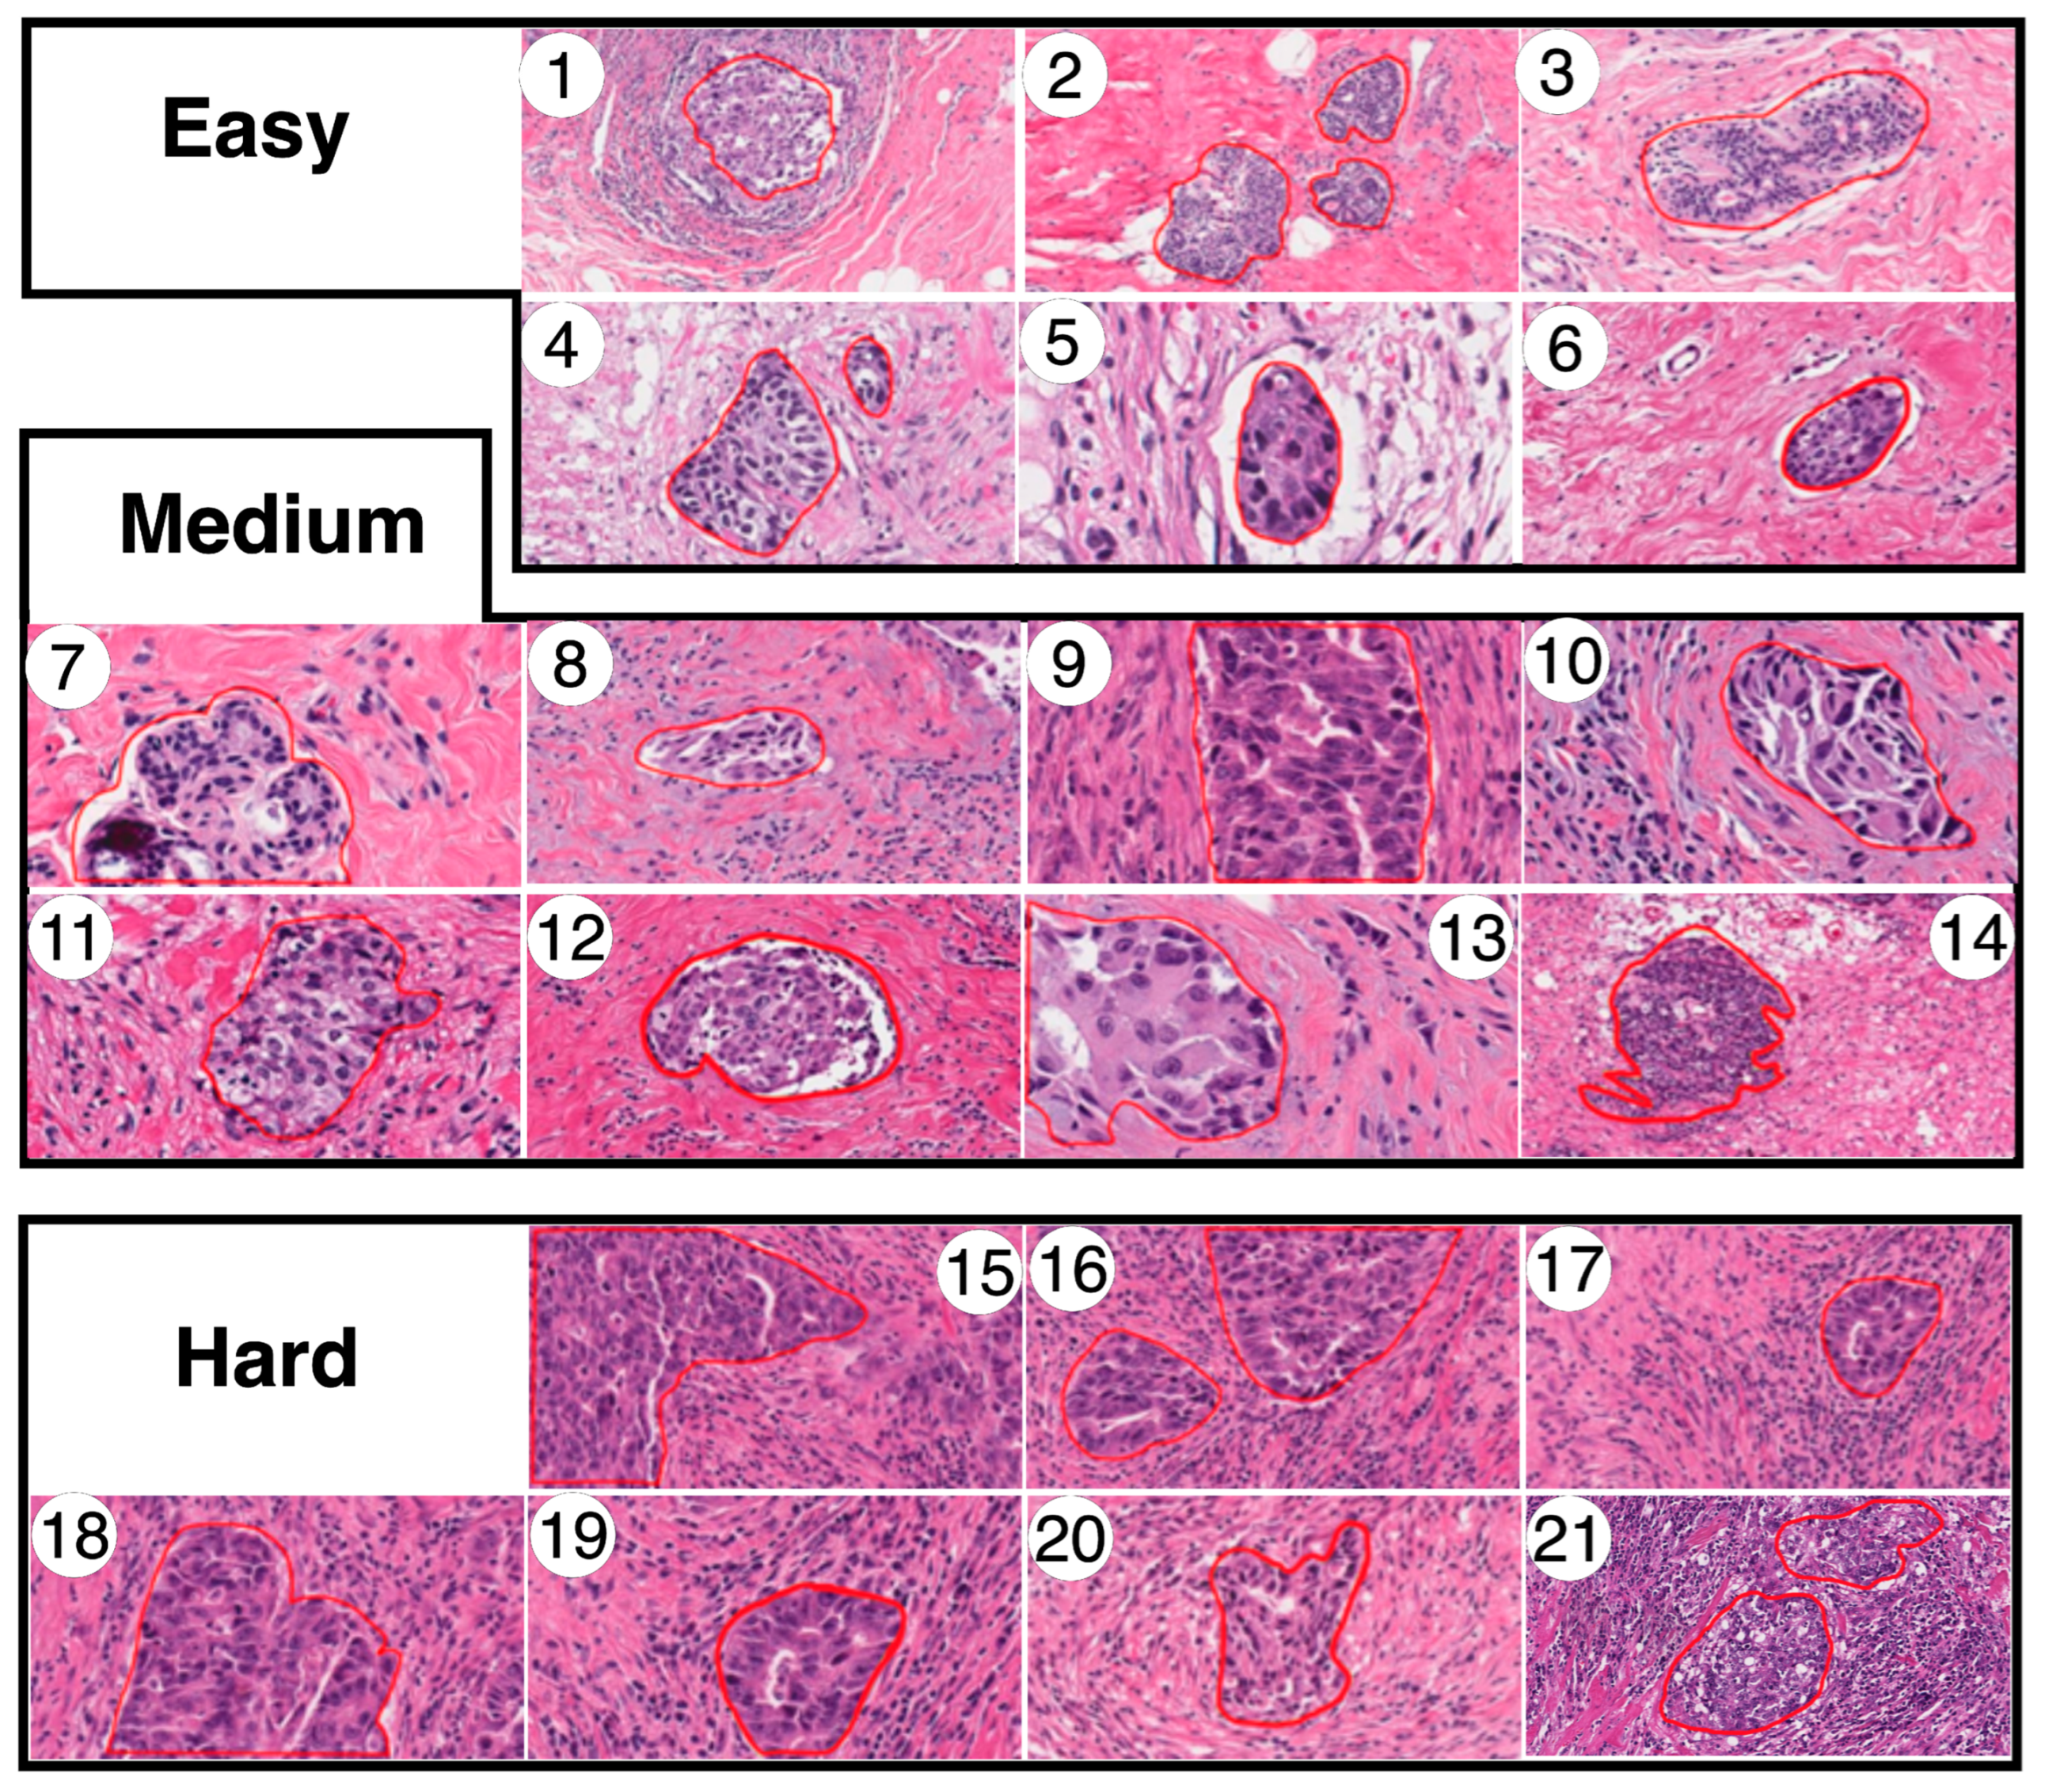
The dataset was extracted from the DSA [7]. Images in this dataset are annotated with different classes, not only tumors, but also blood and lymphocytic structures, which have their respective classes. We have extracted subsets from the dataset for our study, focusing only on the tumor zones. Of course, due to the nature of the histomics, instances of other classes could also be presented. Following the schema from [14], we classified images into three different levels of difficulty. This classification was not disclosed to the crowdworkers in the subsequent study. The difficulty levels are determined by
  • Easy: The tumor is enhanced over all the structures around it. Typically, white zones are near and delimit the specific tumor zone.
  • Medium: The tumor could be dispersed over all the structures around it. Nevertheless, there are other related structures which appear to be like tumors in other locations of the image, but the actual measurement has not classified them.
  • Hard: The tumor is very difficult to discern over all the structures around it. Frequently, there are thick or even no white zones delimiting the tumor zone. For instance, there are numerous lymphocytic structures visible in the image.
Figure 2 shows the dataset with the ground truth (GT) and its classified level of difficulty.
We used a crowdsourcing campaign on a commercial crowdsourcing platform to collect annotations. To show the images and enable their annotations, a web application was developed. The web application also implemented a standard microtask workflow that included a tutorial, in which the training content approach is shown. The main task was displayed upon successful completion of the tutorial.
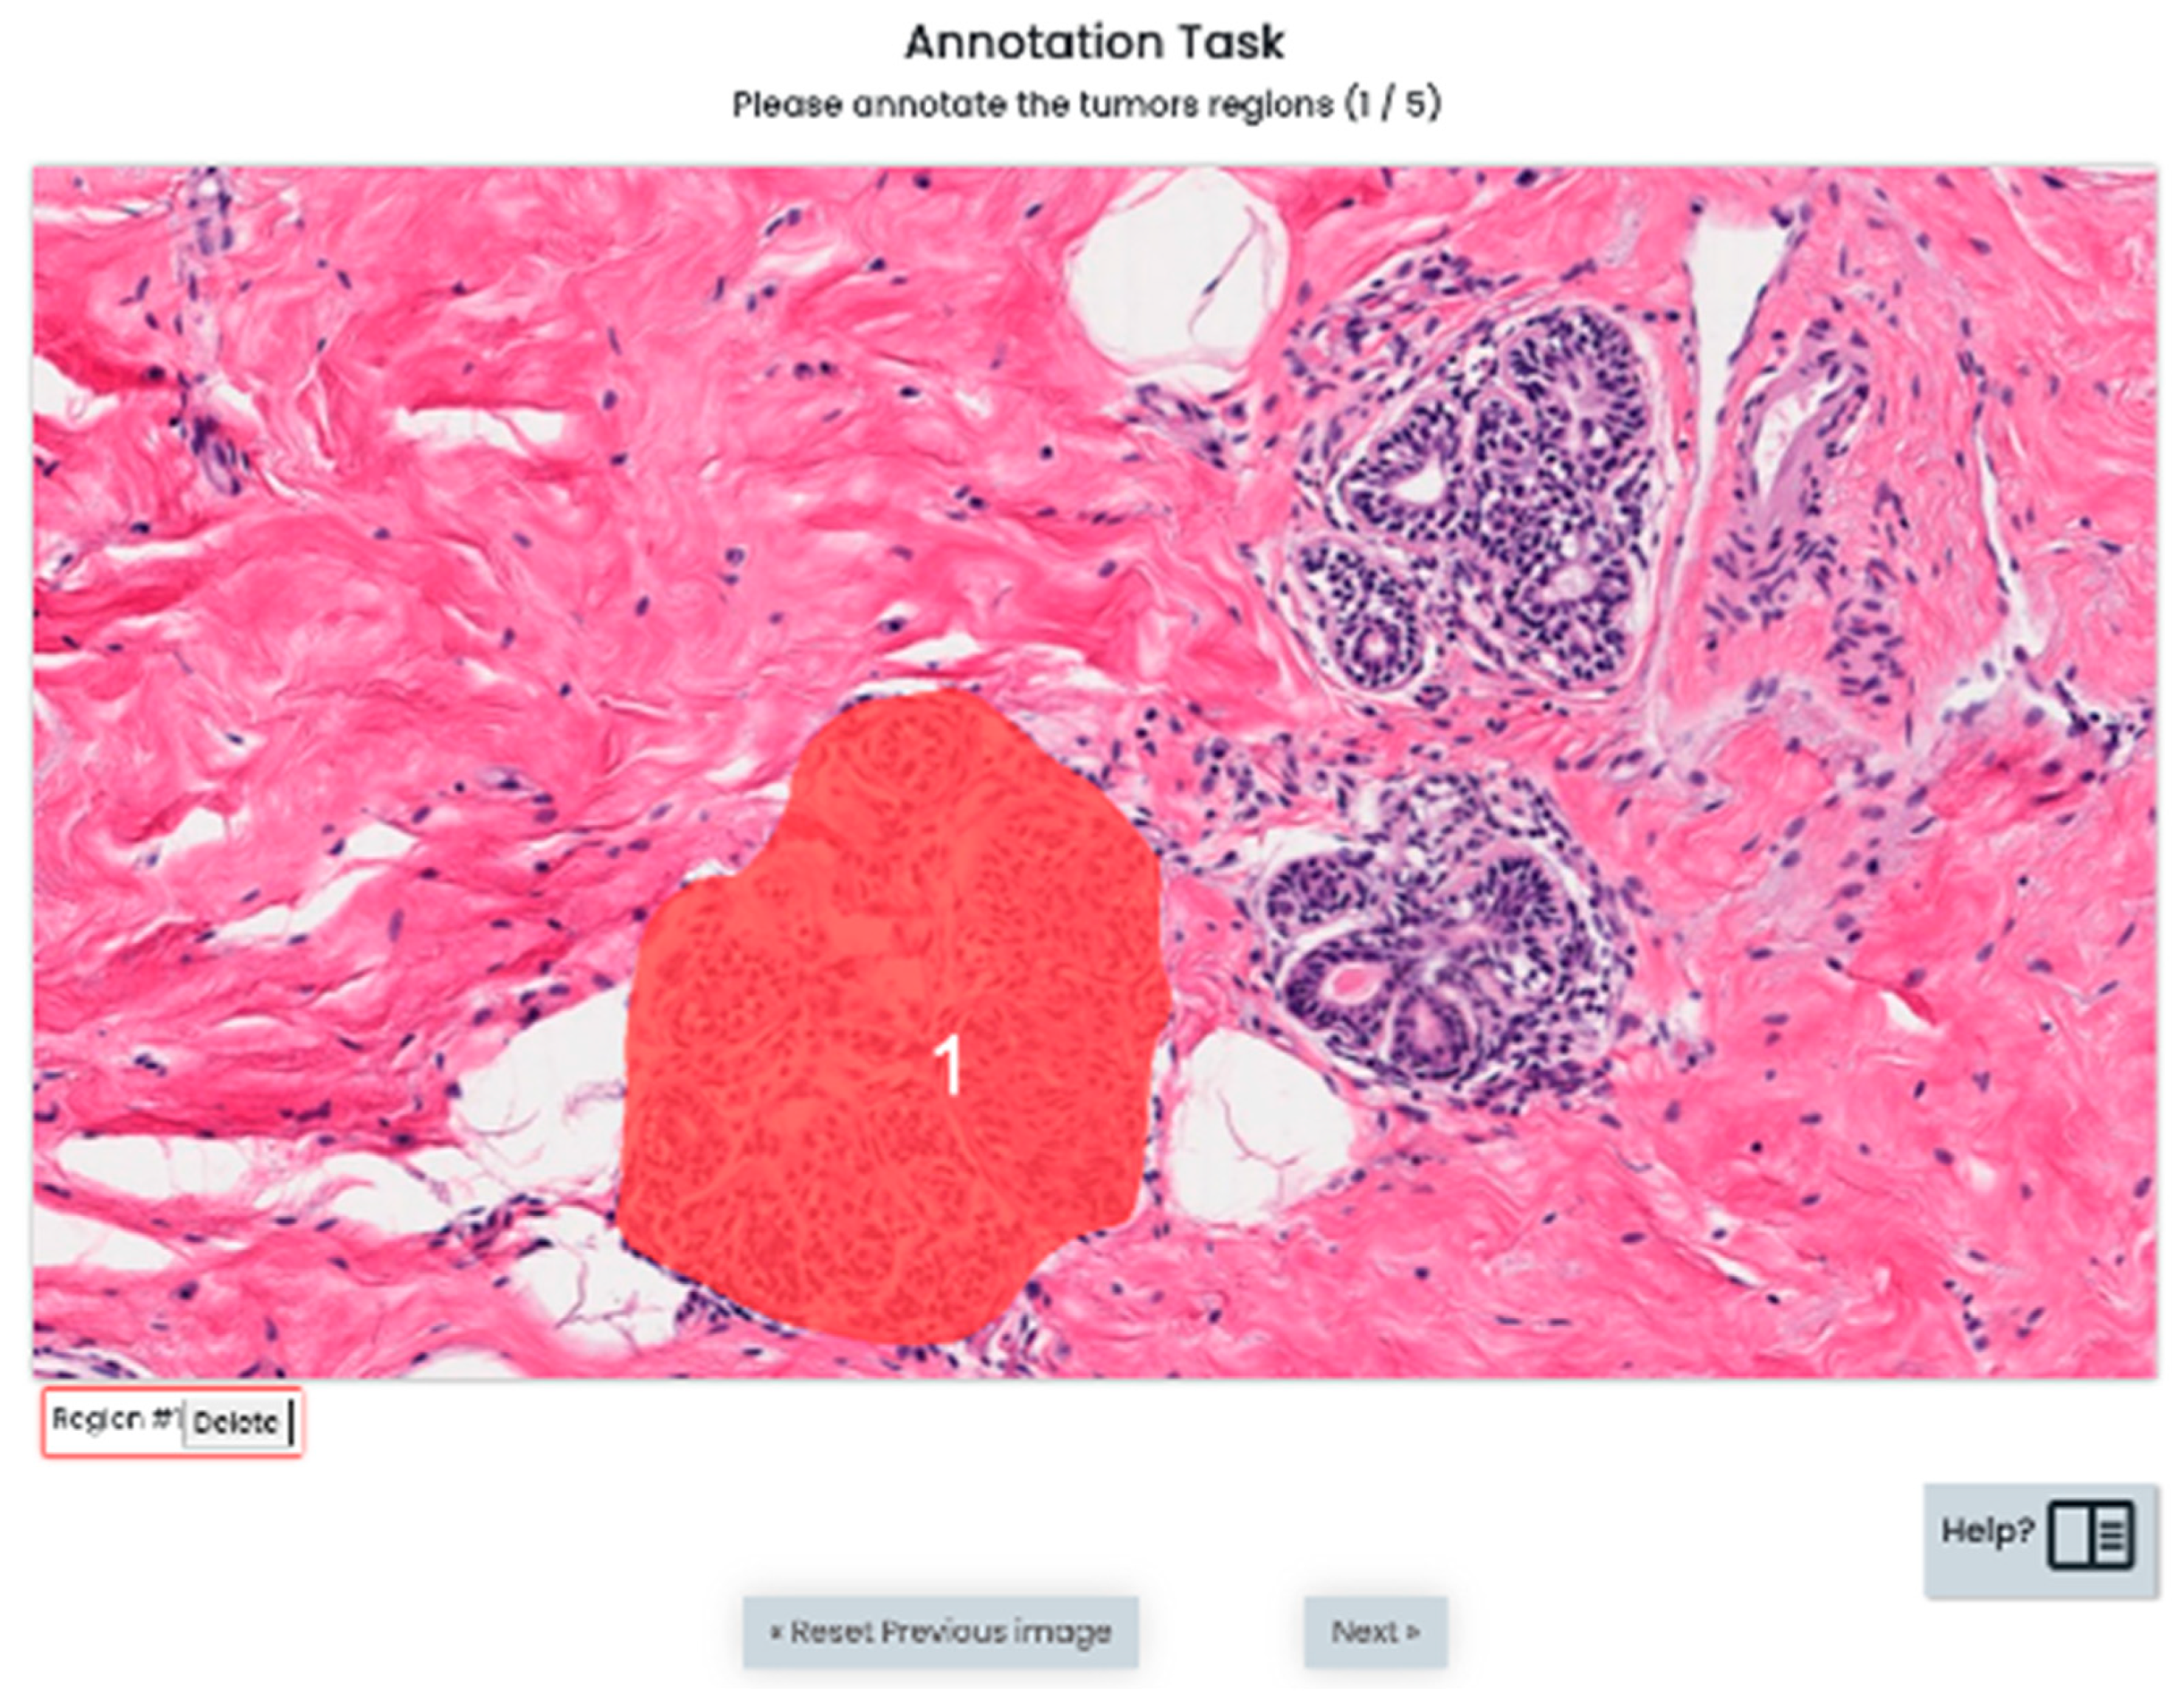
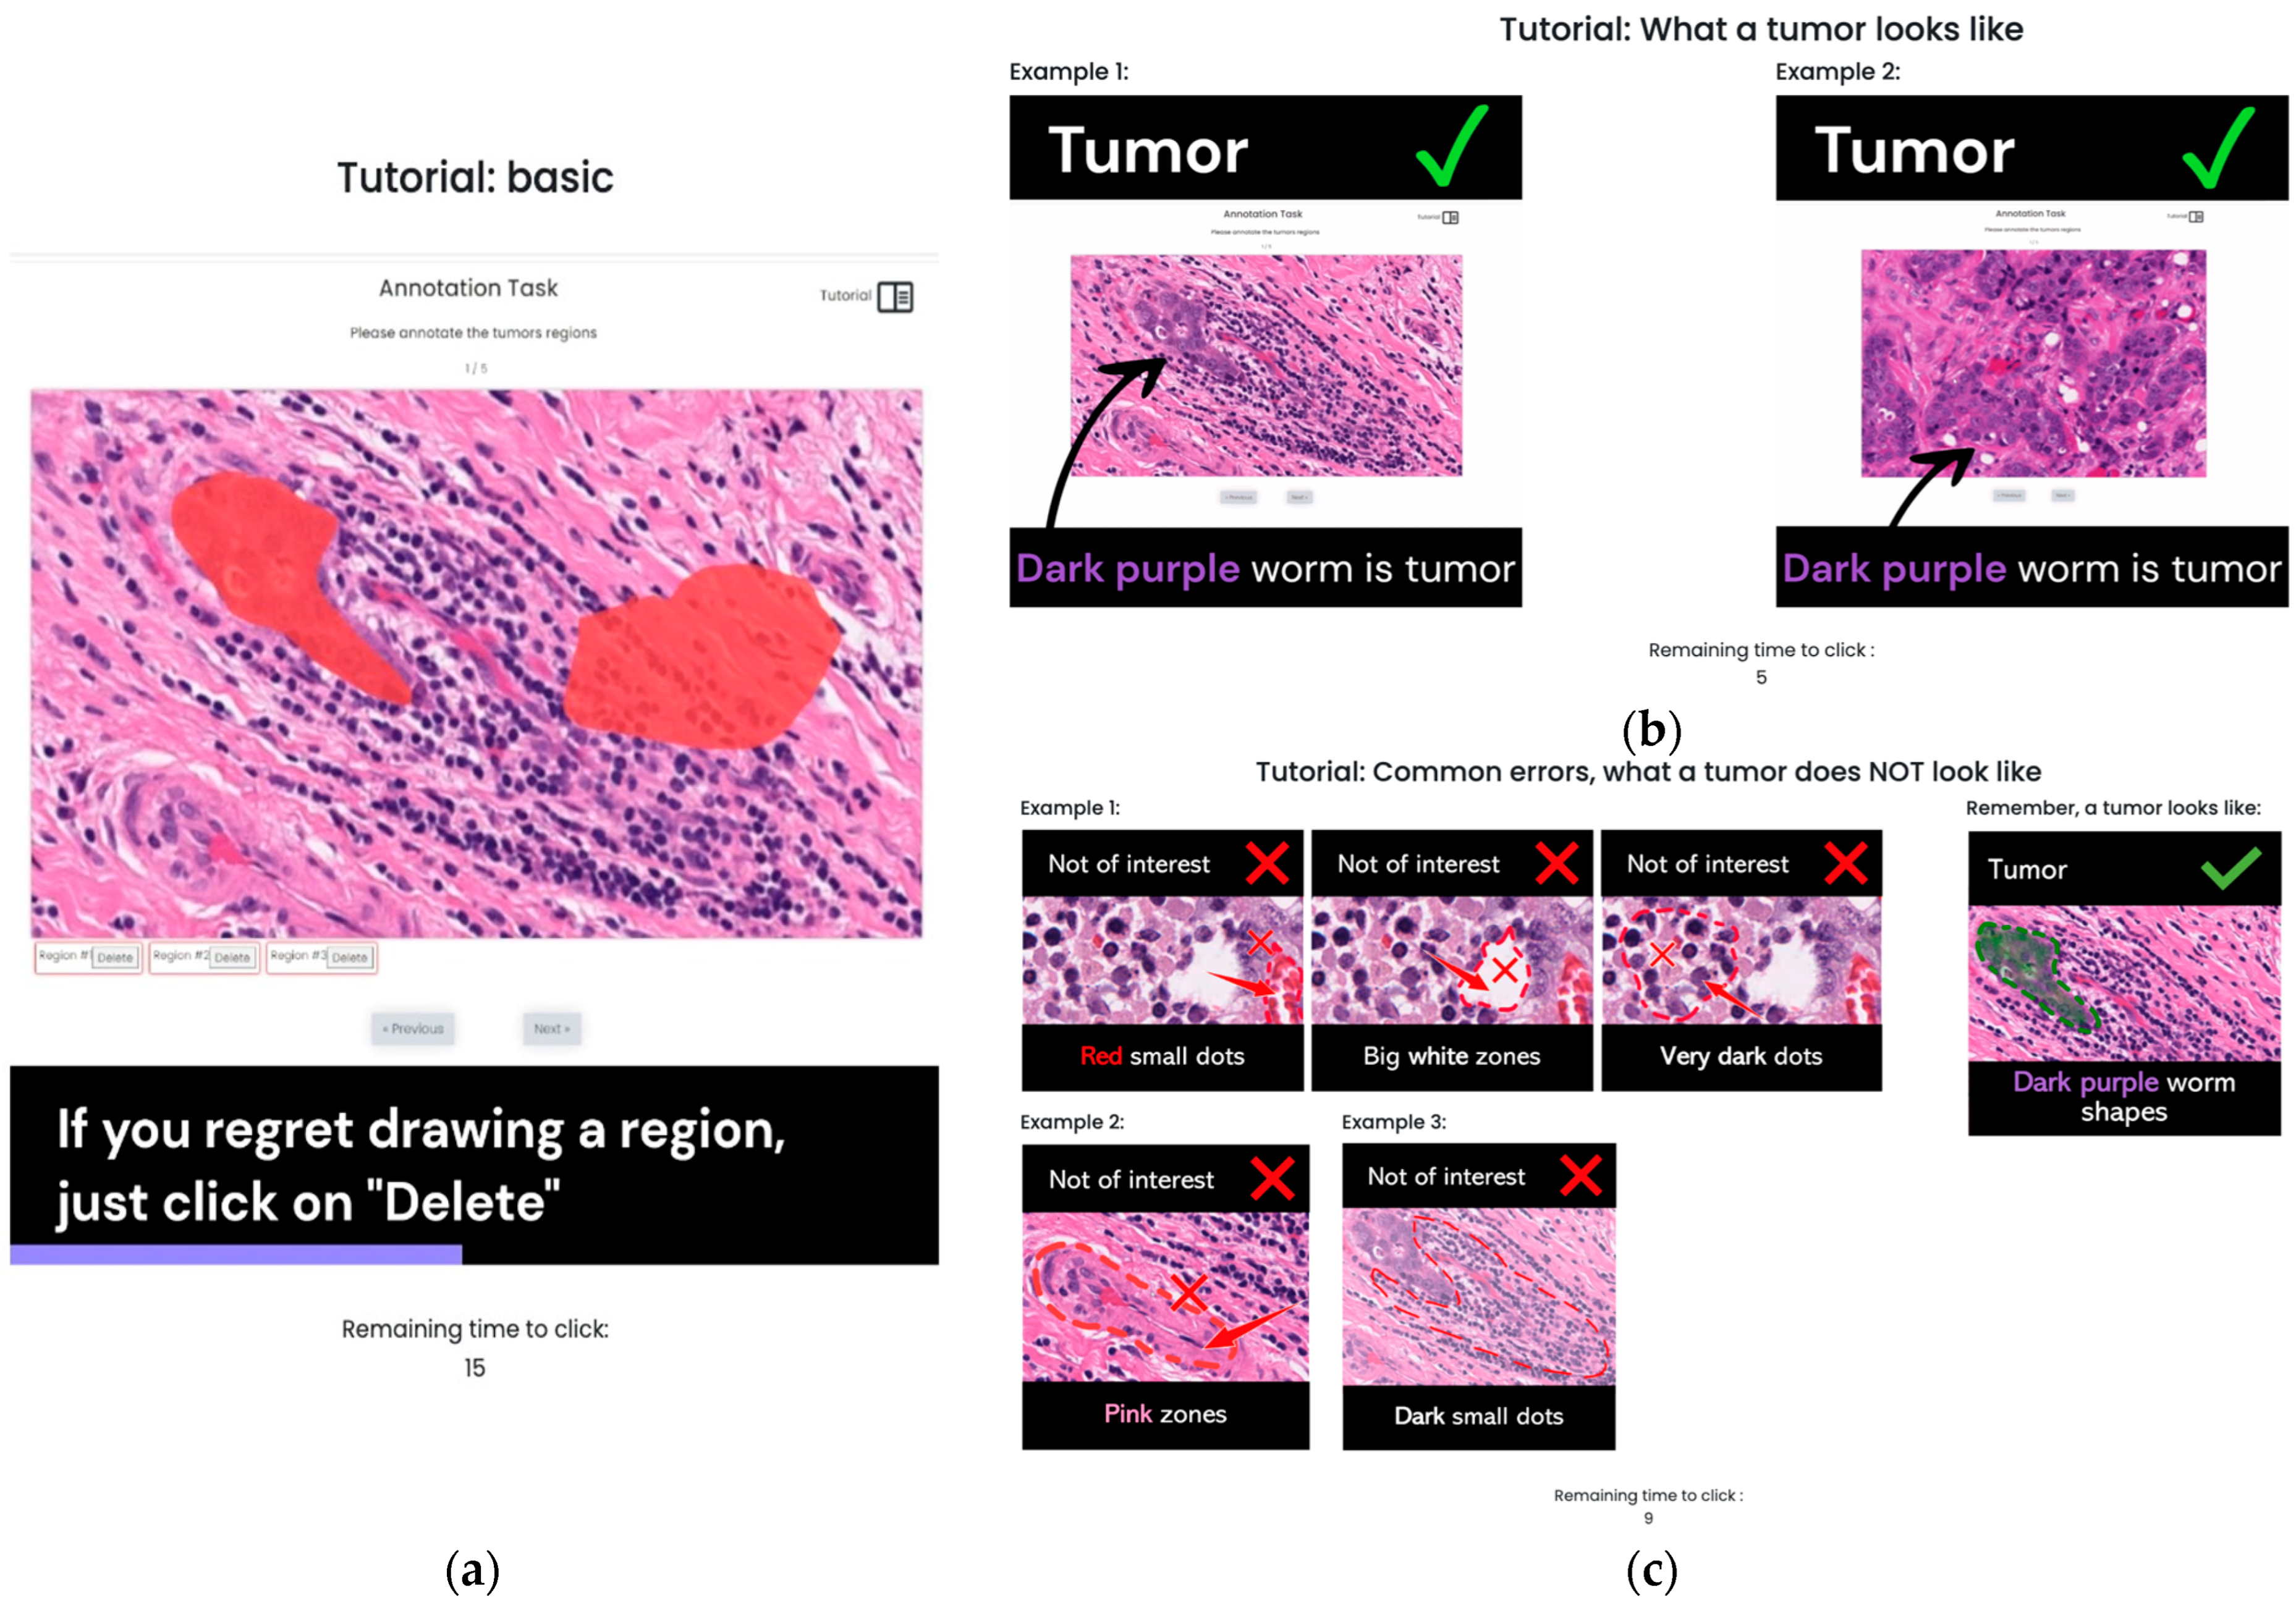
The main task consisted of an annotation tool, in which workers should use the available canvas to draw over the histological image, specifically in the zone where they think the tumor is located. The tool was self-implemented using the Konvajs version 4.0.10 and React-Konva version 17.0.2-0 libraries (https://konvajs.org/docs/react/index.html (accessed on 30 July 2025)). We extended the library with actions raised by holding and releasing the mouse buttons, which allows the user to draw polygons as they desire. Additionally, the crowdworkers can remove any of the drawn regions by clicking “delete”, as shown in Figure 3, which corresponds to the annotation task.

3.2. S1: Initial Version Training Strategy

In the first study, we developed a basic tutorial illustrating the visual appearance of the tumors on the images and illustrating what is not a tumor. This tutorial was displayed to the recruited crowdworkers in an initial campaign, with the aim of evaluating this training strategy package using the Thinking Aloud Method. We use the framework developed by Gamboa et al. [43] that enables us to perform Thinking Aloud studies via crowdsourcing and record the participants’ verbalized thoughts together with their screen interactions. Overall, 30 crowdworkers were recruited via the Microworkers (www.microworkers.com (accessed 30 July 2025)) platform. The recordings were analyzed. Transcription of audio recordings was conducted and grouped using word similarities. Then, the videos were analyzed by visual inspection, and compared with the text mined in order to identify events where the crowdworkers were stuck. Also, misannotations were identified from the videos, which were converted into optimization paths of the training content for minimizing errors, as well as the instant feedback settings. The campaign and the results of the Thinking Aloud Method brought us the opportunity to discover error patterns faced by the crowdworkers, and hence, design an optimized version of the training based on identified error patterns.
The following error patterns were found:
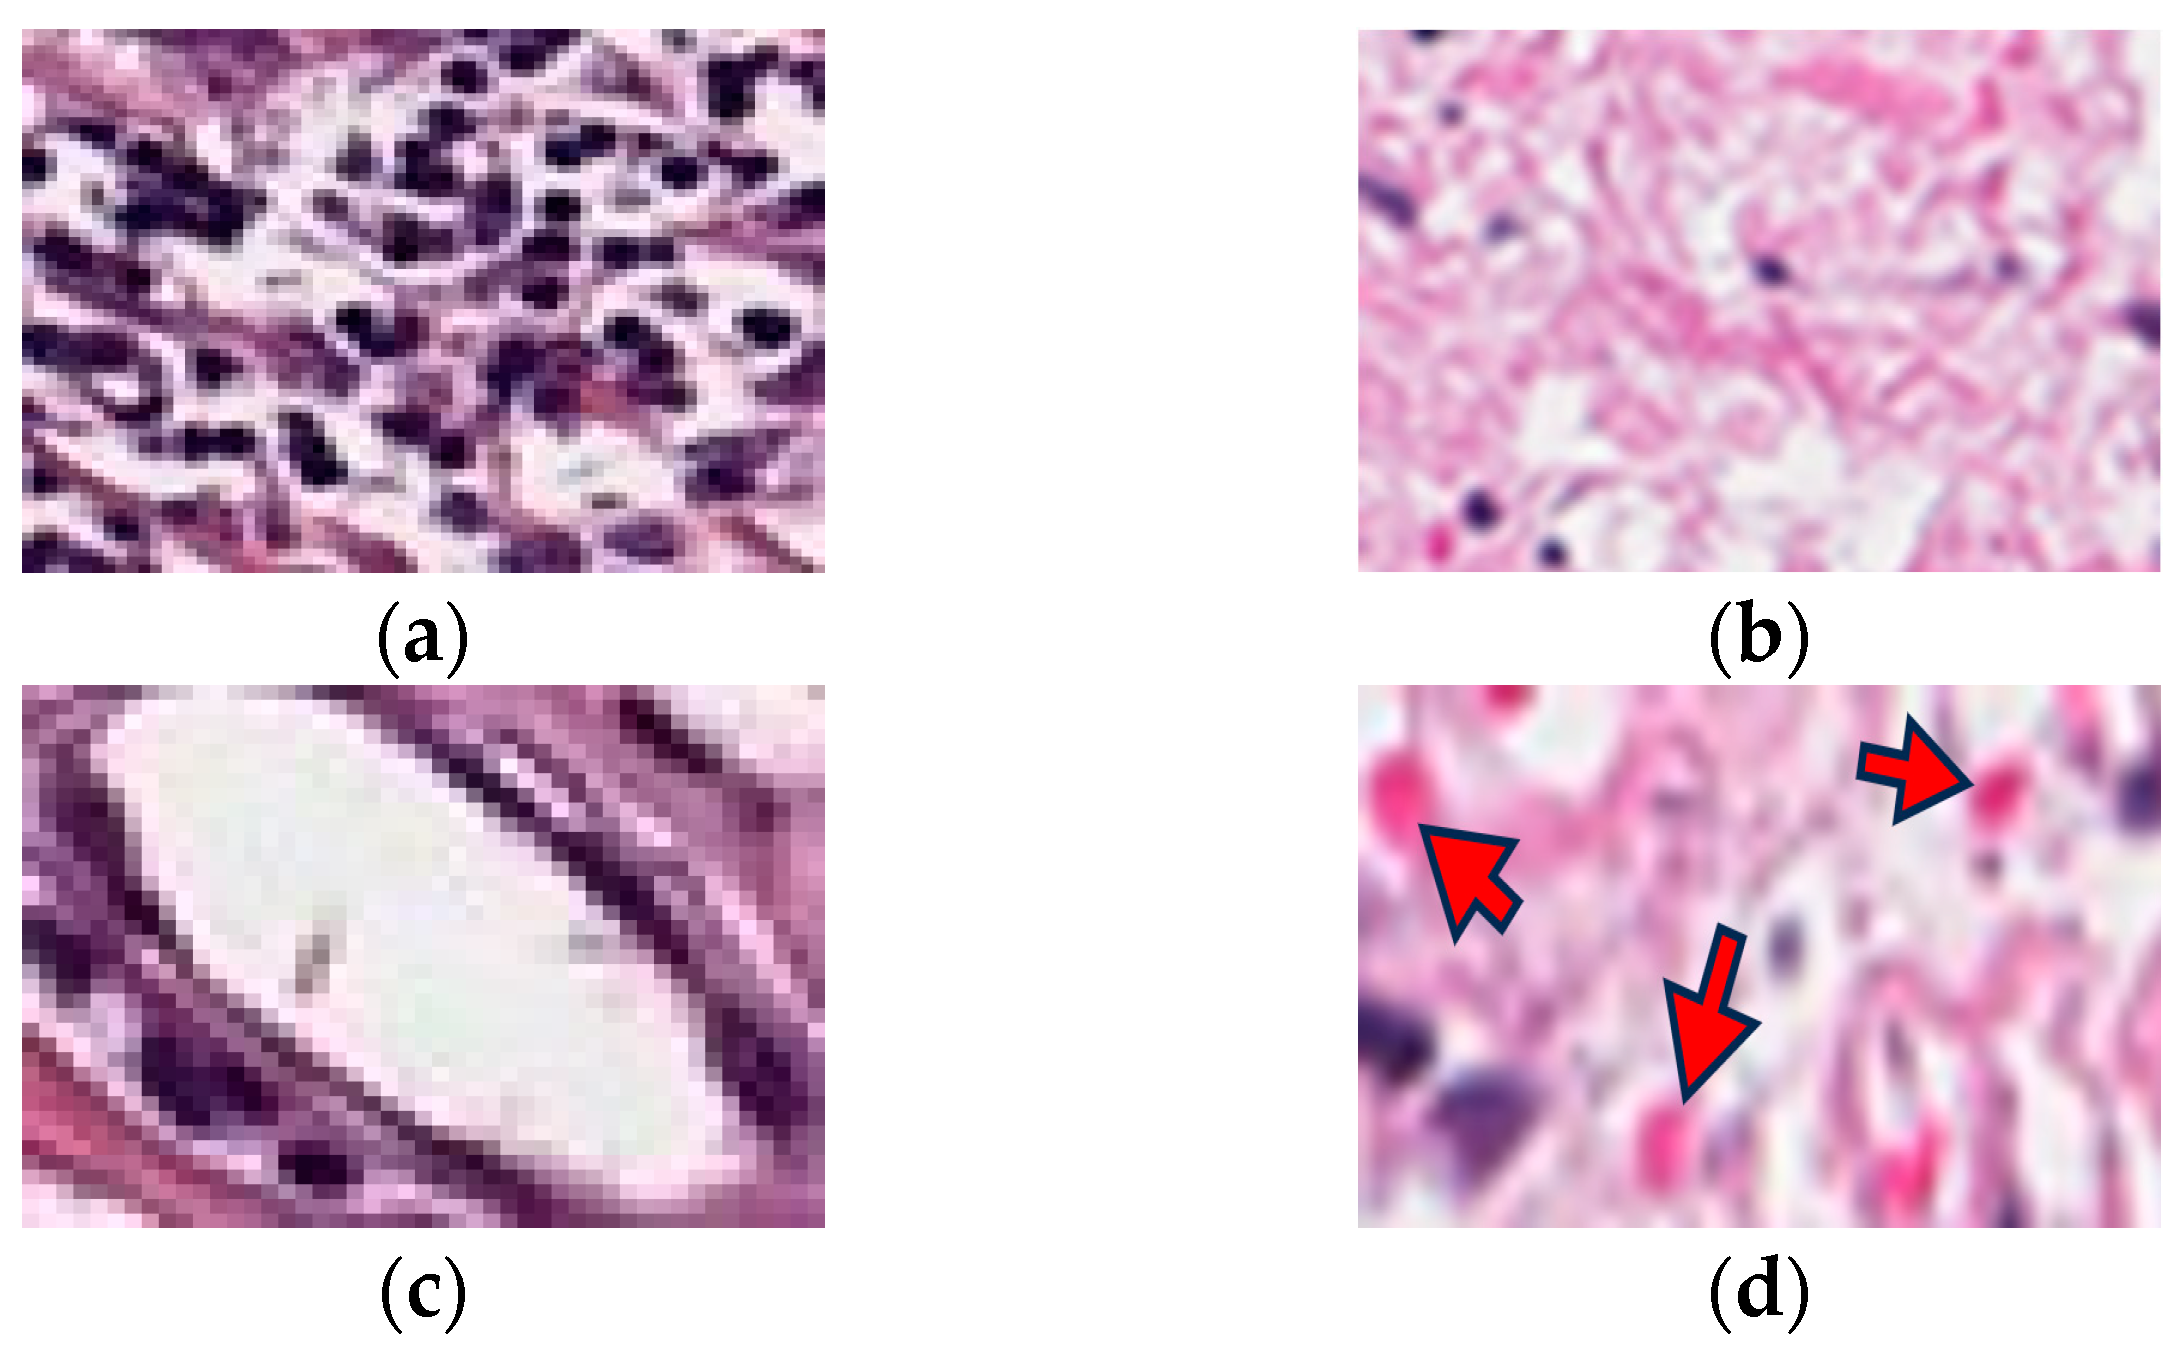
Dark dot region error: This kind of annotation is also one of the biggest contributors to the decrease in performance metrics in the first campaign. Figure 4a shows the dark dots present near the tumor regions. According to experts and DSA, these are lymphocytic structures. Some crowdworkers have interpreted this as the tumor itself, potentially due to the limited knowledge about histology and their deep blue staining similar to that of tumor cells.
Therefore, we put emphasis on describing that this is not part of the tumor, even if its presence also allows detecting the presence of tumors.
Pink region errors: This is one of the most detected regions wrongly identified by crowdworkers. Figure 4b shows the pink regions associated with fibrosis, muscle fibers, or other kinds of stromal tissue. This is not relevant for the study, in which we are focused only on the tumor cell clusters. However, we have found that some crowdworkers marked these kinds of zones as tumors. Probably, those crowdworkers interpreted—according to the given basic training strategy—that the regions to be annotated are the most prominent in the image.
As the tumors are supplied by the supply system of surrounding tissues, these structures will appear in all the images. Hence, we improved our training to explicitly encourage crowdworkers to avoid annotations of such structures.
White region errors: Other regions appear “white” but are in fact clear regions of the section where no tissue is present. These can be lumens of larger blood vessels, fat cells, or simple artifacts from tissue processing. Figure 4c shows one example of a blood vessel that appears white. We have learned from the videos in the first crowdsourcing campaign that some crowdworkers have marked these regions as tumors. It means that crowdworkers are mostly motivated to make correct annotations, but we see lags in understanding what they should annotate. Therefore, we must explicitly mention that these areas have no meaning in this experiment and should be avoided.
Red region error: According to the ground truth of DSA [7], these structures are blood, but they might also be staining artifacts, immunohistochemical markers, or pigmented structures depending on the stain and tissue context. Similar to pink regions, crowdworkers have interpreted this as tumor structures. Examples of these structures are shown in Figure 4d.
In the second study, we ran three parallel campaigns in which the crowdworkers were randomly assigned to one of the three versions, i.e., the baseline BASTRAGY with fixed technical issues, the version with the optimized tutorial (OSTRAGY), and the version of the campaign with the instant feedback scheme (INSTRAGY). Crowdworkers who participated in the first study were not allowed to participate in the second study to avoid adding bias to their prior training. Then, we compare the collected annotations to evaluate the effectiveness of the optimization performed. The training strategies presented in the second study (in addition to the current BASTRAGY) are detailed in Section 3.3 and Section 3.4. The training content is shown in Figure 5.

3.3. S2: Optimized Training Strategy (OSTRAGY)

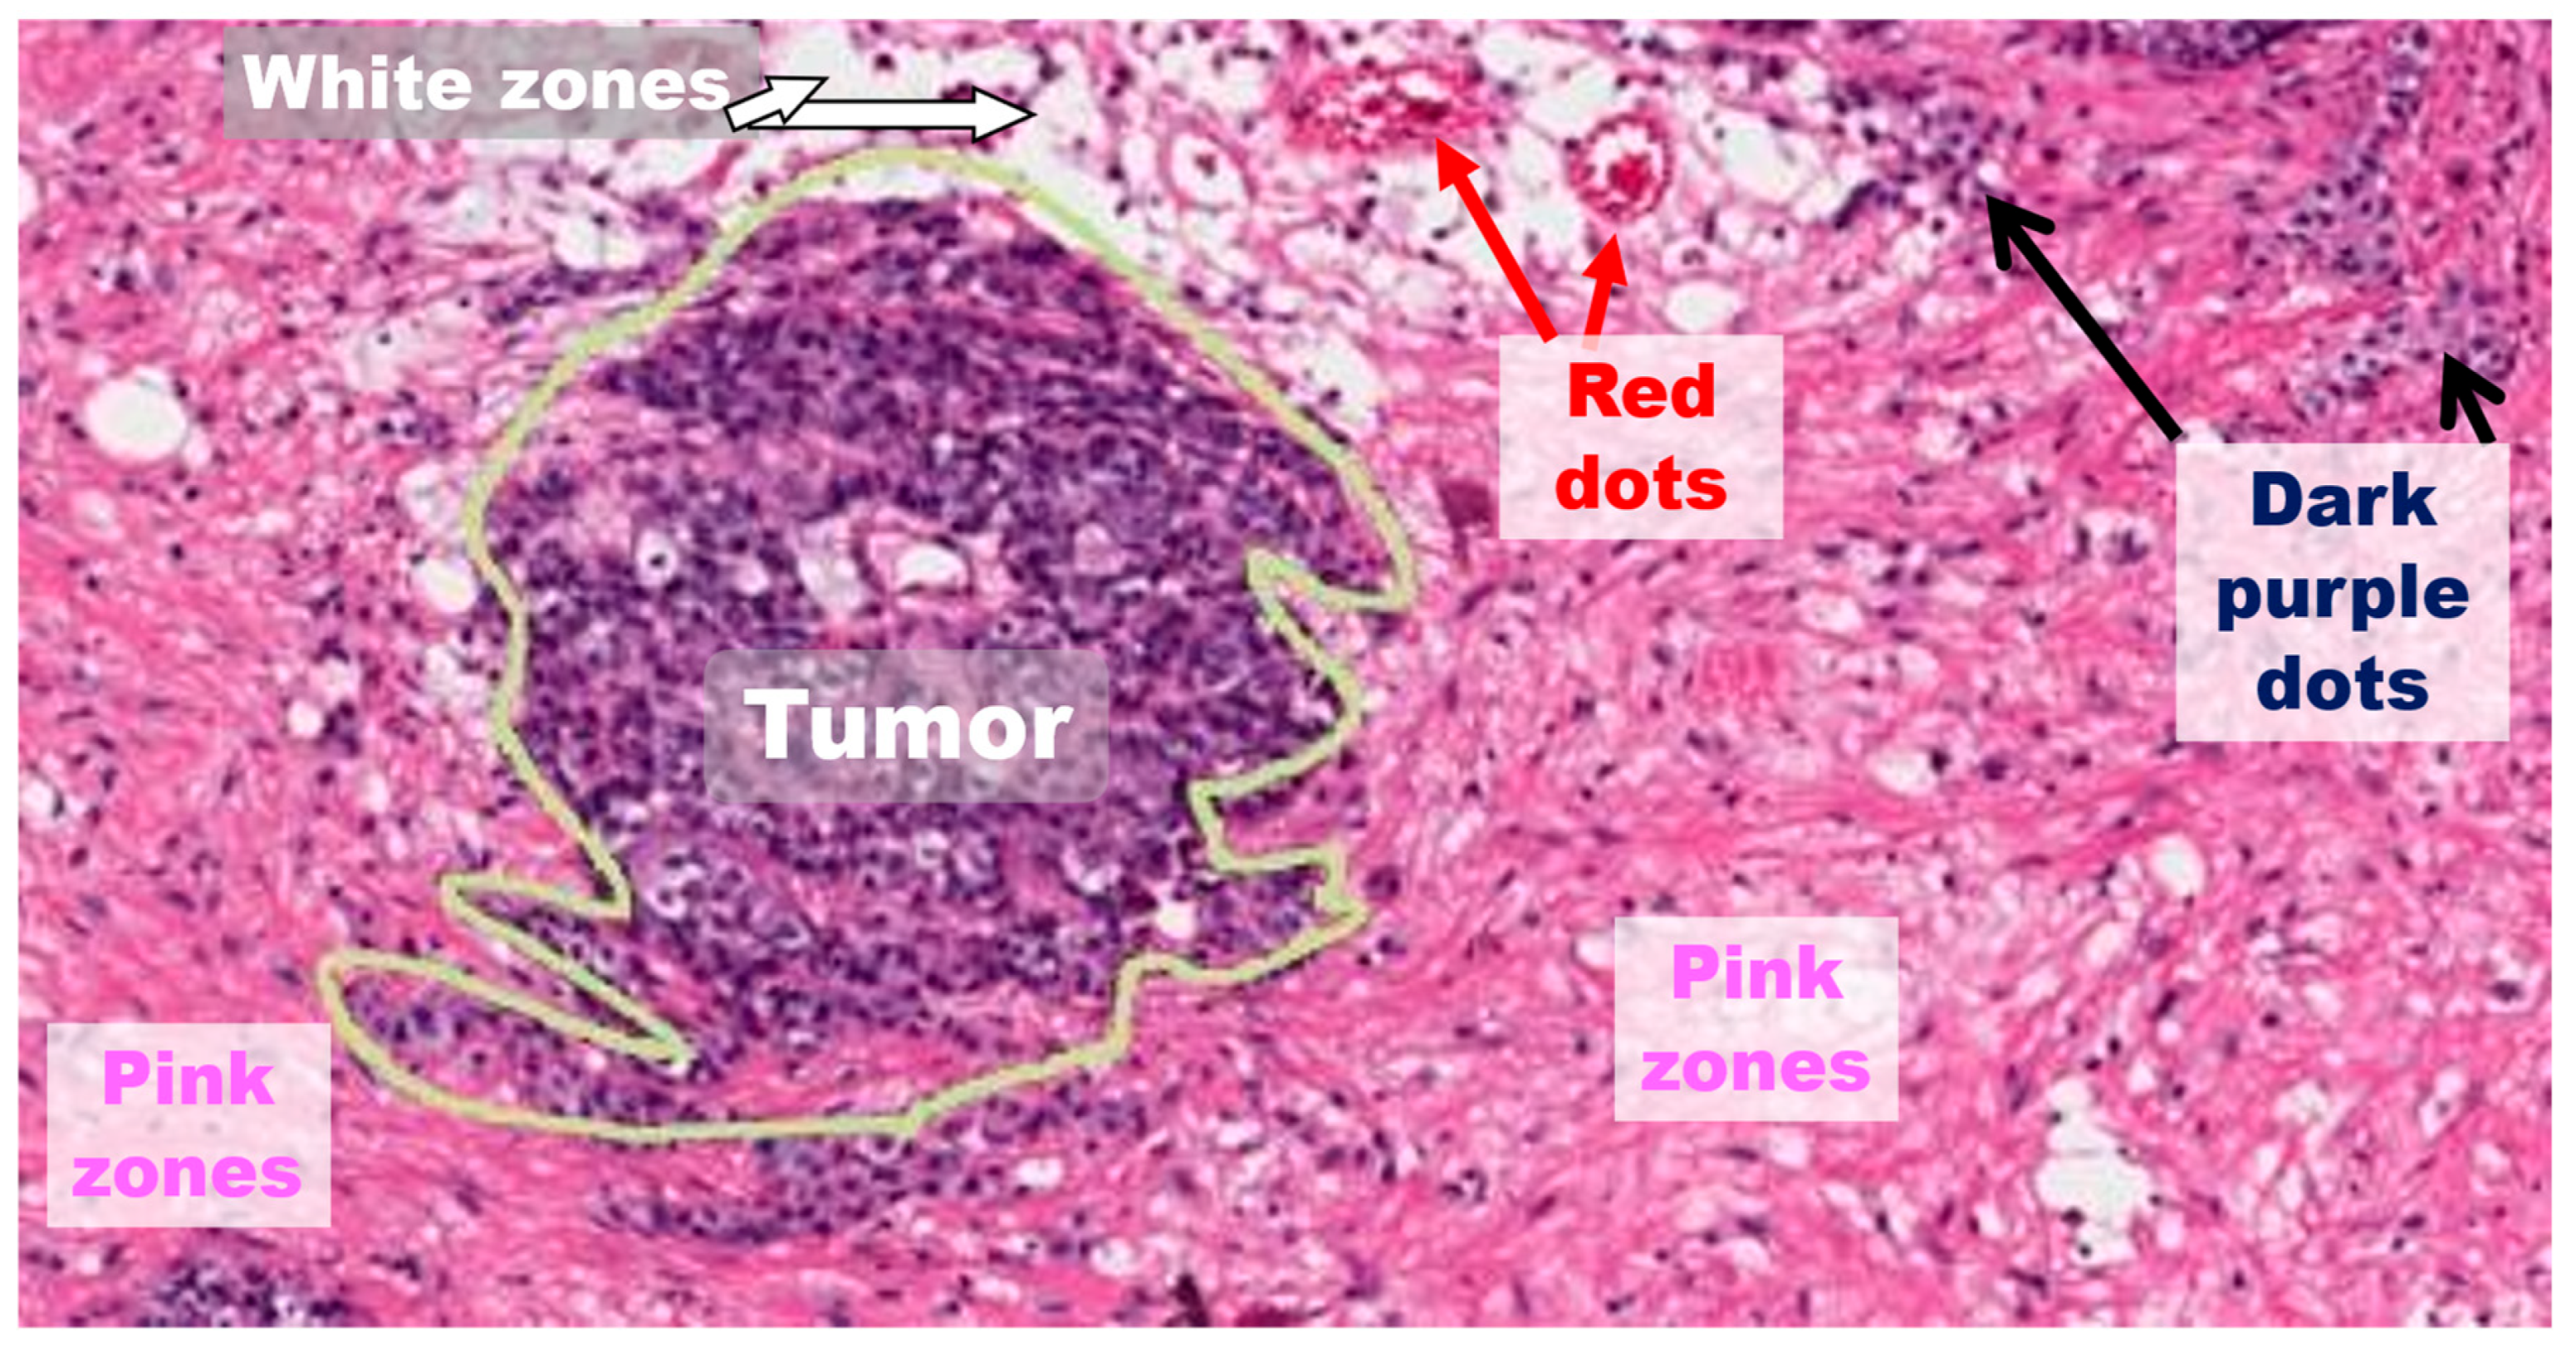
As noted in Section 3.2, we found the following common annotation errors: (a) pink areas were often marked, though they are not tumors; (b) dark small dots were confused for tumor cells, but they are only biomarkers and not the tumor itself; (c) some red areas, representing blood or other tissue, were marked; and (d) a few white areas, unrelated to any tissue, were also marked. Figure 6 shows one example of the different regions drawn by the workers, even while relying on the wrong regions.
Based on this, the OSTRAGY training strategy has optimized content across all four main error patterns, with additional mentions of what not to do, based on previous workers’ error patterns, derived from the data postprocessing of study 1. Figure 7 shows the content of the training strategy.

3.4. S3: Optimized Training Strategy with Instant Feedback (INSTRAGY)

In the third study, the workers were supported with the optimized training phase as used in OSTRAGY with additional instant feedback after they made a mistake. We performed a heuristic operation based on a pixel-wise estimation using the Hue-Saturation-Value (HSV) color space. Table 1 shows the information displayed for each instant feedback type.

Preliminary Preprocessing of Dataset

To prepare instant feedback for the workers, we detected some basic errors, which did not require any training. Detections were based on a set of features from pixel values of the hue channel of the HSV color space. We first calculate the HSV value distribution for all GT data regions in the whole dataset. Then we determined the Interquartile Range (IQR) of the HSV for the respective regions. The ranges are summarized in Table 2:
Using the IQRs, we established a heuristic H ^ consisting of a tolerance of an additional 25% of the IQR value for each detection type. Tests with this feature were conducted to validate the suitability of this heuristic. Hence, this acts as a flexible thresholding procedure supported by non-parametric statistics that operate without predefined models.
The final decision is based on the following expressions:
Given   median   >   median   of   region   type     0.25     I Q R AND Given   median   <   median   of   region   type   +   0.25     I Q R ,
These expressions were applied to each region type to determine which of all the regions the active polygon falls into.

3.5. Evaluation Metrics and Statistical Analysis

Through different training strategies (BASTRAGY, OSTRAGY, and INSTRAGY), we aimed to understand the influence of different feedback mechanisms on the quality of work. Consequently, we intended to assess whether the crowdworkers behave differently when facing different types of training strategies, in the first place.
The crowdsourcing campaign was deployed on the Microworkers (www.microworkers.com (accessed on 1 June 2025)) platform, and workers were paid USD 0.30 each. For assessing the crowdworkers’ performance, the following metrics were evaluated for each worker, with respect to different performance settings: the mean of the union and intersection between one annotated region and its most approximate ground truth region. Additionally, different percentage levels of intersection were also evaluated: up to 20%, 21–40%, 41–60%, 61–80%, and 81–100%. Moreover, the mean precision, recall, F1-Score, and Intersection over Union (IoU) were also calculated.
Let M i μ = R l × m × n the vector per histologic image i , in which each element M i μ k is also a vector of R k , with k { B A S T R A G Y ,   O S T R A G Y , I N S T R A G Y } , with the set of all the m metrics ( μ -metric values) obtained for all the l = R k workers who had annotated the current histologic image i . Notice that the number of crowdworkers who have faced the specific k training strategy, and the image i is not the same for the k + 1 training strategy or the i + 1 image.

3.5.1. Differences Between Training Strategies: Overall Perspective Using Blocked Designs

A Randomized Complete Block Design was applied to each M μ k -triplet, in which each k training strategy is considered the treatment, as well as each image i is the block. Depending on the normal distribution shown in all the measurements per evaluated metric, the following block design was applied:
  • All three vectors M μ k follow the normal distribution: ANOVA test [44,45] was applied to check if the groups are statistically different. Welch ANOVA test [46] was applied to the groups which did not have equal variances. To determine which of the groups presents the statistically lowest error (and statistically best performance), a Post Hoc Tukey HSD test [47] was also applied.
  • All three vectors M μ k did not follow the normal distribution: The Friedman test [48,49] was applied to check if the groups are statistically different. To determine which of the groups presents the statistically lowest error (and statistically best performance), a Post Hoc HSD test [50] was also applied.
  • All statistical evaluations were performed in Python version 3.9, using the libraries Statsmodels.api, statsmodels.formula.api, OLS (the three come from Statsmodels package version 0.14.0), and scikit_posthocs version 0.8.1.

3.5.2. Analysis of Significant Association Between the Training Strategy and Performance Metrics

The objective of this part was to assess whether changes in the training strategies lead to a trend of different concentrations of values across different performance metrics. In particular, we also wanted to know whether specific types of errors are more frequently associated with particular ranges of performance metrics, such as switching between the training strategies. To achieve this, a χ 2 Test of Independence was applied to the distribution of the quartile-based categorization of each performance metric M μ k . Hence, potential associations between training strategies and performance behaviors can be evaluated, as reflected in frequency patterns, and support the block-level analysis presented in Section 3.5.1.

3.5.3. Differences Between Training Strategies: Perspective per Image

A Shapiro–Wilk test [51] was applied to each M i μ k to determine the normal distribution. Depending on the p -value of all the vectors—and hence, accepting or rejecting the null hypothesis—the following tests were applied to determine if the groups of workers behave significantly differently:
  • All three vectors M i μ k follow the normal distribution: ANOVA test [52] was applied to check if the groups are statistically different. Welch ANOVA test [46] was applied to groups which do not have equal variances. To determine which of the groups presents the statistically lowest error (and statistically best performance), the Nemenyi Post Hoc test for multiple pairwise comparisons [53,54] was also applied.
  • All three vectors M i μ k did not follow the normal distribution: The Kruskal–Wallis H-test [55,56] was applied to check if the groups are statistically different. To determine which of the groups presents the statistically lowest error (and statistically best performance), a Post Hoc Dunn test with a Bonferroni correction test [57,58] was also applied.

4. Results

Complete statistical analyses, including p-values for all comparisons, can be found in the Supplementary Dataset available in Zenodo [59]. In this section, we highlight the most relevant results, focusing on the instances where significant reductions in errors were observed across the predefined error patterns: pink regions (non-tumor tissue), red regions (rare structures), dark dot regions (ambiguous markings), and white regions (background or artifacts). We also report significant improvements in the accuracy of the annotated tumor regions here. The corresponding examples shown refer to subfigures of Figure 8.

4.1. Overall Trends

As described in Section 3.5.1, Table 3 shows the results of the normality test, as well as the statistical calculation of differences between the training strategies, across the different performance metrics considered. Results are presented across the different error types, as well as the overall performance. Also, the performance is shown when considering the delimitation of tumor zones.
Specifically, discriminated by error types, the mean precision, mean recall, and mean F1-Score, as well as the mean IoU, behave statistically differently when having these kinds of training strategies at the moment of drawing regions among pink regions, red region types, and white zones.
Regarding the overall performance, we observed significant differences in the training strategies according to the metric related to valid region zones with overlapping percentages of up to 20%. We observed different behaviors. Also, we saw significant differences related to the regions with no meaning in the different training strategies. It also occurred in the error categories of dark dot regions, red errors, white zones, and tumor regions. It means that the workers behaved differently at the moment of drawing unwanted regions.
We also noticed the signs of variation of performance metrics in the regions which overlap in the 41–60%.
Later, we show in Table 4, which training strategy resulted in the best performance metric, only in the cases of significant differences evidenced from Table 3. It brings statistical evidence that the performance metric for the tumor region improves when facing INSTRAGY (the higher value the better), as well as the error decreases when facing OSTRAGY or INSTRAGY, as in the case of the different unwanted structures (the lower the better).
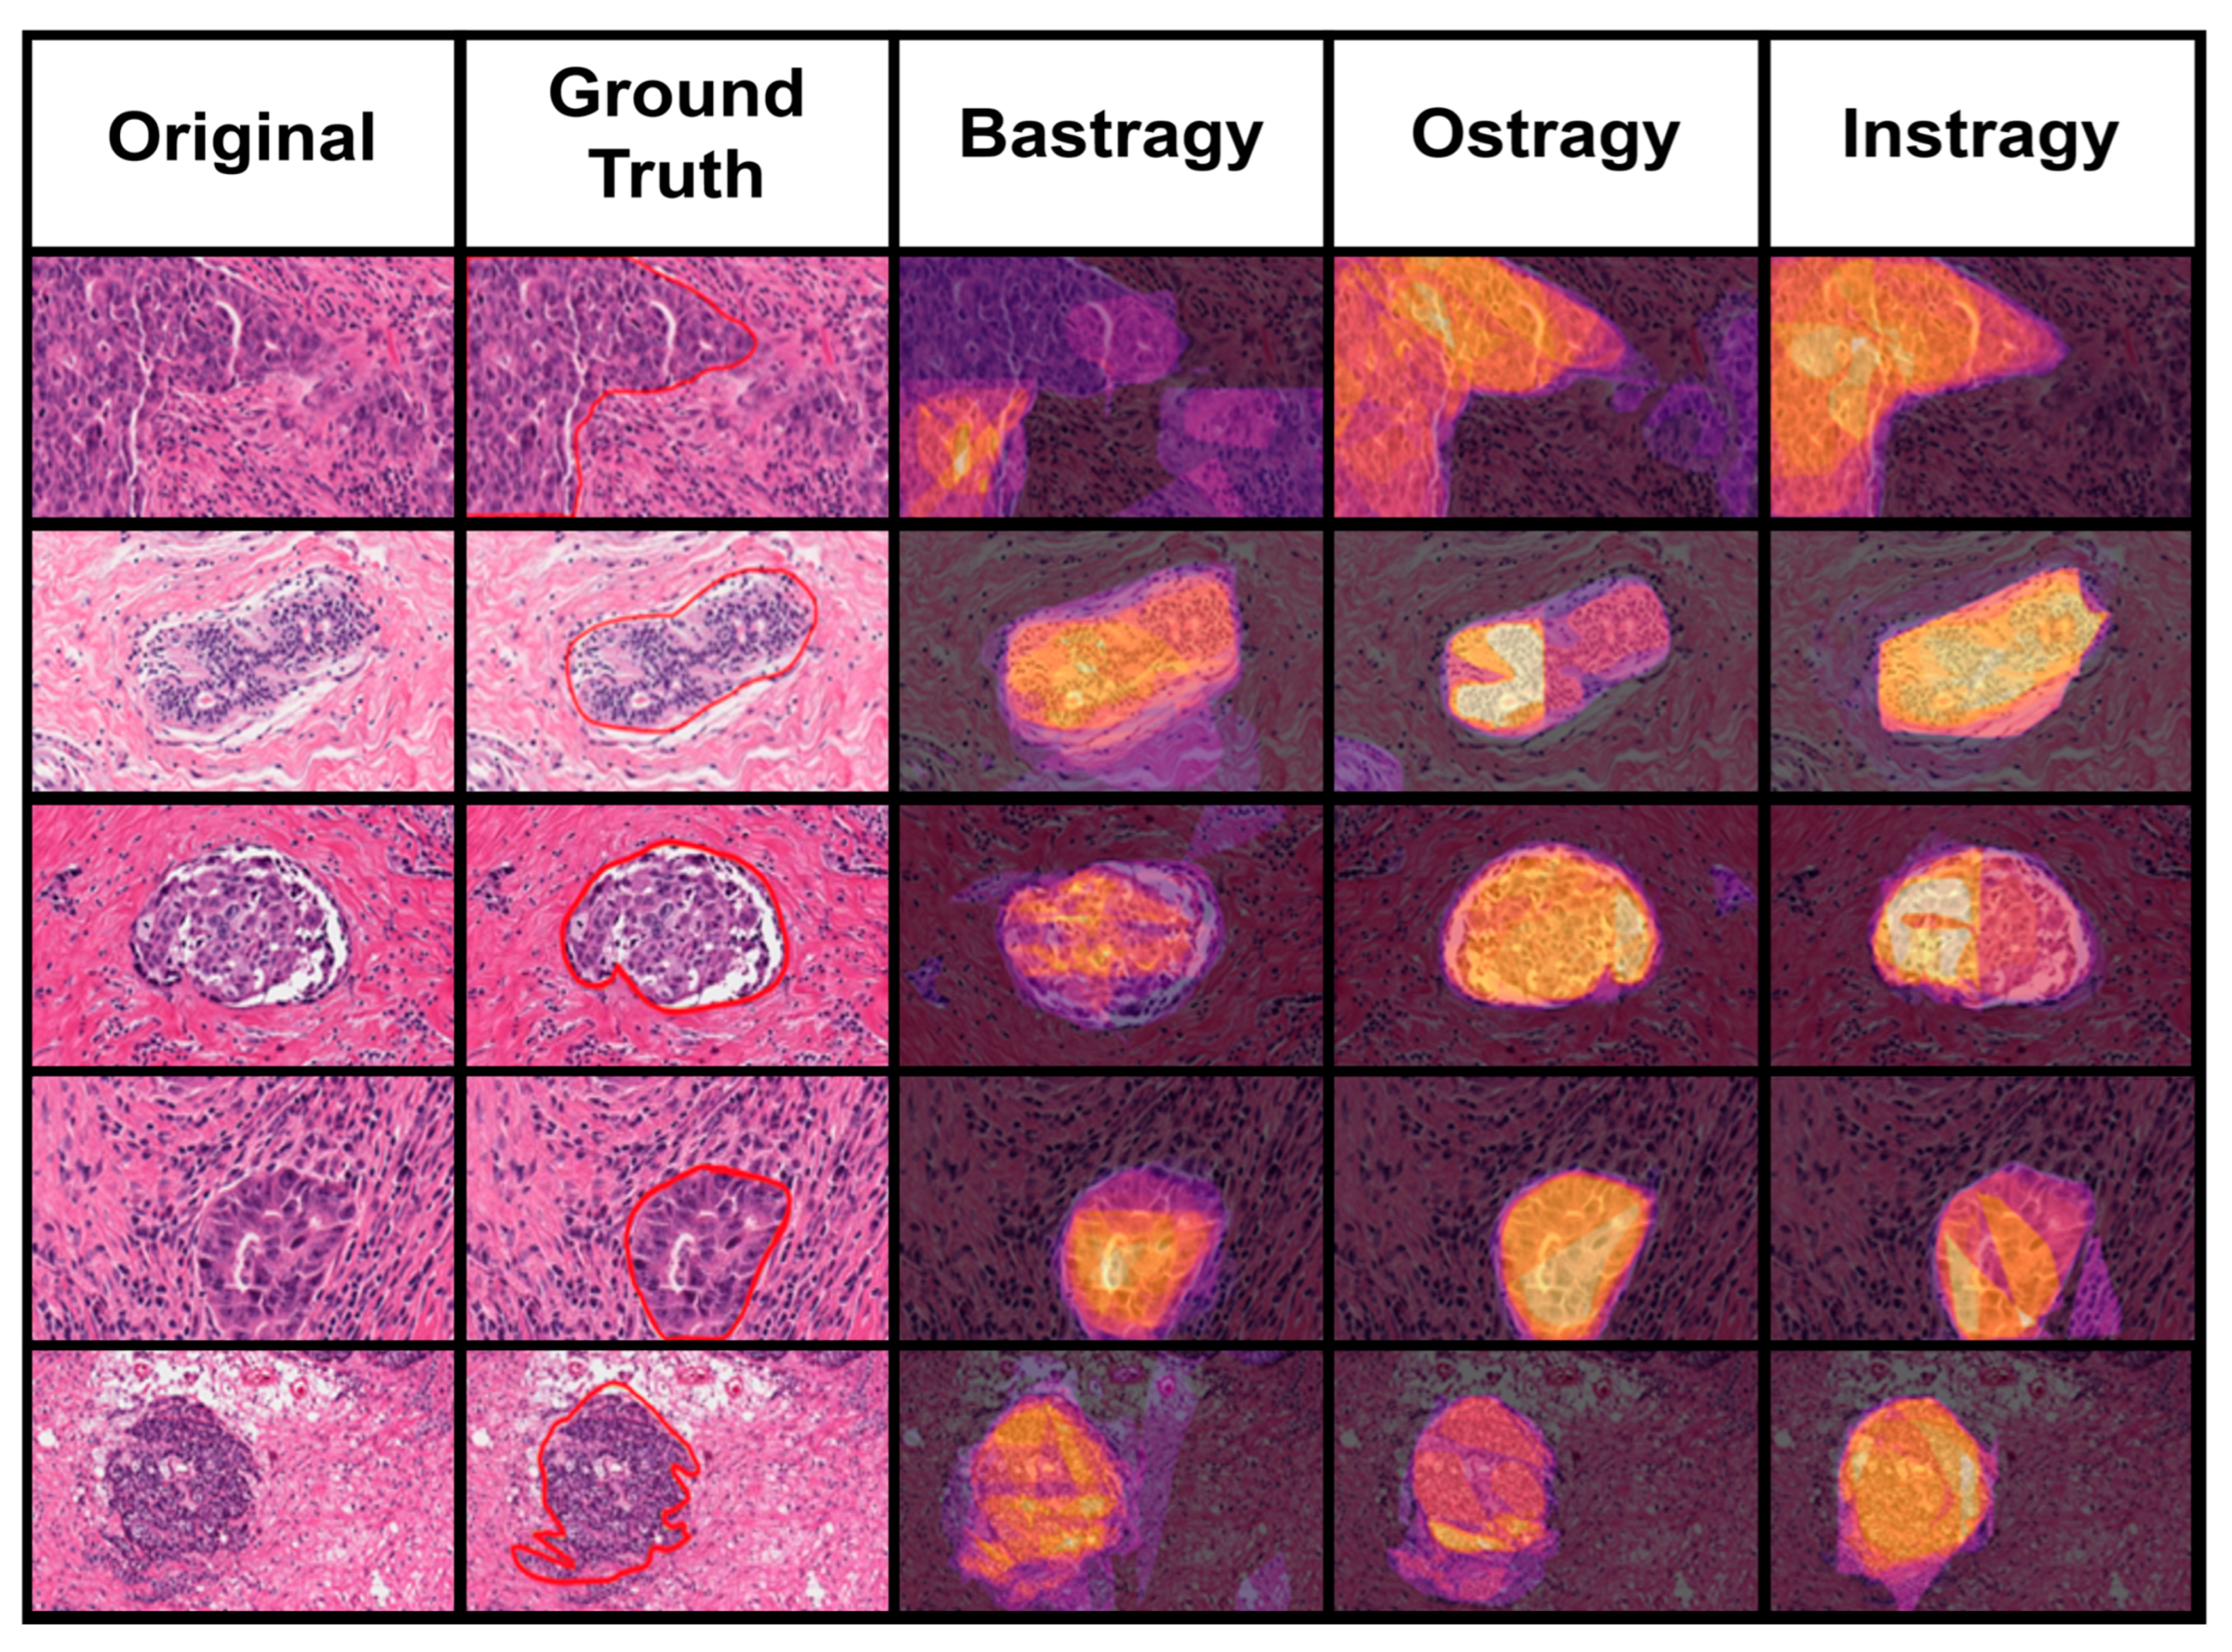
We present in Figure 8 some exemplary instances where significant improvement is evident under OSTRAGY and INSTRAGY. In Figure 8, each row represents the original image followed by the aggregated annotation heatmaps from workers, obtained under BASTRAGY, OSTRAGY, and INSTRAGY training strategies.
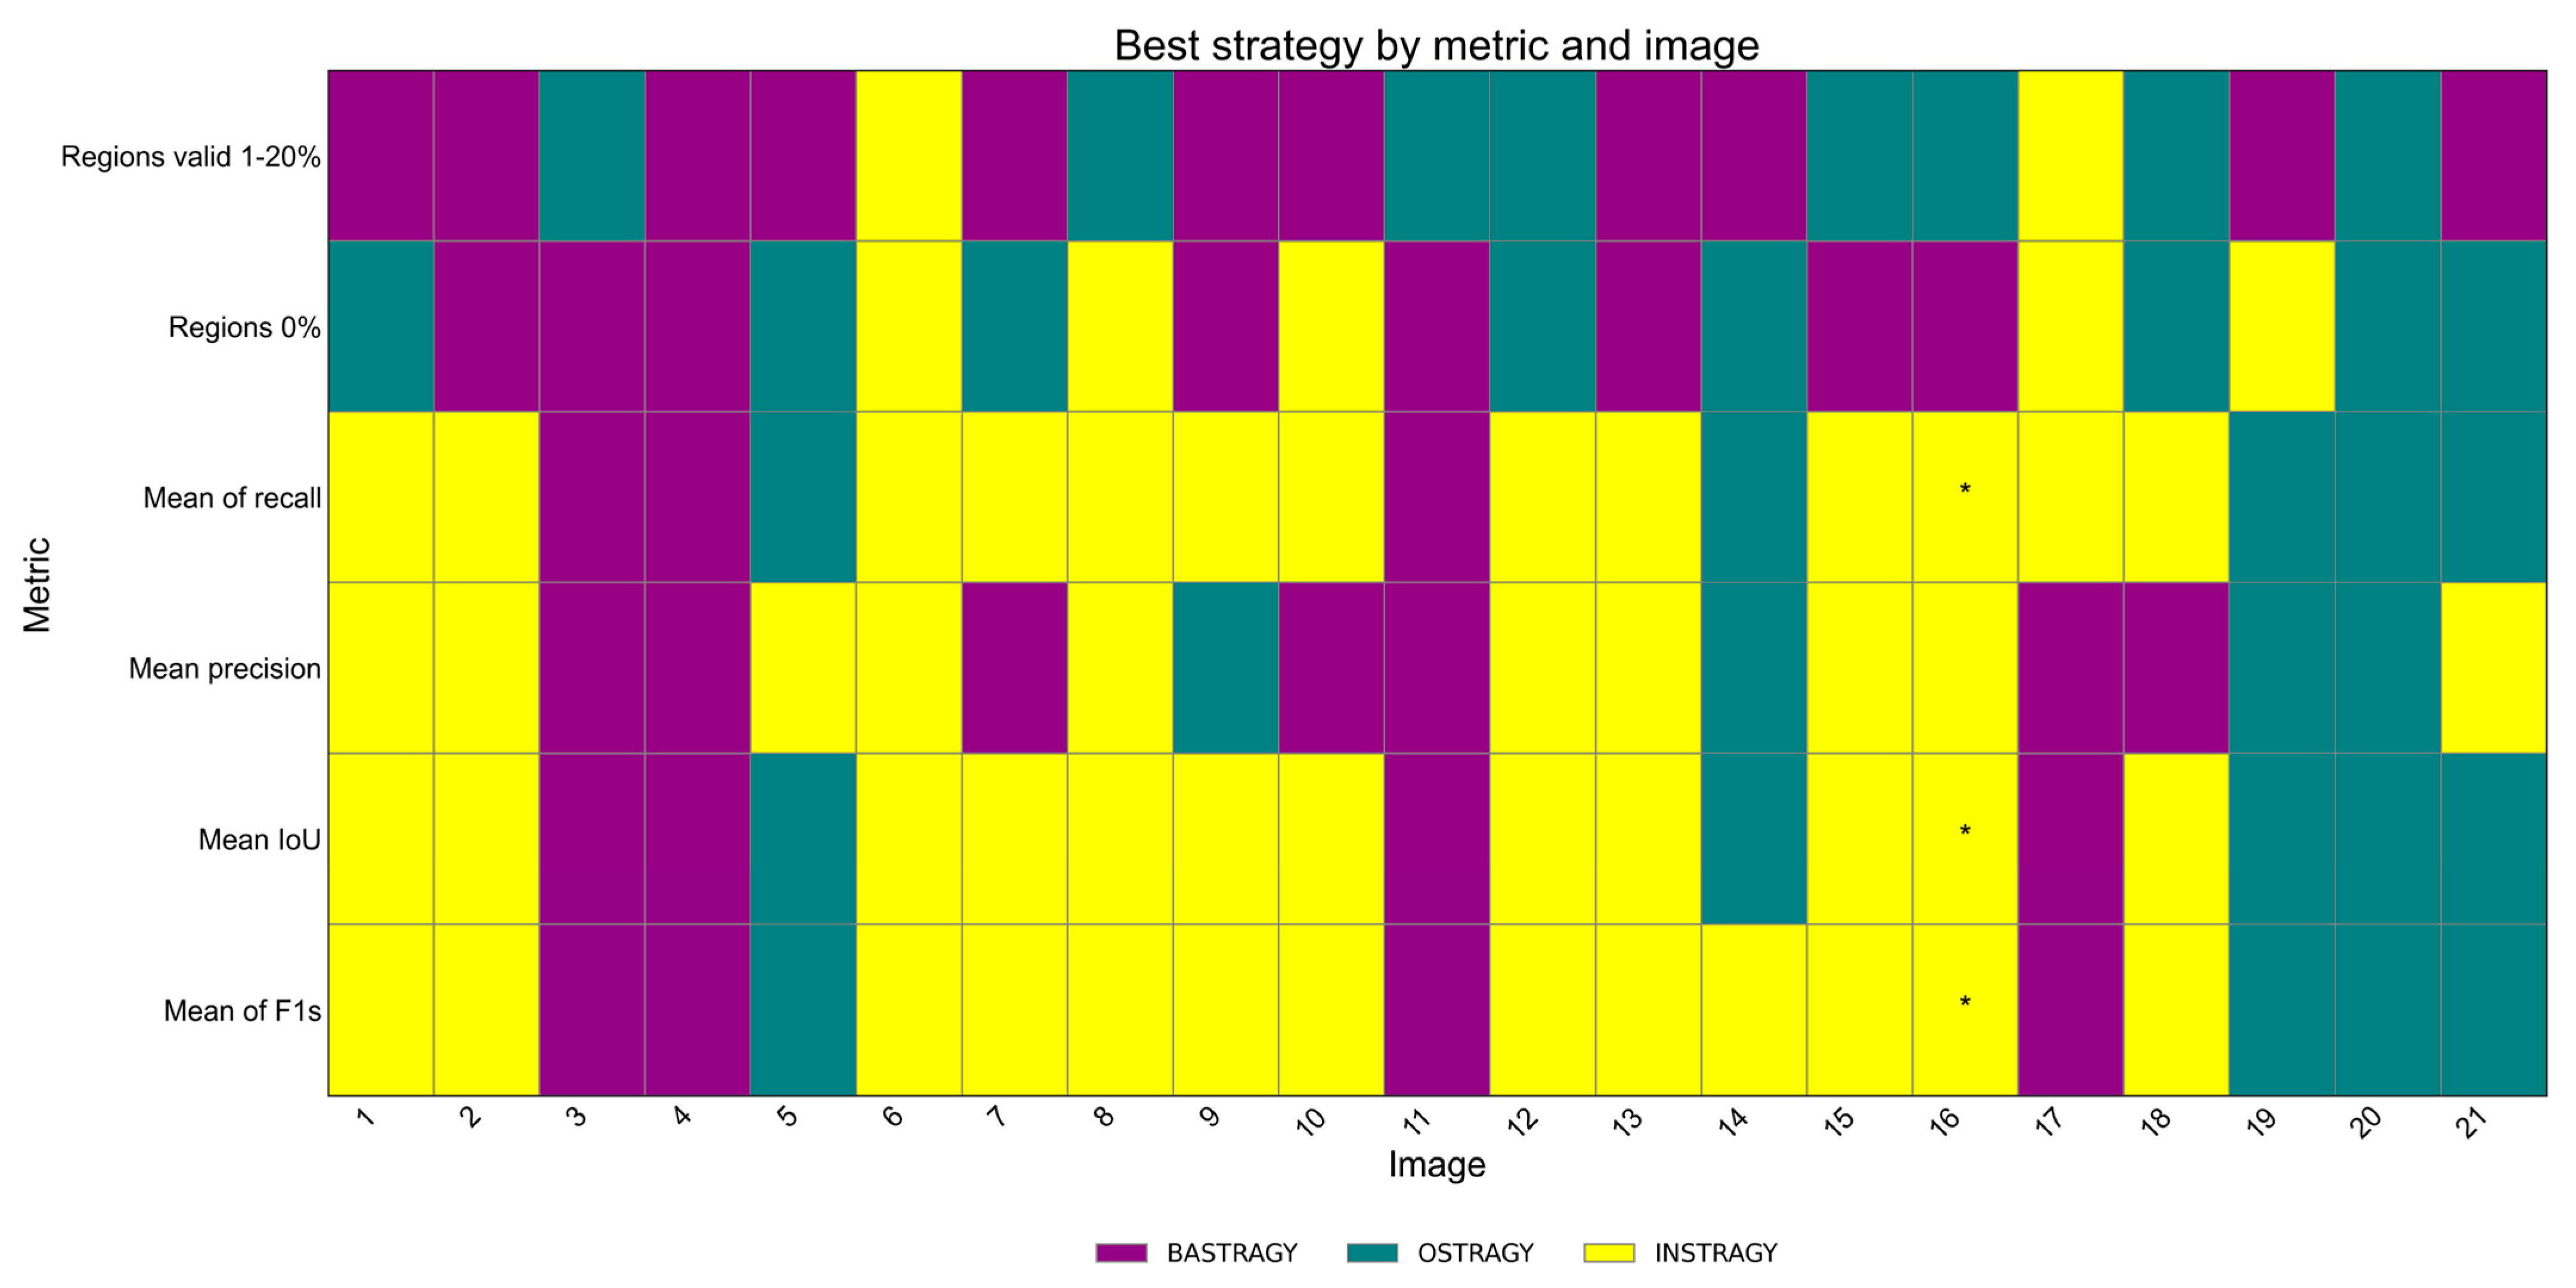
Also, in Figure 9, we show the performance of the different training strategies for all the images. It demonstrates that, depending on the complexity of the image, different strategies should be considered.
Table 5 presents the results of the χ 2 Test of Independence applied to the quartile-based distribution of each performance metric, with the aim of identifying potential associations between training strategies and performance behavior. As mentioned, this analysis examines whether different training approaches result in distinct concentration patterns across performance ranges, and whether specific types of errors tend to occur more frequently at particular levels of metric values. The findings offer complementary evidence to the block-level analysis from Table 3 and Table 4, highlighting how shifts in strategy may influence the distribution of model performance.
In particular, the mean precision, the mean recall, as well as the mean IoU demonstrate significant differences in the distribution of these performance metrics across the pink error type and the white zone error type, as well as when annotating the tumor region zones. The first-mentioned metric of performance is also seen when examining the combined set of all regions.
These findings support a joint perspective with the results shown in Table 3 indicating that there are strong indications of significant differences in outcome when different training strategies are applied. Finally, the overall trend shows not only a statistical difference between the set of performance metrics of the workers according to the different training strategies (BASTRAGY, OSTRAGY, and INSTRAGY) but also that the results confirm that INSTRAGY outperformed BASTRAGY and OSTRAGY on most tumor-zone metrics, and INSTRAGY and OSTRAGY clearly outperformed BASTRAGY in the reduction in metrics of annotations conducted in unwanted zones.

4.2. Analysis of Results per Image

As described in Section 3.5.3, we were also interested in examining how performance metrics vary across images of different difficulty levels and error types when transitioning between training strategies. We will describe the significant differences in performance metrics per image.

4.2.1. Delimitation of Tumor Zones

We report significant improvements in some performance metrics with OSTRAGY compared to BASTRAGY in Figure 2 (3), (4), (12), (15), (16), and (19). The opposite occurs for some other performance metrics when annotating Figure 2 (3) and (16). Moreover, when annotating Figure 2 (3), (4), (12), (15), and (16), there were significant improvements in different instances of performance metrics using INSTRAGY compared to BASTRAGY. The opposite occurred in other instances of error metrics when annotating Figure 2 (15) and (16).
On the other hand, when using INSTRAGY, we obtained significant improvements in Figure 2 (3) and (16), compared to OSTRAGY. The opposite occurs in other error metrics when annotating Figure 2 (3), (4), (12), (15), (16), and (19), and with statistical significance when annotating tumors on Figure 2 (15).
It underlines nuanced interactions between strategies in tumor segmentation tasks. A more consolidated perspective is shown in Figure 9, the best strategy according to different metrics and images. Notice from the image shown in Figure 9, the tendency indicates that images associated with a specific level of difficulty tend to yield higher performance, primarily when aligned with a corresponding type of learning. This relation is consistently reflected in the reported performance metrics.

4.2.2. Pink Regions (Other Non-Tumor Tissues)

For pink region errors, there was an improvement by reducing coverage of pink regions annotated, according to different metrics of error when switching to OSTRAGY from BASTRAGY, with reduced error on Figure 2 (2), (3), (6), (7), (11), (16), and (18). From these Figures, statistically better reduction in error occurred when annotating on Figure 2 (2), (3), (6), and (18). There was a significant increase in error only when annotating Figure 2 (6).
Moreover, there was a reduction in error in some performance metrics when switching from BASTRAGY to INSTRAGY when annotating on Figure 2 (2), (3), (4), (6), (7), (11), (13), (16), and (18). Notice that there was a significant reduction in other error metrics when annotating Figure 2 (2), (3), (11), (13), (16), and (18).

4.2.3. Red Regions

In the case of coverage of red regions when annotating tumors, there is a decrease in error when annotating in Figure 2 (4) when switching from BASTRAGY to OSTRAGY. When comparing INSTRAGY with BASTRAGY, we report a reduction in different error metrics when annotating in Figure 2 (4), (10), and (16). Finally, a reduction in error when annotating in Figure 2 (4), (10), and (16) is achieved, using INSTRAGY instead of OSTRAGY.

4.2.4. Dark Dot Regions

For the case of dark dots, we observed a reduction in error in Figure 2 (4) when switching from BASTRAGY to OSTRAGY. Also, there was a reduction in different metrics of error when switching from BASTRAGY to INSTRAGY when annotating in Figure 2 (4) and (16). Finally, there were significant improvements to other error metrics when annotating Figure 2 (4) and (16) when switching from OSTRAGY to INSTRAGY. This means, for those specific images, INSTRAGY shows the best reduction in error when trying to avoid the annotation of dark dots instead of tumors.

4.2.5. White Regions

For the white regions, mistakenly annotated when segmenting tumor regions, we saw a reduction in some error metrics when annotating on Figure 2 (2), (4), (12), and (16) when switching from BASTRAGY to OSTRAGY. We remark on the significant reduction in Figure 2 (2). The opposite occurs in Figure 2 (12). When comparing INSTRAGY to BASTRAGY, we observed a reduction in metrics of error when performing annotations on Figure 2 (2), (4), (10), (12), (15), and (16). And, the significant reduction in metrics of error occurred when comparing INSTRAGY to BASTRAGY on Figure 2 (2), (4), (12), and (16). Finally, when comparing INSTRAGY to OSTRAGY, we observed a reduction in metrics of error when performing annotations on Figure 2 (4), (10), (12), (15), and (16). We remark on the significant reduction in error metrics in Figure 2 (4) and (10).

4.3. Untypical Results

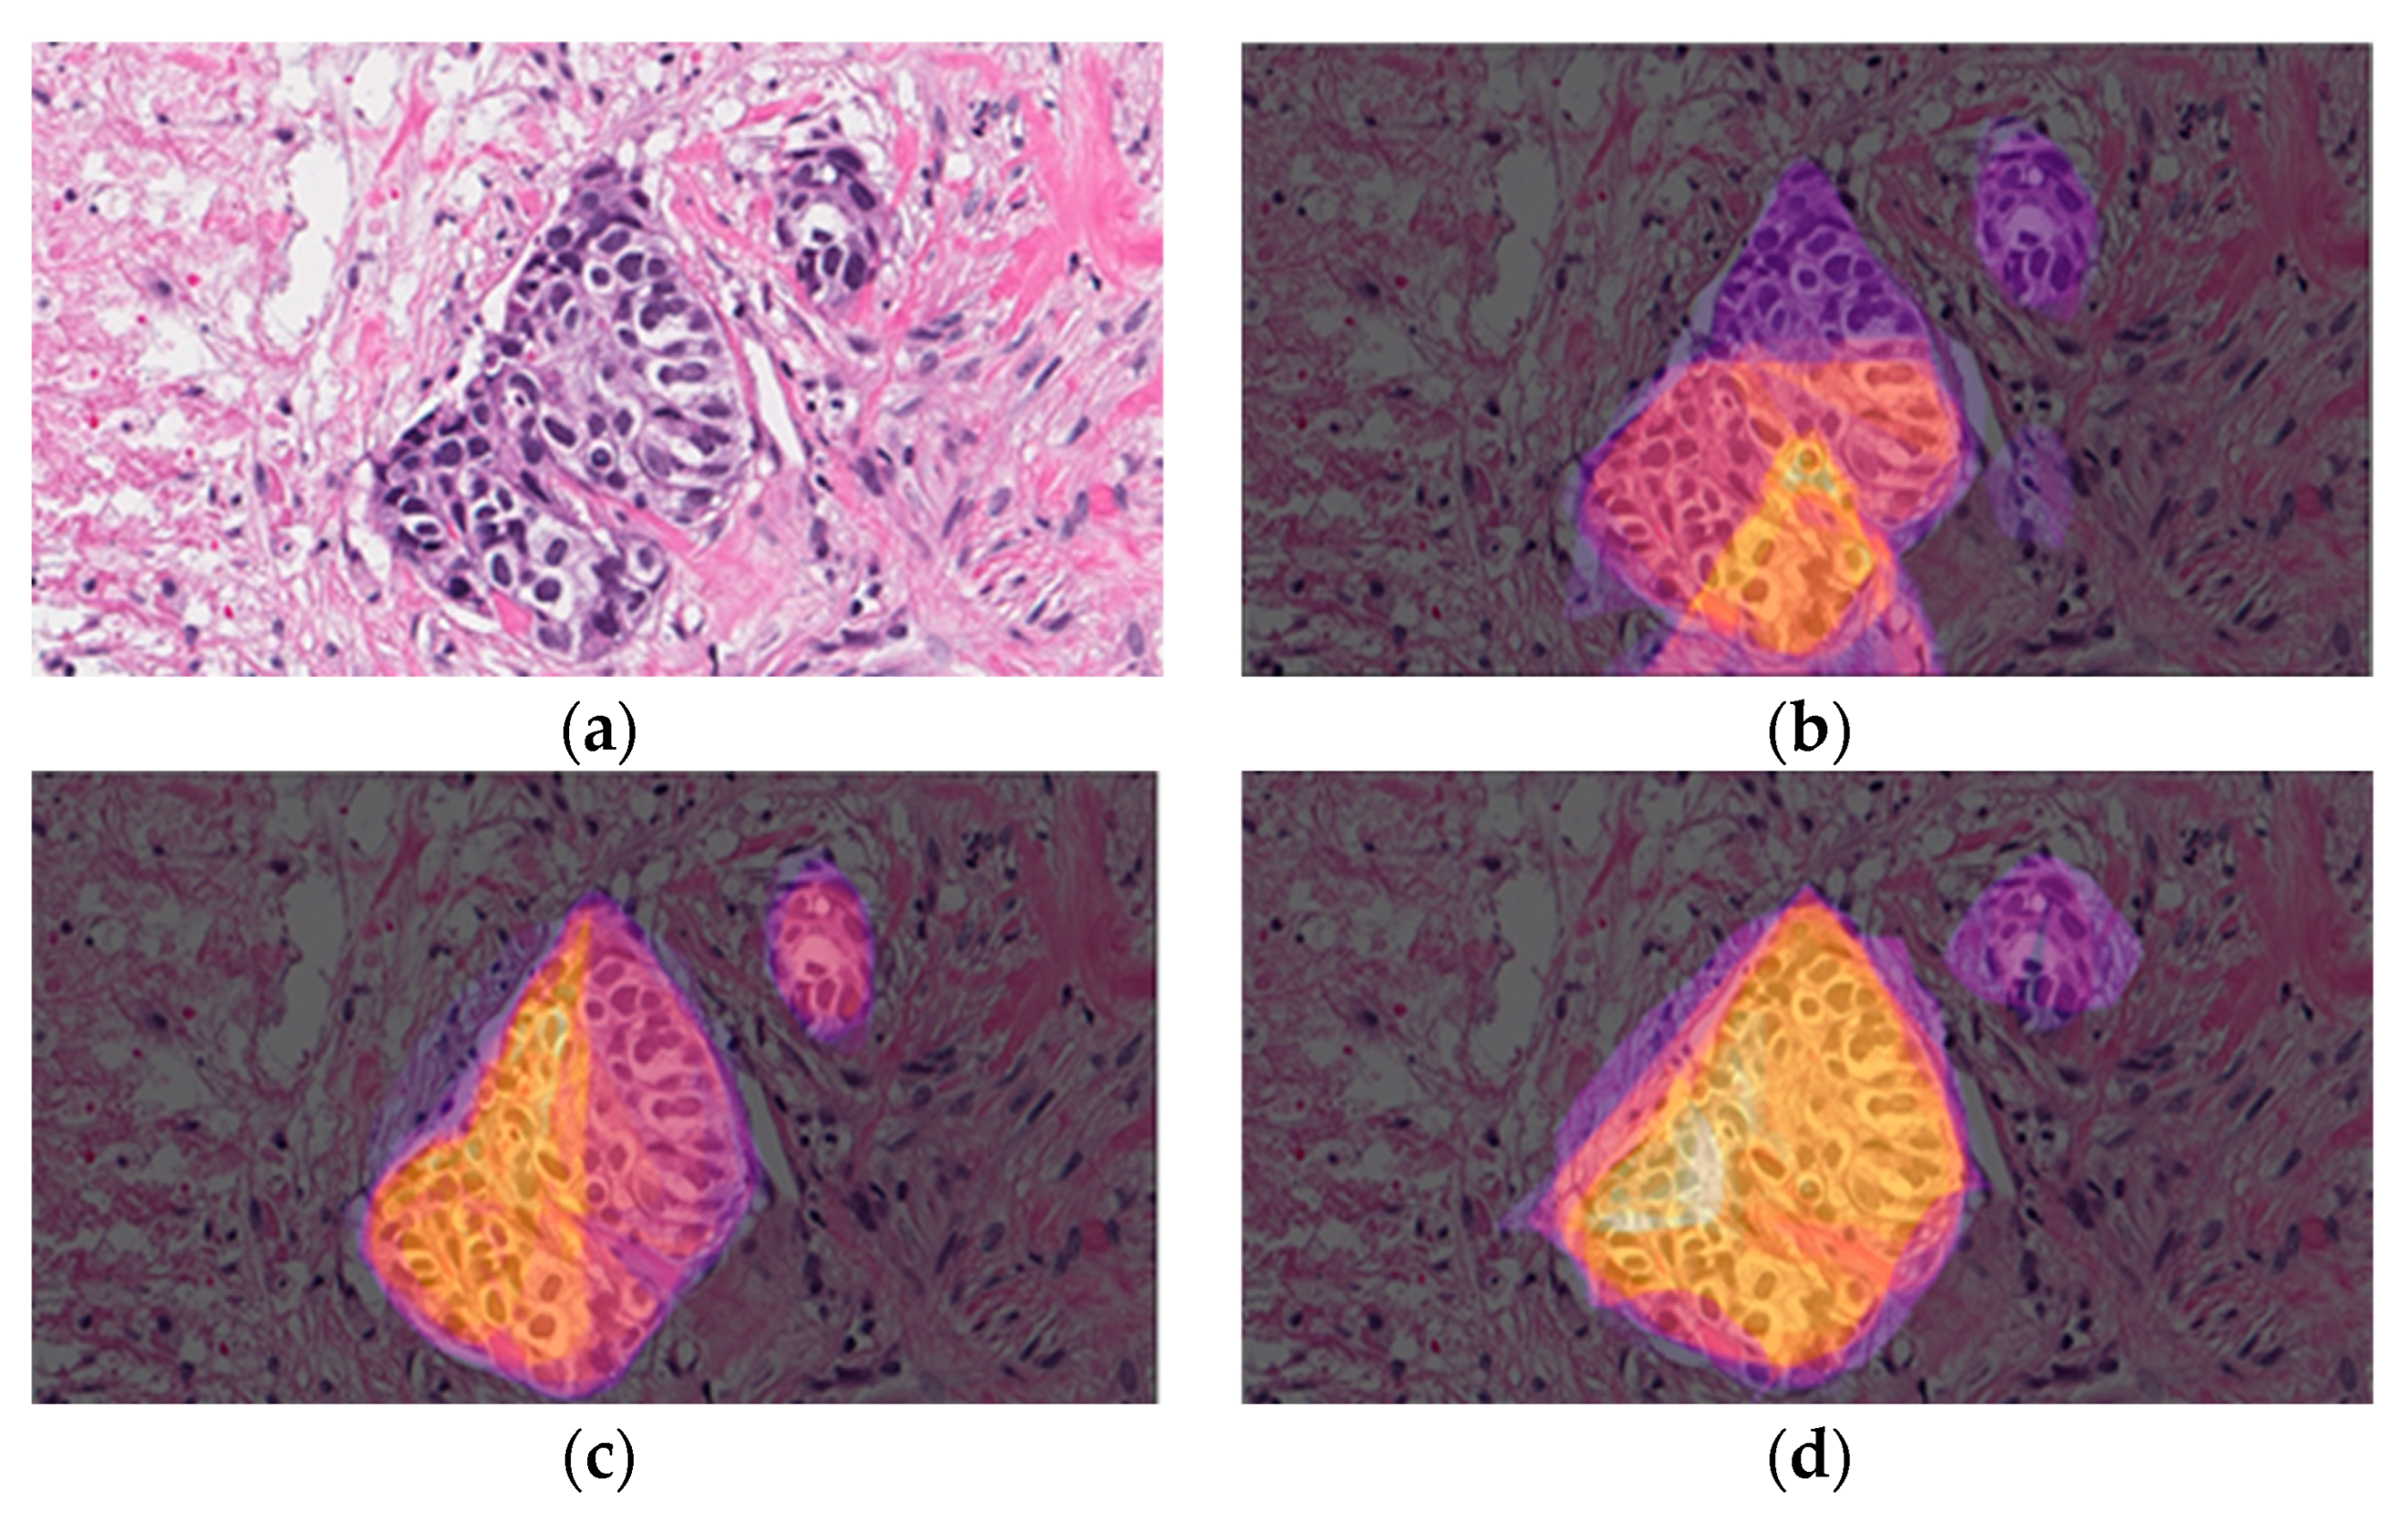
Figure 10 shows the untypical case in which the mean precision criterion has been significantly higher when facing BASTRAGY, rather than when facing optimized TS (OSTRAGY), despite all the other metrics reflecting the opposite case.

5. Discussion

5.1. Summary of the Findings

This paper addresses the challenge of training crowdworkers by efficiently exposing them to error patterns commonly made by other workers confronted with the same tasks. Using tumor image annotation as a use case, we compared three different training strategies for crowdworkers (BASTRAGY, OSTRAGY, and INSTRAGY), evaluating their impact on performance metrics when annotating tumor regions. Additionally, we analyzed whether these strategies lead to a reduction in annotations over pink, red, white, and black-dot regions. We focused on the crowdworker training material [42]. We tried to analyze how the crowdworkers annotate the tumor regions and in which proportion they mistakenly annotate specific unwanted regions, according to the training strategy each crowdworker is facing.
In general terms, when controlling for the influence of image difficulty, there are significant differences between the groups of crowdworkers. This aspect implies that the crowdworkers behave distinctly when confronted with different types of training strategies. This goes in the same direction as that stated by Rice et al. [26]. On the other hand, a general overview of each set of performance metrics showed that the crowdworkers who faced a version of the training strategy with instant feedback (INSTRAGY) outperformed the crowdworkers who learned a basic version of the training strategy (BASTRAGY). Also, we showed that an optimized version of the training strategy (OSTRAGY) relies on a reduction in mistakenly unwanted zones annotated by the crowdworkers.

5.2. Comparison of Training Strategies

Our results provide statistical evidence that performance improves in the tumor region when using INSTRAGY, as indicated by higher metric values. Additionally, error reduction is observed in various unwanted structures under either OSTRAGY or INSTRAGY, depending on the case, as reflected by lower metric values.
For the pink regions, we summarized 70 cases of reduced error metrics when using OSTRAGY over BASTRAGY, and 67 cases when switching from BASTRAGY to INSTRAGY, with only 3 instances showing increased error in the reverse direction. Comparing OSTRAGY to INSTRAGY, we observed 30 instances of error reduction with the latter. As these regions are large and widespread, even a few misaligned pixels can introduce errors, making it harder for crowdworkers to avoid them. These reductions suggest that quickly capturing error patterns allows smarter guidance, leading to more reliable results.
Similar trends appear in smaller but significant red regions. Despite their limited size, they yield reliable results: four cases of error reduction when using OSTRAGY or INSTRAGY, and six cases when using INSTRAGY alone.
Dark dot regions were more challenging due to their scattered nature. Even so, we observed three cases of error reduction with OSTRAGY or INSTRAGY, and only two cases of increased error with BASTRAGY. Among the four improved cases, three corresponded to INSTRAGY alone.
In the images, white regions typically lie near the tumor contour. Although some appear elsewhere, 27 instances of error reduction were found when switching from BASTRAGY to OSTRAGY, while only ten showed error increases. Comparing BASTRAGY to INSTRAGY yielded 34 instances of error reduction, and comparing OSTRAGY to INSTRAGY, 23. This indicates that many workers overlooked white regions with BASTRAGY, an error pattern we captured with OSTRAGY and INSTRAGY, both in training and annotation phases.
Another objective was to determine which training strategy led to (1) better tumor-zone annotation and (2) reduced error. Overall, we found 28 instances of improved performance metrics and only 7 cases of degradation when using INSTRAGY or OSTRAGY compared to BASTRAGY. INSTRAGY also outperformed OSTRAGY in two metrics. Thus, performance improved under an optimized training strategy, even with instant feedback elements.
In general, INSTRAGY consistently led to further error reductions compared to both OSTRAGY and BASTRAGY. These improvements, guided by error pattern-based stimuli, led to better tumor annotations, especially at medium and hard difficulty levels. In conclusion, this allows us to confirm the findings exposed by Sanyal and Ye [41] regarding the importance of feedback types in shaping task performance. In such a direction, we believe that our training strategies combine the mentioned outcome and process feedback. Moreover, providing training based on errors should not have a negative connotation but be informative. We demonstrated that what exposes Keith to social-cognitive theory [60] and Frese in Human–Computer Interaction [61] is feasible to be applied in micro training schemes for crowdsourced complex tasks, like those presented in this research.

5.3. Crowdsourced Definition of Error Pattern

Moreover, crowdworkers are usually unaware that they belong to groups exhibiting similar annotation mistakes, as they typically do not interact with each other. Therefore, we postulate the crowdsourcing definition of error pattern as a manifestation of the aggregated tendency of misconduct, not necessarily premeditated, but reflected in the aggregated results of the crowdworkers. As causes of such error patterns, we found evidence indicating a strong influence of the type of content and the way in which the training is presented. Despite this, these error patterns could have more than one cause, not explored in this study.
This shift in the paradigm of training people for microtasks in crowdsourcing allows (1) demonstrating the reliability of results when using crowdsourcing as an aggregation of collective intelligence for complex tasks like tumor annotation, in which there is mainly no reported background in histology or medicine on a large scale. (2) There is no need to examine many workers, which can also be conducted automatically, for defining error patterns. Hence, tendencies can be redirected in the correct direction relatively quickly. (3) The content and method of training are a key factor which affects the potential reliability of results, with the economic benefit which it implies for employers.

6. Conclusions and Future Work

In this paper, we presented a microtraining framework to crowdworkers, based on errors from previous crowdworkers. By comparing three different training strategies, we have analyzed the influence of different feedback mechanisms on the quality of work. First, we presented a baseline training strategy, which simulates different training for in-production environments. Next, we presented an optimized training strategy, a training package based on errors that other workers have frequently made. Finally, we also presented the instant feedback training strategy, which, in addition to showing the errors previously committed by other crowdworkers, provides instant feedback, based on error detection with a very small number of features.
Each crowdworker underwent only one of the three defined types of training, forming independent groups, to avoid any bias. The various and most used performance metrics, both in correctly annotating tumor areas and incorrectly annotating other areas, were statistically compared to detect differences between the groups. The influence of image difficulty was also controlled.
The findings reveal that the training strategy significantly influences crowdworker behavior and performance, and their attention is in front of possible errors. Error-driven training models yielded substantial reductions in annotation mistakes, thereby enhancing the precision of tumor delineation in the crowdsourced tasks, and the more accurate definition of tumor zone, as a region of interest, was reported, as the effectiveness of the optimized training strategy based on the error patterns shown by previous crowdworkers.
Additionally, we have postulated the crowdsourcing definition of error pattern, as a manifestation of the aggregated tendency of misconduct, not necessarily premeditated—as the crowdworkers do not know each other—but reflected in the aggregated results of the crowdworkers.
This paper allowed us to realize what should be learned by the crowdworkers, and to what extent. Thus, this paper acts as the first step for creating a training design framework for crowdsourcing, towards personalized training in the future. We recommend that a personalized training schema for crowdsourcing should consider the aggregated errors of previous crowdworkers. Regarding the use case of annotation of medical images, previous works have shown other strategies for achieving high-quality results, but the training was ineffective, or this aspect was not considered. In this paper, we have focused on the decrease in errors as a first step. It is recognized that performing annotations in medical images is a complex task, and might be subject to errors when conducted by a layman. Despite this, we demonstrated that high error rates could be decreased by designing training content based on errors, fed by the first crowdworkers.
We propose the identification of error patterns in crowdsourcing as the first step towards an automatic generation of training data. Technical feasibility for implementing this framework involves, for example, using AI-based schemes or hand-crafted methods. Leveraging AI should not be only for proposing annotations, but also for rapidly decreasing the noise that errors made by crowdworkers can produce. Such discovered errors using automatic schemes could be translated into refined training material for the new crowdworkers. Building the framework for personalization of training based on errors and its implementation for being executed and refined in real time should be addressed in the future, with potential AI tools.
In a real context, the aggregation of opinions or annotations is conducted by a small number of crowdworkers. Then, all the workers should understand the task and its constraints, making this a key factor. As a limitation of our work, certain workers struggle to adapt when encountering unfamiliar tests (e.g., multiple-choice tests) associated with entirely new tasks (i.e., drawing regions). It is expected to explore changes in this in the future. One example of it would be annotating very basic regions to test the training effect and letting workers who pass that test perform the task.
Several aspects beyond the scope of this study can be further explored, alongside our proposed approach. For example, a deeper research into usability factors affecting crowdsourcing task performance could reveal important trade-offs between task creation time for employers and the resulting performance of crowdworkers, and the development of automated or intelligent methods for generating usable components for general tasks, or enabling the straightforward design of such components for highly specialized tasks using modular building blocks.
Advancing this line of research could open new possibilities for both fully human-driven tumor annotation and hybrid human–AI collaboration frameworks.

Author Contributions

Conceptualization, J.A.L., E.G. and M.H.; methodology, J.A.L. and E.G.; software, J.A.L. and E.G.; validation, J.A.L., E.G., E.H. and M.H.; formal analysis, J.A.L., E.G., E.H. and M.H.; investigation, J.A.L. and E.G.; resources, M.H.; data curation, E.H. and M.H.; writing—original draft preparation, J.A.L.; writing—review and editing, M.H. and E.H.; visualization, M.H.; supervision, M.H.; project administration, M.H.; funding acquisition, M.H. All authors have read and agreed to the published version of the manuscript.

Funding

We acknowledge support for the publication costs by the Open Access Publication Fund of the Technische Universität Ilmenau.

Institutional Review Board Statement

Not applicable.

Informed Consent Statement

Not applicable.

Data Availability Statement

Supplementary tables with the results of statistical measurements can be found at [59].

Conflicts of Interest

The second author has been employed by ScaleHub GmbH during the time of this research. The other authors declare no conflicts of interest.

References

  1. Estellés-Arolas, E.; Navarro-Giner, R.; González-Ladrón-de-Guevara, F. Crowdsourcing Fundamentals: Definition and Typology. In Advances in Crowdsourcing; Springer: Berlin/Heidelberg, Germany, 2015; pp. 33–48. [Google Scholar]
  2. Estellés-Arolas, E.; González-Ladrón-De-Guevara, F. Towards an Integrated Crowdsourcing Definition. J. Inf. Sci. 2012, 38, 189–200. [Google Scholar] [CrossRef]
  3. Nakatsu, R.T.; Grossman, E.B.; Iacovou, C.L. A Taxonomy of Crowdsourcing Based on Task Complexity. J. Inf. Sci. 2014, 40, 823–834. [Google Scholar] [CrossRef]
  4. Berg, J. Income Security in the On-Demand Economy: Findings and Policy Lessons from a Survey of Crowdworkers 2016. Comp. Labor Law Policy J. 2015, 37, 543. [Google Scholar]
  5. Zhang, J.; Wu, X.; Sheng, V.S. Learning from Crowdsourced Labeled Data: A Survey. Artif. Intell. Rev. 2016, 46, 543–576. [Google Scholar] [CrossRef]
  6. Vaughan, J.W. Making Better Use of the Crowd: How Crowdsourcing Can Advance Machine Learning Research. J. Mach. Learn. Res. 2018, 18, 1–46. [Google Scholar]
  7. Gutman, D.A.; Khalilia, M.; Lee, S.; Nalisnik, M.; Mullen, Z.; Beezley, J.; Chittajallu, D.R.; Manthey, D.; Cooper, L.A.D. The Digital Slide Archive: A Software Platform for Management, Integration, and Analysis of Histology for Cancer Research. Cancer Res. 2017, 77, e75–e78. [Google Scholar] [CrossRef]
  8. Wong, P.K.-Y.; Luo, H.; Wang, M.; Leung, P.H.; Cheng, J.C.P. Recognition of Pedestrian Trajectories and Attributes with Computer Vision and Deep Learning Techniques. Adv. Eng. Inform. 2021, 49, 101356. [Google Scholar] [CrossRef]
  9. Dahl, C.M.; Johansen, T.S.D.; Sørensen, E.N.; Westermann, C.E.; Wittrock, S. Applications of Machine Learning in Tabular Document Digitisation. Hist. Methods J. Quant. Interdiscip. Hist. 2023, 56, 34–48. [Google Scholar] [CrossRef]
  10. Lubna; Mufti, N.; Shah, S.A.A. Automatic Number Plate Recognition:A Detailed Survey of Relevant Algorithms. Sensors 2021, 21, 3028. [Google Scholar] [CrossRef]
  11. Ott, S.; Barbosa-Silva, A.; Blagec, K.; Brauner, J.; Samwald, M. Mapping Global Dynamics of Benchmark Creation and Saturation in Artificial Intelligence. Nat. Commun. 2022, 13, 6793. [Google Scholar] [CrossRef]
  12. León-Gómez, B.B.; Moreno-Gabriel, E.; Carrasco-Ribelles, L.A.; Fors, C.V.; Liutsko, L. Retos y desafíos de la inteligencia artificial en la investigación en salud. Gac. Sanit. 2022, 37, 102315. [Google Scholar] [CrossRef]
  13. López, D.M. Retos de la inteligencia artificial y sus posibles soluciones desde la perspectiva de un editorialista humano. Biomédica 2023, 43, 309–314. [Google Scholar] [CrossRef]
  14. Libreros, J.A.; Gamboa, E.; Hirth, M. Mistakes Hold the Key: Reducing Errors in a Crowdsourced Tumor Annotation Task by Optimizing the Training Strategy. In Human-Computer Interaction; Ruiz, P.H., Agredo-Delgado, V., Mon, A., Eds.; Communications in Computer and Information Science; Springer Nature: Cham, Switzerland, 2024; Volume 1877, pp. 210–224. ISBN 978-3-031-57981-3. [Google Scholar]
  15. Pedraza, A.; Bueno, G.; Deniz, O.; Cristóbal, G.; Blanco, S.; Borrego-Ramos, M. Automated Diatom Classification (Part B): A Deep Learning Approach. Appl. Sci. 2017, 7, 460. [Google Scholar] [CrossRef]
  16. Libreros, J.A.; Shafiq, M.H.; Gamboa, E.; Cleven, M.; Hirth, M. Visual Transformers Meet Convolutional Neural Networks: Providing Context for Convolution Layers in Semantic Segmentation of Remote Sensing Photovoltaic Imaging. In Big Data Analytics and Knowledge Discovery; Wrembel, R., Chiusano, S., Kotsis, G., Tjoa, A.M., Khalil, I., Eds.; Lecture Notes in Computer Science; Springer Nature: Cham, Switzerland, 2024; Volume 14912, pp. 359–366. ISBN 978-3-031-68322-0. [Google Scholar]
  17. Gamboa, E.; Libreros, A.; Hirth, M.; Dubiner, D. Human-AI Collaboration for Improving the Identification of Cars for Autonomous Driving. In Proceedings of the CIKM Workshops, Atlanta, GA, USA, 17–21 October 2022. [Google Scholar]
  18. Garcia-Molina, H.; Joglekar, M.; Marcus, A.; Parameswaran, A.; Verroios, V. Challenges in Data Crowdsourcing. IEEE Trans. Knowl. Data Eng. 2016, 28, 901–911. [Google Scholar] [CrossRef]
  19. Salminen, J. The Role of Collective Intelligence in Crowdsourcing Innovation; LUT University: Lappeenranta, Finland, 2015; ISBN 978-952-265-876-0. [Google Scholar]
  20. Tondello, G.F.; Wehbe, R.R.; Diamond, L.; Busch, M.; Marczewski, A.; Nacke, L.E. The Gamification User Types Hexad Scale. In Proceedings of the 2016 Annual Symposium on Computer-Human Interaction in Play, Austin, TX, USA, 16–19 October 2016; Association for Computing Machinery: New York, NY, USA, 2016; pp. 229–243. [Google Scholar]
  21. Vroom, V.H. Work and Motivation; Wiley: Oxford, UK, 1964. [Google Scholar]
  22. Sun, Y.; Wang, N.; Yin, C.; Zhang, J.X. Understanding the Relationships between Motivators and Effort in Crowdsourcing Marketplaces: A Nonlinear Analysis. Int. J. Inf. Manag. 2015, 35, 267–276. [Google Scholar] [CrossRef]
  23. Yin, X.; Zhu, K.; Wang, H.; Zhang, J.; Wang, W.; Zhang, H. Motivating Participation in Crowdsourcing Contests: The Role of Instruction-Writing Strategy. Inf. Manag. 2022, 59, 103616. [Google Scholar] [CrossRef]
  24. López-Pérez, M.; Amgad, M.; Morales-Álvarez, P.; Ruiz, P.; Cooper, L.A.D.; Molina, R.; Katsaggelos, A.K. Learning from Crowds in Digital Pathology Using Scalable Variational Gaussian Processes. Sci. Rep. 2021, 11, 11612. [Google Scholar] [CrossRef]
  25. Mehta, P.; Sandfort, V.; Gheysens, D.; Braeckevelt, G.-J.; Berte, J.; Summers, R.M. Segmenting the Kidney on CT Scans Via Crowdsourcing. In Proceedings of the 2019 IEEE 16th International Symposium on Biomedical Imaging (ISBI 2019), Venice, Italy, 8–11 April 2019; IEEE: Piscataway, NJ, USA, 2019; pp. 829–832. [Google Scholar]
  26. Rice, M.K.; Zenati, M.S.; Novak, S.M.; Al Abbas, A.I.; Zureikat, A.H.; Zeh, H.J.; Hogg, M.E. Crowdsourced Assessment of Inanimate Biotissue Drills: A Valid and Cost-Effective Way to Evaluate Surgical Trainees. J. Surg. Educ. 2019, 76, 814–823. [Google Scholar] [CrossRef]
  27. Goldenberg, M.; Ordon, M.; Honey, J.R.D.; Andonian, S.; Lee, J.Y. Objective Assessment and Standard Setting for Basic Flexible Ureterorenoscopy Skills Among Urology Trainees Using Simulation-Based Methods. J. Endourol. 2020, 34, 495–501. [Google Scholar] [CrossRef]
  28. Amgad, M.; Elfandy, H.; Hussein, H.; Atteya, L.A.; Elsebaie, M.A.T.; Abo Elnasr, L.S.; Sakr, R.A.; Salem, H.S.E.; Ismail, A.F.; Saad, A.M.; et al. Structured Crowdsourcing Enables Convolutional Segmentation of Histology Images. Bioinformatics 2019, 35, 3461–3467. [Google Scholar] [CrossRef]
  29. Bui, M.; Bourier, F.; Baur, C.; Milletari, F.; Navab, N.; Demirci, S. Robust Navigation Support in Lowest Dose Image Setting. Int. J. Comput. Assist. Radiol. Surg. 2019, 14, 291–300. [Google Scholar] [CrossRef]
  30. Kandala, P.A.; Sivaswamy, J. Crowdsourced Annotations as an Additional Form of Data Augmentation for CAD Development. In Proceedings of the 2017 4th IAPR Asian Conference on Pattern Recognition (ACPR), Nanjing, China, 26–29 November 2017; IEEE: Piscataway, NJ, USA, 2017; pp. 753–758. [Google Scholar]
  31. Conti, S.L.; Brubaker, W.; Chung, B.I.; Sofer, M.; Hsi, R.S.; Shinghal, R.; Elliott, C.S.; Caruso, T.; Leppert, J.T. Crowdsourced Assessment of Ureteroscopy with Laser Lithotripsy Video Feed Does Not Correlate with Trainee Experience. J. Endourol. 2019, 33, 42–49. [Google Scholar] [CrossRef]
  32. Morozov, S.P.; Gombolevskiy, V.A.; Elizarov, A.B.; Gusev, M.A.; Novik, V.P.; Prokudaylo, S.B.; Bardin, A.S.; Popov, E.V.; Ledikhova, N.V.; Chernina, V.Y.; et al. A Simplified Cluster Model and a Tool Adapted for Collaborative Labeling of Lung Cancer CT Scans. Comput. Methods Programs Biomed. 2021, 206, 106111. [Google Scholar] [CrossRef]
  33. Marzahl, C.; Aubreville, M.; Bertram, C.A.; Gerlach, S.; Maier, J.; Voigt, J.; Hill, J.; Klopfleisch, R.; Maier, A. Is Crowd-Algorithm Collaboration an Advanced Alternative to Crowd-Sourcing on Cytology Slides? In Bildverarbeitung für die Medizin 2020; Tolxdorff, T., Deserno, T.M., Handels, H., Maier, A., Maier-Hein, K.H., Palm, C., Eds.; Springer Fachmedien: Wiesbaden, Germany, 2020; pp. 26–31. ISBN 978-3-658-29266-9. [Google Scholar]
  34. Ascheid, D.; Baumann, M.; Pinnecker, J.; Friedrich, M.; Szi-Marton, D.; Medved, C.; Bundalo, M.; Ortmann, V.; Öztürk, A.; Nandigama, R.; et al. A Vascularized Breast Cancer Spheroid Platform for the Ranked Evaluation of Tumor Microenvironment-Targeted Drugs by Light Sheet Fluorescence Microscopy. Nat. Commun. 2024, 15, 3599. [Google Scholar] [CrossRef]
  35. Paley, G.L.; Grove, R.; Sekhar, T.C.; Pruett, J.; Stock, M.V.; Pira, T.N.; Shields, S.M.; Waxman, E.L.; Wilson, B.S.; Gordon, M.O.; et al. Crowdsourced Assessment of Surgical Skill Proficiency in Cataract Surgery. J. Surg. Educ. 2021, 78, 1077–1088. [Google Scholar] [CrossRef]
  36. Grote, A.; Schaadt, N.S.; Forestier, G.; Wemmert, C.; Feuerhake, F. Crowdsourcing of Histological Image Labeling and Object Delineation by Medical Students. IEEE Trans. Med. Imaging 2019, 38, 1284–1294. [Google Scholar] [CrossRef]
  37. Martin, D.; Carpendale, S.; Gupta, N.; Hoßfeld, T.; Naderi, B.; Redi, J.; Siahaan, E.; Wechsung, I. Understanding the Crowd: Ethical and Practical Matters in the Academic Use of Crowdsourcing. In Proceedings of the Evaluation in the Crowd. Crowdsourcing and Human-Centered Experiments, Dagstuhl Castle, Germany, 22–27 November 2015; Archambault, D., Purchase, H., Hoßfeld, T., Eds.; Springer International Publishing: Cham, Switzerland, 2017; pp. 27–69. [Google Scholar]
  38. Difallah, D.; Filatova, E.; Ipeirotis, P. Demographics and Dynamics of Mechanical Turk Workers. In Proceedings of the Eleventh ACM International Conference on Web Search and Data Mining, Marina Del Rey, CA, USA, 5–9 February 2018; Association for Computing Machinery: New York, NY, USA; pp. 135–143. [Google Scholar]
  39. Na, K.; Han, K. How Leaderboard Positions Shape Our Motivation: The Impact of Competence Satisfaction and Competence Frustration on Motivation in a Gamified Crowdsourcing Task. Internet Res. 2023, 33, 1–18. [Google Scholar] [CrossRef]
  40. Ashikawa, M.; Kawamura, T.; Ohsuga, A. Proposal of Grade Training Method for Quality Improvement in Microtask Crowdsourcing. Web Intell. 2019, 17, 313–326. [Google Scholar] [CrossRef]
  41. Sanyal, P.; Ye, S. An Examination of the Dynamics of Crowdsourcing Contests: Role of Feedback Type. Inf. Syst. Res. 2024, 35, 394–413. [Google Scholar] [CrossRef]
  42. Wang, C.; Han, L.; Stein, G.; Day, S.; Bien-Gund, C.; Mathews, A.; Ong, J.J.; Zhao, P.-Z.; Wei, S.-F.; Walker, J.; et al. Crowdsourcing in Health and Medical Research: A Systematic Review. Infect. Dis. Poverty 2020, 9, 8. [Google Scholar] [CrossRef]
  43. Gamboa, E.; Galda, R.; Mayas, C.; Hirth, M. The Crowd Thinks Aloud: Crowdsourcing Usability Testing with the Thinking Aloud Method. In Proceedings of the HCI International 2021—Late Breaking Papers: Design and User Experience, Virtual Event, 24–29 July 2021; Stephanidis, C., Soares, M.M., Rosenzweig, E., Marcus, A., Yamamoto, S., Mori, H., Rau, P.-L.P., Meiselwitz, G., Fang, X., Moallem, A., Eds.; Springer International Publishing: Cham, Switzerland, 2021; pp. 24–39. [Google Scholar]
  44. Fractional Factorial Experiments. In Design and Analysis of Experiments; Dean, A., Voss, D., Eds.; Springer: New York, NY, USA, 1999; pp. 483–545. ISBN 978-0-387-22634-7. [Google Scholar]
  45. Design and Analysis of Experiments; Dean, A., Voss, D., Eds.; Springer Texts in Statistics; Springer: New York, NY, USA, 1999; ISBN 978-0-387-98561-9. [Google Scholar]
  46. Welch, B.L. On the Comparison of Several Mean Values: An Alternative Approach. Biometrika 1951, 38, 330–336. [Google Scholar] [CrossRef]
  47. Tukey, J.W. The Problem of Multiple Comparisons; Princeton University: Princeton, NJ, USA, 1953. [Google Scholar]
  48. Pereira, D.G.; Afonso, A.; Medeiros, F.M. Overview of Friedman’s Test and Post-Hoc Analysis. Commun. Stat.—Simul. Comput. 2015, 44, 2636–2653. [Google Scholar] [CrossRef]
  49. Xu, J.; Shan, G.; Amei, A.; Zhao, J.; Young, D.; Clark, S. A Modified Friedman Test for Randomized Complete Block Designs. Commun. Stat.—Simul. Comput. 2017, 46, 1508–1519. [Google Scholar] [CrossRef]
  50. Abdi, H.; Williams, L.J. Tukey’s Honestly Significant Difference (HSD) Test. Encycl. Res. Des. 2010, 3, 1–5. [Google Scholar]
  51. Shapiro, S.S.; Wilk, M.B. An Analysis of Variance Test for Normality (Complete Samples). Biometrika 1965, 52, 591–611. [Google Scholar] [CrossRef]
  52. Miller, R.L.; Acton, C.; Fullerton, D.A.; Maltby, J.; Campling, J. Analysis of Variance (ANOVA). In SPSS for Social Scientists; Campling, J., Ed.; Macmillan Education UK: London, UK, 2002; pp. 145–154. ISBN 978-0-333-92286-6. [Google Scholar]
  53. Nemenyi, P.B. Distribution-Free Multiple Comparisons; Princeton University: Princeton, NJ, USA, 1963. [Google Scholar]
  54. Hollander, M.; Wolfe, D.A.; Chicken, E. Nonparametric Statistical Methods; John Wiley & Sons: Hoboken, NJ, USA, 2013. [Google Scholar]
  55. McKight, P.E.; Najab, J. Kruskal-Wallis Test. In The Corsini Encyclopedia of Psychology; Weiner, I.B., Craighead, W.E., Eds.; Wiley: Hoboken, NJ, USA, 2010; p. 1. ISBN 978-0-470-17024-3. [Google Scholar]
  56. Kruskal, W.H.; Wallis, W.A. Use of Ranks in One-Criterion Variance Analysis. J. Am. Stat. Assoc. 1952, 47, 583–621. [Google Scholar] [CrossRef]
  57. Dunn, O.J. Multiple Comparisons among Means. J. Am. Stat. Assoc. 1961, 56, 52–64. [Google Scholar] [CrossRef]
  58. Armstrong, R.A.; Davies, L.N.; Dunne, M.C.M.; Gilmartin, B. Statistical Guidelines for Clinical Studies of Human Vision. Ophthalmic Physiol. Opt. 2011, 31, 123–136. [Google Scholar] [CrossRef]
  59. Hirth, M.; Libreros, J.; Gamboa, E.; Henke, E. Mistakes Hold the Key: Providing Instant Feedback Based on Errors to Crowdworkers in Tumor Annotation Imaging. Zenodo 2024. [Google Scholar] [CrossRef]
  60. Keith, N. Learning through Errors in Training. In Errors in Organizations; Routledge: Abingdon, UK, 2011; ISBN 978-0-203-81782-7. [Google Scholar]
  61. Frese, M.; Altmann, A. The Treatment of Errors in Learning and Training. Dev. Ski. Inf. Technol. 1989, 65. [Google Scholar]
Figure 1. Description of all the studies conducted and the versions of the training strategy.
Bdcc 09 00220 g001
Figure 2. Original images with the GT shown in red-colored line: (1)–(6) easy; (7)–(14) medium; and (15)–(21) hard.
Bdcc 09 00220 g002
Figure 3. Annotation task: crowdworkers should draw a polygon around tumor regions. Label in red means one annotation (region) drawn by a crowdworker over the tumor location.
Bdcc 09 00220 g003
Figure 4. (a) Pink regions; (b) red regions; (c) dark dot regions; (d) white regions.
Bdcc 09 00220 g004
Figure 5. BASTRAGY. This training content includes brief visual explanation about (a) how to draw the regions–annotate; (b) what is a tumor; (c,d) what is not a tumor.
Bdcc 09 00220 g005
Figure 6. Example image showing how different error zones (pink regions, red dot regions, dark dot regions, and white regions) are widely visible and can attract the attention of crowdworkers (even more than the correct tumor zone), and end up being annotated as tumors.
Bdcc 09 00220 g006
Figure 7. Description of each error pattern defined in Study 1, and the comparison with the tumor region in the same slide, as part of the optimized training strategy used in Study 2. (a) About how to annotate; (b) dark dots—example 2 about what a tumor does look like; (c) common errors made by other workers and tutorial about what a tumor does not look like.
Bdcc 09 00220 g007
Figure 8. Instances in which INSTRAGY was significantly better than OSTRAGY and BASTRAGY. For each row, the first column shows the original image to be annotated. The second column is ground truth (GT) associated with the specific image. The third, fourth, and fifth columns represent the aggregated annotations of workers facing BASTRAGY, OSTRAGY, and INSTRAGY, respectively.
Bdcc 09 00220 g008
Figure 9. Best strategy according to different metrics and images. * means statistically significance.
Bdcc 09 00220 g009
Figure 10. (a) Original; (b) BASTRAGY; (c) OSTRAGY; (d) INSTRAGY. “Mean precision” criterion significantly higher when facing the baseline TS (s1), than when facing optimized TS (s2).
Bdcc 09 00220 g010
Table 1. Type of error and its corresponding message shown in a pop-up, as instant feedback.
Type of ErrorError Message
Region’s shapeIt looks like you are drawing a region more related to a line. We are pretty sure that the tumors do not have this shape. Please review them again and take another look at the help button. You can undo this region. Please click on “delete”.
Non-tumor region (pink region, dark dot region, white or red region identified)It looks like you are drawing over a non-tumor region. We are pretty sure the tumors do not have this color. Please review again and take another look at the help button. If it is not a tumor, please click on “delete”.
Region’s sizeIt looks like you are making the regions too small. We are pretty sure the tumors are not so small. Please click on “delete” and take another look at the tutorial button.
Table 2. Type of regions and their features described as IQR and median of hue channel (HSV color space).
Type of RegionIQRMedian
Tumor198–221216
Black dots (lymphocytes)188–197189
Pink (other tissues)213–229215
White195–231221
Red230–243235
Table 3. Results of Friedman Test for significant differences between the training strategies, according to different performance metrics, per error type, and combined images. (*, **, and *** to denote significance at p ≤ 0.05, p ≤ 0.01, and p ≤ 0.001, respectively).
Type of Error/Tumor ZonePerformance Metricp-ValueNormality p-Value
Tumor-zone annotationmrecall_img_worker0.000 ***0.000 ***
mf1_img_worker0.000 ***0.000 ***
miou_img_worker0.000 ***0.000 ***
regions_0p0.008 **0.000 ***
regions_valid_81_100p0.009 **0.000 ***
regions_valid_61_80p0.0550.000 ***
regions_valid_21_40p0.1030.000 ***
regions_valid_1_20p0.1100.000 ***
mprecision_img_worker0.2630.000 ***
unable_to_reconstruct0.3310.000 ***
regions_valid_41_60p0.8950.000 ***
Dark dot errorsregions_0p0.002 **0.000 ***
miou_img_worker0.0730.000 ***
mf1_img_worker0.0730.000 ***
mprecision_img_worker0.1050.000 ***
regions_valid_21_40p0.2640.000 ***
regions_valid_41_60p0.2670.000 ***
mrecall_img_worker0.3020.000 ***
regions_valid_61_80p0.3070.000 ***
unable_to_reconstruct0.3310.000 ***
regions_valid_1_20p0.4810.000 ***
regions_valid_81_100p0.8950.000 ***
Pink tissue errormprecision_img_worker0.001 ***0.000 ***
mrecall_img_worker0.010 **0.000 ***
mf1_img_worker0.022 *0.000 ***
miou_img_worker0.043 *0.000 ***
regions_0p0.0970.000 ***
regions_valid_21_40p0.2120.000 ***
regions_valid_81_100p0.3040.000 ***
regions_valid_1_20p0.3080.000 ***
unable_to_reconstruct0.3310.000 ***
regions_valid_41_60p0.3680.000 ***
regions_valid_61_80p0.9610.000 ***
Red tissue errorregions_0p0.043 *0.000 ***
miou_img_worker0.047 *0.000 ***
mprecision_img_worker0.047 *0.000 ***
mf1_img_worker0.047 *0.000 ***
regions_valid_41_60p0.050 *0.000 ***
regions_valid_61_80p0.0740.000 ***
regions_valid_1_20p0.3090.000 ***
unable_to_reconstruct0.3310.000 ***
regions_valid_81_100p0.5970.000 ***
mrecall_img_worker0.6330.000 ***
regions_valid_21_40p0.6700.000 ***
White zone errorregions_0p0.010 *0.000 ***
regions_valid_41_60p0.0570.000 ***
regions_valid_81_100p0.1090.000 ***
mprecision_img_worker0.1260.000 ***
mrecall_img_worker0.1670.000 ***
miou_img_worker0.2150.000 ***
mf1_img_worker0.2150.000 ***
regions_valid_21_40p0.2390.000 ***
unable_to_reconstruct0.3310.000 ***
regions_valid_61_80p0.3680.000 ***
regions_valid_1_20p0.7750.000 ***
All types combinedregions_valid_1_20p0.010 **0.000 ***
regions_0p0.050 *0.000 ***
regions_valid_61_80p0.0710.000 ***
mprecision_img_worker0.0840.000 ***
regions_valid_41_60p0.2870.000 ***
unable_to_reconstruct0.3310.000 ***
regions_valid_21_40p0.3590.000 ***
miou_img_worker0.3680.000 ***
regions_valid_81_100p0.4020.000 ***
mrecall_img_worker0.4050.000 ***
mf1_img_worker0.4670.000 ***
Table 4. Comparison between each pair of training strategies—Group 1 vs. Group 2—with significant differences (BASTRAGY, OSTRAGY, and INSTRAGY). For error types of red error, dark dot, white zones, and pink zones, the lower the performance metric the better the training strategy faced—in bold. For tumor type, the higher the performance metrics, the better the training strategy—in bold. (*, **, and *** to denote significance at p ≤ 0.05, p ≤ 0.01, and p ≤ 0.001, respectively).
Type of Error/Tumor ZonePerformance MetricGroup 1Group 2p-ValueHigher ValueLower ValueDifference
Tumor-zone annotationmiou_img_workerBASINS0.001 ***INSBAS0.090
miou_img_workerOSTINS0.019 *INSOST0.033
mrecall_img_workerBASINS0.001 ***INSBAS0.098
mrecall_img_workerOSTINS0.004 **INSOST0.040
mrecall_img_workerINSOST0.004 **INSOST0.040
mf1_img_workerBASINS0.001 ***INSBAS0.106
mf1_img_workerOSTINS0.004 **INSOST0.051
mf1_img_workerINSOST0.004 **INSOST0.051
regions_0pBASINS0.024 *BASINS0.365
regions_0pOSTINS0.019 *OSTINS0.439
Dark dots errorregions_0pBASINS0.015 *BASINS0.794
regions_0pOSTINS0.003 **OSTINS0.923
Pink tissue errormprecision_img_workerBASOST0.036 *BASOST0.083
mprecision_img_workerBASINS0.001 ***BASINS0.092
mprecision_img_workerINSBAS0.001 ***BASINS0.092
mrecall_img_workerOSTBAS0.015 *BASOST0.024
mf1_img_workerOSTBAS0.036 *BASOST0.021
White zone errorregions_0pINSOST0.015 * OSTINS1.035
Table 5. Results of the χ 2 Test of Independence applied to the quartile-based distribution of each performance metric, per error type, and combined images. (*, **, and *** to denote significance at p ≤ 0.05, p ≤ 0.01, and p ≤ 0.001, respectively).
Type of Error/Tumor ZonePerformance Metric χ 2 p-Value
Tumor annotation zonesmrecall_img_worker27.4710.000 ***
regions_valid_81_100p16.5540.000 ***
mf1_img_worker25.0130.000 ***
miou_img_worker23.7520.001 ***
mprecision_img_worker14.0920.029 *
regions_valid_61_80p4.7790.092
regions_0p6.2070.184
regions_valid_41_60p5.5400.236
regions_valid_21_40p4.3250.364
unable_to_reconstruct4.0200.403
regions_valid_1_20p3.0090.556
Dark dots errorregions_valid_1_20p6.5180.164
regions_valid_61_80p4.8810.300
regions_valid_41_60p2.0380.361
unable_to_reconstruct4.0200.403
regions_valid_81_100p4.0200.403
regions_0p4.0110.404
regions_valid_21_40p3.0090.556
Pink tissue errormprecision_img_worker31.9090.000 ***
miou_img_worker25.4580.000 ***
mf1_img_worker25.4580.000 ***
mrecall_img_worker11.4640.003 **
regions_valid_21_40p9.0610.060
unable_to_reconstruct4.0200.403
regions_0p4.0110.404
regions_valid_41_60p4.0110.404
regions_valid_81_100p3.3070.508
regions_valid_61_80p2.6700.615
regions_valid_1_20p2.5110.643
Red tissue errorregions_valid_41_60p6.0260.049 *
regions_0p8.0110.091
regions_valid_61_80p5.5370.236
regions_valid_1_20p5.5150.238
unable_to_reconstruct4.0200.403
regions_valid_81_100p4.0030.406
regions_valid_21_40p1.6110.447
White zone errorsum_union_img_worker8.4200.015 *
regions_valid_81_100p9.2820.054
regions_valid_41_60p8.6050.072
regions_0p8.0110.091
regions_valid_1_20p4.1750.383
miou_img_worker1.8850.390
mf1_img_worker1.8850.390
unable_to_reconstruct4.0200.403
mprecision_img_worker1.4750.478
regions_valid_61_80p0.9890.610
mrecall_img_worker0.3790.828
regions_valid_21_40p1.2620.868
All types combinedregions_0p22.4360.000 ***
unable_to_reconstruct20.1000.000 ***
mprecision_img_worker8.1380.017 *
mrecall_img_worker2.3090.315
regions_valid_81_100p4.6790.322
miou_img_worker2.0380.361
mf1_img_worker2.0380.361
regions_valid_1_20p4.0040.405
regions_valid_41_60p4.0040.405
regions_valid_61_80p3.4320.488
regions_valid_21_40p3.4140.491
Disclaimer/Publisher’s Note: The statements, opinions and data contained in all publications are solely those of the individual author(s) and contributor(s) and not of MDPI and/or the editor(s). MDPI and/or the editor(s) disclaim responsibility for any injury to people or property resulting from any ideas, methods, instructions or products referred to in the content.